
Abstract
Estrogen residues, including diethylstilbestrol in chicken, are one of the main food safety concerns all over the world owing to a series of negative effects on the human body. Surface-enhanced Raman spectroscopy (SERS) coupled with multivariate analysis was applied to detect rapidly diethylstilbestrol residues in chicken. The detection conditions, including the sizes of colloidal gold nanoparticles (Au NPs) and the additional amounts of Au NPs, chicken extract containing diethylstilbestrol, and magnesium sulfate solution, as well as the adsorption time, were optimized by a single factor experiment to obtain a better detection effect of diethylstilbestrol residues in chicken. Partial least squares regression (PLSR) was the best quantitative model for the detection of diethylstilbestrol residues in chicken by comparing four chemometric models. Diethylstilbestrol residues in chicken could be predicted by PLSR with the low root mean square error (RMSE = 0.4128 mg/L), and the high determination coefficient (R2 = 0.9811) and ratio of prediction to deviation (RPD = 7.2566) for the test set. A novel approach, which has the potential for the analysis of other estrogen residues in meat, was developed to detect rapidly the diethylstilbestrol residues in chicken by using SERS coupled with multivariate analysis.
Keywords
Introduction
Diethylstilbestrol, a synthetic estrogen, has proven to be an important role in the prevention and treatment of miscarriage, prostate cancer, and menopause symptoms in human beings, as well as for growth promotion for livestock feed such as for chickens and ducks.1–3 However, its residues in human beings and livestock can produce a series of negative effects on the human body, such as causing cancer.1,2 Currently, chicken is the largest poultry consumer good in China, but the issue about diethylstilbestrol residues in chicken has increasingly aroused the concerns of people because of its abuses during chicken feeding. Therefore, it is indispensable to develop a novel method with rapid speed and high efficiency to rapidly determine diethylstilbestrol residues for ensuring the edible safety of chicken. Some traditional analytical methods, such as high-performance liquid chromatography (HPLC),4,5 enzyme-linked immunosorbent assay, 6 and gas chromatography–mass spectrometry (GC-MS), 7 were applied to detect the diethylstilbestrol residues in food including chicken. However, these methods are somewhat inconvenient for the rapid detection of diethylstilbestrol residues in chicken and are unsuitable for on-site detection due to the disadvantage of either expensive apparatuses or time-consuming processes. 2
Surface-enhanced Raman spectroscopy (SERS) was considered to be a sensitive and rapid technology widely applied in chemistry, biology, and food science.8–11 Surface-enhanced Raman spectroscopy, which is an expansion of standard Raman spectroscopy, can enhance the Raman intensities by using a surface treatment, i.e., metallic nanoparticles (NPs) and nanostructures in materials. 12 One of the most important factors for successfully applying SERS technology was the selection of the proper enhancement substrate, owing to that there existed no an universal substrate suitable for the detection of any analyte. 13 To date, some related literature was published about diethylstilbestrol analysis based on SERS.14–16 However, these studies were mainly focused on the analysis of diethylstilbestrol solutions and no meat samples including chicken were tested by using SERS technology.
The objective of this paper was to investigate the potential of applying SERS coupled with chemometric methods to rapidly detect diethylstilbestrol residues in chicken with a simplified sample preparation. The SERS detection conditions of diethylstilbestrol residues in chicken were optimized using a single factor experiment. Four chemometric models were established and compared for quantitative analyses. This research provided an important basis for further applying SERS and chemometric methods to quantitatively analyze estrogen residues in meat.
Materials and Methods
Materials and Reagents
Chicken was purchased from the vegetable market of Jiangxi Agricultural University; the chicken breasts were then removed from the chicken carcass and stored in a refrigerator at –18 ℃ before use. Trisodium citrate, diethylstilbestrol (99.0%), magnesium sulfate, acetonitrile, and hexane were obtained from Nanchang Precision Scientific Instruments Co. Ltd., China. Tetrachloroaurate trihydrate (HAuCl4· 3H2O) with gold content of not less than 49% was purchased from Sigma-Aldrich.
Synthesis of Gold Nanoparticles with Different Sizes
Colloidal gold nanoparticles (Au NPs) were synthesized based upon a typical trisodium citrate reduction method with slight modification. 17 Briefly, 0.6, 0.7, 0.8, 0.9, 1.0, and 1.1 mL of 1% trisodium citrate were rapidly added into 100 mL of boiling 0.01% HAuCl4 solution with constant stirring for 9 min, respectively, and then cooled to room temperature. Six different particle sizes (i.e., around 74, 68, 60, 42, 36, and 32 nm for ultraviolet visible [UV–Vis] absorption maxima of 544, 540, 536, 528, 526, 525 nm) 18 of colloidal Au NPs were obtained and stored at room temperature before use.
Preparation of Diethylstilbestrol Standard Solutions
A total of 100 mg/L diethylstilbestrol stock solution was prepared by ultrasonically dissolving 10.0 mg of diethylstilbestrol in 100 mL of acetonitrile. Next, the diethylstilbestrol stock solution was diluted to a series of diethylstilbestrol standard solutions with acetonitrile before use.
Sample Preparation
The method used for extracting diethylstilbestrol from chicken breast was based on a quick, cheap, and simple sample preparation method for diethylstilbestrol analysis according to liquid chromatography–mass spectroscopy/mass spectroscopy (LC-MS/MS) methods19,20 with a slight modification. In brief, chicken breasts were taken from refrigerator to thaw for about 2 h at room temperature and then mashed with tissue disintegrator (JJ-2B, Jintan Jinnan Instrument Factory, China). Next, 5 g of the mashed chicken breast was vigorously mixed (VOTRER-5 whirlpool mixer, Haimen Kylin–Bell Lab Instrument Co., Ltd., China) with 2 mg of diethylstilbestrol and 20 mL of acetonitrile for 1 min, oscillated ultrasonically (JK-50B ultrasonic cleaner, Hefei Jinnike Machinery Co., Ltd., China) for 10 min, and centrifuged (JW-1024 low speed centrifuge, Anhui Jiawen Instrument Equipment Industry Co. Ltd., China) at 4200 r/min for 10 min. The supernatants were combined after a second extraction with 20 mL of acetonitrile and then vigorously mixed with 2 g of magnesium sulfate for 1 min, evaporated to around 10 mL with nitrogen at 60 ℃ (HSC-24B nitrogen evaporation, Tianjin Heng Ao Technology Development Co., Ltd., China), and centrifuged at 4200 rpm/min for 10 min. Subsequently, the supernatant was filtered through a 0.45 µm filter membrane and then vigorously mixed with 10 mL of hexane for 1 min, oscillated ultrasonically for 10 min, and centrifuged at 4200 r/min for 10 min. Lastly, the upper layer (i.e., hexane phase) was removed and the lower layer (i.e., acetonitrile phase) was pipetted to a tube after static stratification of above solution. The volume of acetonitrile phase was fixed to 20 mL with acetonitrile (i.e., chicken extract containing 100 mg/L diethylstilbestrol) and then diluted to different diethylstilbestrol concentrations of samples by using chicken extract without diethylstilbestrol.
Optimization of SERS Detection Conditions
First, in order to investigate the effect of Au NPs particle sizes on Raman intensity, 300 µL of different particle sizes of Au NPs, which were synthesized by changing the additional amounts (i.e., 0.6, 0.7, 0.8, 0.9, 1.0, and 1.1 mL) of 1% trisodium citrate, were respectively mixed with 5 µL of chicken extract containing diethylstilbestrol (8 mg/L) and 50 µL of magnesium sulfate solution (0.1 mol/L). Second, for the analysis of the effect of the additional amounts of Au NPs on Raman intensity, different volumes (i.e., 0, 200, 300, 500, 700, and 900 µL) of Au NPs were respectively added to the mixture solution of 5 µL of chicken extract containing diethylstilbestrol (8 mg/L) and 50 µL of magnesium sulfate solution (0.1 mol/L). Third, different volumes (i.e., 0, 3, 5, 10, 15, and 20 µL) of chicken extract containing diethylstilbestrol (8 mg/L) were respectively mixed with the optimal additional amount (300 µL) of Au NPs and 50 µL of magnesium sulfate solution (0.1 mol/L) to determine the optimal additional amount of chicken extract containing diethylstilbestrol. Fourth, different volumes (i.e., 0, 30, 50, 70, 100, and 120 µL) of magnesium sulfate solution (0.1 mol/L) were respectively blended with 300 µL of Au NPs and 5 µL of chicken extract containing diethylstilbestrol (8 mg/L) to analyze the optimal additional amount of magnesium sulfate solution. Fifth, based on the above optimized parameters, the mixture solutions of 300 µL of Au NPs, 5 µL of chicken extract containing diethylstilbestrol (8 mg/L) and 50 µL of magnesium sulfate solution (0.1 mol/L) were used to select the optimal adsorption time. Five parallel samples for each concentration levels were performed during the above optimization processes.
Spectral Measurement
Raman spectra (400–1800 cm−1) were acquired using a portable Raman spectrometer (QE 65Pro, Ocean Optics Co., Inc.) equipped with a 785 nm laser (LASER-785-LAB-ADJ-S, Ocean Optics Co., Inc.). A laser power of 650 mW was focused onto the sample placed in liquid sample holder (Ocean Optics Co., Inc.) by using Raman coupled fiber probe with SMA-SMA connectors on both fibers (RIP-RPB-785-SMA-SMA, Ocean Optics Co., Inc.). Two scans with integration times of 10 s each were averaged and smoothed by using a three-point moving average.
Raman spectra of the samples (i.e., the mixture solutions of chicken extract containing different levels of diethylstilbestrol (5 µL), Au NPs (300 µL), and 0.1 mol/L magnesium sulfate solution (50 µL)) were measured to establish the detection model when the adsorption time was 1 min.
The optical absorbance spectra (400–700 nm) of samples, including Au NPs, diethylstilbestrol standard solution, chicken extract without diethylstilbestrol, and chicken extract containing diethylstilbestrol, were measured on a UV–Vis spectrometer (T6, Beijing Purkinje General Instrument Co., Ltd., China).
Statistical Analysis
Raman spectra of chicken extract samples containing 11 concentrations of diethylstilbestrol (0.5–10 mg/L) were measured and five parallel samples for each concentration levels were performed. Raman spectra of six different diethylstilbestrol concentrations of the samples (i.e., 0.5, 2, 4, 6, 8, and 10 mg/L) were selected for calibration set and Raman spectra of the rest of five different diethylstilbestrol concentrations of the samples (i.e., 1, 3, 5, 7, and 9 mg/L) were used for the test set.
Baseline correction of raw Raman spectra based on the adaptive iteratively reweighted penalized least squares method was performed to reduce the baseline variability in the region of 400–1800 cm−1 using Matlab R2010b (The MathWorks, Inc.) before multivariate analysis. Next, principal component analysis (PCA) was performed, which is a non-parametric approach using mathematical decomposition to reduce the dimension of data and only retain a small amount of scores and loadings. The first two principal components (PCs) were used to analyze the possibility for the detection of diethylstilbestrol residues in chicken using The Unscrambler 9.7 (CAMO Software AS, Norway) before the detection models were established, and the pre-processed spectra data have been centered first when PCA was performed. For univariate analysis, Raman intensities of characteristic peaks (i.e., 819, 1073, and 1092 cm−1) and the diethylstilbestrol concentrations in chicken extract were correlated to evaluate whether there was a good linear relationship between Raman intensities and the corresponding concentrations. Besides, partial least squares regression (PLSR) was used to establish the quantitative model using The Unscrambler 9.7 for quantitative analyses. A total of 449 variables (i.e., Raman intensities in the region of 400–1800 cm−1) were used as the inputs of the model. The pre-processed spectra data have been centered first when PLSR was performed, and leverage correction, which is an approximation to cross-validation and sometimes can give apparently reasonable results, especially for small data tables, was adopted as validation method to establish PLSR model. The determination coefficient (R2), root mean square error (RMSE), and ratio of prediction to deviation (RPD) were calculated to evaluate the model performance.
Results
Surface-Enhanced Raman Spectra Characteristics of Samples
As shown by comparing the curves (a), (b), (c), and (d) in Fig. 1, some SERS peaks including 585, 819, 895, 1073, 1092, 1170, and 1372 cm−1 appeared on SERS spectra of diethylstilbestrol standard solution. However, the mixture of Au NPs and magnesium sulfate itself caused an obvious peak at 1372 cm−1, two very weak peaks at 585 and 895 cm−1, and a broad band at around 1574 cm−1, which interfered with some of the characteristic peaks of diethylstilbestrol. In addition, the broad band at around 1198 cm−1 caused by acetonitrile and characteristic peak of chicken extract without diethylstilbestrol at 1173 cm−1 made it difficult to identify the characteristic peak of diethylstilbestrol at 1170 cm−1. Furthermore, SERS peaks at 819, 1073, and 1092 cm−1 could be seen on SERS spectra of diethylstilbestrol standard solution and chicken extract containing diethylstilbestrol, while they could not be found on SERS spectra of chicken extract without diethylstilbestrol by the contrast of the curve (d), (e), and (f) in Fig. 1. Therefore, 819, 1073, and 1092 cm−1 could be used as the main characteristic peaks for the analysis of diethylstilbestrol residues in chicken.
Representative SERS spectra of the samples including (a) Au NPs, (b) Au NPs + MgSO4, (c) Au NPs + acetonitrile + MgSO4, (d) Au NPs + diethylstilbestrol standard solution (8 mg/L) + MgSO4, (e) Au NPs + chicken extract without diethylstilbestrol + MgSO4, and (f) Au NPs + chicken extract containing diethylstilbestrol (8 mg/L) + MgSO4. The Raman spectra have been vertically offset and the vertical dashed lines represent the position of Raman characteristic peaks.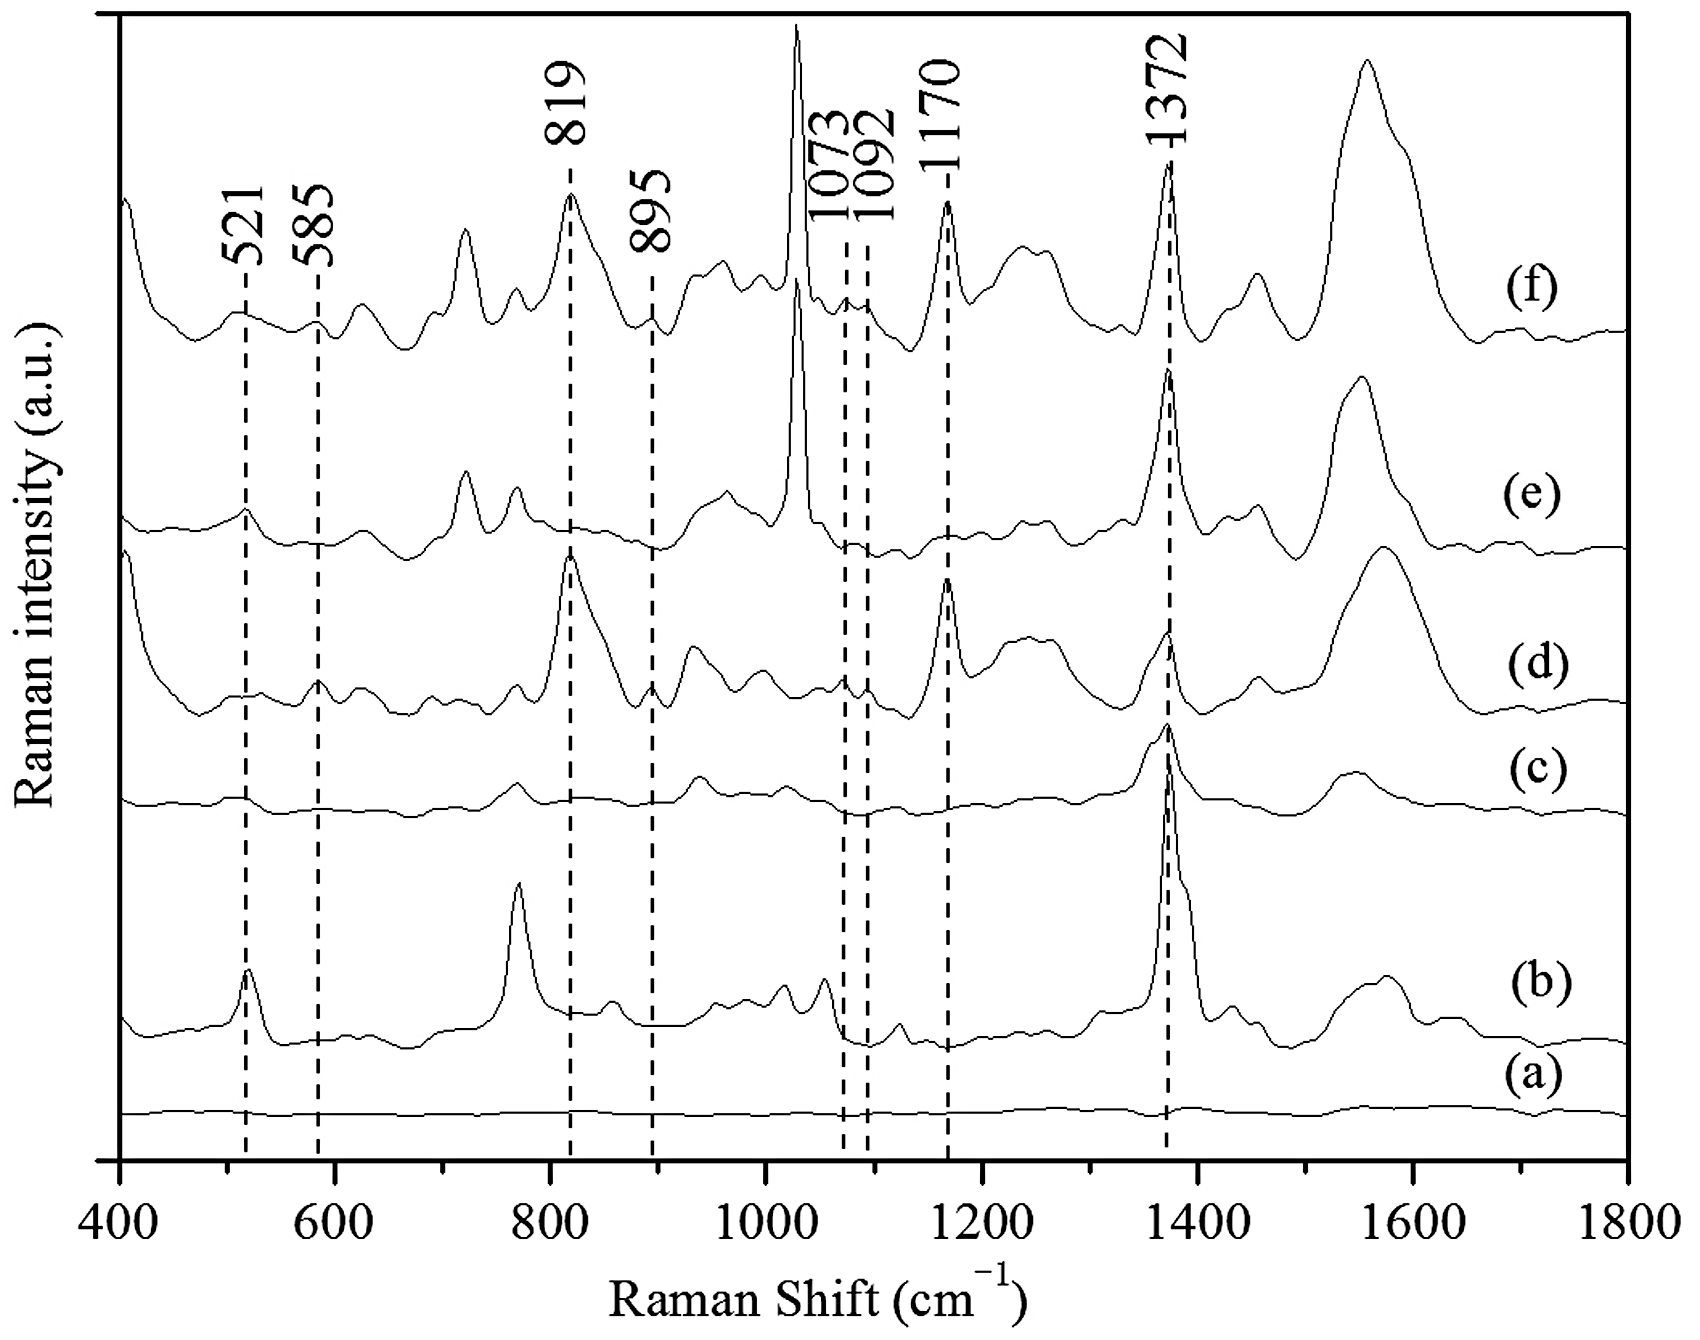
The SERS peak at 819 cm−1 was attributed to respiratory vibration of benzene ring. The SERS peak at 1073 cm−1 was ascribed to C–O stretching vibration. The SERS peak at 1092 cm−1 was attributed to C–C bending vibration. 21
The surface plasmon resonance (SPR) peaks of Au NPs, Au NPs + MgSO4, Au NPs + chicken extract containing diethylstilbestrol + MgSO4, Au NPs + chicken extract without diethylstilbestrol + MgSO4, Au NPs + diethylstilbestrol standard solution + MgSO4 are shown in Fig. 2. For Au NPs, one SPR peak could be observed at 528 nm, which indicated that its particle diameter was around 42 nm according to the relationship between SPR peak and particle diameter.
22
When Au NPs was mixed with magnesium sulfate solution, the SPR peaks blueshifted from 528 nm to 526 nm. When Au NPs and magnesium sulfate solution were respectively blended with diethylstilbestrol standard solution, chicken extract without diethylstilbestrol, and chicken extract containing diethylstilbestrol, the SPR peaks redshifted from 526 nm to 530, 532, and 534 nm, respectively. This phenomenon showed that the larger aggregates were formed because the negative surfaces of Au NPs contributed to the adsorption of positive charged chicken extract, diethylstilbestrol, or magnesium sulfate onto the surface of Au NPs.
23
The mixture system of Au NPs, chicken extract containing diethylstilbestrol, and magnesium sulfate had a wide absorption band to the near-infrared spectral region which were favorable to SERS measurements with an excitation laser at 785 nm.
Representative UV–Vis absorption spectra including (a) Au NPs + chicken extract containing diethylstilbestrol (8 mg/L) + MgSO4, (b) Au NPs + chicken extract without diethylstilbestrol + MgSO4, (c) Au NPs + MgSO4, (d) Au NPs + diethylstilbestrol standard solution (8 mg/L) + MgSO4, and (e) Au NPs.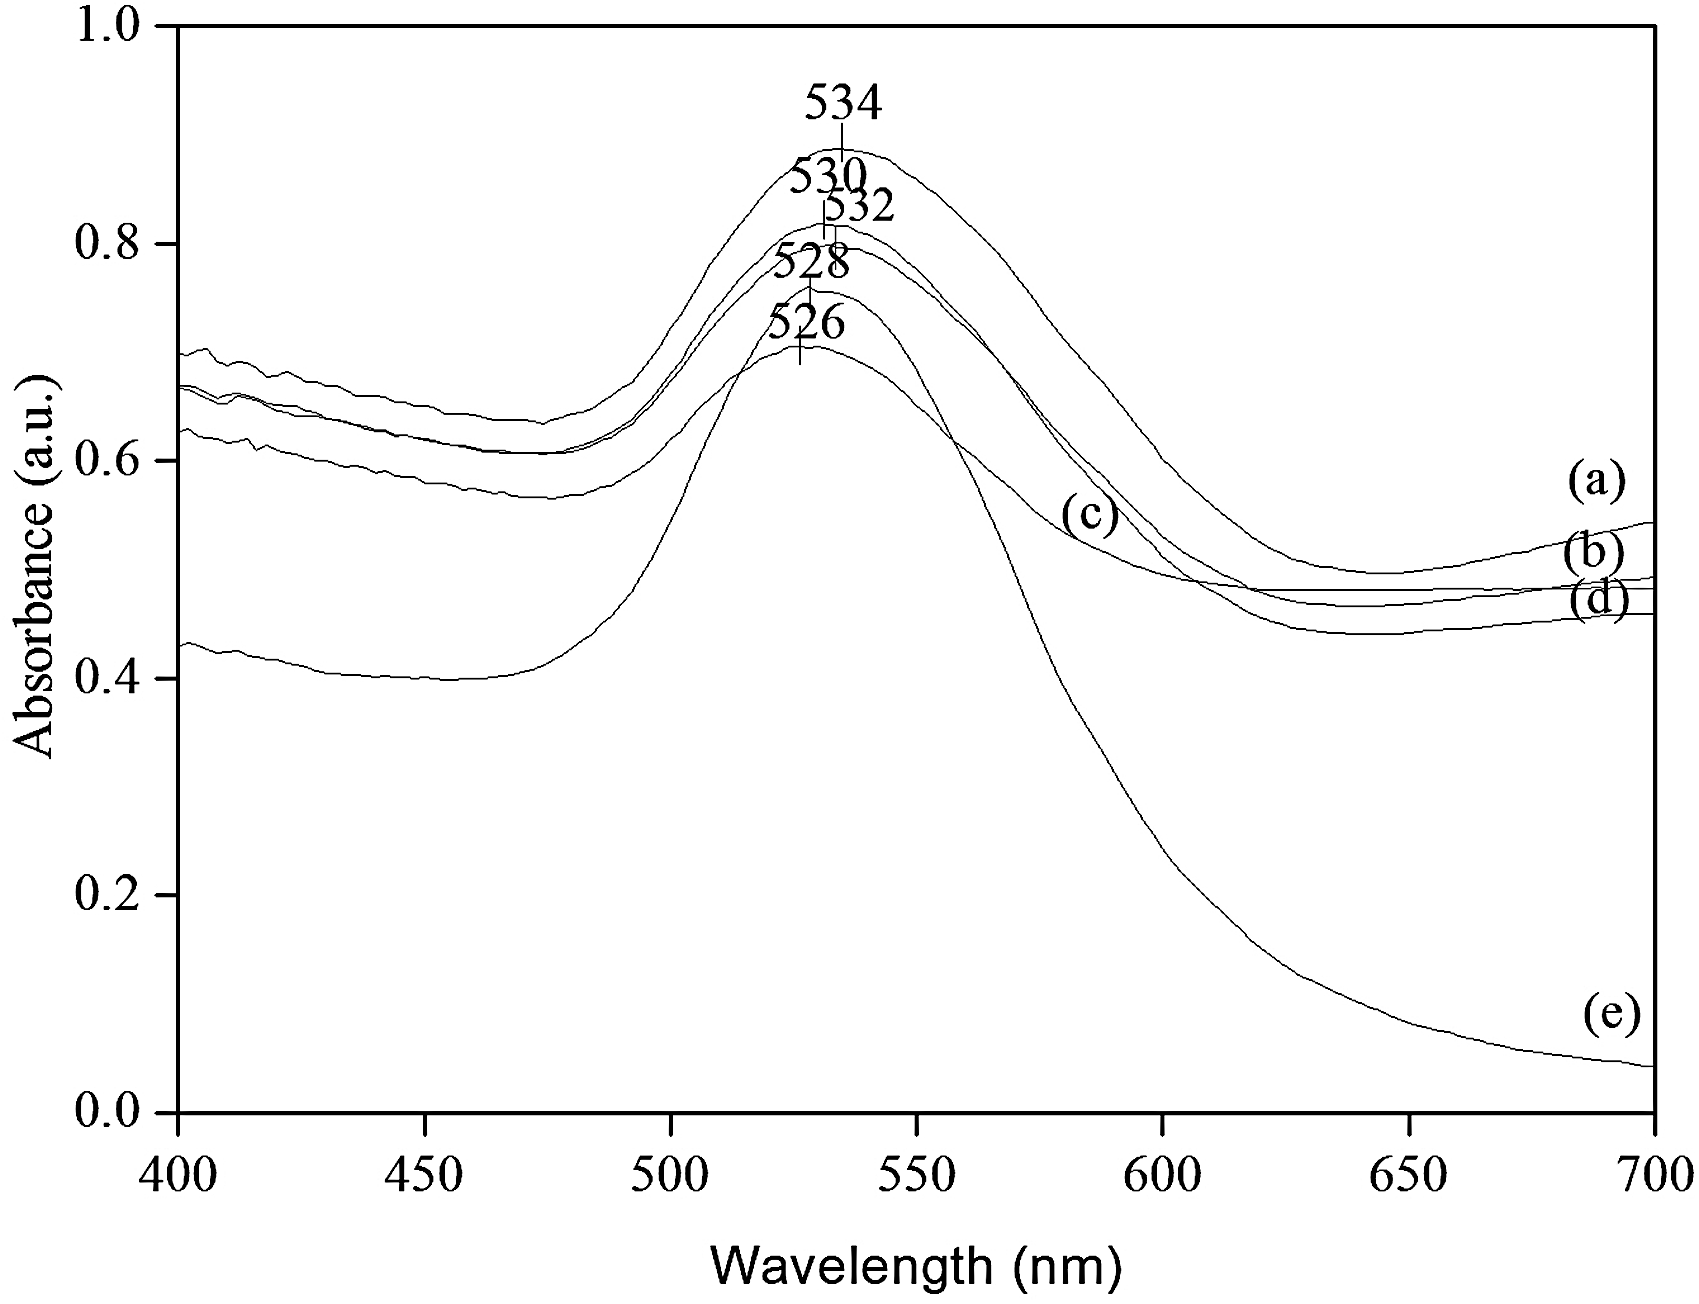
Optimization of Surface-Enhanced Raman Spectroscopy Detection Conditions of Diethylstilbestrol Residues in Chicken
Surface-enhanced Raman spectroscopy enhancement effects of metallic NPs are closely related to their shapes, sizes, and the aggregation degrees. In addition, the impacts of NP sizes on SERS enhancement have relations with too many complex factors.
24
Therefore, experimental data are often applied to determine the NP sizes. For example, SERS enhancement effects of different NP sizes are compared to obtain an optimal NP size.
24
Six particle sizes of Au NPs were synthesized by altering the additional amounts of trisodium citrate to select an optimal one as enhancement substrate of this study. Their particle sizes are roughly estimated as around 74, 68, 60, 42, 36, and 32 nm for UV–Vis absorption maxima of 544, 540, 536, 528, 526, 525 nm according to the relationship between SPR peak and particle diameter.
18
As indicated in Fig. 3a, Raman intensities of characteristic peaks at 819, 1073, and 1092 cm−1 for chicken extract containing diethylstilbestrol were affected by the sizes of Au NPs. Using 0.9 mL of trisodium citrate to synthesize Au NPs as enhancement substrate resulted in the greatest enhancement effects at 819, 1073, and 1092 cm−1. This showed that the spacing between the Au NPs of this NP size and diethylstilbestrol molecules in chicken extract was moderate and a large quantity of aggregates were formed.
25
Thus, Au NPs (around 42 nm) synthesized by using 0.9 mL of trisodium citrate was selected for the analysis of diethylstilbestrol residues in chicken.
(a) Effect of the sizes of Au NPs by altering the additional amounts of 1% trisodium citrate, (b) the additional amount of Au NPs, (c) the additional amount of chicken extract containing diethylstilbestrol, (d) the additional amount of magnesium sulfate solution, and (e) the adsorption time on Raman intensities of chicken extract containing diethylstilbestrol (8 mg/L).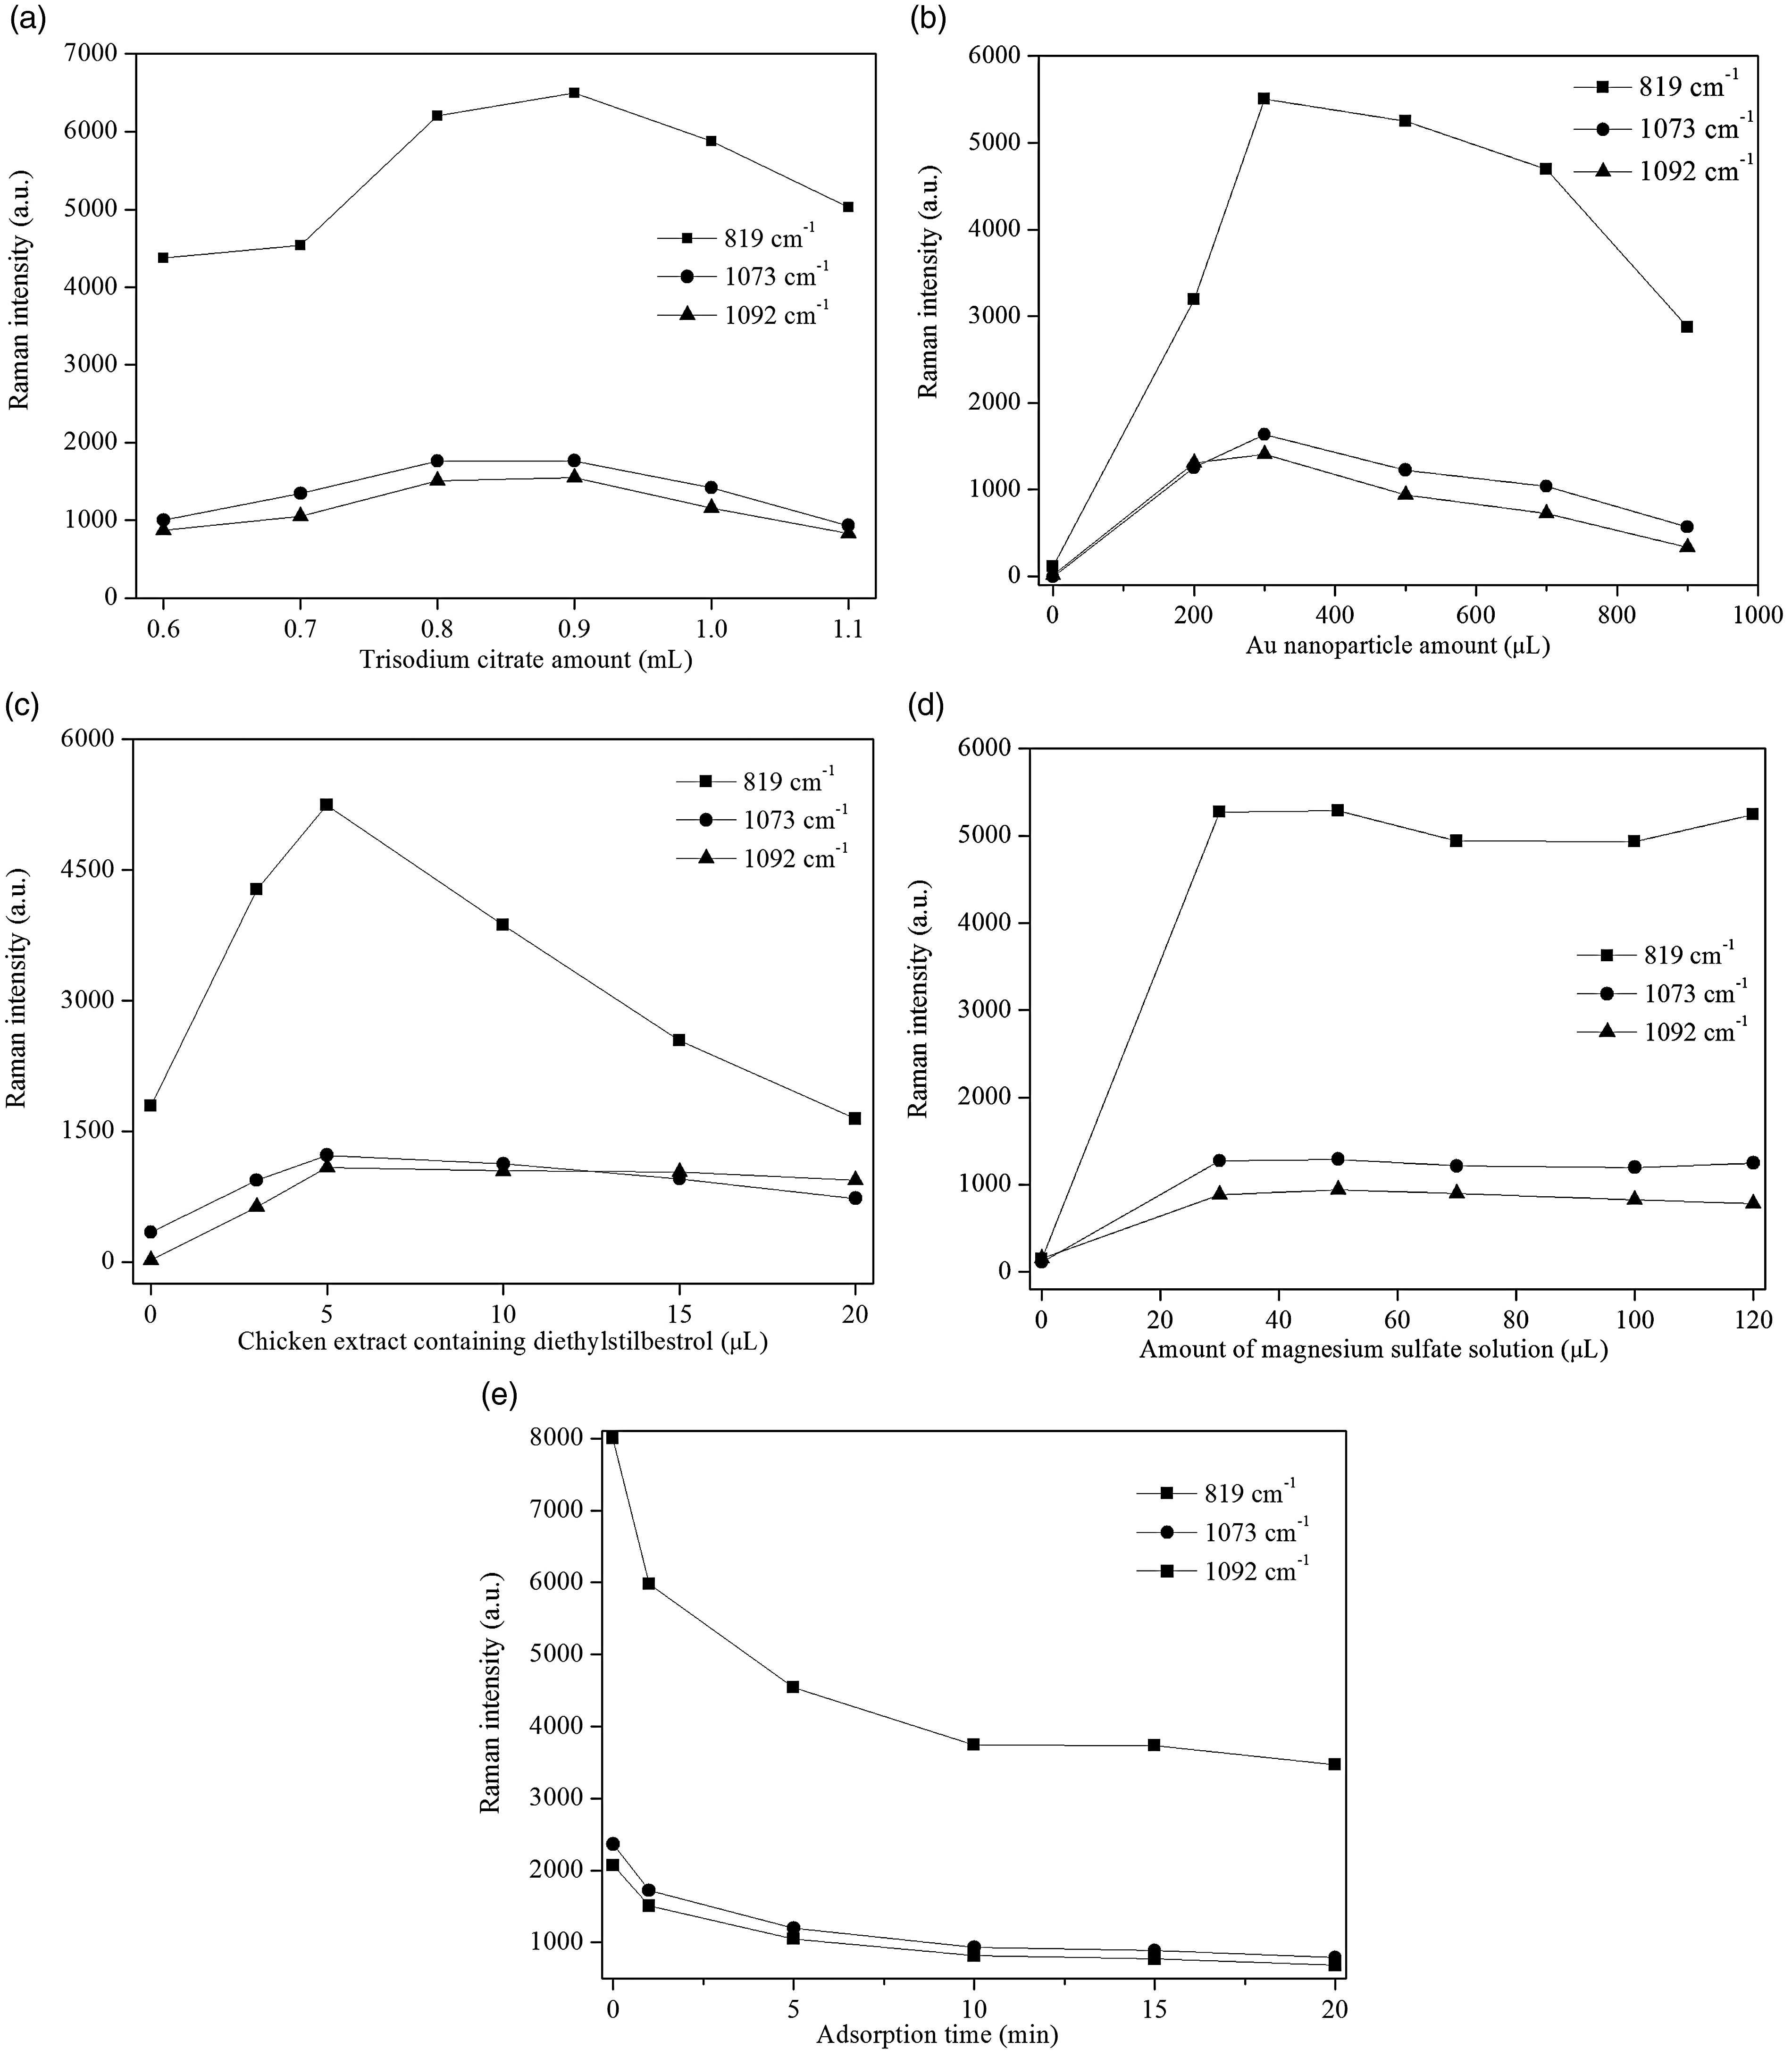
The diethylstilbestrol molecules in chicken extract adsorbed onto the surface of Au NPs would result in the SERS effect. However, not all diethylstilbestrol molecules in chicken extract could produce the SERS effect because some of them were not adsorbed onto surface of Au NPs. The ratio of Au NPs to chicken extract containing diethylstilbestrol was one of the important factors affecting the strength of the SERS effect. 26 As shown in Fig. 3b in the condition of only changing the additional amounts of Au NPs, Raman intensities at 819, 1073, and 1092 cm−1 gradually enhanced along with the increase of the additional amounts of Au NPs when the additional amounts of Au NPs were no more than 300 µL. This was mainly owing to the fact that the probability of the aggregates formed by diethylstilbestrol molecules, Au NPs, etc. would be increased with the increase of Au NPs. Besides, their Raman intensities gradually decreased along with the increase of the additional amounts of Au NPs when the additional amounts of Au NPs were > 300 µL. This was principally due to the fact that the decline in the neutralization ability of Mg2+ to the negative charges on the surface of Au NPs with the increase of the additional amounts of Au NPs resulted in the decrease of the diethylstilbestrol adsorption effect and the Raman intensities. 26 Another possible reason was the dilution effects on both the aggregating agent and sample analyte molecules as the sample mixtures were saturated with AuNPs. Therefore, 300 µL was selected as the optimal additional amount of Au NPs.
To analyze the additional amounts of chicken extract containing diethylstilbestrol on Raman intensities, Raman intensities at 819, 1073, and 1092 cm−1 were investigated under the condition of only changing the additional amounts of chicken extract containing diethylstilbestrol. As demonstrated in Fig. 3c, Raman intensities at 819, 1073, and 1092 cm−1 enhanced first and then decreased as the increase of the additional amounts of chicken extract containing diethylstilbestrol. In addition, Raman intensity reached the maximum value when the additional amount of chicken extract containing diethylstilbestrol was 5 µL. The major reason for the increase of Raman intensities was that the probability of diethylstilbestrol molecules adsorbed onto the surface of Au NPs increased with the increase of the additional amounts of chicken extract containing diethylstilbestrol. 23 Additionally, one of the important reasons for the decrease of SERS intensities was that the excessive additional amounts of chicken extract containing diethylstilbestrol would lead to the increases of some impurities, such as protein and fat, which could interfere with the adsorption of diethylstilbestrol molecules onto the surface of Au NPs and resulted in the number decrease of diethylstilbestrol molecules adsorbed onto the surface of Au NPs owing to the competitive adsorption of these impurities and diethylstilbestrol on the surface of Au NPs. 26
Suitable activation agents, such as inorganic salts, are conducive to form the aggregates of colloidal NPs, and the specific activating agent can have an immense influence on Raman enhancement of the analyte. 27 The effect of magnesium sulfate solution on Raman intensities of chicken extract containing diethylstilbestrol was investigated in this study. As shown in Fig. 3d, under consideration of only changing the additional amounts of magnesium sulfate solution, Raman intensities at 819, 1073, and 1092 cm−1 were greatly enhanced after adding magnesium sulfate solution. This phenomenon demonstrated that magnesium sulfate solution had played a role of activation agent. Also, the fluctuation of Raman intensities at 819, 1073, and 1092 cm−1 was not distinct from the increase of the additional amounts of magnesium sulfate solution in the range of 30–120 µL. Furthermore, Raman intensities reached a relatively maximum value when the additional amount was 50 µL. Therefore, the optimal additional amount of magnesium sulfate solution was determined as 50 µL.
The adsorption time is one of the important factors affecting Raman intensities of the analyte. 26 As shown in Fig. 3e, Raman intensities at 819, 1073, and 1092 cm−1 gradually decreased along with the increase of the adsorption time in the range of 0–20 min. This variety trend was chiefly because the competitive adsorption between diethylstilbestrol and other components onto the surface of Au NPs resulted in the changes of so-called hot spots. Although Raman intensities had the maximum value at the beginning, the experiment process was difficult to perform in so short time. Therefore, SERS spectra in other experiment section were measured when the adsorption time was 1 min.
Analysis of Diethylstilbestrol Residues in Chicken
Figure 4 shows the plots of PCA scores (sample number = 30) for the first two PCs of the calibration set that account for 99% of the spectral variations (97% and 2% for PC1 and PC2, respectively). Chicken extract samples containing different concentrations of diethylstilbestrol could be separated clearly from each other, which indicated that there were marked differences in Raman spectra in the samples containing different concentrations of diethylstilbestrol and it was feasible to detect diethylstilbestrol residues in chicken using SERS technology. There was an obvious difference between PC1 and PC2 loading spectra (Fig. S1, Supplemental Material). By comparison of the curves (d), (e), and (f) in Fig. 1 and the curves in Fig. S1, SERS peaks, including 585, 819, 895, 1073, 1092, and 1170 cm−1, simultaneously appeared on SERS spectra of diethylstilbestrol standard solution and PC1 loading curve. The SERS peak of diethylstilbestrol standard solution at 1372 cm−1 and the SERS peak of chicken extract at 1028 cm−1 simultaneously appeared on the PC1 and PC2 loading curves. The SERS peak of acetonitrile at 1198 cm−1 appeared on the PC2 loading curve. Used as the main characteristic peaks for the analysis of diethylstilbestrol residues in chicken, 819, 1073, and 1092 cm−1 only appeared on PC1 loading curve, and 819 cm−1 was the most prominent discriminant variable. To sum up, the PC1 and PC2 loading curves contained multicomponent information in chicken extract. For example, the PC1 loading curve contained the Raman information of diethylstilbestrol, chicken extract, Au NPs, MgSO4, etc. The PC2 loading curve contained the Raman information of acetonitrile, chicken extract, etc.
Principal component analysis plot of scores of first two PCs for Raman spectra of calibration set. The numbers inside the ellipses represent the diethylstilbestrol concentration in chicken extract and the concentration unit is mg/L.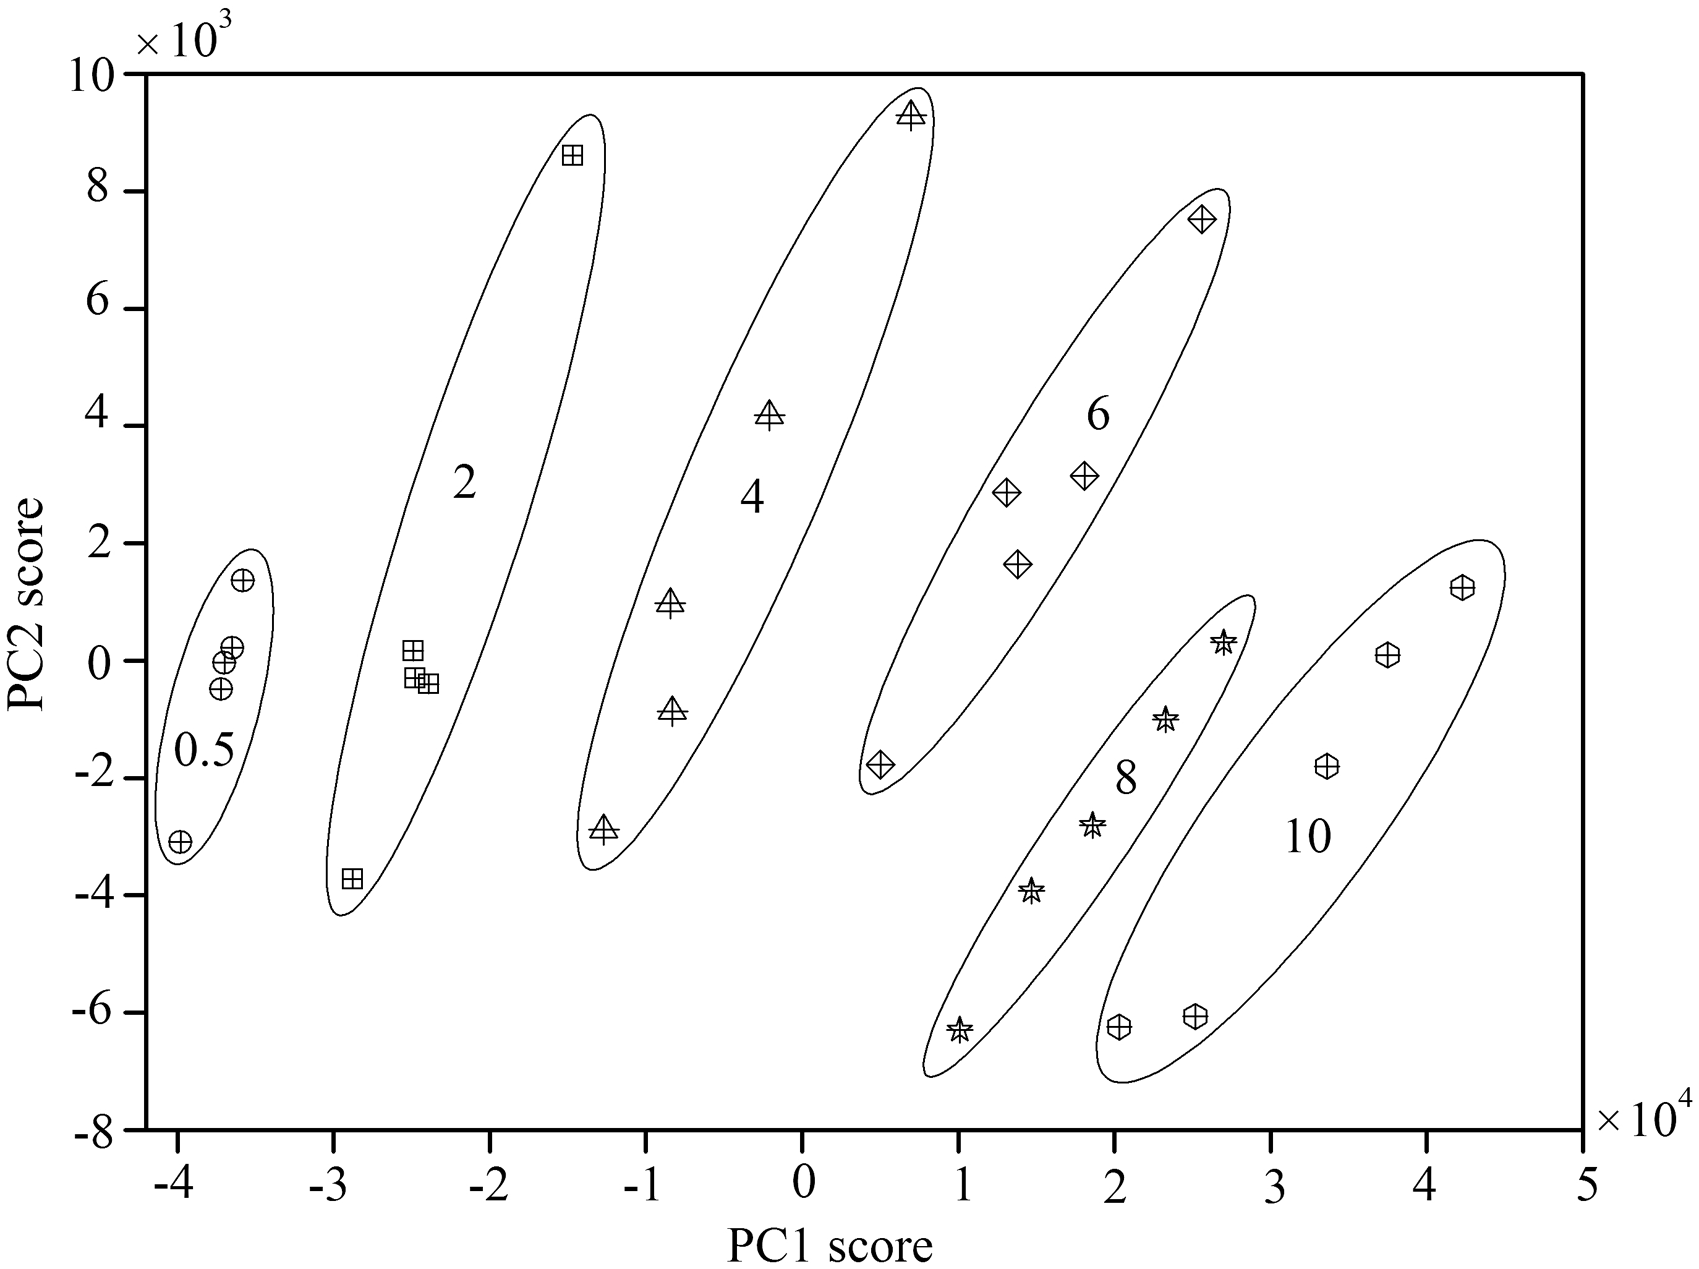
Static summary of four prediction models for detection of diethylstilbestrol residues in chicken extract.
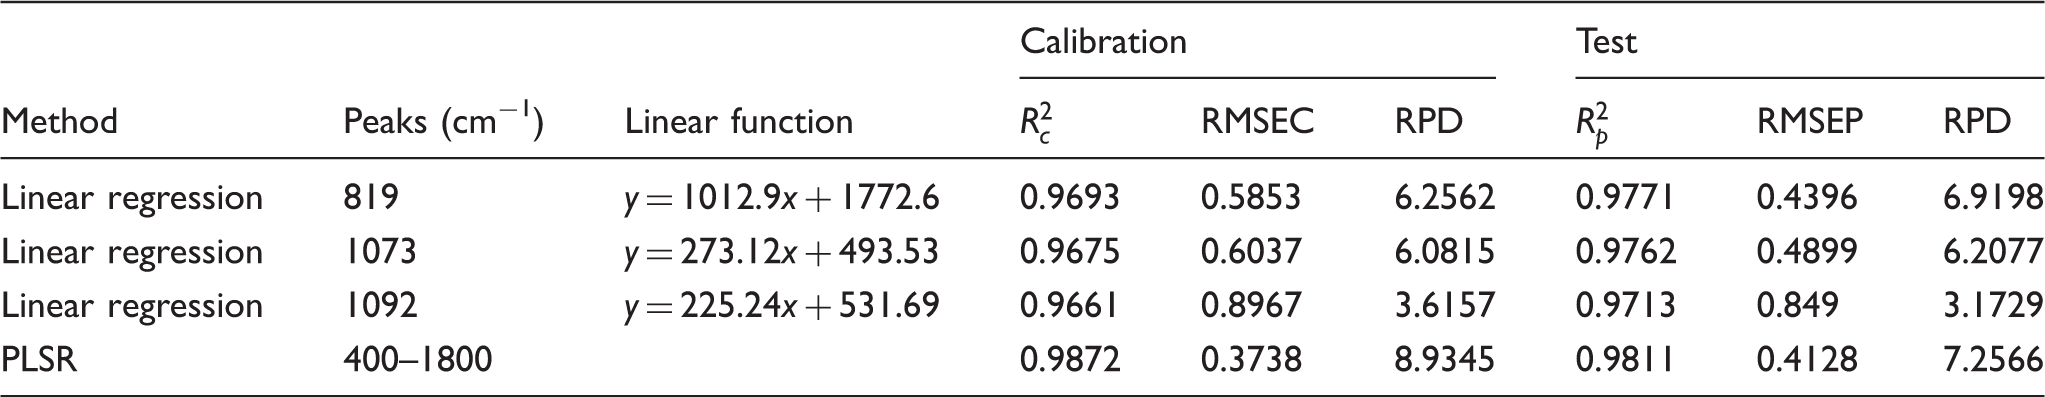
Partial least squares regression, a multivariate method, was also utilized to establish the model to further assess the performance for quantitative analysis of diethylstilbestrol residues in chicken extract. After raw Raman spectra were baseline corrected, total 449 variables (i.e., Raman intensities in the region of 400–1800 cm−1) were used as the inputs of PLSR model. Fig. S2 (Supplemental Material) shows the PLSR loadings. By comparison, the curves in Figs. S1 and S2 in the LV1 spectrum of PLSR were similar to the PC1 spectrum of PCA. The LV2 spectrum of PLSR was similar to the PC2 horizontal axisymmetric spectrum of PCA. Diethylstilbestrol Raman peaks in chicken extract (i.e., 819, 1073, and 1092 cm−1) appeared on the LV1 spectrum of PLSR, which showed that PLSR was an effective approach to quantitatively analyze diethylstilbestrol residues in chicken. As shown in Table I, the use of PLSR resulted in higher R2 and RPD values, and a lower RMSE value by comparison with the prediction results of single peak intensity. The best PLSR was obtained using Raman intensities of full spectra with an R2 value of 0.9872, RMSE value of 0.3738, and RPD value of 0.3738 for the calibration set, and an R2 value of 0.9811, RMSE value of 0.4128, and RPD value of 7.2566 for the test set. Additionally, PLSR exhibited a good predictability (Fig. 5). In conclusion, the experimental results showed that the SERS method had the potential to analyze quantitatively the diethylstilbestrol residues in chicken extract coupled with PLSR.
The relationship between actual values of diethylstilbestrol residues in chicken extract and predicted values for the calibration set and test set with the PLSR model.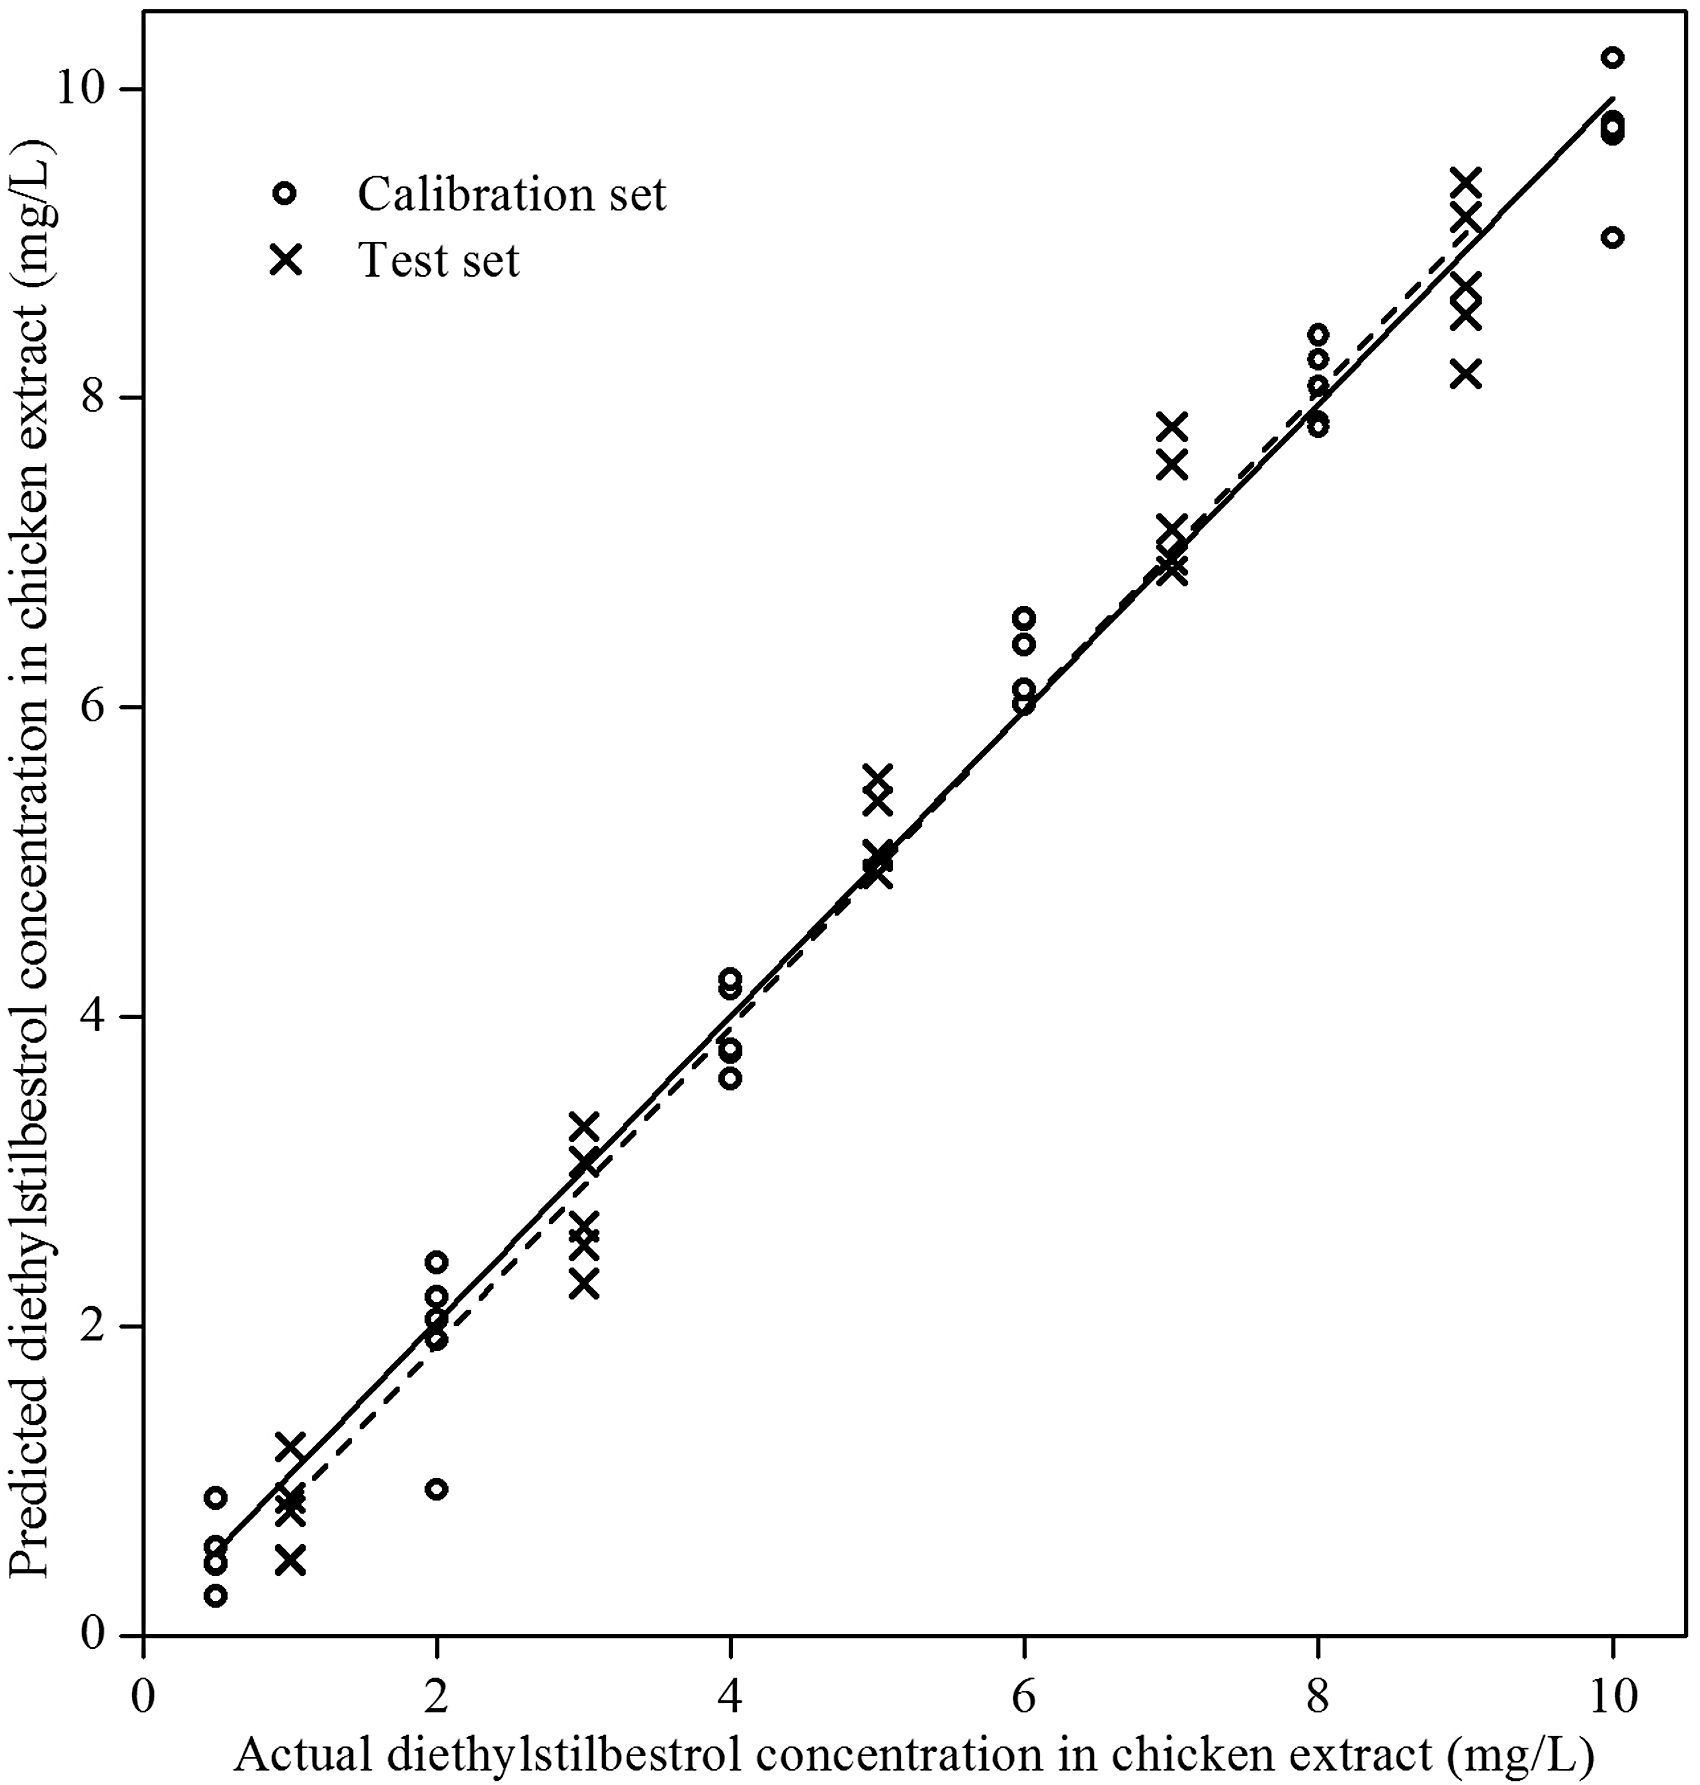
Conclusion
In summary, we developed an approach to detect rapidly and quantitatively the diethylstilbestrol residues in chicken using SERS technology, and it has great potential application in the detection of hormone residues in other meat. A series of particle sizes of Au NPs were successfully synthesized by altering the additional amount of trisodium citrate and compared as enhancement substrates for the detection of diethylstilbestrol residues in chicken extract. The additional amounts of Au NPs, chicken extract containing diethylstilbestrol and magnesium sulfate solution, as well as the adsorption time were optimized for improving the SERS detection effect of diethylstilbestrol residues in chicken, respectively. Linear regression and PLSR were applied to establish the models for a quantitative analysis of the diethylstilbestrol residues in chicken extract, and PLSR exhibited a better predictability with an R2 value of 0.9872, RMSE value of 0.3738, and RPD value of 0.3738 for the calibration set and an R2 value of 0.9811, RMSE value of 0.4128, and RPD value of 7.2566 for the test set. The experimental results showed the adopted Au NPs had the good enhancement effect on diethylstilbestrol in chicken meat extract. The high prediction result of multivariate analysis illustrated the potential of using SERS technology for the quantitative detection of diethylstilbestrol residues in chicken. Surface-enhanced Raman spectroscopy technology coupled with multivariate method was a good and possible method for the quantitative analysis of the diethylstilbestrol residues in chicken.
Supplemental Material
Supplemental material for Analysis of Diethylstilbestrol Residues in Chicken Using Surface-Enhanced Raman Spectroscopy (SERS) Coupled with Multivariate Analysis
Supplemental material for Analysis of Diethylstilbestrol Residues in Chicken Using Surface-Enhanced Raman Spectroscopy (SERS) Coupled with Multivariate Analysis by Xiongfei Chen, Muhua Liu, Haichao Yuan, Shuanggen Huang, Jinjiang Tao and Jinhui Zhao in Applied Spectroscopy
Footnotes
Conflict of Interest
The authors report there are no conflicts of interest.
Funding
This research was sponsored by National Natural Science Foundation of China (31660485), Science and Technology Research Project of Jiangxi Education Department, China (GJJ160350), Science and Technology Support Project of Jiangxi Province, China (2012BBG70058), and External Science and Technology Cooperation Plan of Jiangxi Province, China (20132BDH80005).
Supplemental Material
All supplemental material mentioned in the text is available in the online version of the journal.
References
Supplementary Material
Please find the following supplemental material available below.
For Open Access articles published under a Creative Commons License, all supplemental material carries the same license as the article it is associated with.
For non-Open Access articles published, all supplemental material carries a non-exclusive license, and permission requests for re-use of supplemental material or any part of supplemental material shall be sent directly to the copyright owner as specified in the copyright notice associated with the article.