
Abstract
This work reports an investigation on the feasibility of using a photomultiplier tube (PMT) to follow the time evolution of self-absorption of copper resonance transitions at 324.7 nm and 327.4 nm. The plasma was obtained by focusing a Nd:YAG laser, operated at 1064 nm, on a series of aluminum alloy standard disks containing different copper concentrations. The results described have been obtained at different times and with different set-ups. These set-ups consisted of a Paschen–Runge polychromator, a LIBS 2000 spectrometer, and a spectrometer equipped with both an intensified charge-coupled device (ICCD) and PMT. Both PMT signals and time-resolved spectra were obtained and the ratio of the two Cu resonant lines was calculated, compared, and discussed. By selecting different delay times and integration gates of the PMT signals, the self-absorption effect of the Cu resonant lines was found to be changing, implying that, by careful selection of the integration window of PMT signals, the self-absorption may be minimized, thus improving the calibration linearity of the technique.
Keywords
Introduction
The temporal behavior of atomic and ionic emission lines is one of the essential parameters governing the performance of laser-induced breakdown spectroscopy (LIBS) as a quantitative analytical technique, within which self-absorption is one of the most important factors that influence quantitative analysis. A significant literature can be found on this topic and a few pertinent examples are reported here.1–11 These include the influence of self-absorption on curves of growth,3,4 the modeling and spectral analysis of line shapes,5,6,10,11 together with the description and practical implementation of experimental methods for its evaluation and correction.7–10 The reader is referred to Hahn and Omenetto for an exhaustive review of the subject.1,2
The wide application of a gated intensified charge-coupled device (ICCD) detector, where the opening of the measuring gate can be continuously delayed from the onset of the plasma, allows the acquisition of the entire temporal waveform. However, because of the transient nature of LIBS, temporal analysis by ICCD is necessarily based on analyzing different plasmas generated by different laser pulses. As each individual plasma may differ from one another, the ideal way of performing temporal analysis would be to investigate the behavior of one particular plasma. In other words, a temporal analysis accomplished within the persistence time of a single LIBS plasma would be more meaningful.
The use of a photomultiplier tube (PMT) allows the acquisition of the entire temporal behavior of a single plasma event in a small spectral bandwidth. Indeed, its use in LIBS work is not new. Early work of Radziemski et al. describes the detection of aerosols in air using a combination of PMT and boxcar averager, providing both time resolution and averaging. 12 In a classic work, Bette and Noll first performed scanning microanalysis of macroscopic samples using a Paschen–Runge type spectrometer to detect up to 24 elements simultaneously. 13 In double-pulse experiments, Gautier et al. used a PMT to obtain time profiles of the emission lines of Al samples and of atmospheric lines; 14 Chen et al. coupled a PMT with digital storage oscilloscope to detect trace heavy metals in water; 15 Novotný et al. used a PMT gated by a laboratory-built control unit to obtain depth profiles of zinc-coated steel samples, 16 in the analysis of tungsten carbides, 17 and in the design of a time resolved double-pulse instrument. 18 An automatic transient LIBS system was also described by Lin Qiao-Jun et al., 19 and Yu-Tai Li et al. reported ns time resolution LIBS of Al using a 100 ps pulsed neodymium-doped yttrium aluminum garnet (Nd:YAG) laser and a fast PMT. 20 Finally, Antony et al. used a combination of a fast PMT-high bandwidth oscilloscope to obtain the temporal evolution of a plasma obtained on simulant lunar soil. 21
The detection of self-absorption in LIBS using PMTs is also not new. Based upon the results obtained using a PMT detector, a simple model describing the time evolution of ionic and atomic emission lines of Ca and Mg was proposed by Ahmed and Jaïdane. 22 In their model, the authors considered the effect of the optical depth, showing self-absorbed and self-reversed experimental profiles. Hou et al. investigated the time-resolved behavior of self-absorption and self-reversal of atomic Ni lines belonging to the same electronic configuration. 23 D’Angelo et al. focused on the comparison between the line profiles obtained with PMT-boxcar detection and their two-region model of an inhomogeneous, optically thick plasma,24,25 while Garcimuño et al. demonstrated the experimental decrease of the ratio of two ionic lines of Mg, belonging to the same multiplet, from the theoretical ratio of 2 when the concentration increased above the optically thin limit. 26 As pointed out by Konjević et al., checking line intensity ratios within multiplets which are expected to adhere to LS-coupling is a straightforward self-absorption test. 27 Surprisingly, the method has received little attention in the literature, irrespective of the use of PMTs as detectors.
As described later in the experimental section, in our work two different set-ups were used, in each case with different Nd:YAG lasers to create the plasma. Two spectrometers were available in the first set-up, namely a Paschen–Runge polychromator, using PMT detectors, and a LIBS 2000 spectrometer. In the second set up, the spectrometer was equipped with both an intensified charge-coupled device (ICCD) and a PMT, selected by switching a plane mirror inside the spectrometer. These arrangements, however, should not be construed to imply that all the above instrumentation was necessary to achieve the goal described in this paper: this would have indeed made the experiment rather complicated. In fact, each set-up was assembled and used over the course of several years for other projects. For the sake of completeness, it was felt useful to address the capabilities and limitations of each set-up with regard to the aim of this work, namely the detection of self-absorption using a PMT.
The added novelty of the present work lies in the procedure devised to recognize whether temporal changes of self-absorption can be detected by examining, during the entire persistence of the plasma, the time evolution of the ratio of two emission signals obtained at a single transition from two different sample concentrations or at two transitions and one sample concentration.
To better explain our approach and the interpretation of the results, the following section outlines the rationale of our experiment and the possible conclusions which can be obtained from its different outcomes.
Rationale for Detecting Self-Absorption with a Photomultiplier Tube
First, it should be stated clearly that inferring self-absorption from the observation of a single temporal waveform, corresponding to a single transition, would require a complete modeling of the temporal and spatial behavior of the parameters affecting the phenomenon: these include temperature and species number density distributions (including electrons).
On the other hand, when one takes the ratio of two temporal waveforms, corresponding to two transitions simultaneously obtained with a single laser shot, the following hypothetical scenarios can be envisaged: (1) the two transitions suffer equal amounts of self-absorption, in which case the line ratio would remain constant; (2) the two transitions suffer different amounts of self-absorption which is constant during the evolution of the plasma, in which case the ratio will remain independent of time, as in case (1); or (3) the two transitions suffer different amounts of self-absorption, whose magnitude changes during the evolution of the plasma. In this case, the time-resolved ratio would reflect such change. If self-absorption increases with the delay time from the onset of the plasma, as experimentally observed in many cases, the ratio between the stronger and the weaker transitions will decrease with time.
From the above considerations, one can conclude that time-resolved PMT data will only allow one to detect changes in self-absorption which occur during plasma evolution. This can, in principle, be done for every laser pulse. Practically, this simultaneous observation of two self-absorbed transitions could only be realized with the Paschen–Runge polychromator, with two identical PMTs located in the focal plane at the positions of the two transitions. Such capability, however, could not be exploited with our polychromator, which has several PMTs located at pre-selected wavelengths along the focal circle. As a result, the unique advantage of the PMT to provide single shot self-absorption information was not accomplished in this work.
Alternatively, several single shot waveforms can be obtained and averaged, improving the signal-to-noise ratio. Two experiments were then devised: first, we measured the time-resolved ratio of the averaged temporal profiles using a single transition and two different concentrations; and second, we measured the time-resolved ratio of the averaged temporal profiles obtained at two different transitions using a single concentration.
With this in mind, the Cu 324.7 nm and Cu 327.4 nm doublet resonant lines have been selected as the test case. It is, in fact, well-known that the theoretical ratio of the two lines in optically thin conditions should be 2, 11 and several certified alloys containing Cu at different concentrations were available.
Experimental
The general layout of the first experimental system used, here referred to as Set-up A is shown in Fig. 1a, together with two detection systems. A Q-switched Nd:YAG laser (Ultra, Big Sky, USA) operating at 1064 nm and triggered by a signal sent from a spectrometer (LIBS 2000, Ocean Optics, USA) was used for ablation. The pulse width of the Nd:YAG was 6 ns and the pulse energy was adjusted to 40 mJ/pulse. The laser was reflected off a dielectric mirror that is transparent in the visible range, then passed through a pierced mirror and finally focused on the sample by an F/1 suprasil lens. The plasma emission was back-collected by the pierced mirror with an ultraviolet (UV)-enhanced front surface and focused into a collection fiber. A fiber holder was mounted on a three-dimensional (3D) stage to effectively adjust the best fiber position to collect the plasma emission. A CCD camera (CoolSNAP HQ, 1392 × 1040 6.45 × 6.45 µm pixels, Photometrics, USA) was used to monitor the sample surface position to ensure that during each measurement the sample surface was kept at a fixed position.
(a) Scheme of experimental set-up A, including the laser ablation part and two detection systems. Only the PMT corresponding to the Cu channel at 327.4 nm was employed in this work. (b) Scheme of experimental set-up B. The signal triggering and data processing system were omitted.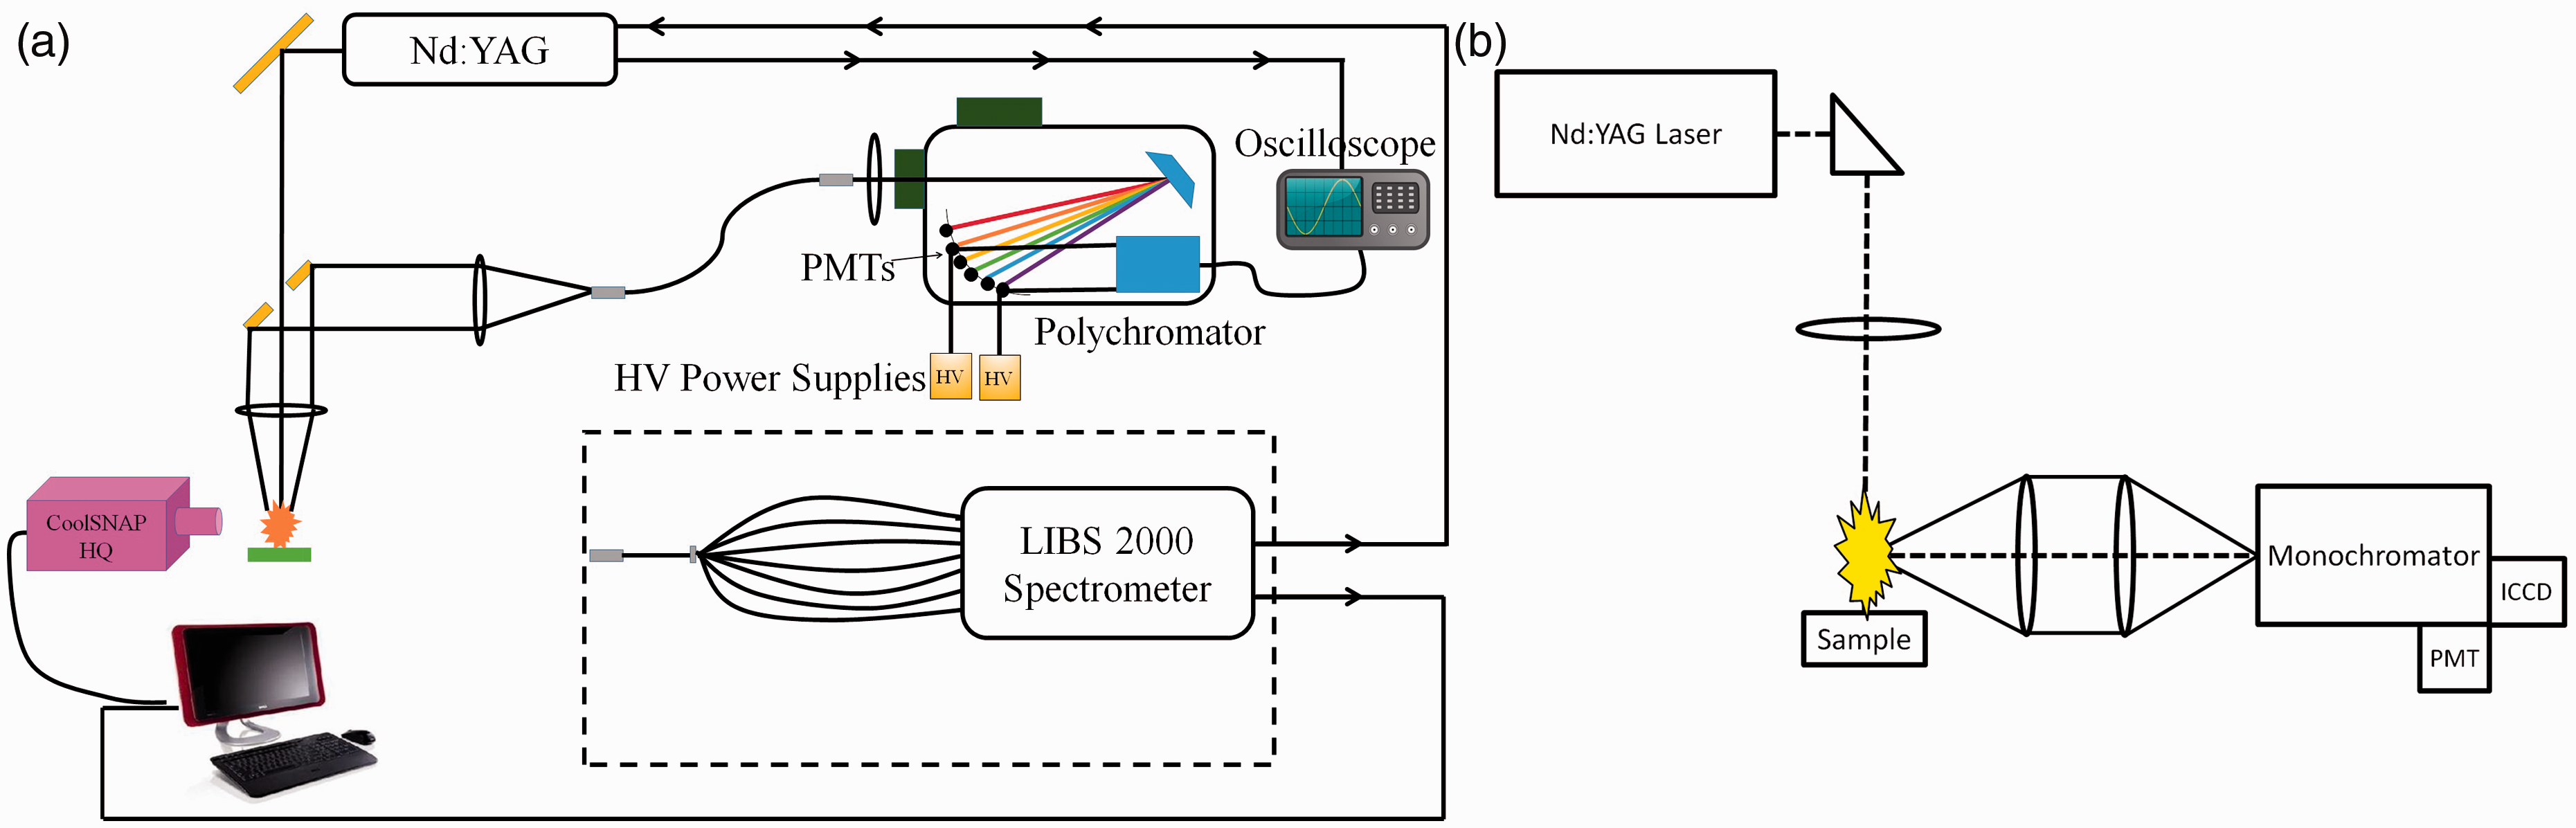
Two detection systems were used in set-up A. To perform time-resolved analysis, a Paschen–Runge polychromator fitted with 32 photomultiplier tubes was taken from a glow discharge surface analyzer (SA-2000, Leco Inc., USA). As pointed out before, this set-up had been assembled before to study laser–particle versus plasma–particle interactions with single particles trapped in an electro-dynamic balance. 28 Each PMT was located at the specific exit slit of the Rowland circle, capturing the plasma emission at the specified wavelength. For this study, the copper transition at 327.4 nm was available. The entrance slit width of the Rowland circle was 12.5 µm and the spectral resolution with the 2400 grooves/mm grating was 0.025–0.040 nm. An R306 PMT (Hamamatsu, Japan) was used with the output signal terminated in 50 Ω and displayed by a 500 MHz oscilloscope (54542-C, Hewlett-Packard, USA). The signal acquisition of the oscilloscope was synchronized with the Q-switch signal. The jitter reported by the manufacturer for an energy of 25 mJ was ∼5 ns. For every measurement, a suitable neutral density filter was inserted between the collecting lens and fiber to avoid PMT saturation.
For time-integrated measurements, a LIBS 2000 spectrometer, consisting of seven fiber optic spectrometer modules with a spectral resolution of 0.1 nm was used. The combined spectral range was 200–900 nm. A hepta-furcated fiber optic cable coupled to each spectrometer module was used to collect the plasma emission. The spectrometer had a fixed integration time of 2 ms and a variable delay time, which allowed the plasma emission in its entirety to be collected by the spectrometer. In the present work, this spectrometer was used to quickly check the time-integrated spectrum of the Al alloy samples and to optimize the collection efficiency of optical set-up.
By switching the fibers inserted in the fiber holder, either spectrometer could be selected without any further optical alignment.
Element compositions of the samples used in this work.
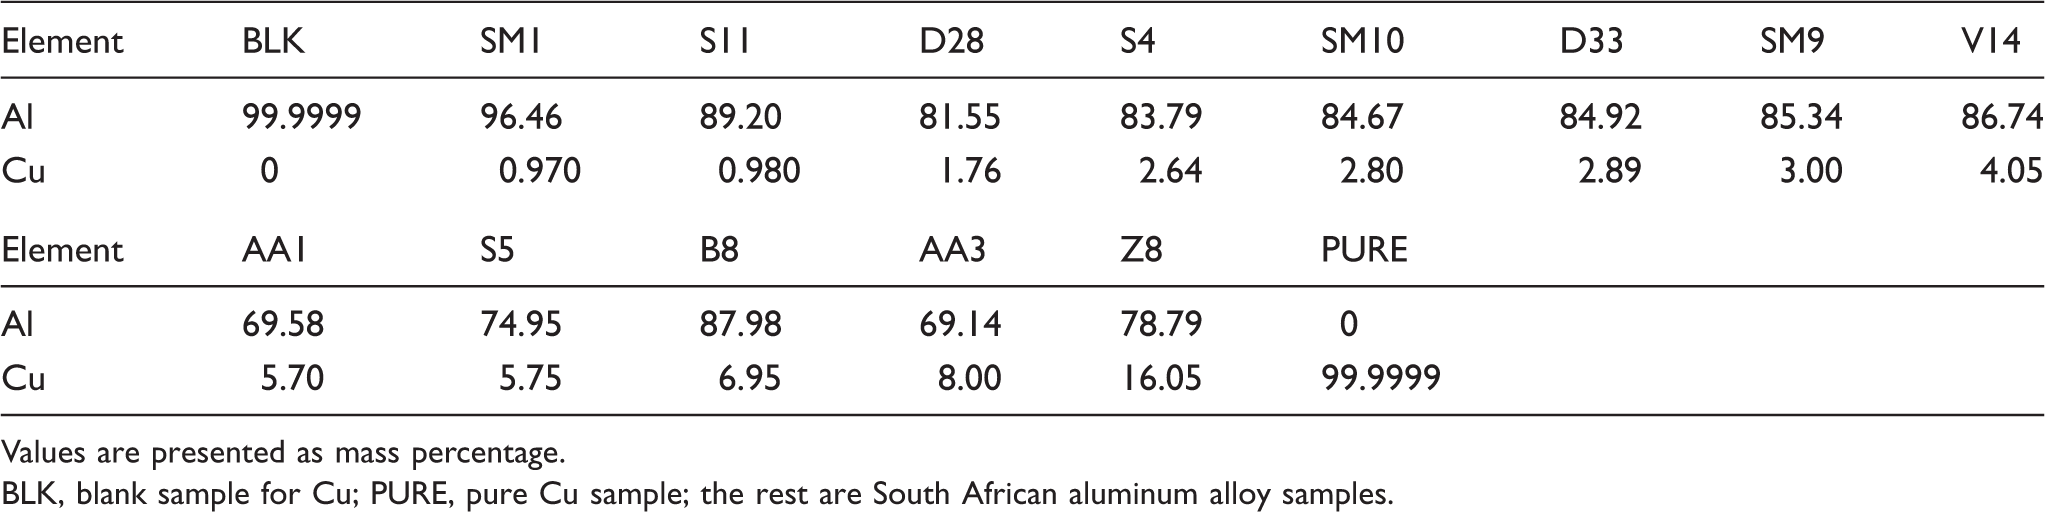
Values are presented as mass percentage.
BLK, blank sample for Cu; PURE, pure Cu sample; the rest are South African aluminum alloy samples.
As pointed out earlier, in our polychromator, only one of the doublet lines (327.4 nm) was available. In addition, the PMT was not wired for fast response. A second experimental system (shown in Fig. 1b and here referred to as “set-up B”) was then used. This system, which can be considered a conventional LIBS set-up, with the possibility of choosing either ICCD or PMT detection, had been assembled before and used to study the feasibility of detecting chlorine in concrete using the ion triplet emission in the 480 nm region and the CaCl molecular band around 590 nm. 29 A Q-switched Nd:YAG laser (Brilliant, Quantel, USA) operating at 1064 nm was used for ablation, the pulse width was 6 ns and the pulse energy was adjusted to 40 mJ/pulse. The laser was directed to the sample with a single glass prism and focused onto the sample surface using a biconvex quartz f/2 lens. Light emitted by the plasma was collimated and then focused on the entrance slit of the monochromator by two f/7 plano-convex quartz lenses. The monochromator (SpectraPro 500i, Acton, USA) is equipped with three gratings. For these experiments, the 2400 grooves/mm grating (0.6 nm/mm reciprocal linear dispersion) was used. The slit width was set to 100 µm, resulting in a spectral resolution of 0.06 nm. The monochromator has two exit planes; one is coupled to an ICCD (PIMAX2, Princeton Instruments, USA), and the other, with a slit, is coupled to a PMT (R955, Hamamatsu, Japan) wired for fast response. The experimental settings were software controlled (WinSpec32, Princeton Instruments, USA). The system timing (both the Q-Switch delay of the laser and the gating parameters of the ICCD) were controlled by a delay generator (DG535, Stanford Research, USA). By selecting proper spectral windows, the temporal behaviors of both the Cu 324.7 nm and Cu 327.4 nm lines were analyzed by acquiring time-resolved PMT signals and time-resolved spectra from the ICCD, respectively.
Results and Discussion
Typical Spectrum and Photomultiplier Tube Temporal Profiles
Figure 2a shows a typical spectrum and PMT response from a South African aluminum alloy sample (Sample AA1, Cu% = 5.7% in mass concentration) with set-up A. The two Cu resonant lines (Cu 324.7 nm and Cu 327.4 nm) are clearly affected by self-absorption, as indicated by their ratio being <2. From the PMT signal profile shown in Fig. 2b, a large spike in the first 300 ns is caused by the continuum plasma emission background and the Cu 327.4 nm emission clearly shows an exponential decay after 800 ns delay time. It is worth noting here that, for pulsed operation, the PMT, along with other characteristics such as fast response time and minimum parasitic capacitance, should be able to sustain peak anodic currents on the order of amperes.
30
Under linear operation, the PMT signal ratio with and without a suitable neutral density filter should remain constant as a function of time; therefore, this experimental check was performed before each measurement.
(a) Typical spectrum of an aluminum alloy sample (AA1, Cu% = 5.7% in mass concentration) obtained with the LIBS 2000 spectrometer. The two Cu resonant lines (inset, 324.7 nm/327.4 nm) and the two Al lines (394.4 nm/396.2 nm) are clearly observed. (b) Typical PMT time profile of Cu 327.4 nm channel of the polychromator obtained with the same aluminum alloy sample as in (a).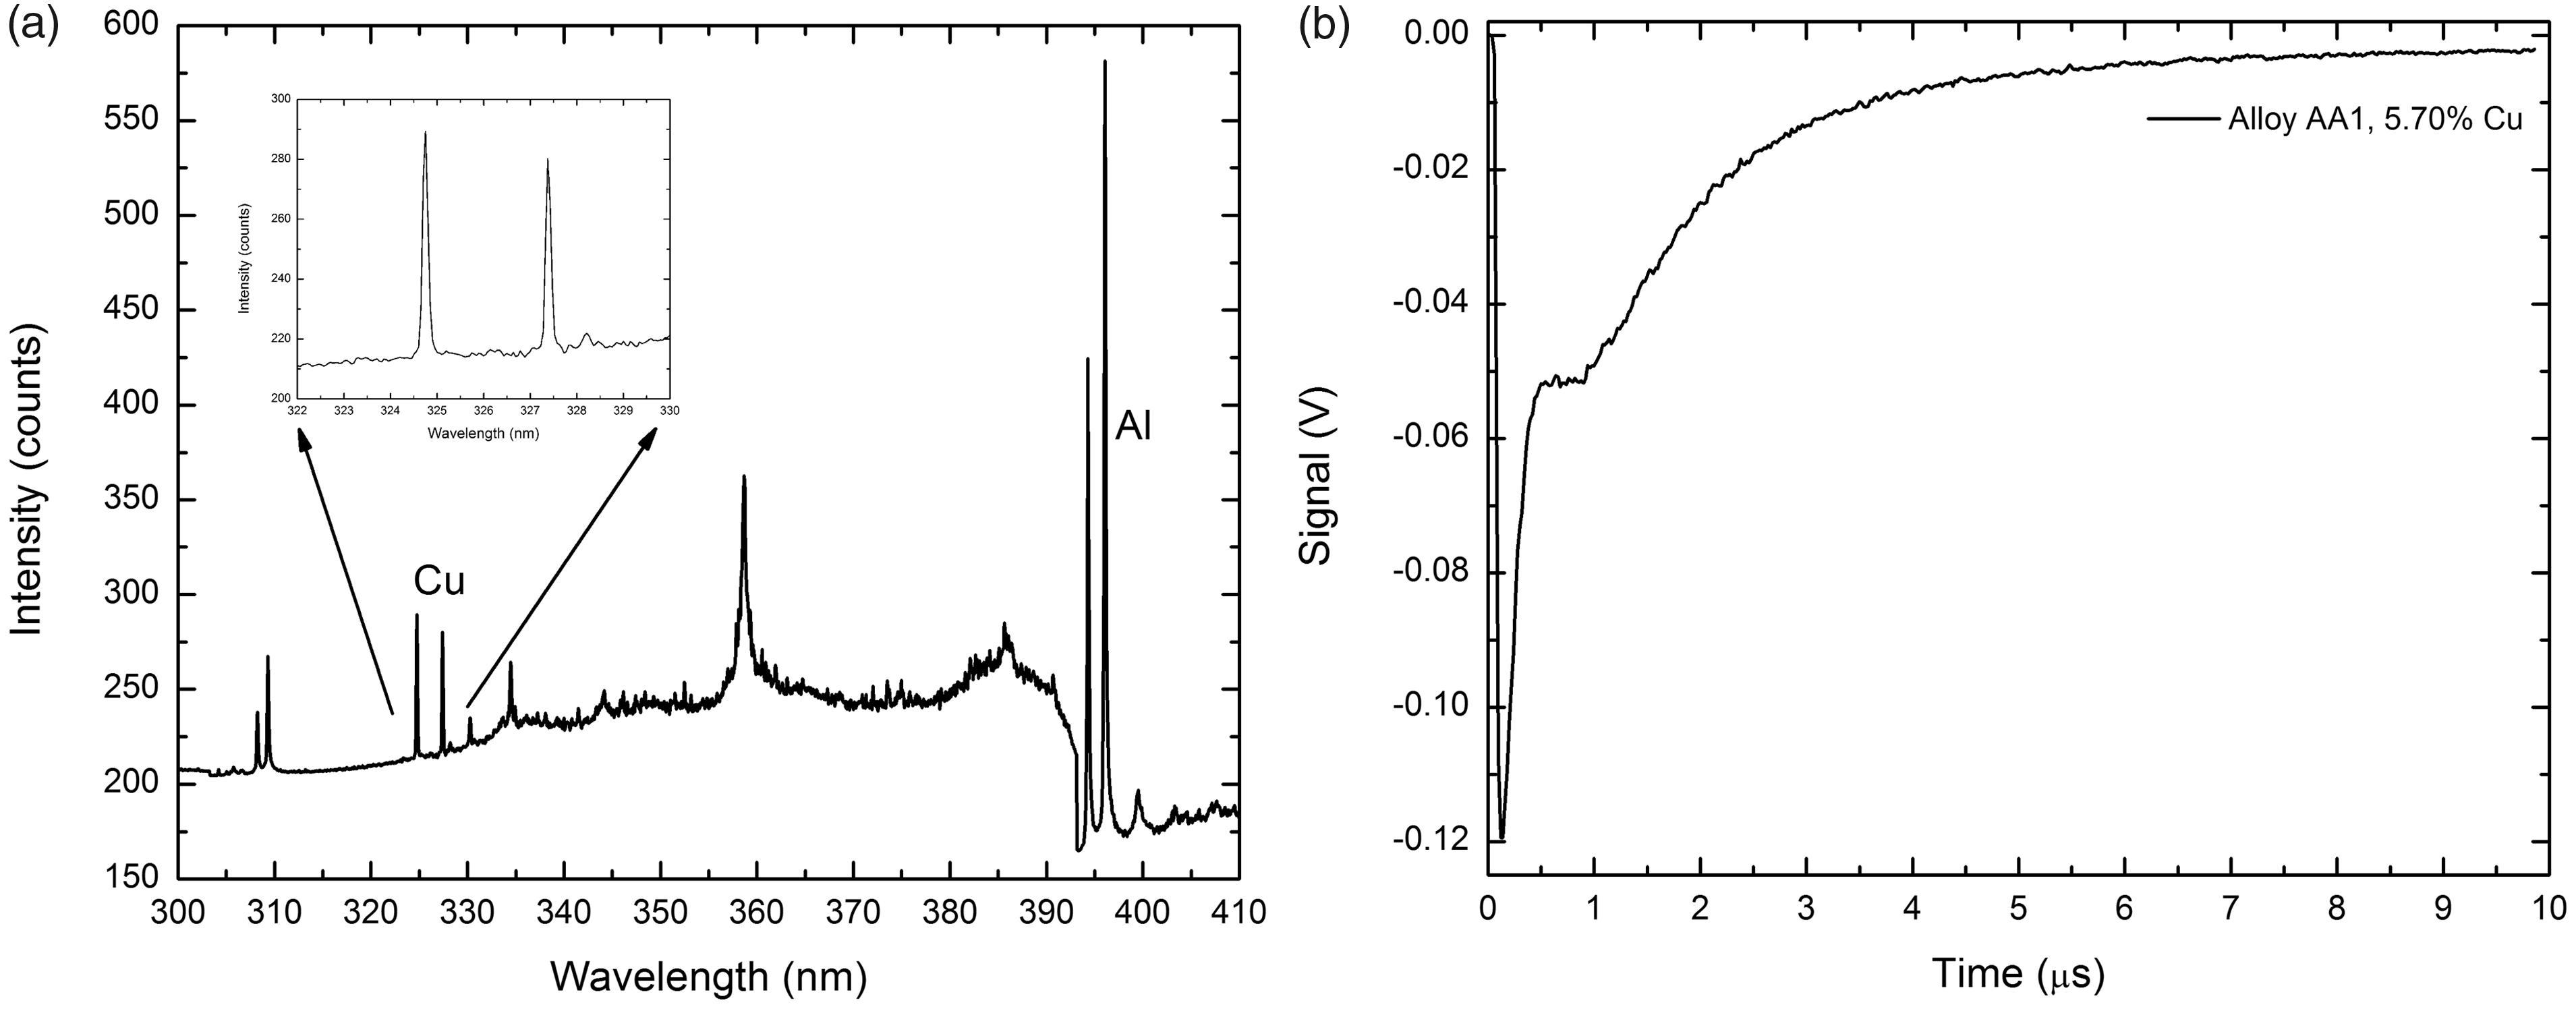
Temporal Self-Absorption Behavior of the Cu 327.4 nm Transition
As described in the Experimental section, our polychromator settings do not allow us to take the ratio of the two copper spectral lines. Nevertheless, complete time profiles of the 327.4 transition can be obtained at two different concentrations chosen from the linear and non-linear parts of the calibration curve. The temporal behavior of the signal ratio at the different concentrations will show whether self-absorption effects change during the persistence time of the plasma. This prediction is clearly borne out experimentally in the shape shown in Fig. 3, which shows the ratio between the PMT copper signals given by a sample containing 16.05% Cu and one containing 1.76% Cu. The data are calculated by subtracting the time-varying background signal (obtained with the pure Al sample) from the total time-varying signal (Cu and background) at each corresponding time. It is worth noting that without the presence of self-absorption, the ratio of these two samples would be approximately 9. The fact that this ratio is never reached suggests that the higher concentration sample is self-absorbed throughout the persistence of the plasma.
Net PMT signal ratio calculated from the Cu 327.4 nm channel of two aluminum alloy samples with Cu mass concentrations of 16.05% and 1.76%, respectively.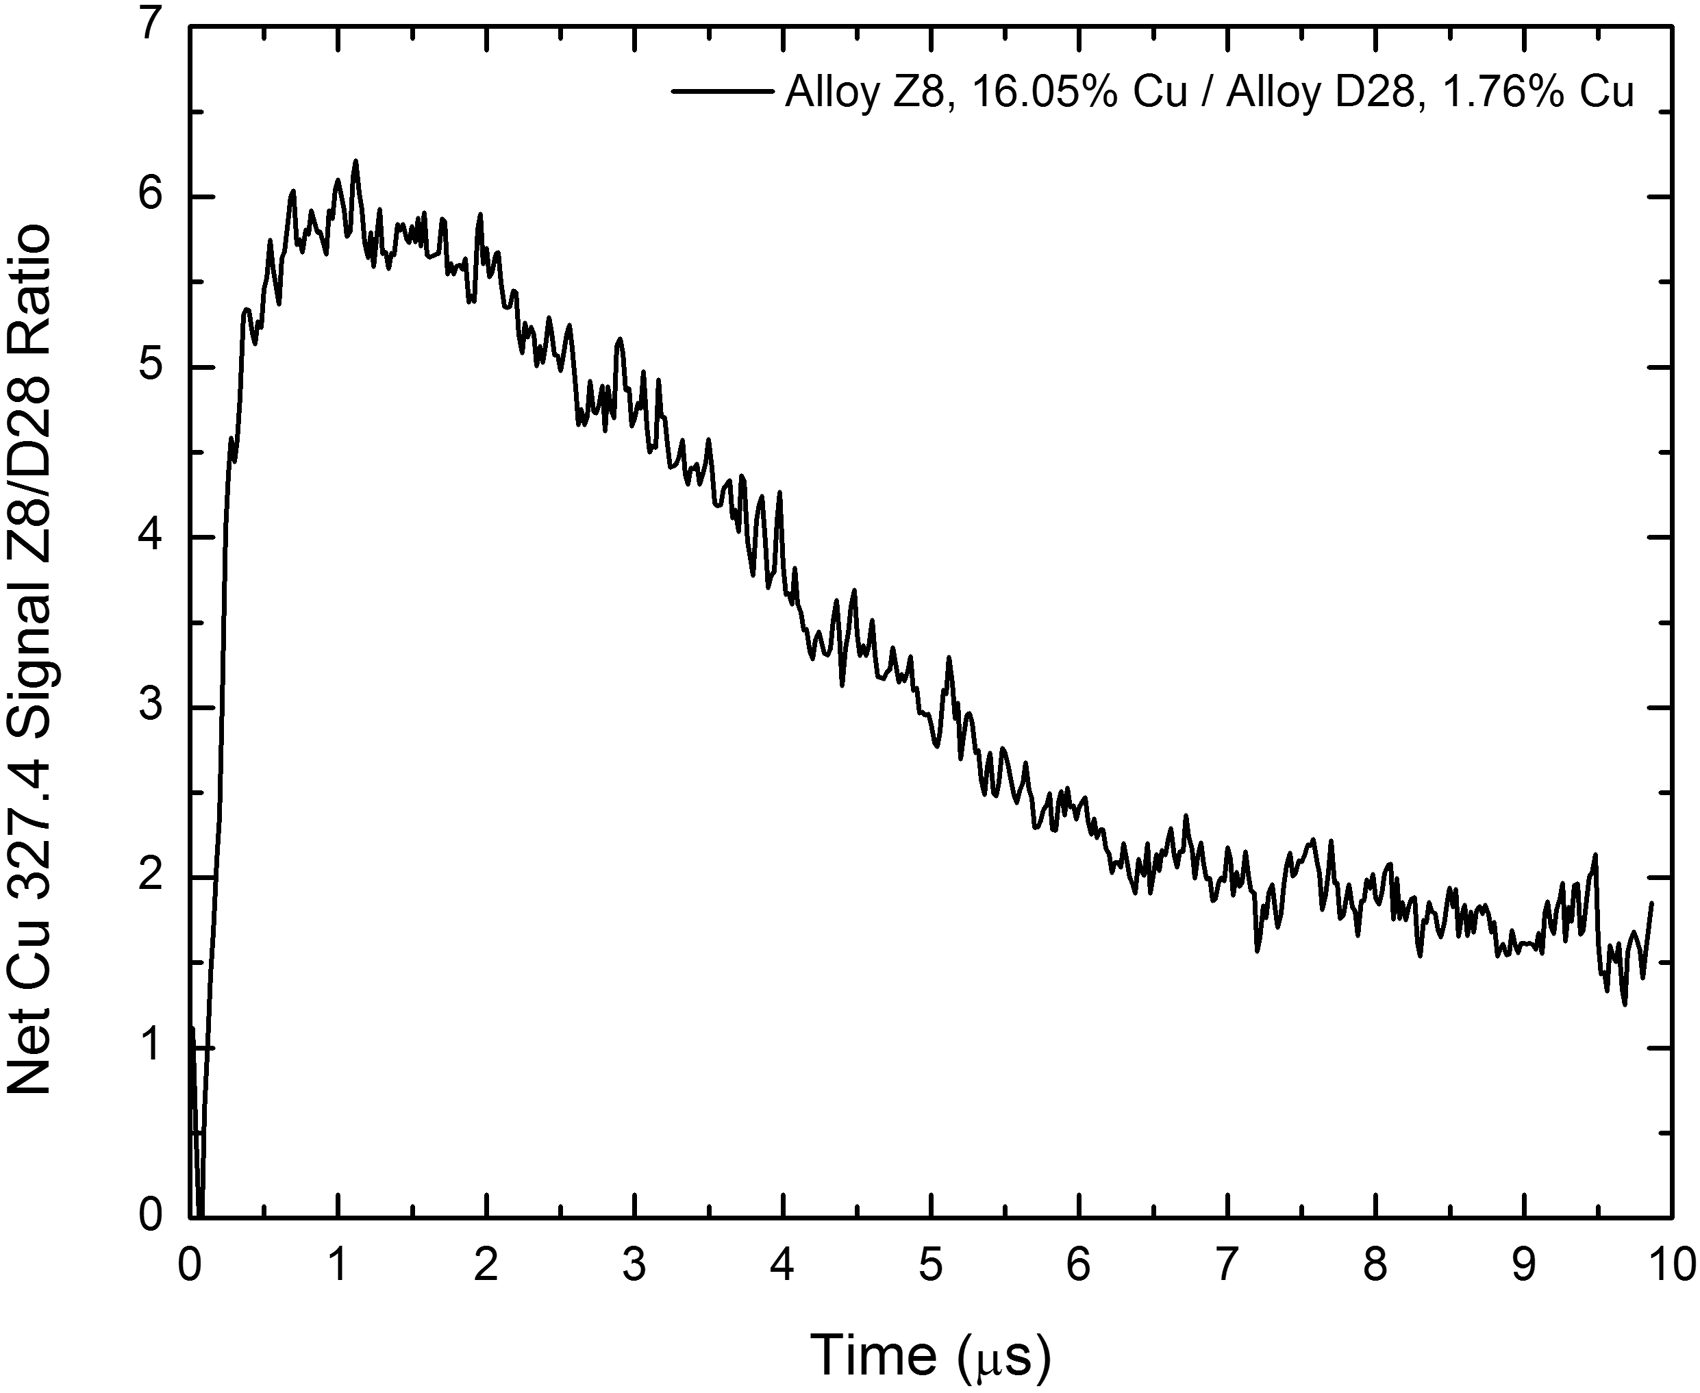
As expected, the effect of self-absorption should also be directly reflected in the shape of the calibration curve obtained in the concentration range of 1–16% Cu. Figure 4 shows the calibration curves obtained from the time integrated Cu 327.4 nm net PMT signal and the net signal calculated from the spectra obtained with the LIBS 2000 spectrometer. All intensities (both PMT and CCD) were normalized to the net intensities from the lowest Cu concentration sample (SM1, Cu% = 0.97%). The two calibration curves show similar slopes and both show the onset of self-absorption at concentrations exceeding 4–6% Cu. When examining the points corresponding to the ratio shown in Fig. 3 (16.05 and 1.76% Cu), the ratio of the two samples in the calibration curve is approximately 4. Again, the calibration curves were constructed with a full integration of the plasma lifetime. The ratio of 4 falls in the middle of the temporal ratio shown in Fig. 3, which is logical when considering a full temporal integration was used to construct the calibration curves.
Calibration curve of Cu 327.4 nm from both net PMT signals and net peak intensity of spectra. Photomultiplier tube integration extended from 0 to 10 μs, the entire plasma persistence (lifetime), noting that PMT signals after 10 μs are negligible. The linear fits exclude the highest concentration copper sample.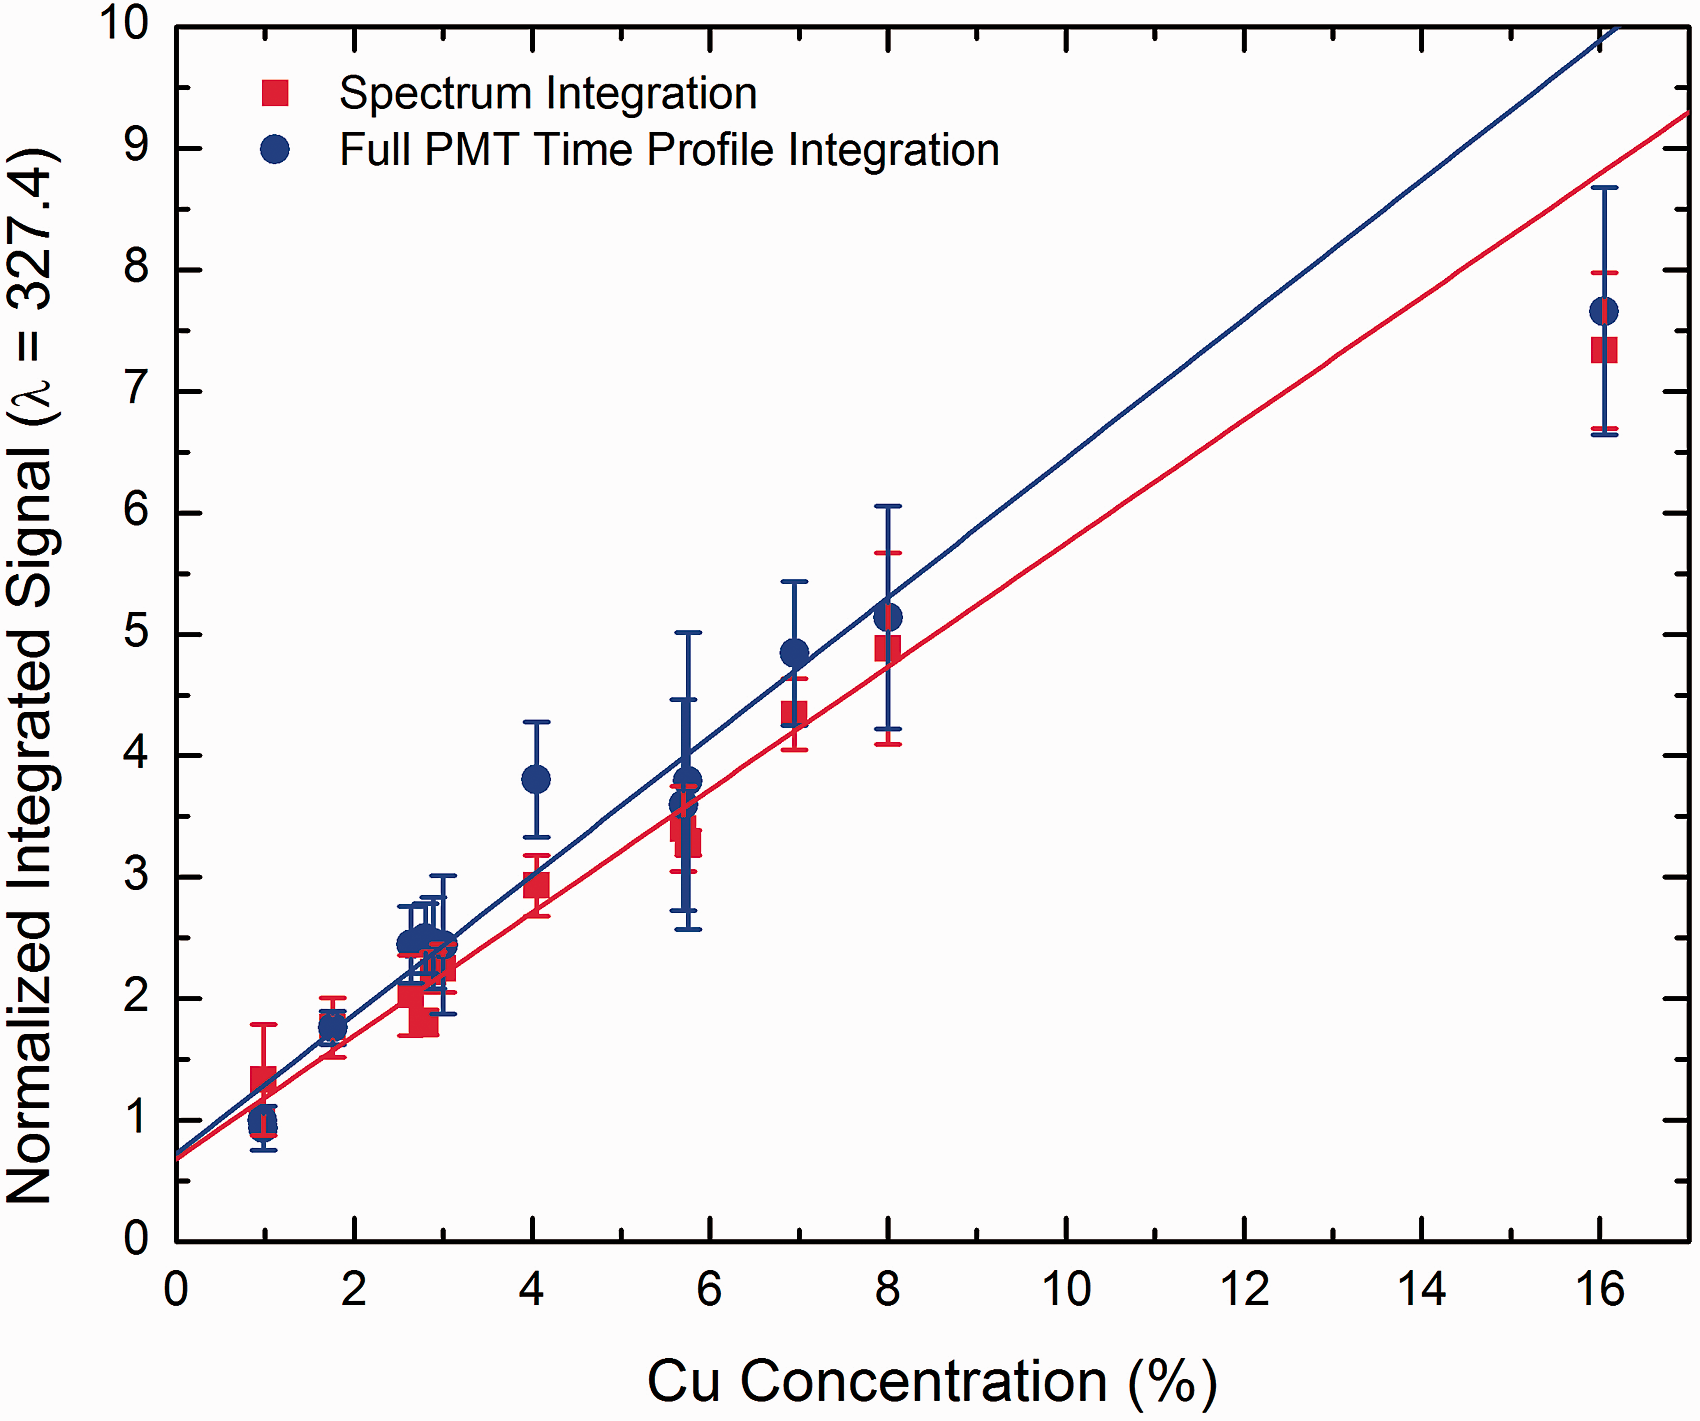
As proposed by Warren,
28
by selecting different time integration windows from the PMT temporal waveforms, calibration curves at different delay times can be obtained, as shown in Fig. 5a and 5b. The integration pattern is shown in Fig. 5a, with each integration window being 200 ns wide. Using the same normalization procedure used for the full integration case above, the resulting calibration curves in Fig. 5b display a change in slope as a function of position of the window along the emission profile. The calibration curves obtained at early times in the plasma evolution provide the steepest slope, confirming a self-absorption change and indicating the possibility of choosing an optimum acquisition delay and integration time that will result in the best sensitivity and linear dynamic range.
(a) Photomultiplier tube signal integration pattern. Each slice has a width of 200 ns. (b) Calibration curves obtained from different integration time windows. The calibration curve in dash lines was from full PMT integration. The data are normalized to the lowest copper concentration sample in order for the slope changes to be easily seen.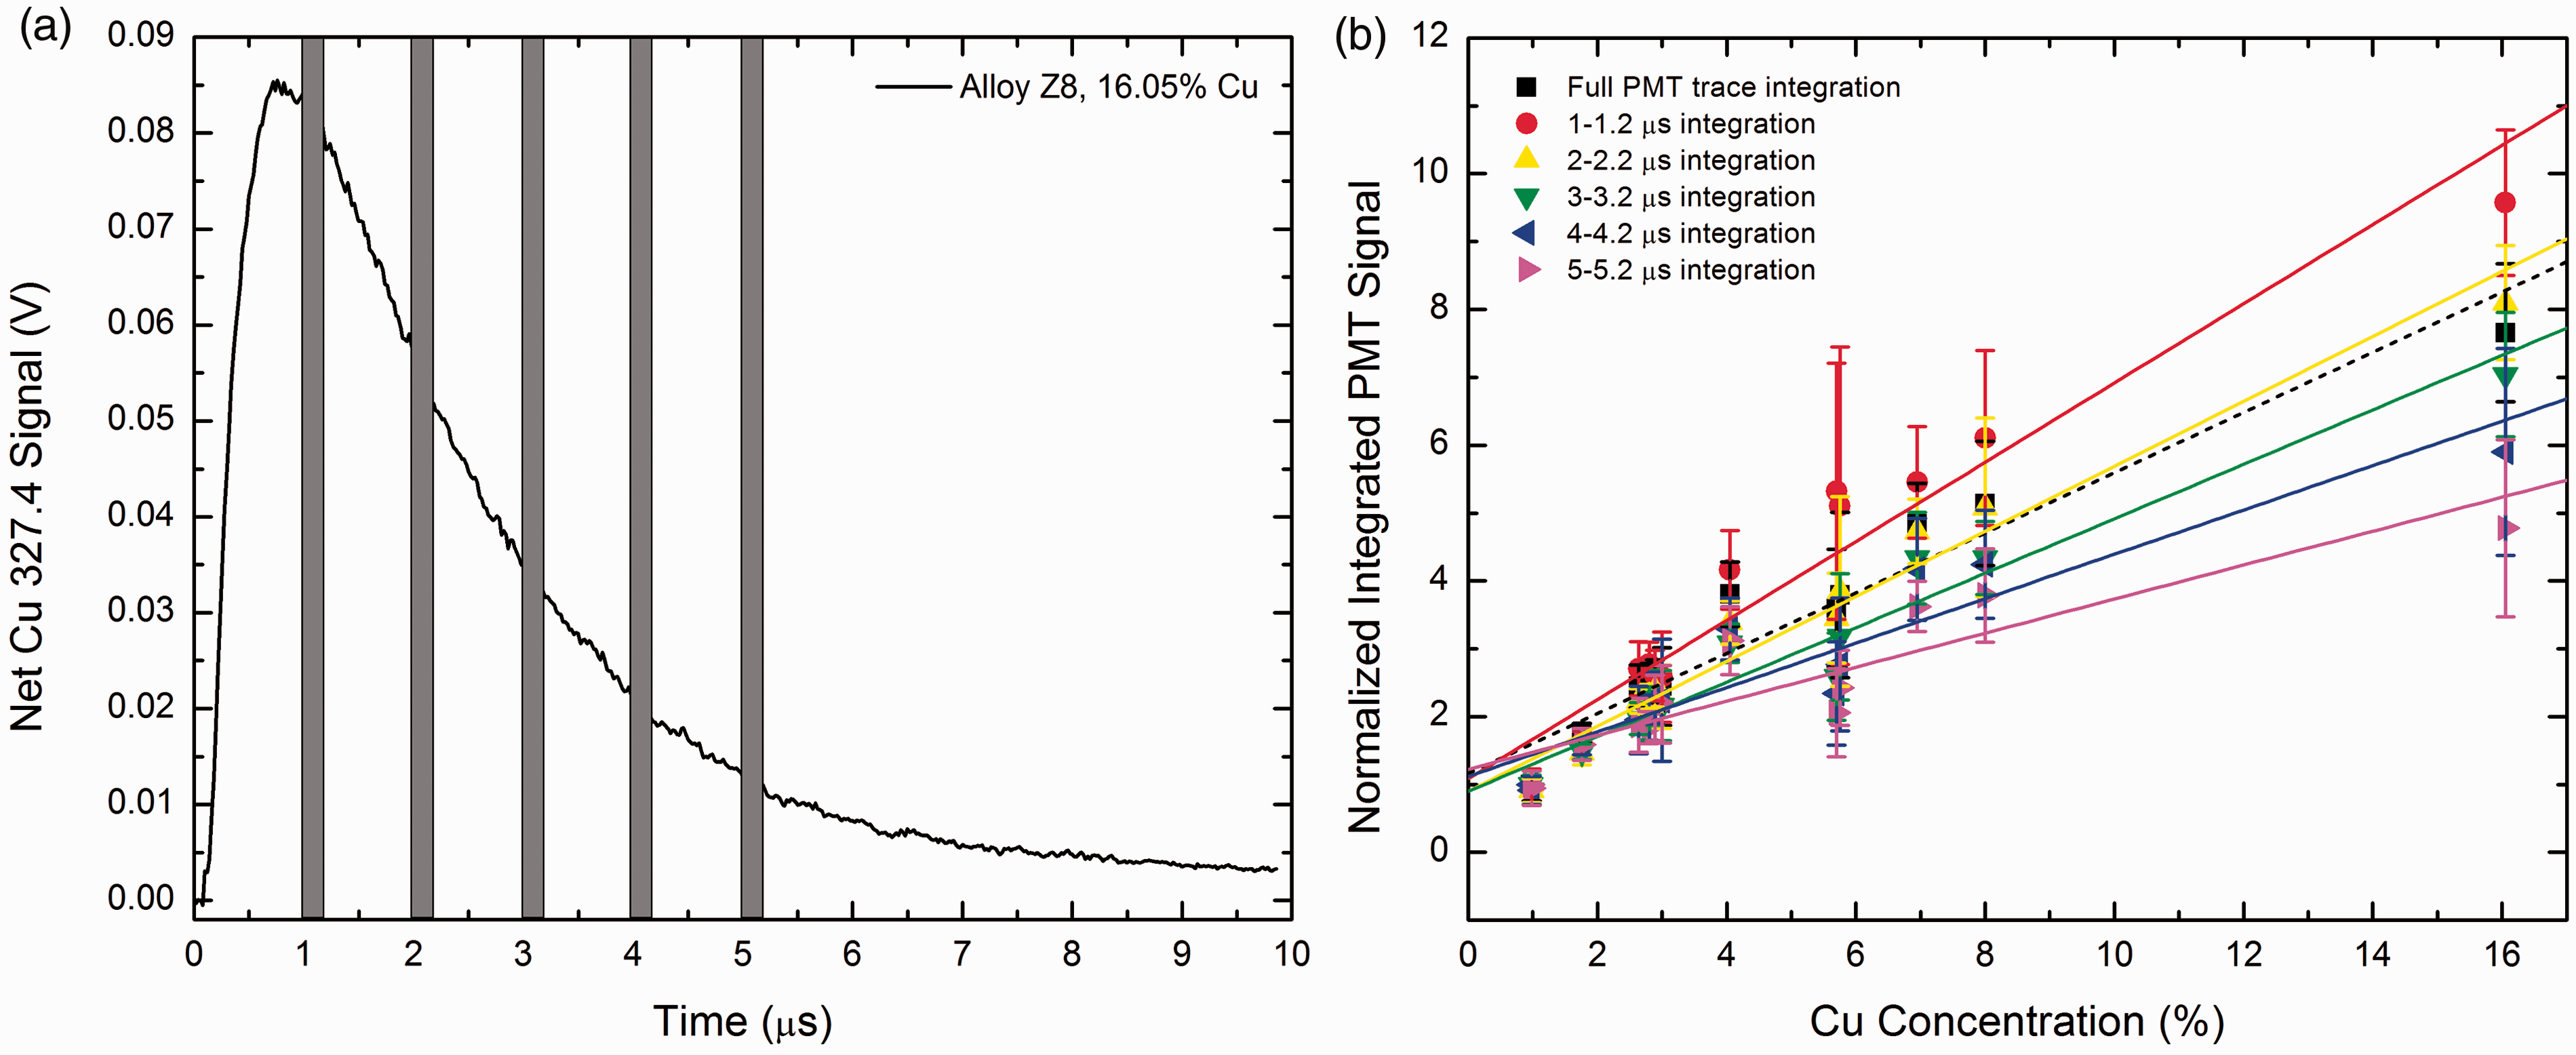
Temporal Self-Absorption Behavior of the Cu Resonance Doublet Ratio
As described in the introduction, the simplest way to assess a self-absorption effect is to measure the ratio of two spectral lines belonging to the same multiplet. This can be done with the PMT of our set-up B, with the additional advantage that the results can be compared with those obtained using variable delays and integration gates of the ICCD. Figure 6a shows the net background subtracted PMT signal shape of both Cu 324.7 nm and Cu 327.4 nm lines from the aluminum alloy AA3 with Cu mass concentration of 8%, and the point-to-point ratio of the net PMT signals along with delay time was plotted in Fig. 6b. As expected, self-absorption was observed throughout the plasma persistence, as shown in the ratio in Fig 6b, always <2. The appearance of the ratio going above 2 at early delay times is an artifact caused by subtraction of the large continuum emission signal, which is both larger than the copper emission and approximately the same size in the copper and blank samples. This leads to an approximate division of zero by zero at early delays (see net temporal waveforms in Fig. 6a), so the first several hundred nanoseconds of the ratio when the continuum is strong should be disregarded. More importantly, the PMT signal ratio of the two lines decreases steadily over time, indicating a more severe self-absorption as the plasma cools down at later delay times. Although this seems a plausible explanation, additional, more refined, experiments, such as time-resolved measurement of temperature and line profiles, will be necessary in order to identify the cause. These measurements were considered to be out of the scope of the present paper.
(a) Net PMT temporal signal profiles of Cu 324.7 nm and Cu 327.4 nm lines from South African aluminum alloy sample AA3 with Cu mass concentration of 8%. (b) Net PMT temporal signal profile ratio of Cu 324.7 nm and Cu 327.4 nm from sample AA3.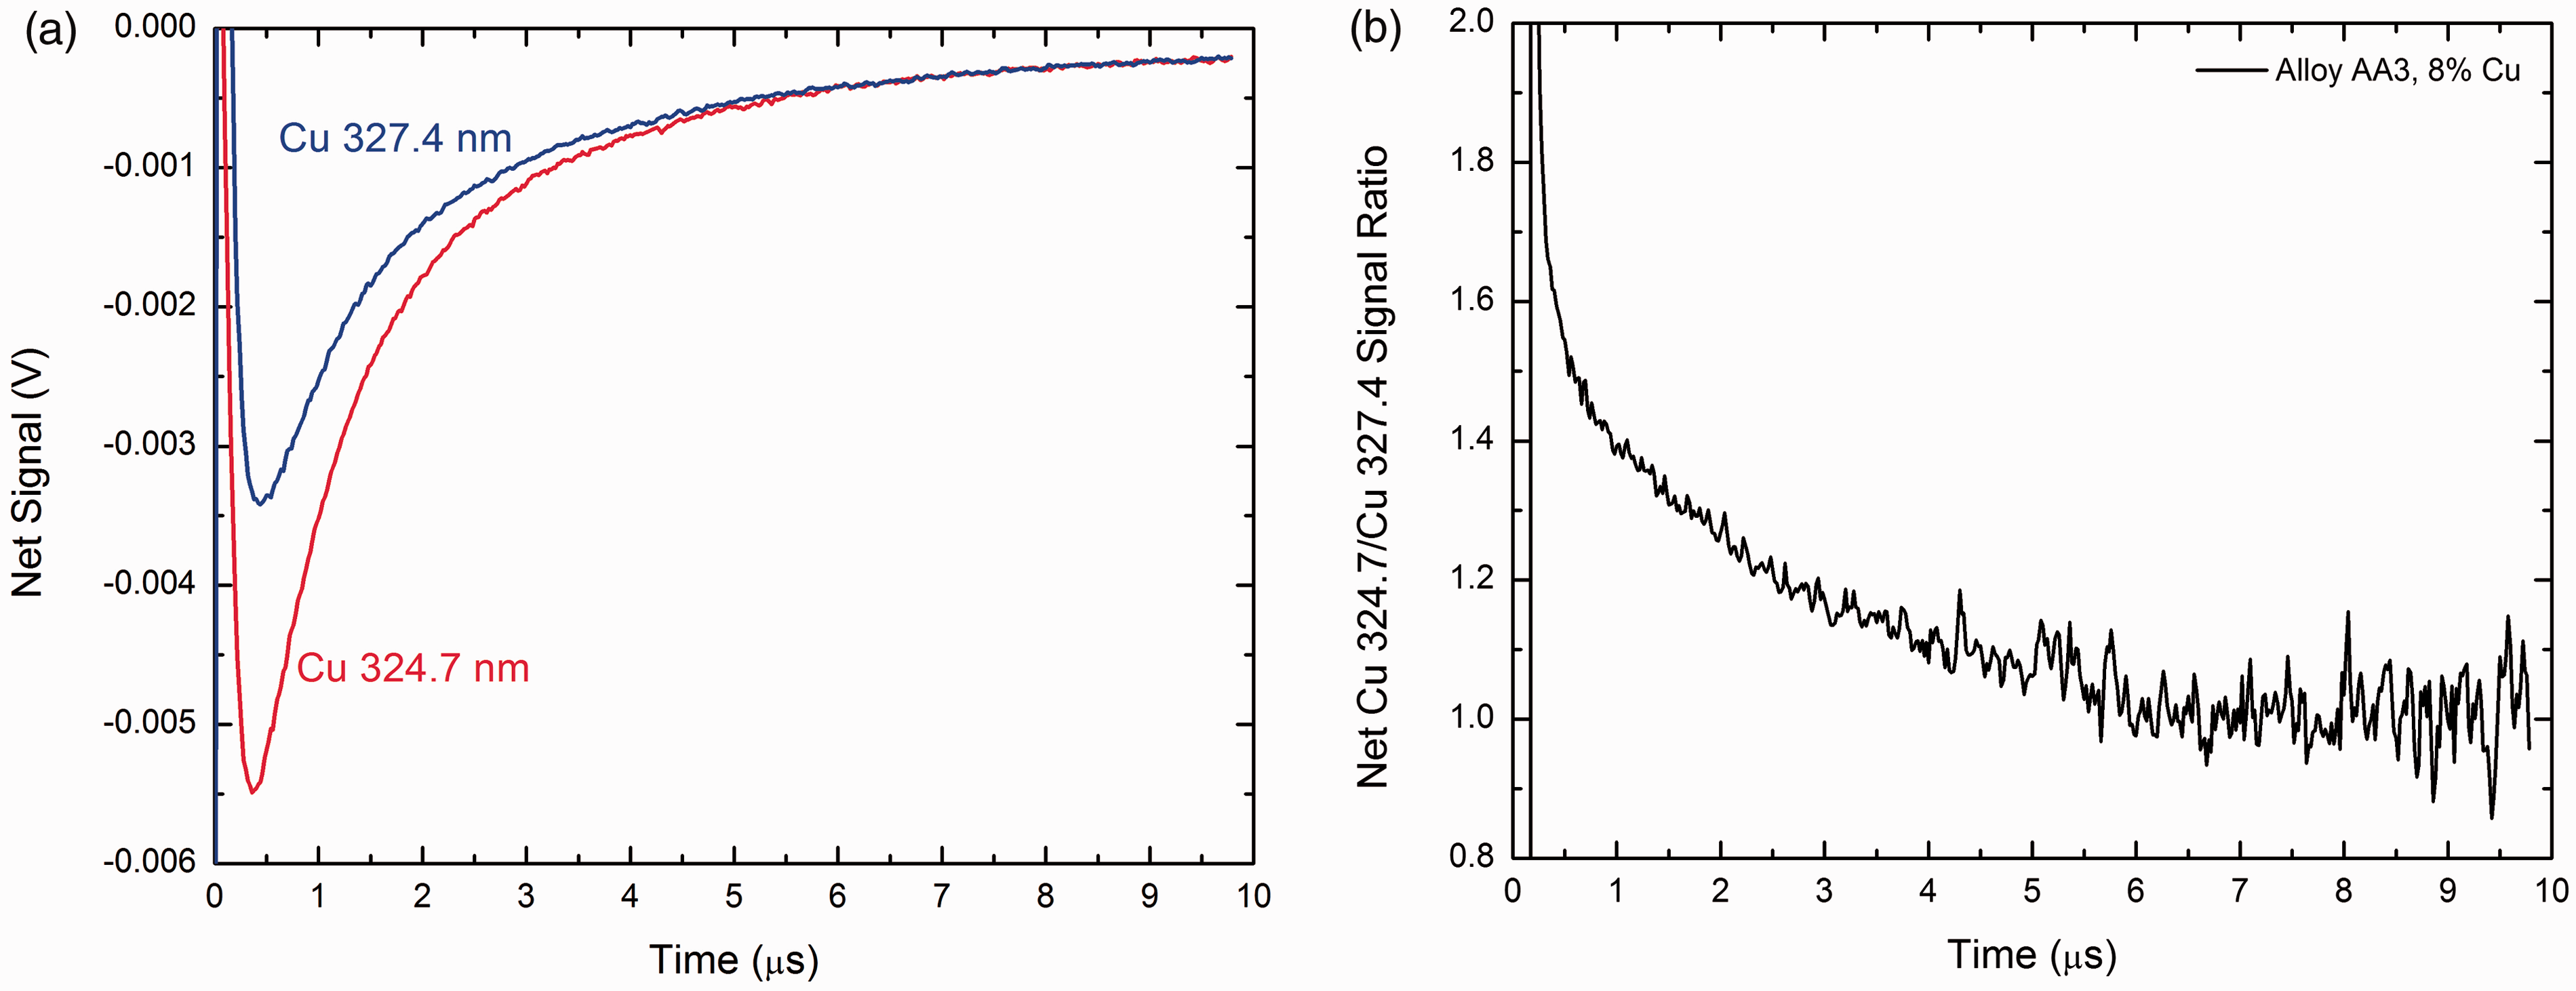
To verify the experimental results obtained with the PMT, time-resolved spectra of Cu 324.7 nm and Cu 327.4 nm lines were acquired using the ICCD. The integrated net peak intensity of the two lines was calculated and their ratios plotted in Fig. 7 as a function of time. The overall monotonous decreasing trend of the ratio is consistent with the trend observed with the PMT, which further demonstrates the increasing self-absorption effect at longer delay times.
Temporal signal profile ratio of Cu 324.7 nm and Cu 327.4 nm integrated net peak intensity with ICCD detection.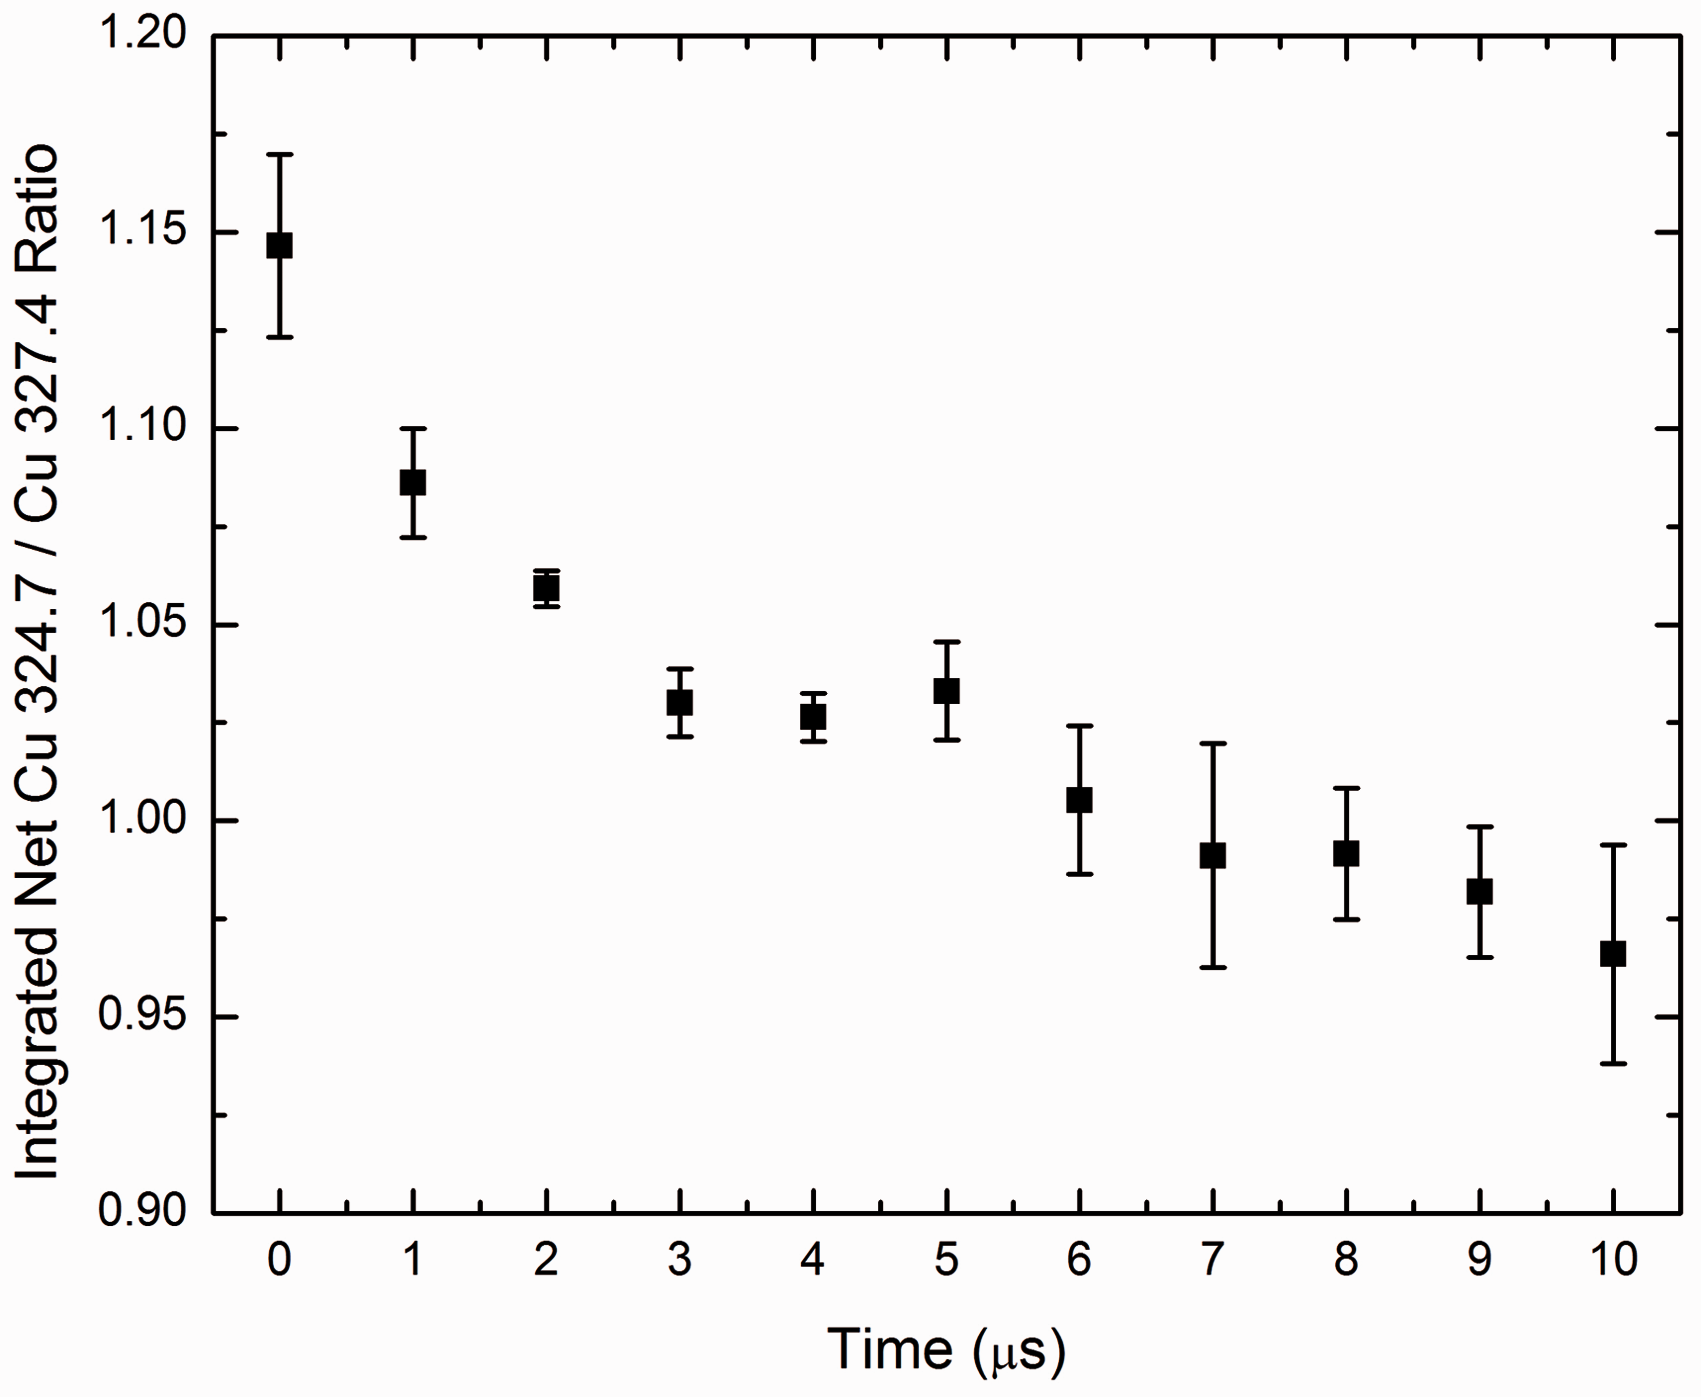
Conclusion
This work has provided further experimental evidence of the use of a PMT in LIBS research, with the specific aim of detecting changes in self-absorption occurring during the entire plasma evolution and improving the linear dynamic range of the calibration curves by an optimum choice of the measuring gate along the temporal persistence profile of the emission signal.
Two cases have been considered, and experimentally demonstrated, using the copper resonance doublet at 324.7 and 327.4 nm. In the first case, the time-resolved ratio of the temporal profiles of the signals observed at a single transition (327.4) was obtained using two Al alloy samples containing different Cu concentrations. In the second case, a single Al-alloy sample with a given Cu concentration was used to obtain the time-resolved ratio of the temporal profiles of the signals obtained at both transitions.
The above measurements were performed at different times using different instrumental set-ups available in our laboratory. In the first case a Paschen–Runge polychromator with a PMT located at Cu 327.4 nm and in the second case with a conventional grating monochromator, set first at one transition and then moved to the second transition. The PMT results confirmed the prediction that self-absorption is changing (in our case increasing) during the temporal evolution of the plasma. The observed trend was also confirmed by the ICCD data obtained by sequentially delaying the opening of the measuring gate until disappearance of the signal.
Some final considerations seem in order. First, as stated in the introduction, neither of our measurements allowed the reporting of single shot data. In this sense, the unique advantage of using a PMT to provide time-resolved statistics for each laser-induced plasma, within the entire plasma persistence, was not achieved. The only way that this could be experimentally feasible is to modify the Paschen–Runge polychromator to simultaneously observe the two transitions belonging to the same multiplet that are separated at suitable positions in the Rowland circle or by setting up two monochromators each equipped with identical PMTs and arranging the optics to observe the same plasma region. Second, the measurements were not space-resolved; therefore, the observed effects have to be interpreted as an average effect over the plasma volume seen by the electro-optical detection system.
Overall, if we restrict the measurements described to those obtained using set-up B, namely a conventional LIBS set-up where the monochromator is equipped with both ICCD and PMT, one can see that the measurements are simple to perform and can be of analytical relevance for a quick diagnostic of the changing behavior of self-absorption in a laser-induced plasma experiment.
Footnotes
Acknowledgments
Yangting Fu thanks the State Scholarship Fund of China Scholarship Council for a fellowship (No. 201506210343) allowing him to study at the University of Florida for one year. The experimental help of Tobias Guenther (BAM, Berlin, Germany) in some of the measurements reported in this paper is also gratefully acknowledged.
Conflict of Interest
The authors report there are no conflicts of interest.
Funding
This research received no specific grant from any funding agency in the public, commercial, or not-for-profit sectors.