
Abstract
Optical scattering corrections are invoked to computationally distinguish between scattering and absorption contributions to recorded data in infrared (IR) microscopy, with a goal to obtain an absorption spectrum that is relatively free of the effects of sample morphology. Here, we present a modification of the extended multiplicative signal correction (EMSC) approach that allows for spectral recovery from fibers and cylindrical domains in heterogeneous samples. The developed theoretical approach is based on exact Mie theory for infinite cylinders. Although rigorous Mie theory implies utilization of comprehensive and time-consuming calculations, we propose to change the workflow of the original EMSC algorithm to minimize extensive calculations for each recorded spectrum at each iteration step. This makes the modified EMSC approach practical for routine use. First, we tested our approach using synthetic data derived from a rigorous model of scattering from cylinders in an IR microscope. Second, we applied the approach to Fourier transform IR (FT-IR) microspectroscopy data recorded from filamentous fungal and cellulose samples with pronounced fiber-like shapes. While the corrected spectra show greatly reduced baseline offsets and consistency, strongly absorbing regions of the spectrum require further refinement. The modified EMSC algorithm broadly mitigates the effects of scattering, offering a practical approach to more consistent and accurate spectra from cylindrical objects or heterogeneous samples with cylindrical domains.
Introduction
Fourier transform infrared (FT-IR) microscopy and spectroscopic imaging 1 are commonly used to understand molecular composition in a variety of samples. Recent applications include examples from biology,2–6 materials science,7–9 forensics,10,11 agriculture,12,13 and medicine.14–25 Although FT-IR microspectroscopy includes the exceptional molecular selectivity of fundamental absorption modes, high spectral accuracy from interferometric measurements, and robust signal-to-noise (S/N) ratios, spectral distortions 26 arise from scattering at interfaces 27 that can complicate the analysis of recorded data. For analytical measurements of samples whose sizes are comparable to the wavelength of impinging electromagnetic radiation, in practice, scattering from the object dominates the total recorded attenuation.
There is now an emerging understanding of the physics underlying spectral distortions associated with scattering of IR radiation from samples with spherical,28,29 cylindrical, 30 thin film,31–37 or more complex geometry.38–40 The forward problem of predicting IR spectra, given the shape and properties of the sample, is now generally well described for a variety of cases. Various theoretical solutions of the inverse problem, namely recovering the absorption of the sample as well as its morphologic properties, for the case of single spheres41–43 and cylinders 30 as well as for thin film samples44,45 have been proposed. A modification of the experimental setup for minimization of recorded scattering has been also developed. 46 Theoretical approaches require either the knowledge of the particle’s size, 30 or multiple 41 or even quite accurate42,43 measurements of IR spectrum of the intact object. Though, in most cases, a single measurement of the sample with a number of spherical or cylindrical inclusions like overlapping or quite densely packaged cells 28 or fibers 47 without clear knowledge of the object size will likely occur. Therefore, for most cases, the inverse problem remains a challenging task.
A post-acquisition computational approach to address this need has been proposed. Termed extended multiplicative signal correction (EMSC), 48 this technique has been developed extensively during the last decade49–54 for samples with spherical inclusions. It was shown that so-called dispersion artefact, 28 or effect of scattering from interfaces in which profile of the real part of the refractive index affects the recorded absorbance, can be mitigated with this algorithm. Extended multiplicative signal correction-corrected data with minimized contribution of undesirable scattering make it possible to adequately analyze IR spectroscopic data acquired from biological cells and tissues.23,55 The applicability of EMSC thus far, however, is limited to objects with spherical shape. While the approach is effective, it is also limiting since the spherical symmetry may obscure effects that arise in other geometries. For example, many objects commonly measured by IR microscopy are cylindrical in shape (e.g., fibers, single crystals, and fungi) but an ideal cylinder as a scattering shape for EMSC has not been reported. Although the forward and inverse problems for a single intact fiber with known size are well-known, 30 a general formulation of the EMSC algorithm for cylinders and, particularly, its application to large data sets without a priori knowledge of cylinder size or refractive index is needed. Here we seek to fulfill this need by first theoretically extending the EMSC model to cylindrical geometries. Second, and in conjunction, we seek to formulate a computational strategy to work with large imaging data sets. Finally, we evaluate the efficacy of the developed approach for different samples.
Theory
Extended Multiplicative Signal Correction
We closely follow the formalism for EMSC thoroughly discussed in the references.48,56–58 According to this algorithm, the recorded signal

The recorded spectrum can be corrected by finding values of c, m and h using a least squares linear regression model. The Mie-type scattering contribution is contained in loadings pi which are calculated from decomposition of simulated scattering efficiency
Scattering from Cylindrical Objects
In most cases, the longitudinal dimension (i.e., length) of natural or synthetic fibers is much larger than the transverse (diameter) dimension.60,61 Further, the image pixel size of a typical IR microspectroscopy setup is usually comparable to the diameter of a fiber. Consequently, the ends of the fiber have little influence on any pixel towards the center and fibers can be generally approximated with an infinite cylinder for the development of a scattering model. In the case of unpolarized illumination, the scattering efficiency of an infinite cylinder embedded in a host medium with refractive index nh can be found as:


Utilization of Eqs. 2–4 may be computationally expensive. Thus, GPU-enabled calculations
51
or implementation of simplified analytical solutions like the original
50
or modified
54
van de Hulst approximation,
59
which have been successfully applied for spherical samples, are alternative ways to estimate
Numerical Results
Scattering from Spheres and Cylinders
We start with a comparative analysis of scattering from single spherical and cylindrical particles. Although it is intuitive that the scattering patterns are different for these two shapes, it is worthwhile to discuss briefly the main features of each and the major differences between these two cases. The main purpose of this comparative analysis is to show the necessity of introduction of modified Resonant Mie Scattering (RMieS)/EMSC approach for the case of fibers. As a reference material, we chose polymethyl methacrylate (PMMA) whose experimentally measured spectra agree well with simulated ones.40,41,43 Real and imaginary parts of the refractive index of PMMA are shown in Fig. 1a, while a schematic representation of illumination and scattering from the sphere and cylinder is shown in Fig. 1b and 1c.
(a) Real, n, and imaginary, k, parts of the refractive index of bulk PMMA, and schematic representation of illumination and scattering from sphere (b) and cylinder (c) with radius r. (d–f) Scattering efficiencies 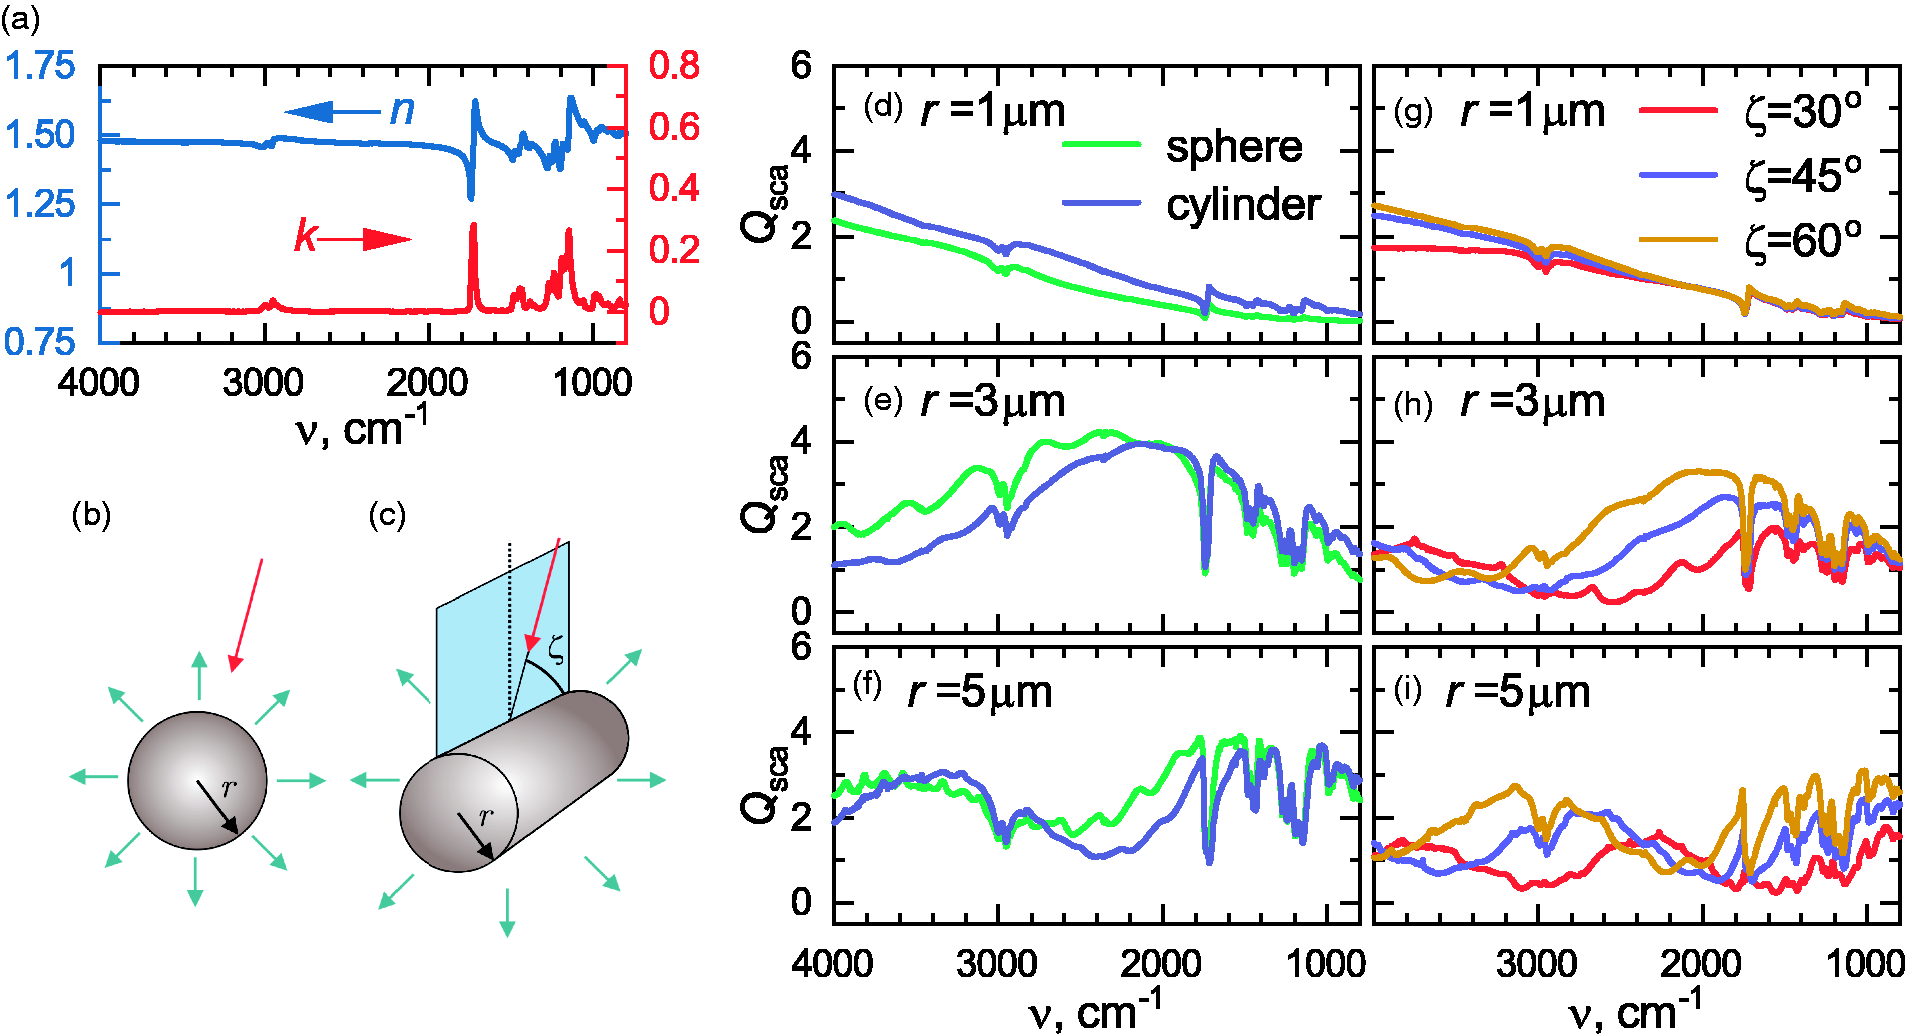
Figure 1 explicitly shows that PMMA spheres and cylinders with the same radius r scatter electromagnetic waves in a different manner. For example, the scattering efficiency of a cylinder may be smaller, greater, or comparable with a sphere in
Unlike the sphere, the fiber is an object with rotational symmetry, thus
Optimization of Extended Multiplicative Signal Correction Algorithm for Mie Scatterers
Although there are various optimizations and improvements of the EMSC algorithm for Mie scattering in terms of speed
51
and stability,
54
there is at least one possible improvement that has not been addressed so far. The original RMieS/EMSC algorithm
50
generates around Flow chart illustrating the iterative procedure of the EMSC algorithm. Red boxes indicate the modifications to the original RMieS/EMSC procedure
50
proposed in this work.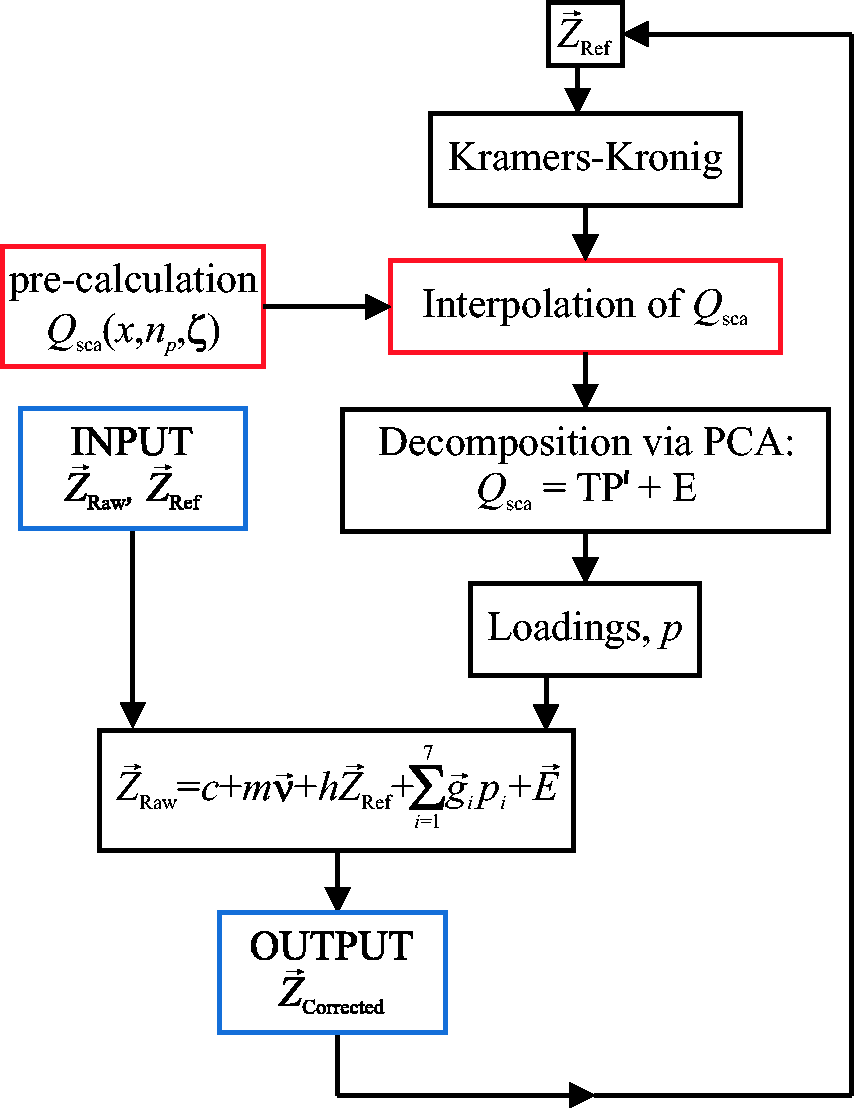
To demonstrate the utility of this concept, we have simulated the comprehensive
Figure 3a shows the calculated (a) Accurate calculation with fine mesh and (b) spline interpolation from coarse data for scattering efficiency 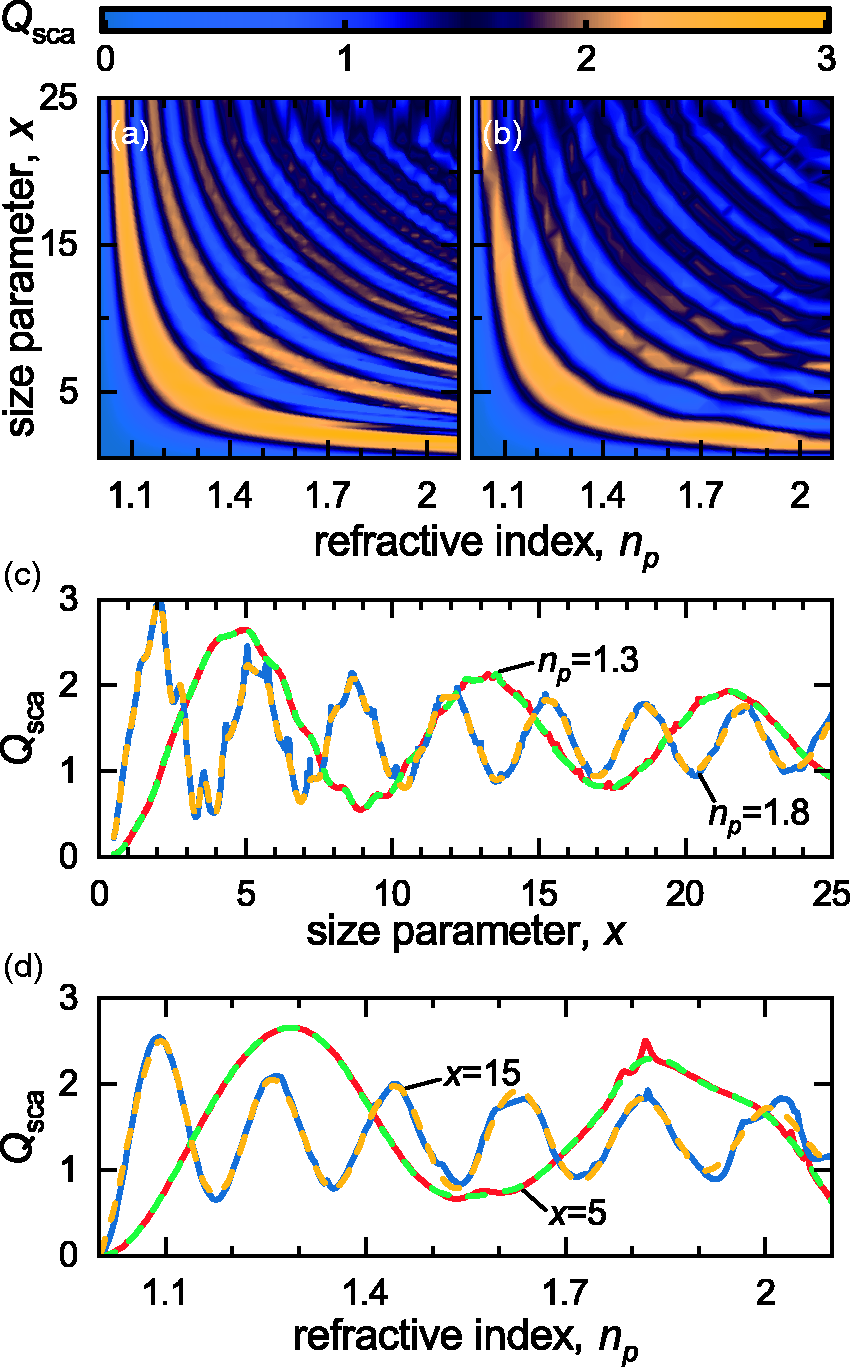
Verification of Extended Multiplicative Signal Correction on Simulated Data
Finally, to verify the proposed modification of the EMSC procedure and to demonstrate its validity, we apply the developed algorithm to synthetic data. Figure 4a shows absorbance of a PMMA cylinder with r = 5 µm calculated with the rigorous forward model from Davis et al.
30
The condenser and detection optics are composed of Schwarzschild objectives with numerical apertures (a) Absorbance of PMMA cylinder with r = 5µm calculated with forward model from Davis et al.
30
(b) Ideal scattering-free absorbance calculated with Eq. 5 and used as 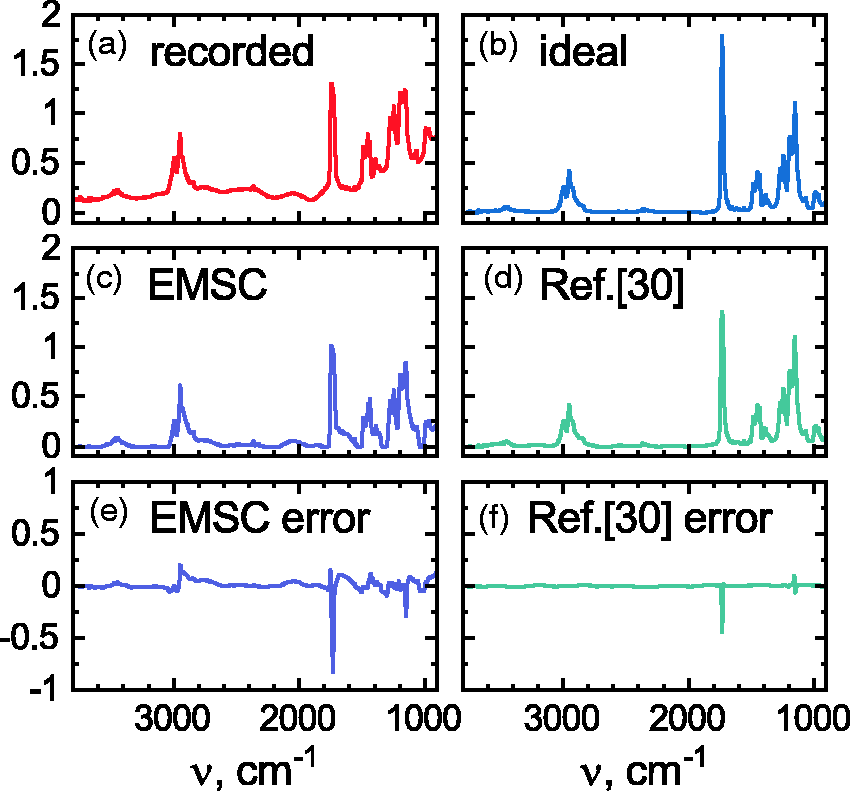
Scattering-free absorbance calculated in accordance with the Beer’s law30,41 has been chosen as the reference spectrum

It can be seen from comparing Fig. 4a and 4b that the recorded signal is significantly different from the ideal one given by Eq. 5, which is explained by the effects of scattering. To mitigate scattering, we implemented the EMSC procedure in the following manner: we limited the database with
Experimental Methods
Samples
Two types of fibrous samples, fungi and cellulose fibers, were prepared to test the modified EMSC approach proposed in this study. For fungal samples, a filamentous fungal strain Fusarium spp. with pronounced cylinder-like shapes62,63 were grown in petri dishes on potato dextrose agar (PDA) media incubated at 28 ℃ and 80% relative humidity. Fungal filaments (hyphae) that grew above the PDA surface were carefully picked and deposited on the top of low-E glass slides (Kevley Technologies) in such a way that the curved surfaces of these filaments lay horizontally on the low-E slides, shown in Fig. 5a. Similarly, cellulose samples were prepared by laying fibers from cellulose pad strips (MilliporeSigma, CFSP 173000) on a 4 mm thick rectangular (a) Optical reflection microscopy image of filamentous structures hyphae from fungal strain Fusarium spp. onto a reflective low-E glass slide for IR imaging. The lower and left dense parts show hyphae mixed with PDA media. Scale bar: 100 µm. (b) Cellulose fibers images acquired in the transmission mode. Scale bar: 100 µm. (c, d) Recorded absorbance at 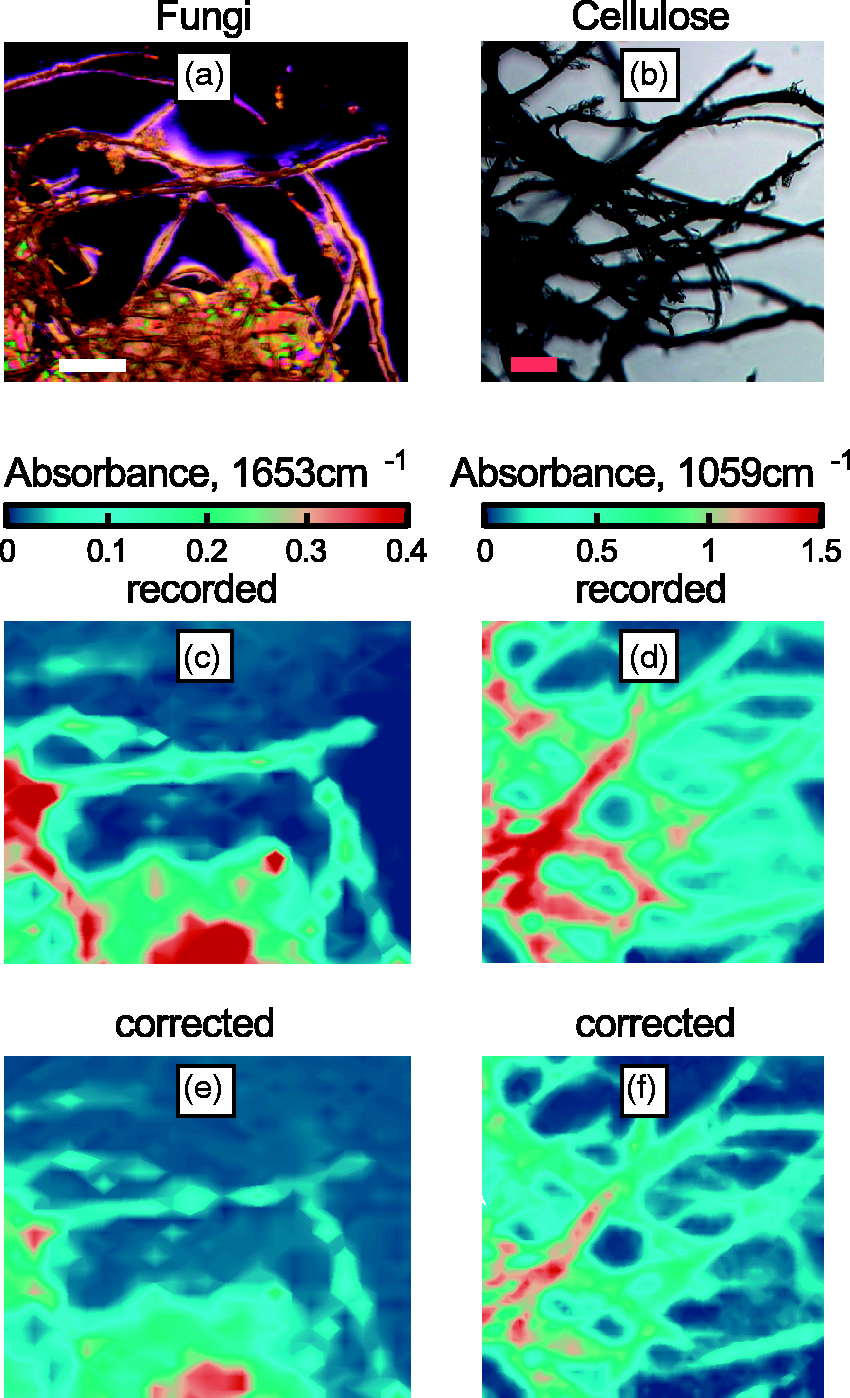
Data Acquisition
A Cary 620 FT-IR Microscope (Agilent Technologies) imaging system was used to collect FT-IR imaging data at 4 cm–1 spectral resolution (truncated to the detector sensitive range of 3800 cm–1 to 900 cm–1 wavenumbers) and 5.5 × 5.5 µm2 per pixel spatial resolution using 15 × (NA = 0.62) magnification objective in standard definition mode. For each image, spectra were collected using identical spectral and spatial parameters with 128 spectral co-additions for background and 64 co-additions for the sample. In total, 16 384 spectra per image were collected in a 704 × 704 µm2 (128 × 128 pixel 2 ) area. For both types of samples, similar parameters were used for FT-IR data collection except the fungal sample was imaged in transflection mode while the cellulose sample was imaged in transmission mode. The optical microscopy image for fungi shown in Fig. 5a was captured using the same FT-IR microscopy setup in reflection mode, while the optical image for cellulose sample shown in Fig. 5b was collected on Zeiss Axio Imager M2 microscopy system with the 10 × (NA = 0.3) objective in transmission mode. We note that the choice of different substrates both for transflection and transmission modes might affect the recorded signal; however, for sufficiently large samples, this effect is almost negligible for the transflection regime, 34 and one could expect the same trend for transmission mode.
Data Analysis
Before the modified EMSC algorithm was applied, a minimum noise fraction (MNF)
64
preprocessing was performed on the collected FT-IR data for noise reduction using Environment for Visualization (ENVI)-Interactive Data Language (IDL) version 4.8. The MNF corrected data were processed with the modified RMieS/EMSC procedure adapted and optimized for cylinder-shape samples from original RMieS/EMSC Matlab code.
65
The modified algorithm was implemented in Matlab (Mathworks, Inc., Version 2018a) environment and tested on a desktop computer equipped with an Intel Core i7-6920HQ CPU @ 2.90 GHz processor. The pre-calculation of
Results and Discussion
As mentioned previously, the main utility of the EMSC algorithm lies in the generalized analysis of spectra from complex samples in an image. We demonstrate the applicability of our approach to two complex samples, namely fungi and fibrous cellulose. Fungi have been analyzed extensively by IR microscopy66–72 and previous attempts at correcting data used the formulation of the EMSC that did not take into account the actual shape of the sample. Here, we apply the cylindrical version developed in this study, which is more suitable for the morphology.
The individual hyphae diameters are in the approximate range of 2–6.5 µm. However, in most of the cases, a collection of hyphae forms a bundle with diameters up to 25 µm. For given spatial resolution, each hyphae within the bundle might be considered as a single fiber. The diameter of each individual cellulose fiber is in the range of 6–20 µm. The size parameters shown in Fig. 3 cover all of these possible variations for the whole spectral range; therefore, we have used this pre-calculated set of
The images before and after correction, shown in Fig. 5c and 5e for fungi and in Fig. 5d and 5f for cellulose, demonstrate changes in several regions. The recorded data become more consistent after application of the scattering correction and increased contrast is clearly seen for regions where fiber-like samples are located. We note that fibers not in the plane of focus within these samples are blurred and may be difficult to visualize in the IR images, compared to the optical microscopy image. This is especially true of the samples on reflective slides (e.g., fungi here). In both cases, the images reflect the corrections in the underlying spectra. As expected from our results on synthetic data, a major manifestation in the correction is the mitigation of scattering-induced baseline offsets in individual spectra, as can be seen in Fig. 6. Examining spectra from the respective images shows that, indeed, EMSC successfully reduces the effect of scattering as seen in spectra gathered from samples with pronounced cylinder shapes in both cases. The question of precisely recovering band shapes is more complex and there are several confounding factors. First, the downside of wide and easy applicability to entire images is that pixels may be addressed that do not capture the entire scattering profile of a fiber. Second, in complex samples of the type seen in the two examples here, multiple scattering and focusing may also play a role that cannot be captured by EMSC. It should be recognized that there are no methods available to entirely correct spectra from arbitrary number of these effects. We note that the success of our implementation does include a mitigation of scattering induced baseline variations and accurate appearing spectra.
Recorded (top) and corrected (bottom) absorbance for fungi (left) and cellulose (right) samples. Spectra are recorded from 30 pixels containing samples with a pronounced cylinder-like shape.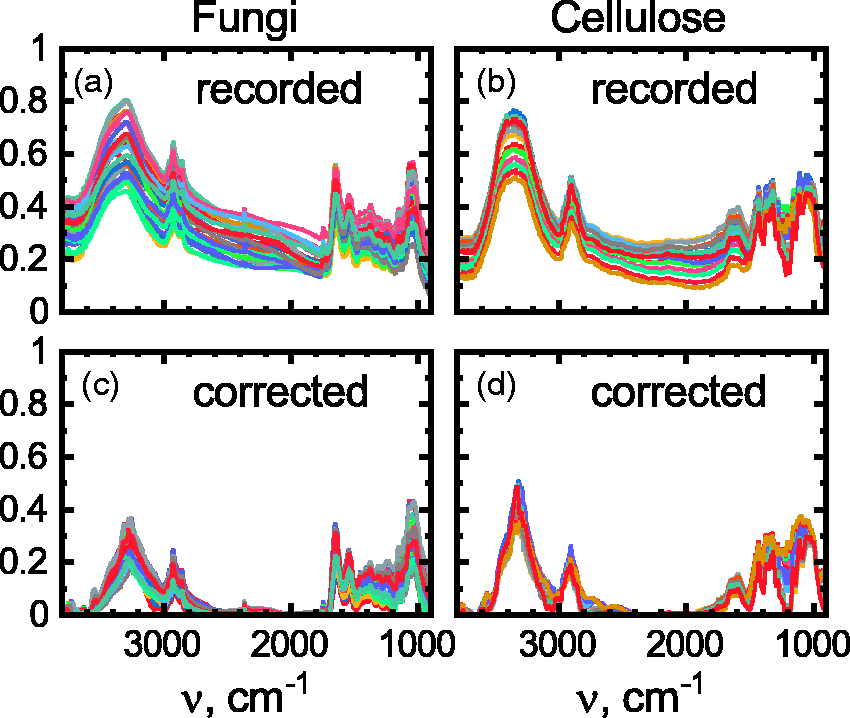
We compared our corrected spectra to those reported in other studies, though we caution that comparing single fibers is much easier than comparing spectra from complicated mixtures of cylindrical objects at varying density in an imaging plane, as attempted here. In general, the major spectra line shapes and peak positions agree well with typical spectra previously reported for both cases. For example, cellulose spectra for cotton fluff reported in the study by Zhbankov
73
show prominent features around 2950 cm–1 and 3300 cm–1, which are also observed in Fig. 6b and 6d. However, we note that the peak at 3300 cm–1 for corrected spectra is sharper than that reported in the literature. While the scattering correction works well in removing baseline variations, the strongly absorbing region of the high wavenumber region does not agree as well. This observation is consistent with our synthetic data in which strongly absorbing regions of the PMMA spectrum were not easily corrected. Moreover, the same trend for peaks at the
It is noteworthy that recently developed improvements (in terms of stability, convergence, and overall performance) of EMSC for spherical samples might be also applied for fibers, e.g., characterizing the sample by the effective optical path length instead of its radius 53 or optimizing the number of iterations and principal components used in Eq. 1. 54 These strategies require comprehensive benchmarks which are beyond the scope of this paper. Together, these advances and the rigorous basis of extension to fibers proposed here can greatly accelerate the development of better algorithms as well as further testing and use for IR imaging of heterogeneous samples containing cylindrical domains.
Conclusion
In this study, we have proposed a modified version of the extended multiplicative signal correction procedure for IR spectroscopy that specifically addresses cylindrical-shaped samples and domains in heterogeneous materials. In order to utilize rigorous Mie theory for calculation of the scattering efficiency of the infinite cylinder further, we have proposed to change the usual workflow of the EMSC algorithm. Namely, instead of estimating the large number of permutations of
Footnotes
Conflict of Interest
The authors report there are no conflicts of interest.
Funding
This work was supported in part by the Agilent thought leader award to RB.