The development of new methods for the detection of redox cycle is important for biological and clinical diagnoses. Here, a new cyclometalated iridium complex, (4-(2-pyridyl) benzaldehyde)2Ir (5-chloro-1,10-phenanthroline) ([(4-pba)2Ir(5-Cl-phen)]PF6, probe 1), has been synthesized and applied to rapid, sensitive, and reversible detection and imaging of redox cycle /H2O2 in living cells. The probe 1 is synthesized by using 4-(2-pyridyl) benzaldehyde as main ligand and 5-chloro-1,10-phenanthroline as ancillary ligand. Probe 1 exhibited “off–on–off” photoluminescence (PL) signal change in response to and H2O2 in aqueous solution within 1 min. The change of PL intensity is proportional to concentration from 40 μM to 300 μM and to H2O2 concentration from 40 μM to 260 μM. The detection limit is 10 μM for and 20 μM for H2O2. Additionally, probe 1 was applied to detect in food samples with satisfactory results. More importantly, PL imaging of HeLa cells indicates that probe 1 is able to image redox cycle /H2O2 in living cells.
The development of new methods is important for the study of redox chemistry in living cell because of its redox biology of living cell and its broad implications in human health and disease. Bisulfite (), as common preservative added to foodstuffs, is widely used in foods.1 The excess amount of could cause various health issues such as allergic reaction or gastrointestinal diseases.2 Hydrogen peroxide (H2O2) is one of the most general yet important molecules existed in different biological tissues.3–5 It was reported that endogenous could be generated from the decomposition of thiol-containing amino acids by H2O2, resulting in oxidative stress and diseases.6,7 Therefore, it is important to develop novel methods for the detection of redox cycle /H2O2 in biological and clinical fields.
The fluorescence probe has become a powerful tool for sensing and imaging targets because of its sensitivity, simplicity, and fast response times.1,8 Although there are many fluorescent probes reported for the detection of via nucleophilic addition to aldehydes/ketones9–11 or via nucleophilic addition to unsaturated double bonds,12 there are few reports on the detection of reversible redox cycles of /H2O2 in living cells, such as redoxfluor-1,13 a naphthopyran-benzothiazolium system,14 and a benzothiazole functionalized cyanine probe.15 For example, Miller et al.13 synthesized a fluorescent redoxfluor-1 to monitor the reversible redox cycle of and H2O2 in living cells. Although some interesting results were obtained in these works, it is still needed to synthesize a new fluorescent probe for reversible detection of redox cycle process of /H2O2 in biological systems.
Cyclometalated iridium complexes have received increasing interest as photoluminescence (PL) probes in sensing and imaging applications because of their high quantum yields, large Stokes shifts, and cell permeability.16–19 A variety of cyclometalated iridium(III) complexes have been synthesized and employed to detect analytes, such as ions,20 small molecules,21,22 amino acids,23 and biomacromolecules.24,25 For example, Chao's group26,27 synthesized serials of dinuclear iridium(III) complexes bridged via an azo group for the detection of based on the nucleophilic addition of to –N=N– double bonds. Our group28 synthesized an Ir(III) complex ([Ir(ppy)2phen-CHO]PF6, ppy = 2-phenylpyridine, phen-CHO = 1,10-phenanthroline-5-carboxaldehyde) for the detection of in real white wines and PL imaging of in living cells based on nucleophilic addition to aldehydes, in which 1,10-phenanthroline-5-carboxaldehyde was used as ancillary ligand. To our best knowledge, there is no report using iridium(III) complexes for PL imaging of redox cycle /H2O2 in living cells. It is well known that the property of iridium(III) complex is dependent not only on main or ancillary ligands but also on the substituents on ligands.16–19 We are curious if the aldehyde group on main ligand can response to target molecules.
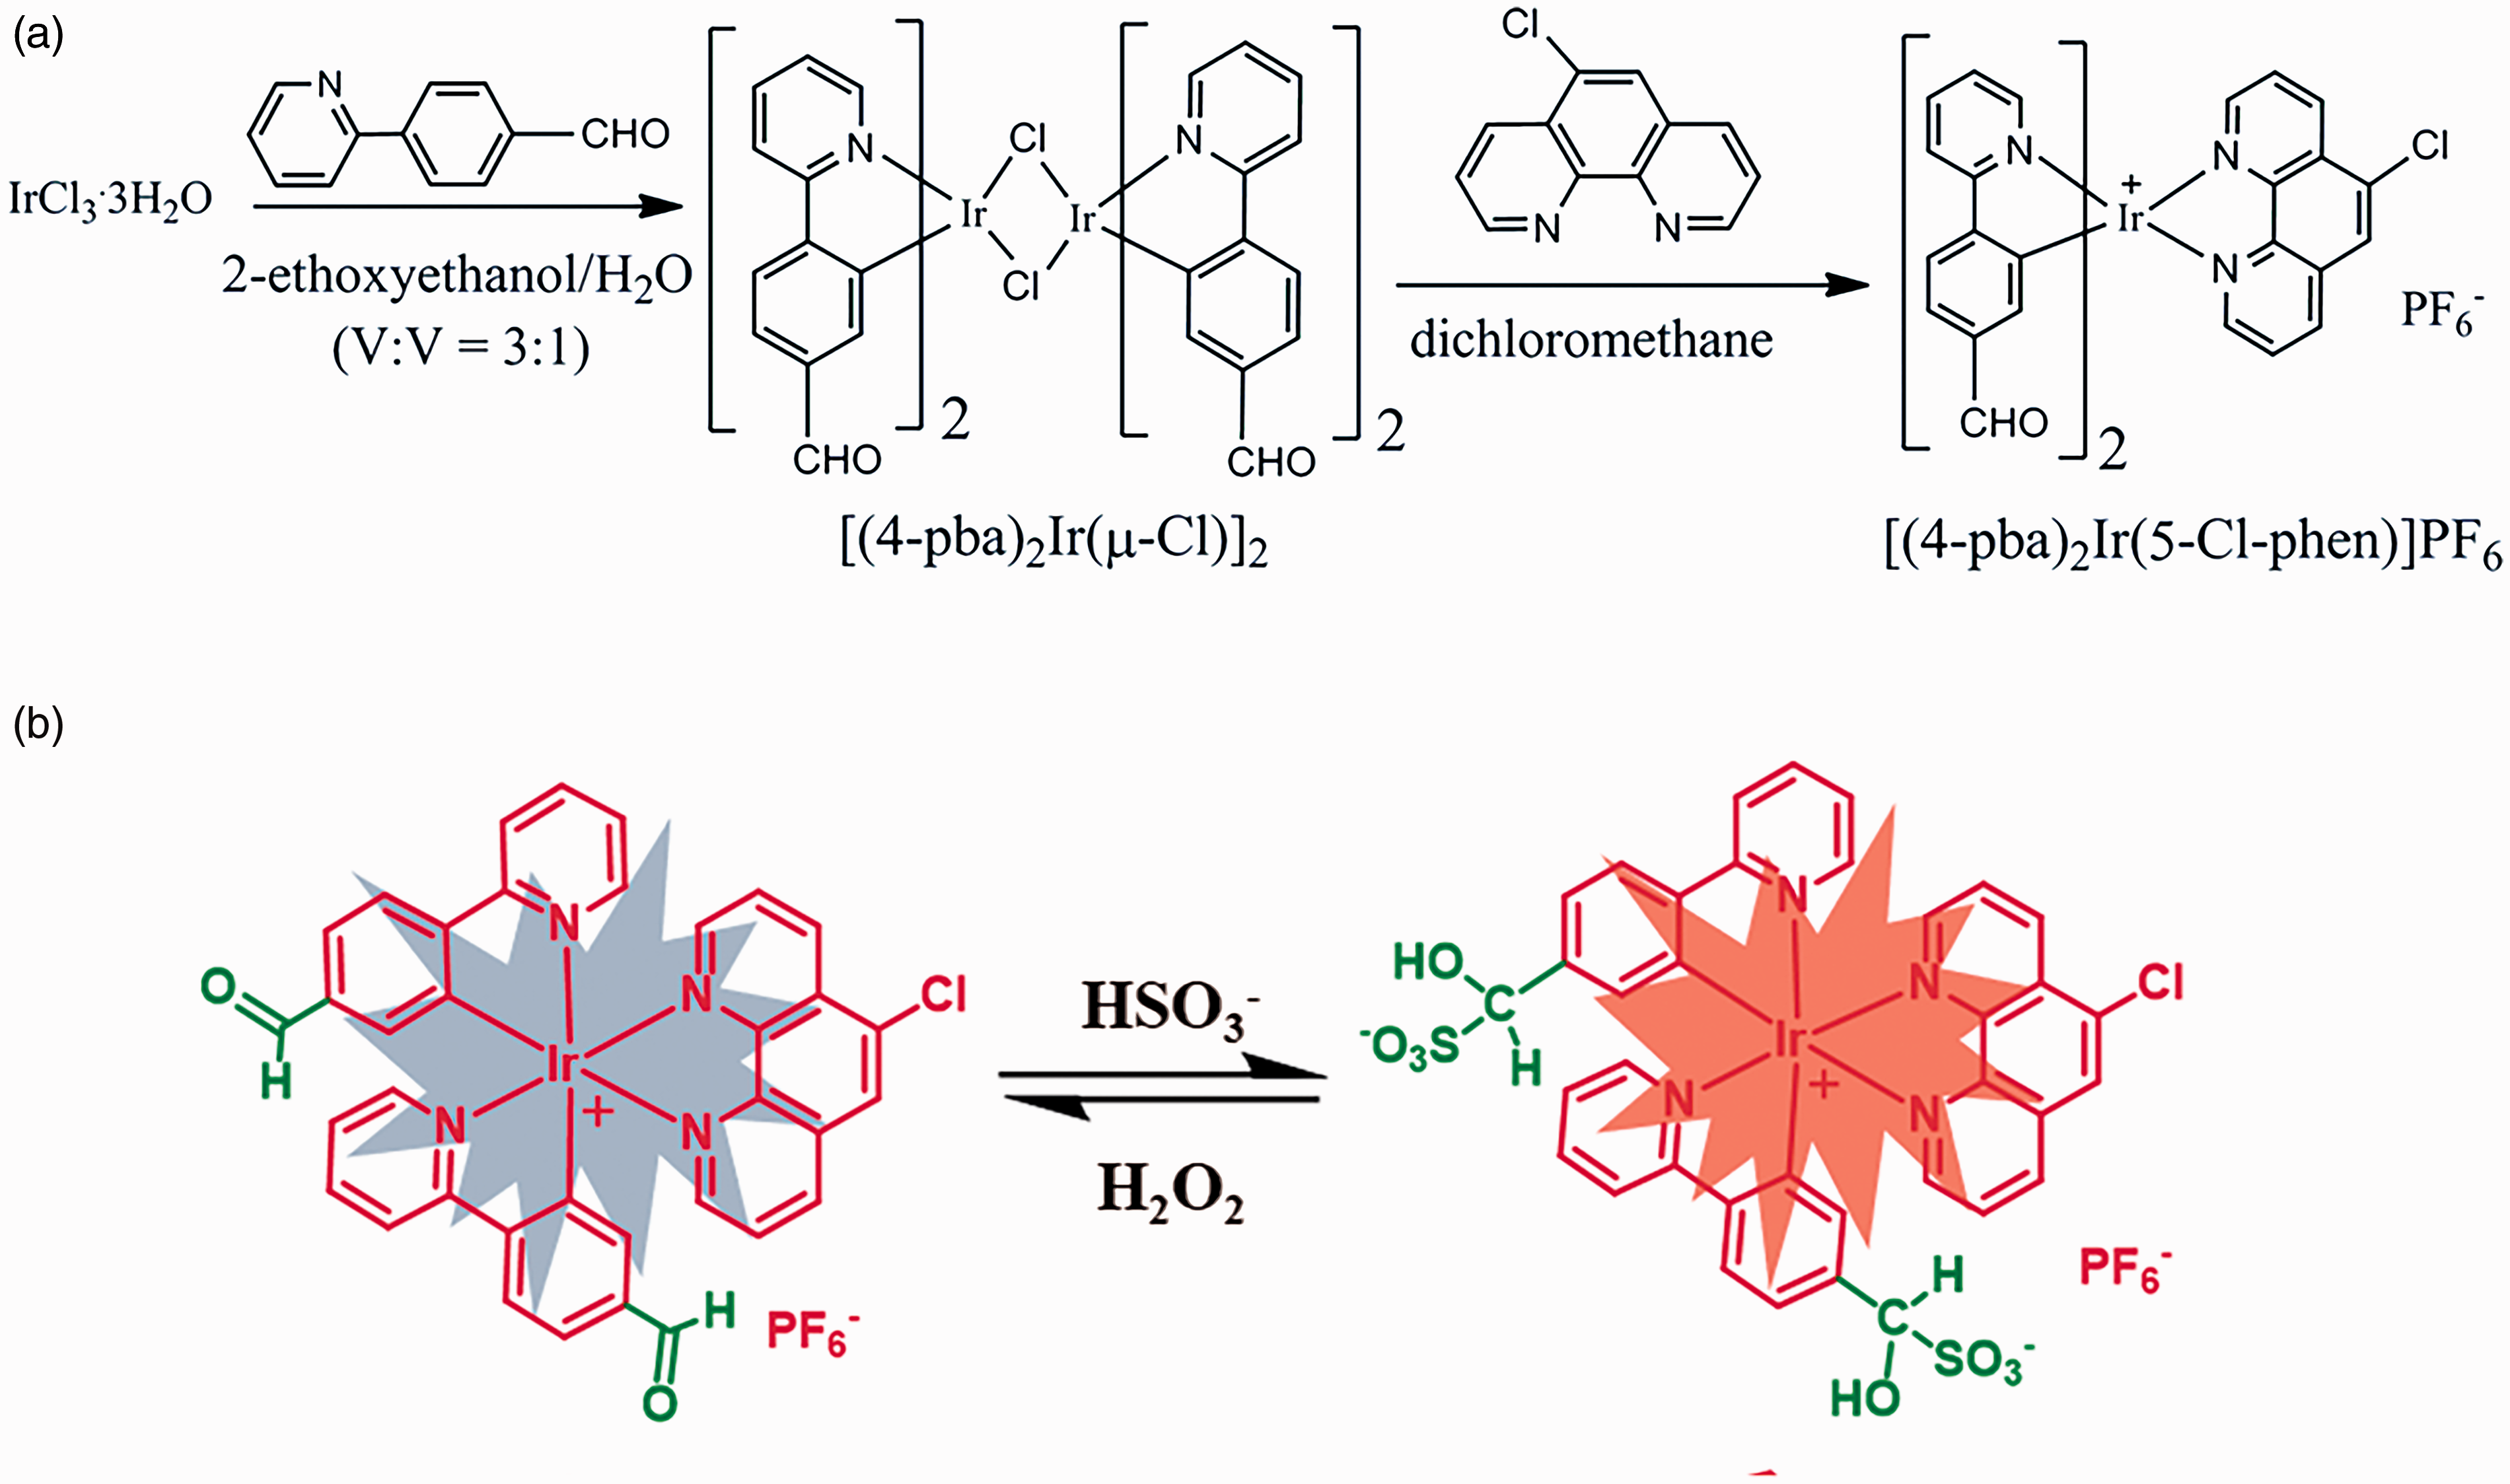
Here, a new cyclometalated iridium(III) complex, (4-(2-pyridyl) benzaldehyde)2Ir (5-chloro-1,10-phenanthroline) ([(4-pba)2Ir(5-Cl-phen)]PF6, probe 1) was designed and synthesized for reversible detection and imaging of redox cycle /H2O2 in aqueous solution and in living cells. Probe 1 was synthesized by using 4-(2-pyridyl) benzaldehyde (4-pba) as main ligand and 5-chloro-1,10-phenanthroline (5-Cl-phen) as ancillary ligand. The synthetic routes and recognition mechanism of probe 1 are shown in Scheme 1a and 1b. It is surprising to find that probe 1 shows an off–on–off reversible PL response to and H2O2. Therefore, one PL method was developed for reversible sensing and H2O2 in aqueous solution. The analytical application of probe 1 was further studied for the detection of in real food samples and for the imaging of reversible redox cycle of and H2O2 in living cells. To our best knowledge, this is the first report using iridium(III) complexes for PL imaging of the redox cycle /H2O2 in living cells.
(a) The synthetic route of probe 1 and (b) the scheme for the detection of and H2O2.
Experimental Section
Chemicals and Apparatus
IrCl3ċ3H2O was obtained from Shaanxi Kaida Chemical Engineering Co., Ltd. (China). Potassium hexafluorophosphate (KPF6), 4-(2-pyridyl) benzaldehyde (4-pba), and 5-chloro-1,10-phenanthroline (5-Cl-phen) were purchased from Tokyo Chemical Industry Co., Ltd. (Japan). , H2O2, bovine serum homocysteine (Hcy), cysteine (Cys), glutathione (GSH), and dimethyl sulfoxide (DMSO) were obtained from Sinopharm Chemical Reagent Co., Ltd. (China). HeLa cells were purchased from Shanghai Institutes for Biological Sciences (China).
Ultraviolet–visible (UV--Vis) spectrophotometer (UV-2450, Shimadzu Corporation, Japan) and Cary Eclipse fluorescence spectrophotometer (Varian, USA) were employed to record photophysical spectrum. Fluorolog-3 fluorescence spectrophotometer (Horiba JY, USA) was used to measure quantum yields (Φ) and lifetime (τ). 1H nuclear magnetic resonance (NMR) spectrometry (a Bruker Avance 400 MHz spectrometer), 13C nuclear magnetic resonance spectrometry (a Bruker Avance 600 MHz NMR spectrometer), elemental analysis (VarioEL III CHNS instrument), and electrospray ionization mass spectrometry (ESI-MS, Bruker Maxis UHR-TOF) were employed for the characterization of probe 1.
Synthesis and Characterization of [(4-pba)2Ir(5-Cl-phen)]PF6 (Probe 1)
The [(4-pba)2Ir(5-Cl-phen)]PF6 (probe 1) was synthesized according to typical two steps.12 The dichlorobridged iridium dimer was firstly synthesized by refluxing IrCl3·3H2O (1 equiv.) and 4-pba (2.2 equiv.) in 2-ethoxyethanol/H2O (V:V = 3:1) for 24 h under nitrogen condition. And then probe 1 in this work was synthesized by reacting [(4-pba)2Ir(μ-Cl)]2 (1 equiv.) with 5-Cl-phen (2.2 equiv.) in 45 mL of dichloromethane with KPF6 at 40 ℃ for 12 h under nitrogen condition. The purity of probe 1 was confirmed by 1H NMR, 13C NMR, elemental analyses, and mass spectrometry analysis.
Living HeLa cells were cultivated according to our previous process (see Supplemental Material).28 In fluorescence imaging experiments, first, probe 1 (20 μM) was incubated with HeLa cells in non-serum cell culture mediums for 30 min at 37 ℃ and then washed with 10 mM pre-warmed phosphate-buffered saline (pH 7.4, HyClone, USA). Second, probe 1-stained HeLa cells were treated with 100 μM for 20 min and then the above stained HeLa cells were treated with 100 μM H2O2 for another 20 min. PL images were recorded on a confocal microscope (an Olympus FV-1200 microscope) using 405 nm excitation wavelength.
Analysis of and H2O2
For the detection of , 60 µL of 1 mM probe 1 in DMSO was added into 4 mL of 0.15 M Na2HPO4/citric acid buffer (0.11 M Na2HPO4 and 0.04 mM citric acid) and was mixed with different volumes of 5 mM or sample solution. And then 0.15 M Na2HPO4/citric acid buffer (pH = 5.4) was used to adjust the final volume to 6 mL. was quantified using the ratio of PL intensity at 595 nm (I−I0/I0), in which I0 represents the PL intensity of probe 1, and I represents the PL intensity of probe 1 in the presence of .
For the detection of H2O2, 60 µL of 1 mM probe 1 in DMSO was injected into 4 mL of 0.15 M Na2HPO4/citric acid buffer and then mixed with 360 µL of 5 mM and different volumes of 5 mM H2O2. And then 0.15 M Na2HPO4/citric acid buffer (pH = 5.4) was used to adjust the final volume to 6 mL. H2O2 was quantified using the ratio of PL intensity at 595 nm (I0−I/I0), in which I0 represents the PL intensity of probe 1-, and I represents the PL intensity of probe 1- in the presence of H2O2.
Results and Discussion
Design and Characterization of Probe 1
Probe 1 was designed and synthesized by using 4-(2-pyridyl) benzaldehyde as main ligand and 5-chloro-1,10-phenanthroline as ancillary ligand. Probe 1 was characterized using 1H NMR (Fig. S1), 13C NMR (Fig. S2), mass spectrum (MS) (Fig. S3), and elemental analysis. Probe 1 shows a major peak at m/z [M]+ 771.1136 in ESI-MS (calculated [M]+ 771.1133), indicating that probe 1 is successfully synthesized.
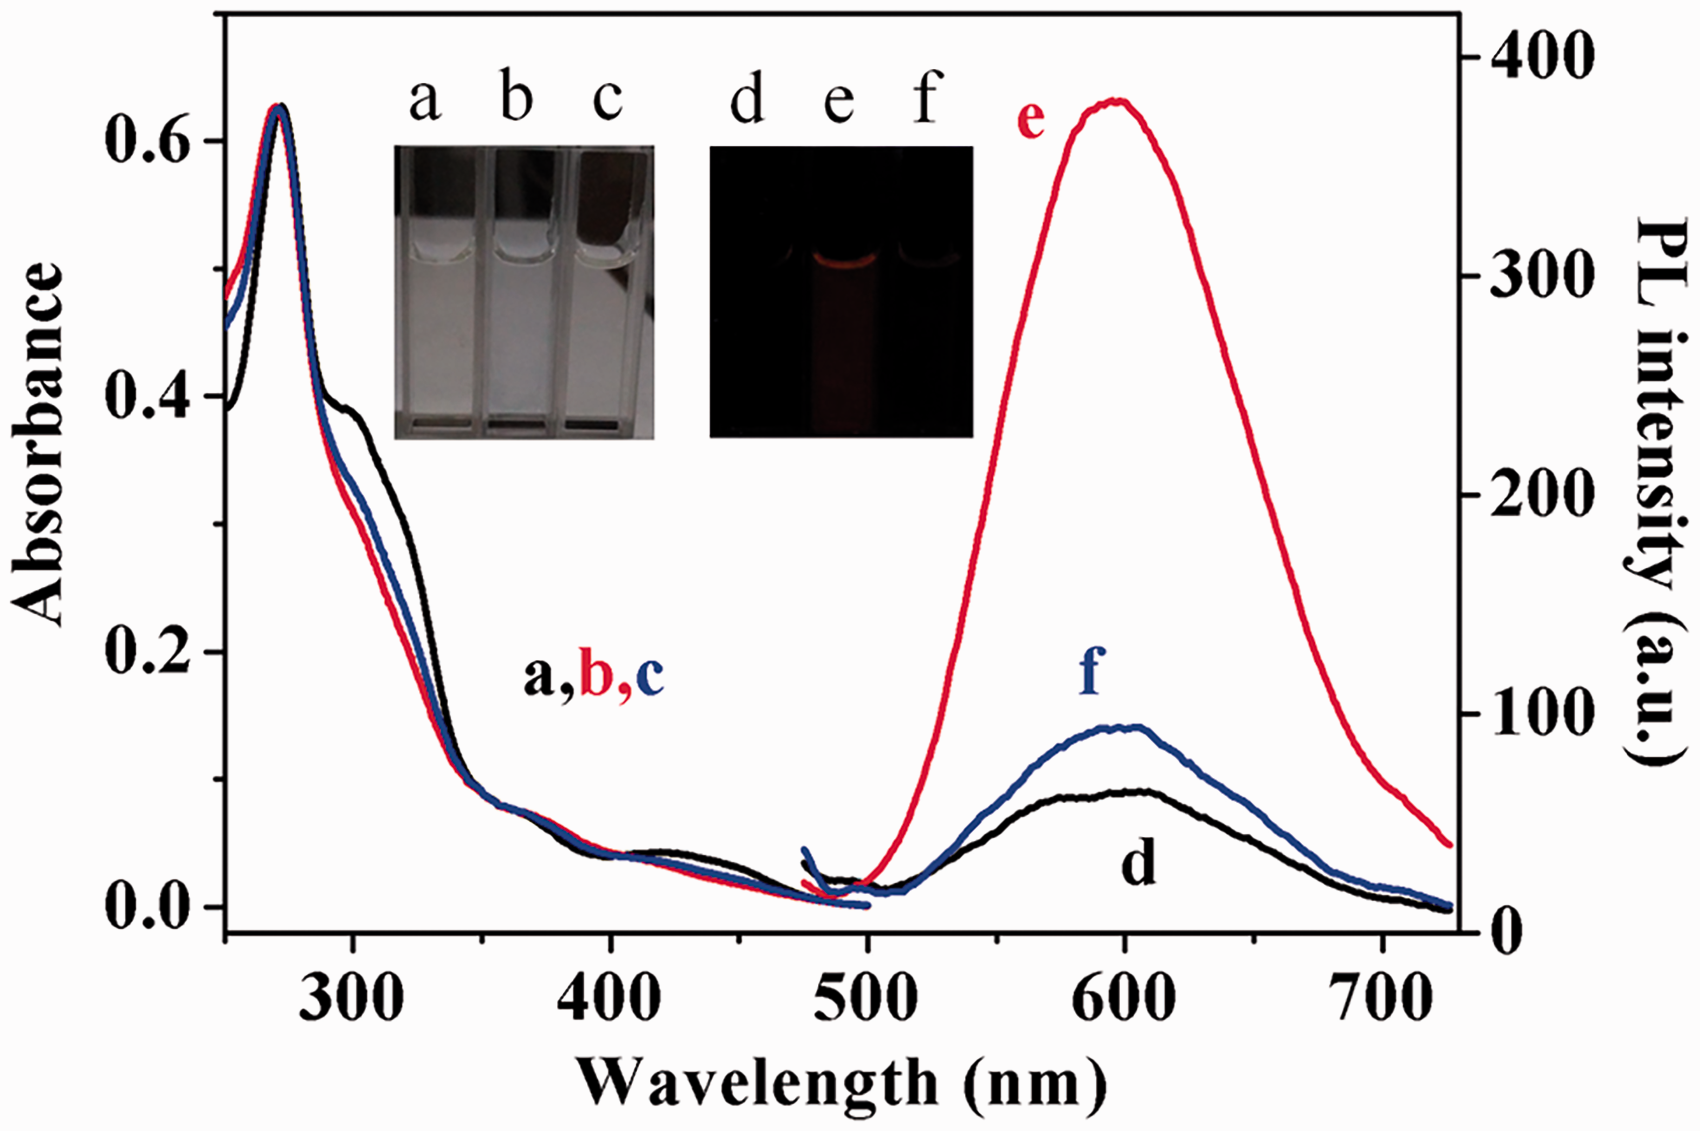
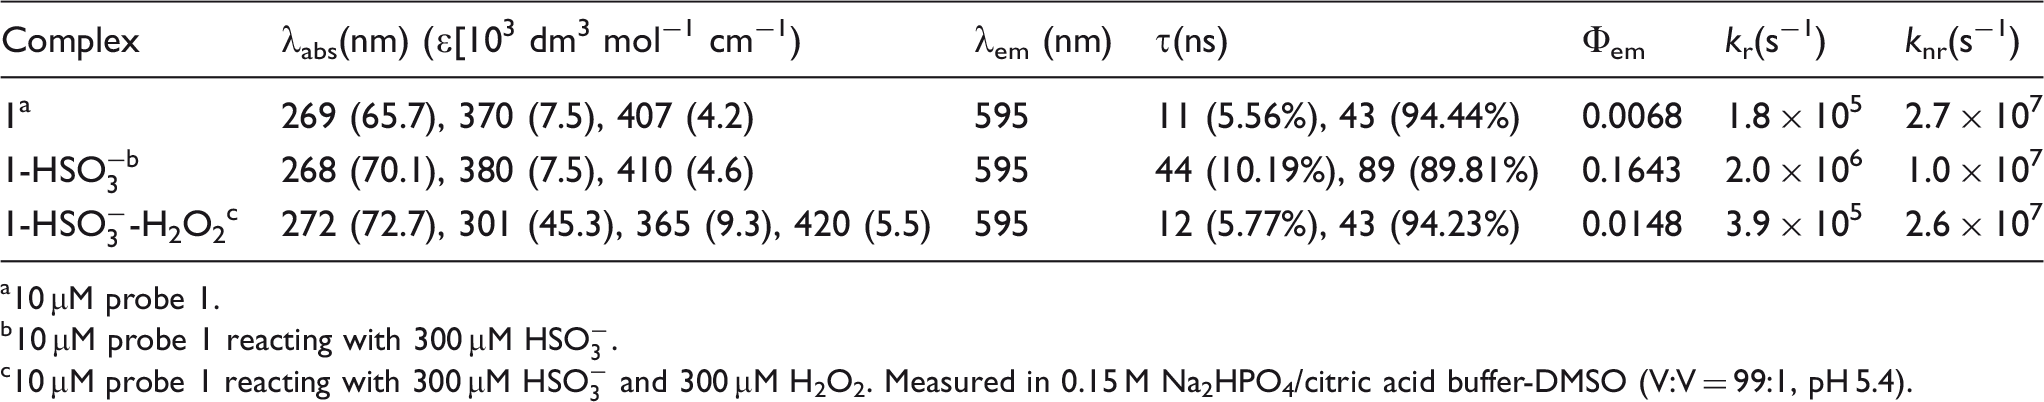
Figure 1 shows UV--Vis absorption spectra and PL spectra of probe 1 in different conditions. The photophysical properties were listed in Table 1. Probe 1 exhibits strong absorption below 350 nm and weak absorption in the range of 350–500 nm, which is usually observed in iridium complex (Fig. 1, a).16–19 Similar absorption spectrum was observed for the mixture of probe 1- (Fig. 1, b) and the mixture of probe 1--H2O2 (Fig. 1, c). One PL emission peaked at 595 nm was observed with PL efficiency (Φ) of 0.0068 for probe 1 (Fig. 1, d). A time-correlated single photon count was used to measure the lifetime, and lifetimes were calculated using decay analysis software (DAS6) to fit the signal to a biexponential decay function. The average lifetime (τ) monitored at 595 nm in air-equilibrated solution at room temperature was measured to be 37 ns according to the biexponential decay components (τ1 = 11 ns, amplitude = 5.56%, τ2 = 43 ns, amplitude = 94.44%, Fig. S4). According to Φ and τ values,29 the radiative decay constant (kr) and non-radiative decay constant (knr) were calculated to be 1.8 × 10⁵ s−1 and 2.7 × 10⁷ s−1 for probe 1, respectively.
UV--Vis absorption spectra and PL spectra of 10 μM probe 1 in different conditions. Probe 1 (a, d), probe 1 in the presence of 300 μM (b, e), probe 1 in the presence of 300 μM , and 300 μM H2O2 (c, f). Inset, related photographs of probe 1. Experiment conditions, 0.15 M Na2HPO4/citric acid buffer-DMSO (V:V = 99:1, pH 5.4), λex = 407 nm.
c10 μM probe 1 reacting with 300 μM and 300 μM H2O2. Measured in 0.15 M Na2HPO4/citric acid buffer-DMSO (V:V = 99:1, pH 5.4).
For the detection of , the PL intensity of probe 1 increased greatly in the presence of (Fig. 1e). The PL efficiency increased to 0.1643 and the average lifetime (τ) was measured to be 81 ns for probe 1- (τ1 = 44 ns, amplitude = 10.19%, τ2 = 89 ns, amplitude = 89.81%, Fig. S4). kr and knr were calculated to be 2.0 × 10⁶ s−1 and 1.0 × 10⁷ s−1 for probe 1-. The observed changes in PL intensity are consistent with respective changes in kr and knr. In the presence of H2O2, the PL intensity of probe 1- decreased compared with that of in the absence H2O2 (Fig. 1f). The PL efficiency is 0.0148 and the average lifetime is 38 ns (τ1 = 12 ns, amplitude = 5.77%, τ2 = 43 ns, amplitude = 94.23%, Fig. S4). Such an off–on–off PL signal change is also visible to the naked eye under a UV light with excitation at 365 nm (Fig. 1, inset).
In order to explain the proposed mechanism of the PL signal change based on the reaction between probe 1 and and between probe 1- and H2O2, the reaction product of probe 1 treated by or and H2O2 (10 equiv.) was characterized by 1H NMR (Fig. S5). There are two aldehyde protons at around 9.77 parts per million (ppm) and 9.75 ppm for probe 1. In 1H NMR spectrum of probe 1-, two new peaks at 5.06 and 4.77 ppm appeared, consistent with protons on the aldehyde–hydrogen sulfite adducts. In the presence of H2O2, two aldehyde protons at around 9.69 ppm and 9.70 ppm reappeared again. Therefore, the mechanism of probe 1 for the detection of the and H2O2 via off–on–off PL signal change is shown in Scheme 1b. As shown in Scheme 1b, the low PL efficiency of probe 1 is ascribed to the quench effect of an aldehyde group in probe 1 through an photo-induced electron transfer (PET) effect, which gives a lower background emission. In the presence of , aldehydes can selectively react with to form the aldehyde– adducts with typical mechanism of nucleophilic addition reaction,14,28 and the PL emission can be increased because of the suppression of PET. In the presence of H2O2, the original probe 1 could be regenerated with the reversibility of nucleophilic addition reaction,14 and the PL intensity of probe 1- can be decreased toward H2O2. As control, UV--Vis absorption spectra and PL spectra of 10 μM probe 1 in the absence and presence of 300 μM H2O2 were checked. It is found that there is no obvious difference in the absorption and PL spectra of probe 1 in the absence and presence of H2O2 (Fig. S6). Therefore, the feasibility of probe 1 for reversible detection of redox cycle /H2O2 is obvious.
Analytical Performance for the Detection of and H2O2
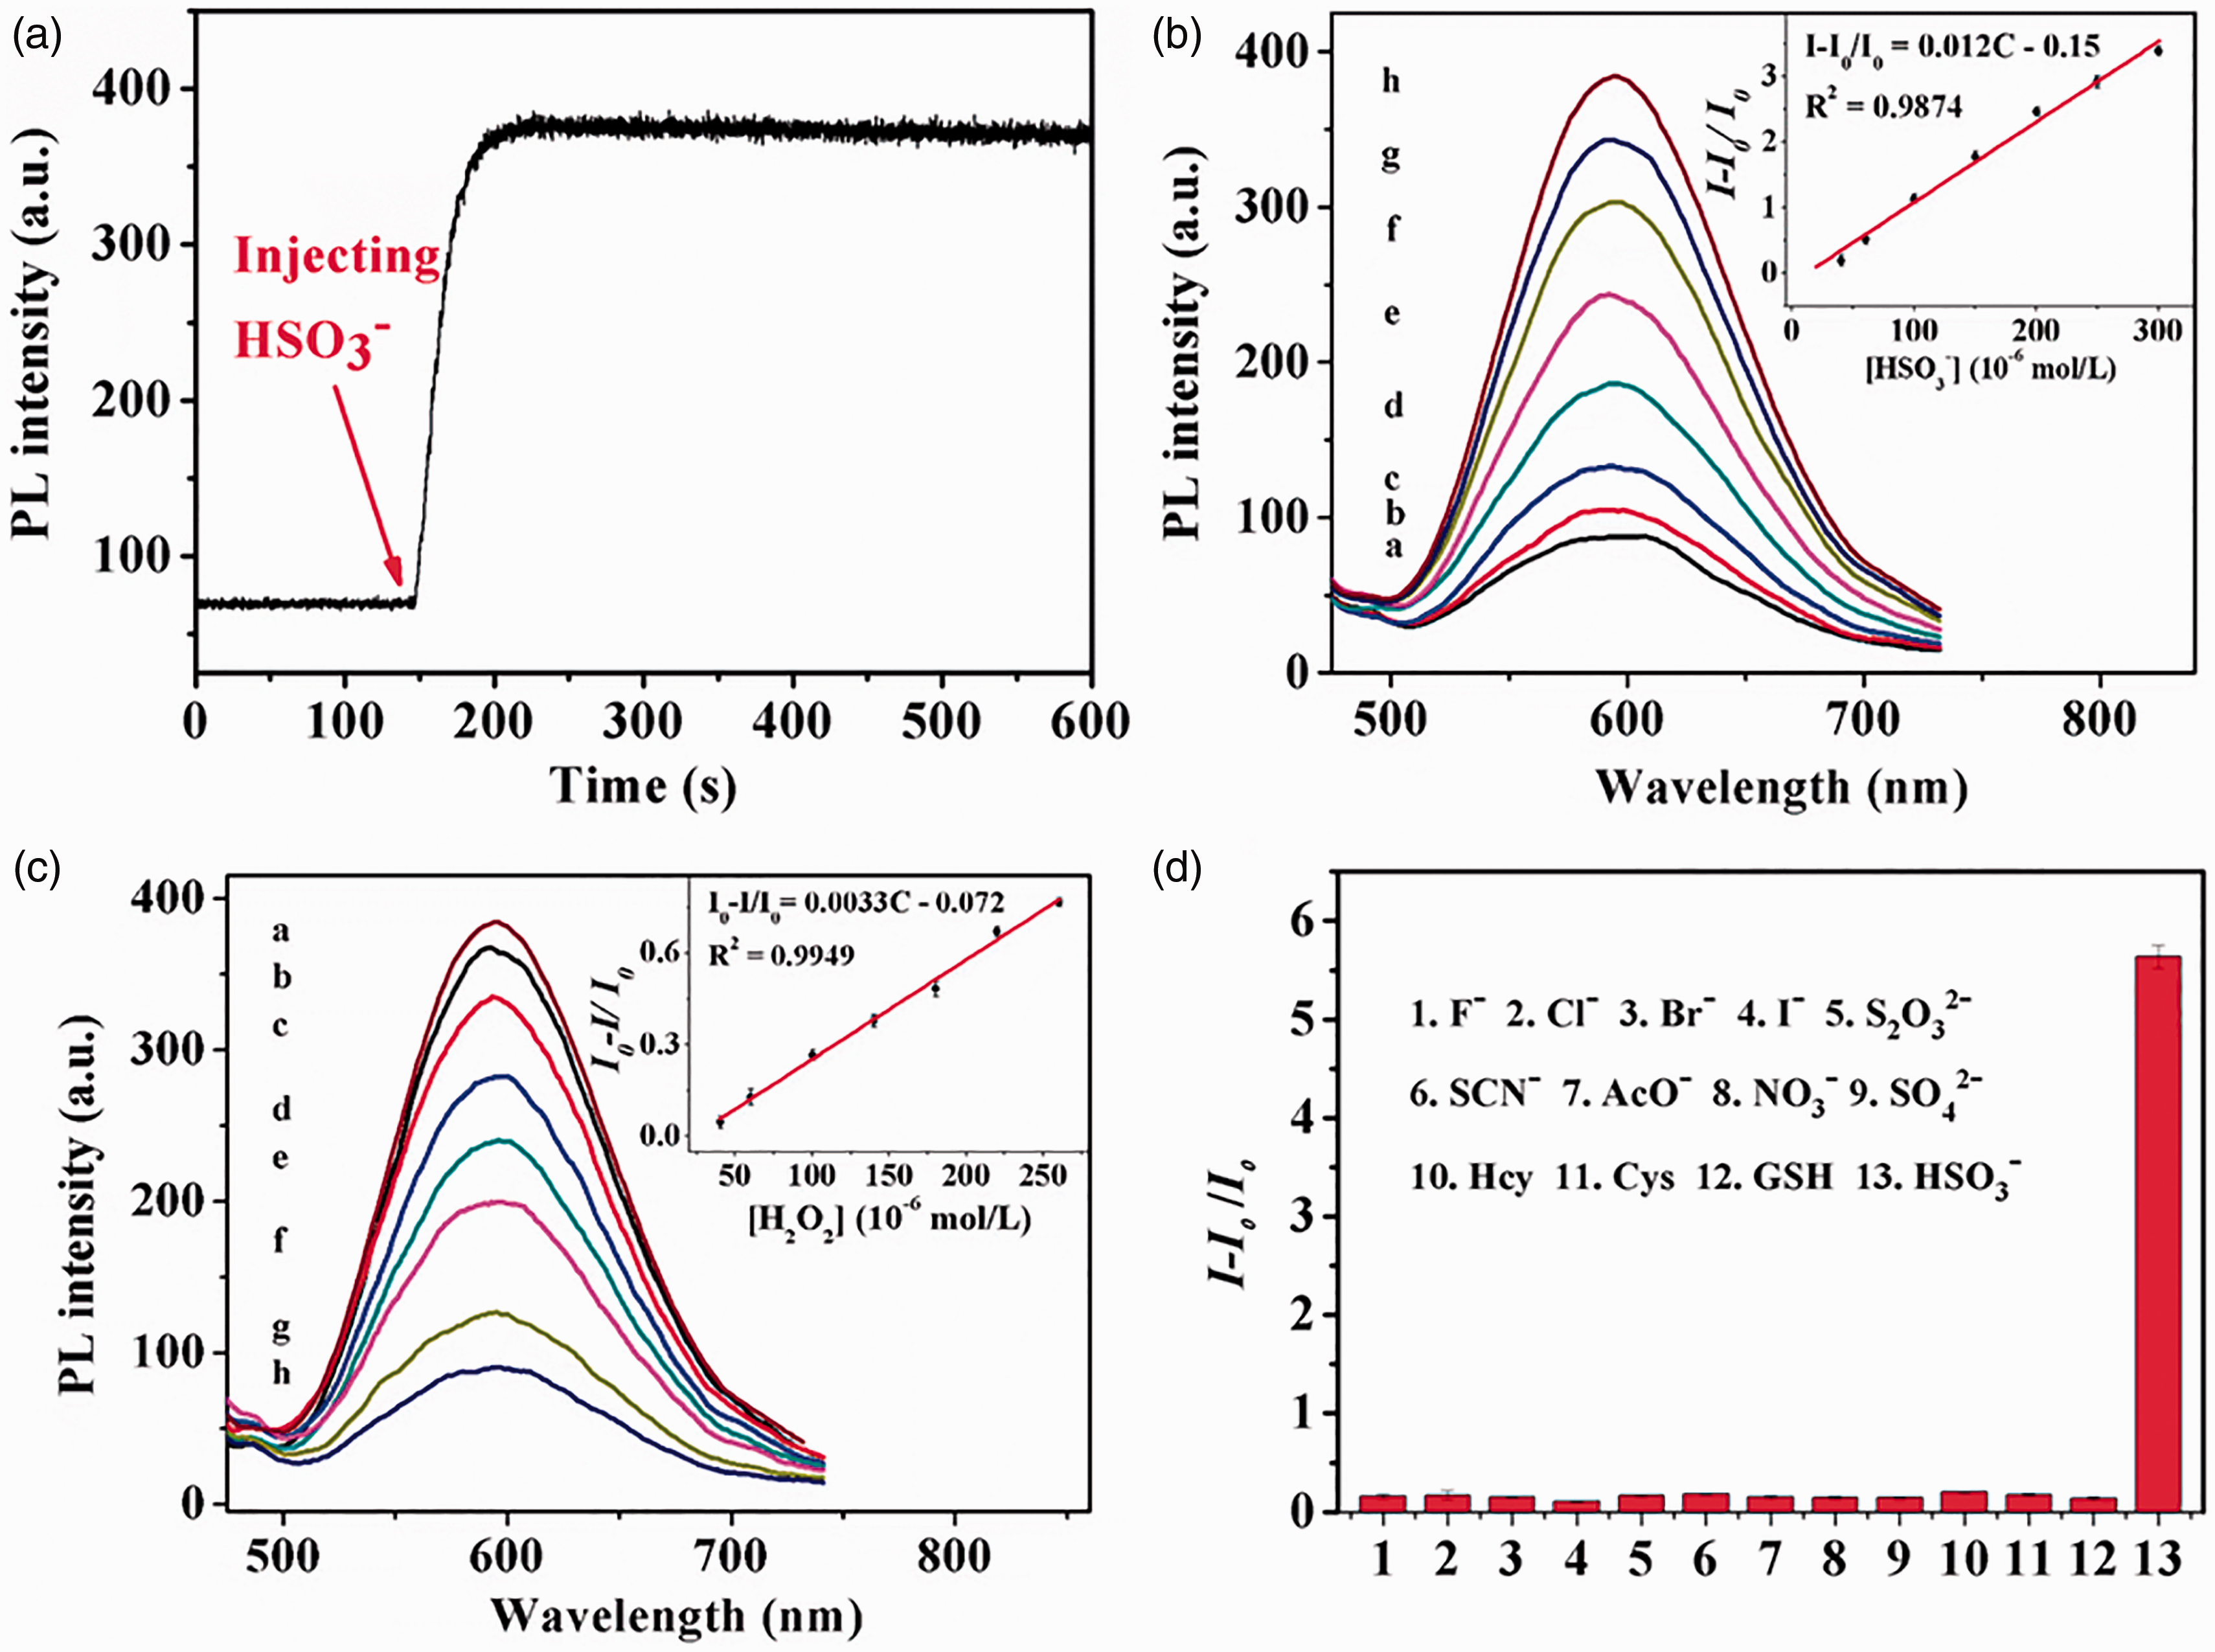
The solubility of probe 1 and the response time of probe 1 to were studied. The solubility is measured to be 75 μM for probe 1 in 0.15 M Na2HPO4/citric acid buffer-DMSO (V:V = 99:1, pH 5.4) using UV-Vis method (Fig. S7). The response time of probe 1 to was checked by injecting 0.2 mL of 4.5 mM into 2.8 mL of 10.8 μM probe 1. A maximum PL intensity was obtained within 1 min (Fig. 2a). Therefore, 1 min response time was chosen in the following experiment for the detection of probe 1 .
(a) PL intensity versus time profile of probe 1 by injecting 0.2 mL of 4.5 mM into 2.8 mL of 10.8 μM probe 1. (b) PL spectra of 10 μM probe 1 reacting with various concentrations of (a, blank, b, 40 μM, c, 60 μM, d, 100 μM, e, 150 μM, f, 200 μM, g, 250 μM, and h, 300 μM). (c) PL spectra of 10 μM probe 1–300 μM with different concentrations of H2O2 (a, blank, b, 40 μM, c, 60 μM, d, 100 μM, e, 140 μM, f, 180 μM, g, 220 μM, and h, 260 μM). Inset, calibration plot for (b) and H2O2 (c). (d) PL responses of 10 μM probe 1 towards 200 μM various analytes. Measurement conditions, 0.15 M Na2HPO4/citric acid buffer-DMSO (V:V = 99:1, pH 5.4), λex = 407 nm, λem = 595 nm.
The analytical performance for the detection of and H2O2 was done in the optimized conditions. Figure 2b shows the PL intensity of probe 1 to different concentrations of . The ratio of PL intensity increased with increasing concentration from 40 μM to 300 μM and a regression equation is I−I0/I0 = 0.012 − 0.15 (unit of C is μM, R = 0.9936). The detection limit is calculated to be 10 μM (S/N = 3). The ratio of PL intensity decreased with increasing H2O2 concentration from 40 μM to 260 μM (Fig. 2c). A linear regression equation is I0−I/I0 = 0.0033−0.072 (unit of C is μM, R = 0.9974) and the detection limit is 20 μM (S/N = 3).
The selectivity of probe 1 for was further checked by examination of the change of the PL intensity upon the addition of other competing anions or interference molecules, including F−, Cl−, Br−, I−, , SCN−, AcO−, , , Hcy, Cys, GSH, and , in 0.15 M Na2HPO4/citric acid buffer-DMSO (V:V = 99:1, pH 5.4). As shown in Fig. 2d, the PL intensity in the tested system greatly increased only in the presence of while the PL intensity showed a negligible or only slight changes in the presence of other possible interferences. These results clearly demonstrated the good selectivity of probe 1 toward .
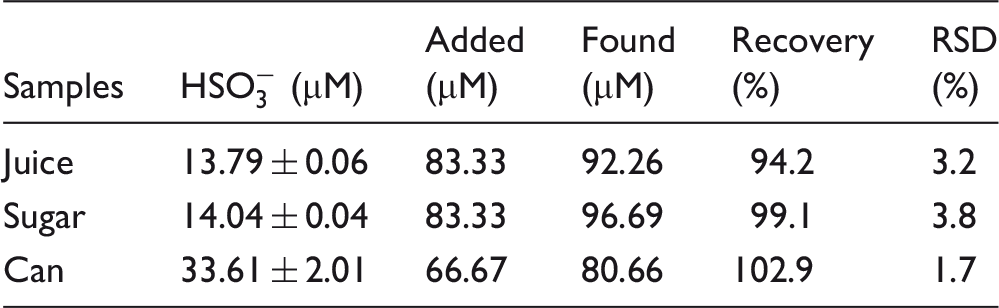
To investigate the applicability of the PL method in real food samples, the amounts of in three kinds of local foods, including sugar, can, and beer purchased from local supermarket, was detected by the PL method using probe 1. Table II shows the results for the detection of in three types of food samples. The concentration of was calculated to be 13.79 ± 0.06, 14.04 ± 0.04, and 33.61 ± 2.01 μM and recovery is ranged from 94.2% to 102.9%. The analytical application of the PL method is feasible in food samples.
Results for the detection of in food samples.
Samples
(μM)
Added (μM)
Found (μM)
Recovery (%)
RSD (%)
Juice
13.79 ± 0.06
83.33
92.26
94.2
3.2
Sugar
14.04 ± 0.04
83.33
96.69
99.1
3.8
Can
33.61 ± 2.01
66.67
80.66
102.9
1.7
PL Imaging of and H2O2 in Living Cells
Because of the good photophysical properties of probe 1, probe 1 was used to image intracellular and H2O2 using HeLa cells as model cell. Less than 20% cytotoxicity was obtained after incubation HeLa cells with 20 μM probe 1 for 24 h (Fig. S8). Therefore, it suggested that probe 1 with low concentration could be used as PL imaging probe.
Figure 3 shows confocal PL images of HeLa cells in different conditions. It can be seen that intracellular luminescence was negligible for probe 1-stained HeLa cells (Fig. 3a), while a bright orange intracellular luminescence was observed in the cytoplasm of HeLa cells when the HeLa cells were stained with 20 μM probe 1 for 20 min and subsequently treated with 100 μM for 20 min at 37 ℃ (Fig. 3b). A waning orange-red luminescence was observed for probe 1- loaded Hela cells incubated with 100 μM H2O2 (Fig. 3c). The feasibility of PL imaging of and H2O2 in living cells is feasible using probe 1. The luminescent intensity of Hela cells stained with probe 1 (20 μM) in the presence of (100 μM) and H2O2 (100 μM) was higher than that of Hela cells stained with probe 1, which is attributed the fact that H2O2 could decompose sulfur-containing amino acids to generate .6,7 Taken together, the data indicate that probe 1 can be loaded into living cells and can be using as PL imaging probe for monitoring /H2O2 redox cycle processes.
Confocal fluorescence images of HeLa cells: the bright field images, fluorescent images, and overlay images. (a) HeLa cells were treated with 20 μM probe 1 for 30 min at 37 ℃. (b) HeLa cells were firstly pretreated with 20 μM probe 1 for 30 min at 37 ℃ and then incubated with 100 μM in non-serum cell culture mediums for 20 min at 37 ℃. (c) HeLa cells were firstly pretreated with 20 μM probe 1 for 30 min at 37 ℃ and then incubated with 100 μM in non-serum cell culture mediums for 20 min at 37 ℃ and then incubated with 100 μM H2O2 in non-serum cell culture mediums for 20 min at 37 ℃. All images were recorded using an excitation wavelength of 405 nm. Scale bar = 10 µm.
Conclusion
In summary, we presented the synthesis, characterization, and live-cell imaging applications of probe 1 as a new off–on–off PL probe for the detection of and H2O2 in aqueous solution and in living cells. Probe 1 features unique PL properties, including fast response time, good sensitivity, and selectivity. The detection limit was 10 μM and 20 μM for and H2O2, respectively. Moreover, probe 1 can be used to monitor /H2O2redox cycle processes in living cells. This result demonstrate that novel Ir(III) complex is promising in detection and imaging application for biological systems.
Supplemental Material
ASP861573 Supplemental Material - Supplemental material for Cyclometalated Iridium Complex as Off–On–Off Reversible Photoluminescence Probe for Redox Cycle /H2O2 in Living Cells
Supplemental material, ASP861573 Supplemental Material for Cyclometalated Iridium Complex as Off–On–Off Reversible Photoluminescence Probe for Redox Cycle /H2O2 in Living Cells by Hetong Qi, Xiaojia Zhao, Yuhai Tang, Manping Qian, Hongfang Gao and Honglan Qi in Applied Spectroscopy
Footnotes
Conflict of Interest
The author(s) declared no potential conflicts of interest with respect to the research, authorship, and/or publication of this article.
Funding
This work is supported by the National Natural Science Foundation of China (Nos. 21775097 and 21804106), the China Postdoctoral Science Foundation (No. 2017M620444), and the Fundamental Research Funds for the Central Universities (Nos. XJJ2018247 and GK201801006).
Supplemental Material
All supplemental material mentioned in the text is available in the online version of the journal.
References
1.
KobayashiH.OgawaM.AlfordR., et al.“New Strategies for Fluorescent Probe Design in Medical Diagnostic Imaging”. Chem. Rev. 2010. 110(5): 2620–2640.
T. Ferri, A. Poscia, R. Santucci. “Direct Electrochemistry of Membrane-Entrapped Horseradish Peroxidase. Part II: Amperometric Detection of Hydrogen Peroxide”. Bioelectrochem. Bioenerg. 1998. 45(2): 221–226.
4.
MillerE.W.AlbersA.E.PrellaA., et al.“Boronate-Based Fluorescent Probes for Imaging Cellular Hydrogen Peroxide”. J. Am. Chem. Soc. 2005. 127(47): 16652–16659.
5.
LambethJ.D.“Nox Enzymes and the Biology of Reactive Oxygen”. Nat. Rev. Immunol. 2004. 4(3): 181–189.
6.
FinkelT.HolbrookN.J.“Oxidants Oxidative Stress and the Biology of Ageing”. Nature. 2000. 408(6809): 239–247.
BaggaleyE.GillM.R.GreenN.H., et al.“Dinuclear Ruthenium(II) Complexes as Two-Photon, Time-Resolved Emission Microscopy Probes for Cellular DNA”. Angew. Chem. Int. Ed. 2014. 53(13): 3367–3371.
9.
SunY.Q.WangP.LiuJ., et al.“A Fluorescent Turn-On Probe for Bisulfite Based on Hydrogen Bond-Inhibited C=N Isomerization Mechanism”. Analyst. 2012. 137(15): 3430–3433.
10.
ChengX.JiaH.FengJ., et al.“‘Reactive’ Probe for Hydrogen Sulfite: Good Ratiometric Response and Bioimaging Application”. Sens. Actuators, B. 2013. 184: 274–280.
11.
LiuJ.B.YangC.KoC.N., et al.“A Long Lifetime Iridium(III) Complex as a Sensitive Luminescent Probe for Bisulfite Detection in Living Zebrafish”. Sens. Actuators, B. 2017. 243: 971–976.
12.
XuW.TeohC.L.PengJ., et al.“A Mitochondria-Targeted Ratiometric Fluorescent Probe to Monitor Endogenously Generated Sulfur Dioxide Derivatives in Living Cells”. Biomaterials. 2015. 56: 1–9.
13.
MillerE.W.BianS.X.ChangC.J.“A Fluorescent Sensor for Imaging Reversible Redox Cycles in Living Cells”. J. Am. Chem. Soc. 2007. 129(12): 3458−.
14.
ZhangW.LiuT.HuoF., et al.“Reversible Ratiometric Fluorescent Probe for Sensing Bisulfate/H2O2 and Its Application in Zebrafish”. Anal. Chem. 2017. 89(15): 8079–8083.
15.
ZhangY.J.GuanL.M.YuH., et al.“Reversible Fluorescent Probe for Selective Detection and Cell Imaging of Oxidative Stress Indicator Bisulfite”. Anal. Chem. 2016. 88(8): 4426–4431.
16.
LoK.K.W.“Luminescent Rhenium(I) and Iridium(III) Polypyridine Complexes as Biological Probes, Imaging Reagents, and Photocytotoxic Agents”. Acc. Chem. Res. 2015. 48(12): 2985−2995.
17.
MaD.L.NgH.P.WongS.Y., et al.“Iridium(III) Complexes as Reaction Based Chemosensors for Medical Diagnostics”. Dalton Trans. 2018. 47(43): 15278–15282.
18.
LytleF.E.“Solution Luminescence of Metal Complexes”. Appl. Spectrosc. 1970. 24(3): 319–326.
19.
MaD.L.LinS.WangW., et al.“Luminescent Chemosensors by using Cyclometalated Iridium(III) Complexes and Their Applications”. Chem. Sci. 2017. 8(2): 878–889.
20.
YouY.ChoS.NamW.“Cyclometalated Iridium(III) Complexes for Phosphorescence Sensing of Biological Metal Ions”. Inorg. Chem. 2014. 53(4): 1804–1815.
21.
WuC.LiuJ.B.LiG., et al.“Chemoselective Detection of Alkyl Halides via an Iridium(III) Luminescent Probe”. Dyes Pigments. 2018. 159: 479–482.
22.
TobitaS.YoshiharaT.“Intracellular and In Vivo Oxygen Sensing Using Phosphorescent Iridium(III) Complexes”. Curr. Opin. Chem. Biol. 2016. 33: 39–45.
23.
ZhouY.YoonJ.“Recent Progress in Fluorescent and Colorimetric Chemosensors for Detection of Amino Acids”. Chem. Soc. Rev. 2012. 41: 52–67.
24.
YanZ.WangJ.ZhangY., et al.“An Iridium Complex-Based Probe for Photoluminescence Lifetime Imaging of Human Carboxylesterase 2 in Living Cells”. Chem. Commun. 2018. 54(65): 9027–9030.
25.
LuL.WangM.MaoZ., et al.“A Novel Dinuclear Iridium(III) Complex as a G-Quadruplex-Selective Probe for the Luminescent Switch-On Detection of Transcription Factor HIF-1α”. Sci. Rep. 2016. 6: 22458–22466.
26.
LiG.ChenY.WangJ., et al.“A Dinuclear Iridium(III) Complex as a Visual Specific Phosphorescent Probe for Endogenous Sulphite and Bisulphite in Living Cells”. Chem. Sci. 2013. 4(12): 4426–4433.
27.
LiG.ChenY.WangJ., et al.“Direct Imaging of Biological Sulfur Dioxide Derivatives In Vivo Using a Two-Photon Phosphorescent Probe”. Biomaterials. 2015. 63: 128–136.
28.
GaoH.QiH.PengY., et al.“Rapid ‘Turn-On’ Photoluminescence Detection of Bisulfite in Wines and Living Cells with a Formyl Bearing Bis-cyclometalated Ir(III) Complex”. Analyst. 2018. 143(15): 3670–3676.
29.
ZhangJ.KangH.LiN., et al.“Organic Solid Fluorophores Regulated by Subtle Structure Modification: Color-Tunable and Aggregation-Induced Emission”. Chem. Sci. 2017. 8(1): 577–582.
Supplementary Material
Please find the following supplemental material available below.
For Open Access articles published under a Creative Commons License, all supplemental material carries the same license as the article it is associated with.
For non-Open Access articles published, all supplemental material carries a non-exclusive license, and permission requests for re-use of supplemental material or any part of supplemental material shall be sent directly to the copyright owner as specified in the copyright notice associated with the article.