
Abstract
We report updated infrared (IR) absorption measurements on vapor-deposited cryogenic parahydrogen (pH2) solids that indicate a ≈10% systematic error in our previous approach for determining a pH2 solid's thickness (S. Tam and M.E. Fajardo. Appl. Spectrosc. 2001. 55(12): 1634-1644). We provide corrected values for the integrated absorption intensities of the Q1(0)+S0(0) and S1(0)+S0(0) bands calculated over the 4495–4520 cm−1 and 4825–4855 cm−1 regions, respectively. New polarized IR absorption spectroscopy data demonstrate the insensitivity to polarization effects of the peak intensity of the QR(0) phonon sideband near 4228 cm−1. This feature provides an even quicker way for determining the thickness of a pH2 solid than via the integrated absorptions.
Keywords
Introduction
We previously promulgated a method for determining the thicknesses of cryogenic parahydrogen (pH2) solids from their infrared (IR) absorption spectra. 1 We have also espoused the advantages of solid pH2 as a “host” for matrix isolation spectroscopy in which impurity “dopants” are deliberately introduced into the matrix host. 2 For example, the excellent optical clarity of pH2 solids produced by rapid vapor deposition (RVD)3,4 permits quantitative absorption measurements on even millimeters-thick samples. These long optical path lengths enable working at a few parts-per-million (ppm) dopant concentrations, for which dopant–dopant interactions are minimized. Systematic studies of phenomena such as dopant clustering and intramolecular energy transfer can then be performed by methodically increasing the dopant concentrations. Extracting accurate dopant concentrations from absorption spectra via Beer's Law5,6 requires accurate knowledge of the matrix host thickness.
In the course of our solid pH2 studies, we upgraded to a different Fourier transform IR (FT-IR) spectrometer and discovered that the method presented by Tam and Fajardo 1 systematically over-predicts pH2 sample thicknesses by ≈10%. In what follows, we discuss the nature of this error, report corrected values for the intrinsic intensities of the relevant solid pH2 absorptions, and present an even simpler sample thickness determination approach based on the peak intensity of a nearby solid pH2 absorption.
Experimental
We produce our pH2 solids by direct in-vacuum deposition, onto a liquid helium cooled cryogenic substrate, of pre-cooled pH2 gas flowing from an ortho-topara (O/P) hydrogen converter.4,7 We typically operate the O/P converter near T ≈ 14 K, i.e., just above the pH2 triple point, resulting in residual oH2 concentrations below ≈100 ppm.
The experiments described herein were performed in two separate laboratories: one at Edwards Air Force Base (AFB), California, and the other at Eglin AFB, Florida. They are distinguished primarily by the exclusive use of optically transparent deposition substrates (e.g., BaF2 and CsI windows) in the Edwards AFB experiments1–4 versus the exclusive use of a reflective (gold-coated copper mirror) deposition substrate in the Eglin experiments.7–9 Accordingly, the Edwards AFB IR measurements all utilize a simple single-pass transmission geometry (IR beam incident along the substrate surface normal), whereas the Eglin spectra are acquired in a reflection/absorption geometry (IR beam incident at 45° to the substrate surface normal) which double-passes the pH2 sample.
We report our IR data as decadic absorbance spectra versus wavenumber,


The sample thickness measurements reported by Tam and Fajardo 1 were based on IR spectra recorded at Edwards AFB using a Mattson Nova Cygni FT-IR spectrometer equipped with a liquid nitrogen (lN2) cooled HgCdTe detector. As discussed by Tam and Fajardo, 1 this detector was overdriven by the high-incident IR intensity, raising concerns about the effects of nonlinear detector response.10,11 This prompted supplemental measurements on the ν1+ν4 combination band of liquid CHCl3 near 4200 cm−1, which reassuringly showed a linear absorption response versus sample cell path length. Unfortunately, this well-intentioned approach failed to detect a ≈10% systematic spectrometric error. As noted without supporting data by Fajardo, 2 this error was discovered years later during the analysis of solid pH2 spectra obtained with a Bruker IFS120HR FT-IR spectrometer equipped with an lN2 cooled InSb detector with superior linearity characteristics.
A horizontal section through the Edwards sample deposition chamber is shown in Fig. 1 of Tam and Fajardo.
1
The delivery tube for the cold pH2 gas makes a 45° angle to the deposition substrate surface normal and terminates ≈3 cm from the substrate center. Most of the pH2 gas condenses on the “front” side of the cold deposition window facing the delivery tube; however, a small fraction condenses on the opposite “back” side. The total solid pH2 thickness interrogated by the IR beam is thus the sum of the thicknesses of these two deposits
IR absorption spectrum of an as-deposited pH2 solid at T = 2.2 K; recorded in the Eglin reflection geometry and presented at 0.1 cm−1 resolution. The net optical path length through the nominally 8 ppm CH4/pH2 solid is ℓEglin = 1.2 mm.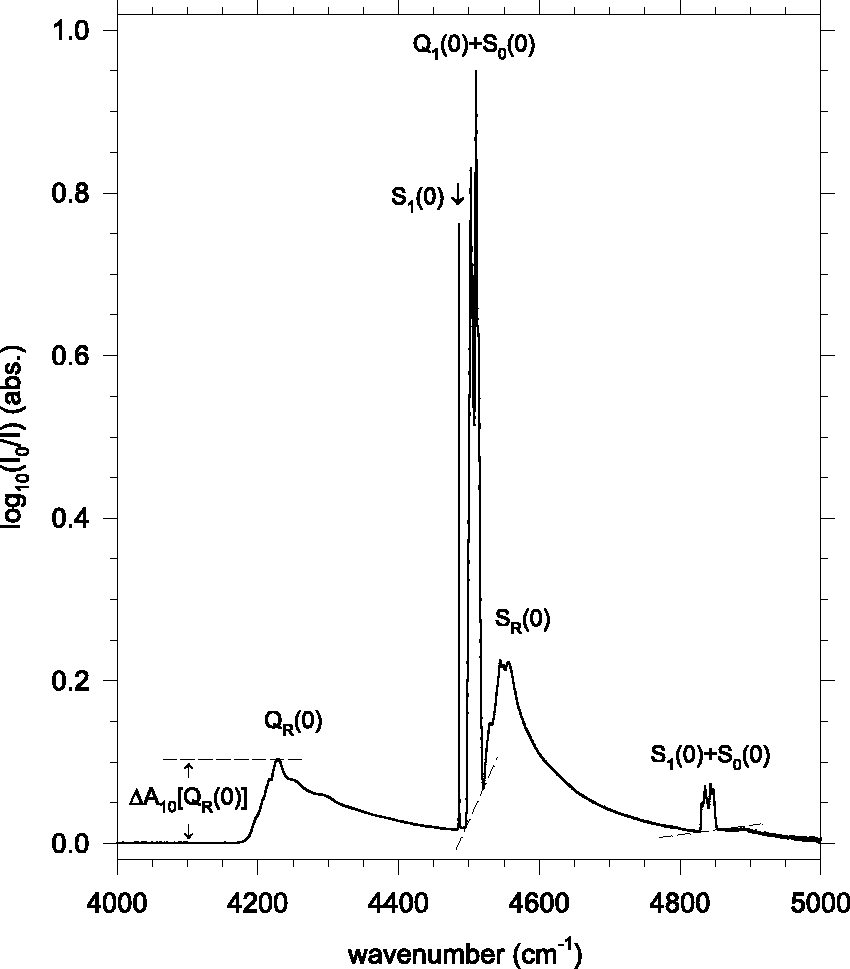

Both of these deposits grow to produce non-planar (e.g., convex or wedged) solids. However, as shown in Fig. 7 of Tam and Fajardo,
1
for very thin samples the accreting pH2 surfaces remain sufficiently parallel to the deposition window to produce transmission interference fringes in the IR spectra. These features can be analyzed to yield the interferometric film thicknesses, d
Int
, using
6

A perspective sketch of the Eglin sample deposition chamber is shown in Fig. 3 of Molek et al.
7
In this case, the pH2 flow is incident from just below the surface normal of the vertically oriented reflective substrate. The incident and reflected IR beams make 45° angles to the surface normal, in a horizontal plane parallel to the optical table top. We use matched pairs of removable grid-type polarizers in the incident and reflected IR beams to perform Polarized IR Absorption Spectroscopy (PIRAS) measurements.2,7–9 Filters oriented to pass horizontally polarized light (i.e., in the plane of reflection) correspond to the so-called p polarization of the IR beam, whereas vertical polarization corresponds to s polarization.
14
We construct s-p PIRAS spectra as the difference between the decadic absorbances measured for the s and p polarizations
Correlation plots of 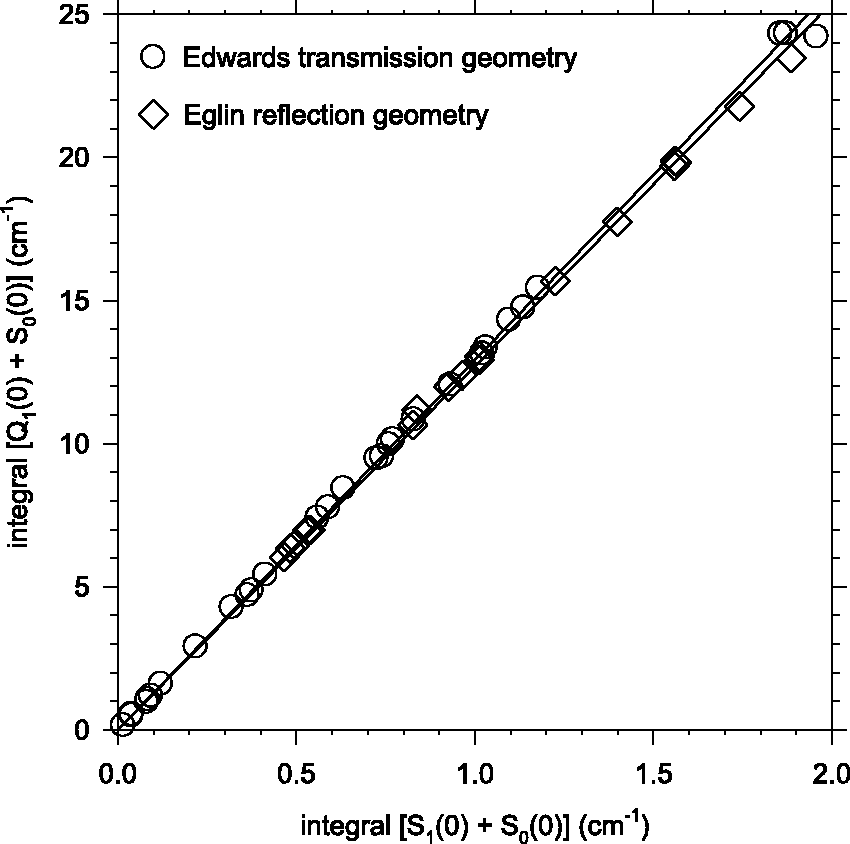

This PIRAS capability has proven valuable in resolving problems arising from unanticipated polarization effects in nominally “unpolarized” IR measurements. 8 Our RVD pH2 samples condense as polycrystalline solids, including metastable face-centered cubic (fcc) and thermodynamically stable hexagonal close-packed (hcp) regions. 2 Annealing to T > 4 K for a few minutes results in the irreversible conversion of the fcc regions to the hcp structure, and to a considerable degree of alignment of the hcp crystallites' unique c-axes with the substrate surface normal. 2 Since even a nominally “unpolarized” IR beam is transversely polarized with respect to its propagation direction, the Edwards geometry results in a strong bias against detecting absorptions with transition moments parallel to the hcp crystallites' c-axes. This caused us to not observe the crystal field splittings of several rovibrational lines of water monomers isolated in pH2 solids, an error we resolved using PIRAS data. 8 We anticipate related difficulties in comparing solid pH2 spectra obtained in different laboratories employing different optical arrangements, and so use the PIRAS capability to identify robust absorption features with minimal polarization dependences.
In the Eglin apparatus, the incident IR beam is refracted at the vacuum:solid pH2 interface causing it to bend towards the surface normal to an internal angle, θ
i
, given by Snell's Law
14


As before, IR spectra of the thinnest samples show transmission interference fringes, and the interferometric thickness can be calculated using θ = 38.3° in Eq. 4.
Results and Discussion
Figure 1 shows a survey spectrum of the relevant solid pH2 IR absorptions, which originate from intermolecular interactions between the pH2 molecules.15–17 The standard spectroscopic notation “L v (J)” labels rovibrational transitions to vibrational level v, originating from v = 0 and rotational level J; with L = Q and S for ΔJ = 0 and +2, respectively. 18 Three different classes of absorption features are apparent: (1) sharp zero-phonon “single transitions” such as the S1(0) peak near 4486 cm−1, (2) somewhat broader zero-phonon “double transitions” including our featured Q1(0)+S0(0) and S1(0)+S0(0) bands, and (3) broad blue-degraded phonon sidebands such as the SR(0) band associated with the S1(0) peak (here the “R” subscript indicates the creation of one or more phonons in the absorption process).
As discussed by Tam and Fajardo, 1 in highly symmetrical environments the net intermolecular interactions leading to the single transitions are subject to the “cancellation effect,” and so the observed intensities of these features depend strongly on the symmetries of the sites occupied by the pH2 molecules. This makes them unsuitable for sample thickness determinations in our variable mixed composition fcc/hcp pH2 solids.
The double transitions are immune to the cancellation effect, and the intensities of the Q1(0)+S0(0) and S1(0)+S0(0) bands depend mainly on the number density of pH2–pH2 pairs in the solid. Since the bulk densities of fcc and hcp pH2 solids are the same, and pH2 molecules in the two structures share the same number of nearest neighbors (i.e., 12), the double transitions are well suited for sample thickness determinations. We abbreviate the Q1(0)+S0(0) and S1(0)+S0(0) bands as Q+S and S+S, respectively. Because they both overlap the SR(0) phonon sideband, we define their integrated band intensities using sloping line segment baselines joining the integration endpoints. For the Q+S and S+S features, these integration regions are: 4495–4520 cm−1 and 4825–4855 cm−1, respectively. We further abbreviate the integrated absorption intensities as:
The broad feature marked “QR(0)” is the phonon sideband of the IR-silent Q1(0) single transition. The Q1(0) peak is absent in both fcc and hcp pH2 crystals due to the cancellation effect. We define the peak height of the QR(0) feature as

Figure 2 shows PIRAS spectra of the QR(0) phonon sideband for an annealed pH2 solid, which consists primarily of hcp crystallites aligned with the substrate surface normal. The QR(0) s-p PIRAS spectrum for the same as-deposited sample (not shown) exhibits negligible polarization dependence, with A10( Polarization dependence of the QR(0) phonon sideband in an annealed pH2 solid at T = 2.2 K; recorded in the Eglin reflection geometry and presented at 1.0 cm−1 resolution. The net optical path length through the nominally 6 ppm NO/pH2 solid is ℓEglin = 4.1 mm.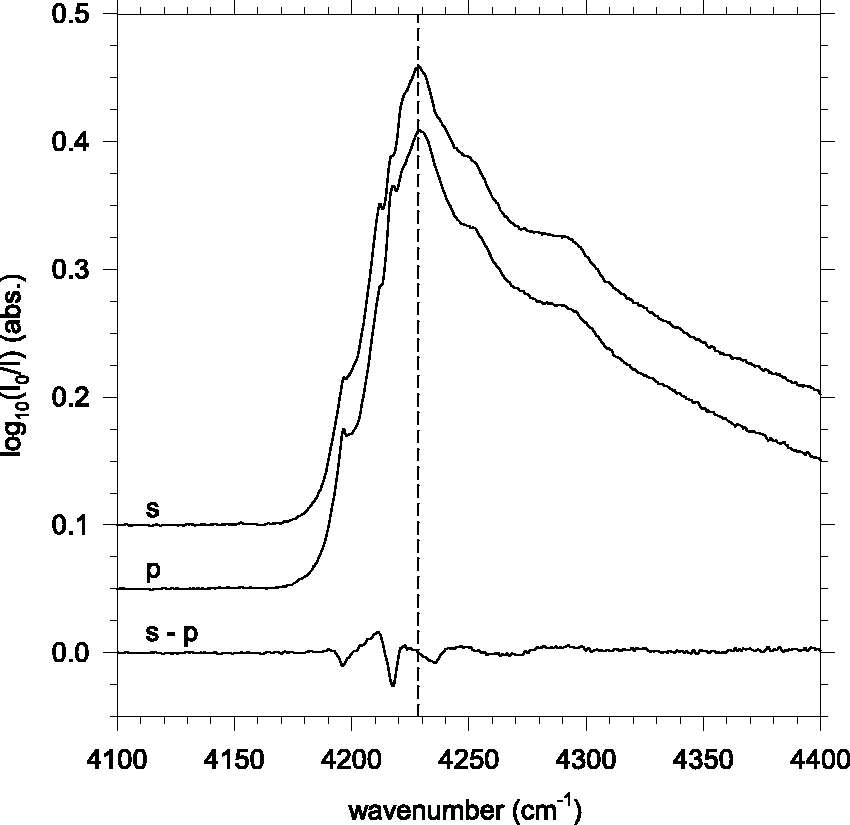
Parameters for solid pH2 thickness determinations.
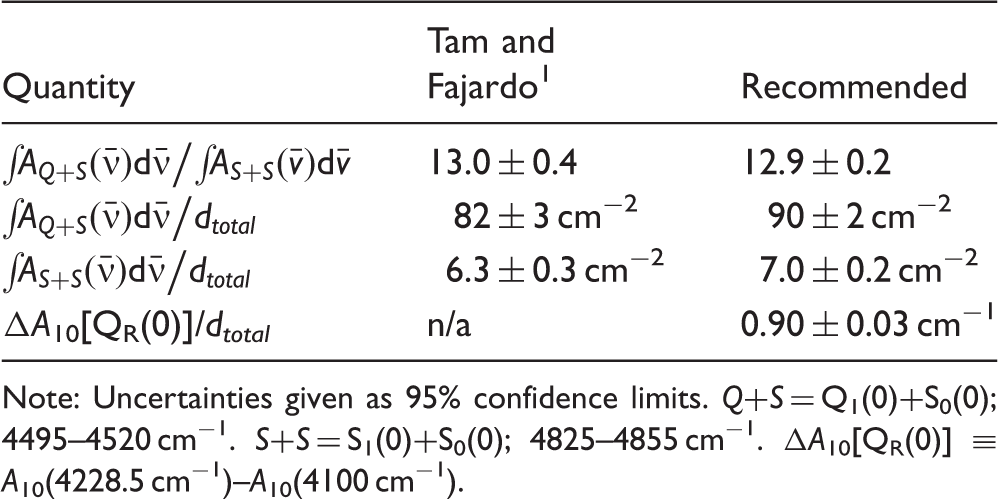
Note: Uncertainties given as 95% confidence limits. Q+S = Q1(0)+S0(0); 4495–4520 cm−1. S+S = S1(0)+S0(0); 4825–4855 cm−1. ΔA10[QR(0)] ≡ A10(4228.5 cm−1)–A10(4100 cm−1).
Figure 4 shows a correlation plot of the integrated intensity of the Q+S band versus the net optical path length through both front and back side pH2 deposits produced in the Edwards transmission geometry. Included are data from the six pH2 samples for which both d
front
and d
back
can be determined directly from transmission interference fringes in the IR spectra (cf. Fig. 7b in Tam and Fajardo
1
). The slope of the unweighted least squares best-fit straight line constrained to pass through the origin is 0.00902 cm−1/μm. The unweighted mean of the quotient Correlation plot of 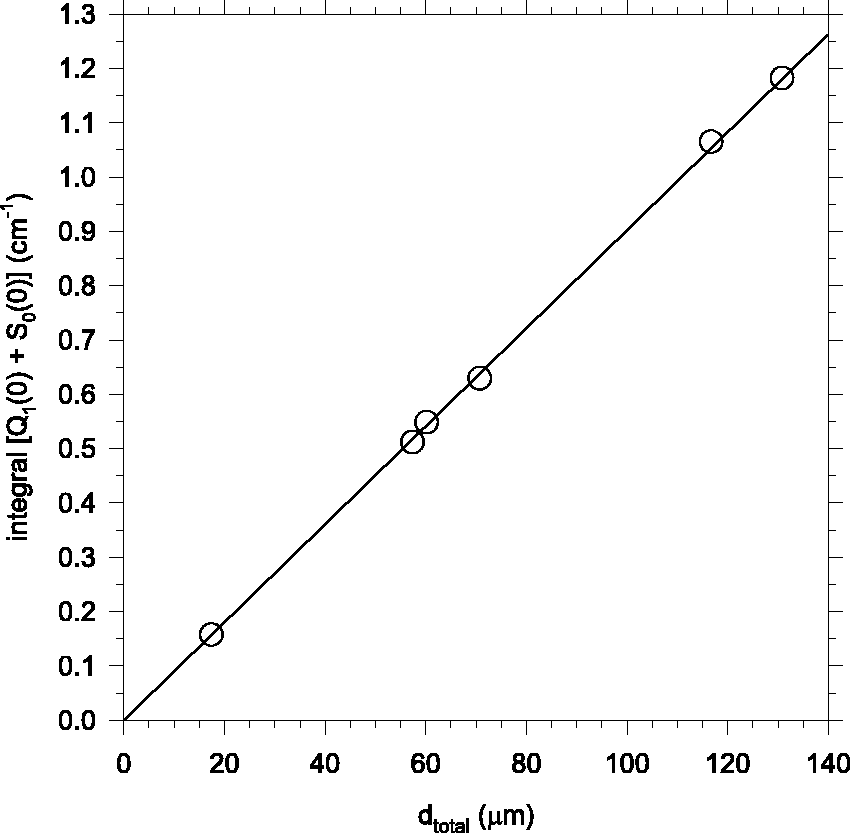
We can also analyze the six experiments represented in Fig. 4 to determine the ratio of the thicknesses of the front and back side deposits. The unweighted mean of the quotient d
front
/d
back
is μ = 6.9(0.3). This is a considerable change from the value of “11.5” reported by Tam and Fajardo
1
for the Mattson FT-IR setup, which we attribute to sampling a different (offset) optical path through the wedged pH2 deposits with the Bruker FT-IR setup. We can use this ratio to estimate d
front
(e.g., for use in Beer's Law dopant concentration calculations) from interferometric measurements of d
back
and from spectroscopic measurements of d
total
using

Finally, Fig. 5 shows a correlation plot of d
total
calculated from Correlation plot of d
total
vs. ΔA10[QR(0)] for as-deposited pH2 solids in the Edwards transmission geometry.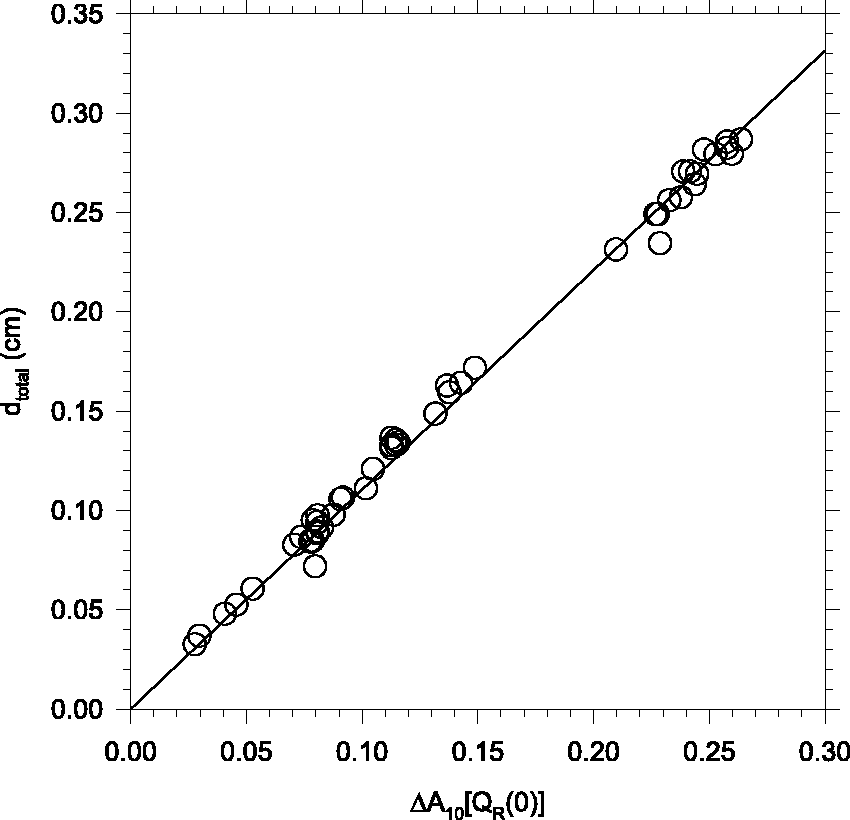
Conclusion
We identify and correct a ≈10% systematic error in our previous approach
1
for determining a pH2 solid's thickness based on integrating the Q1(0)+S0(0) and S1(0)+S0(0) absorption features. We identify the height of the QR(0) peak absorption as an alternative convenient proxy for the pH2 thickness, and one likely to be robust against polarization-dependent measurement artifacts. Thus, we provide three approaches for calculating the total thickness of solid pH2 in the optical path


Footnotes
Acknowledgments
MEF thanks his coworkers on various solid pH2 projects—at Edwards AFB: Mr. S. Tam, Ms. M.E. DeRose, and Dr. M. Macler; at Eglin AFB: Dr. C.M. Lindsay and Dr. C.D. Molek. Approved for Public Release; Distribution Unlimited (96TW-2019-0165).
Conflict of Interest
The author declared no potential conflicts of interest with respect to the research, authorship, and/or publication of this article.
Funding
The author received no financial support for the research, authorship, and/or publication of this article.