






Abstract
Imaging fluorescence spectroscopy proves to be a fast and sensitive method for measuring the thickness of thin coatings in the manufacturing industry. This encouraged us to systematically study, theoretically and experimentally, parameters that influence the fluorescence of thin layers. We analyzed the fluorescence signal as a function of the scattering and reflectance properties of the sample substrate. In addition, we investigated effects of the layer properties on fluorescence emission. A ray-tracing software is used to describe the influence of these parameters on the fluorescence emission of thin layers. Experiments using a custom-made system for imaging fluorescence analysis verify the simulations. This work shows a factor five variation of fluorescence intensity as a function of the reflectance of the sample substrate. Simulations show variations by a factor of up to eight for samples with different surface roughness. Results on tilted samples indicate a significant increase of the detected fluorescence signal, for fluorescent droplets on reflective substrates, if illuminated and coaxially observed at angles greater than 25°. These findings are of utmost relevance for all applications which utilize the fluorescence emission to quantify thin layers. These applications range from in-line lubricant monitoring in press plants to monitoring of functional coatings in medical technology and the detection of filmic contaminations.
Keywords
Introduction
The analysis of fluorescence emission for the sensitive detection of thin layers is widely used in research as well as industrial applications.1,2 Fluorescence spectroscopy, for example, is a recognized method for the detection of oil spills on the sea surface.3–5 These systems are installed on airplanes. Components used in these setups are expensive and not suitable for industrial applications. Only due to the availability of robust, cost-efficient laser diodes in combination with components for fast and reliable data acquisition in recent years, the development of measurement systems that meet the requirements on robustness as well as spatial resolution, speed and sensitivity to monitor coatings in industrial processes became possible.
A promising industrial application is the in-line measurement of lubricant layers for example in industrial forming processes.6,7 Recent publications describe the possibilities for the use of lubrication sensors for the data-driven control of complex production processes, for example in car body parts stamping processes. According to these publications, the amount of lubricant affects the friction and thus plays an important role in the deep drawing process of sheet metals.8,9 Using scanning mirrors in combination with laser induced fluorescence allows for the first time to monitor the spatial distribution of lubricant on 100% of the metal sheets surface with strip speeds of several meters per second. 7 For typical lab applications of fluorescence spectroscopy, well-defined smooth surfaces, such as microscope slides or glass cuvettes, are used as substrate material under the fluorescent layer. For the detection of oil spills the normalization of the fluorescence signal to the signal of the Raman scattering in water is suggested. 3 In industrial forming processes, the lubricant layer to be quantified can be applied on a huge variety of different metal types. Therefore, detailed knowledge of the parameters that influence the fluorescence emission is required in order to determine the thickness of the lubricant layer by laser-induced fluorescence.
The basic dependence of the fluorescence signal on film thicknesses is well described in literature.
10
For thin layers, the power of the fluorescence emission is directly proportional to the power of the excitation light P0 and the optical pathlength l inside the fluorescent media. Considering a fluorescence layer on top of any substrate, reflection as well as scattering on the substrate surface influences the optical pathlength l and therefore the fluorescence emission
This effect has already been shown in experiments. One application of this effect is the amplification of weak signals inside a fluorescence spectrometer by using custom-made mirror-coated cuvettes. 11 For the measurement of oil-film thickness using laser-induced fluorescence in a piston-ring model experiment, it is suggested that the reflectance of the optical background must be taken into account during calibration of the measurements. 1 Whereas the influence of the texture of automotive steel on the fluorescence signal of lubricant oil applied on these surfaces has been described before, no detailed physical model explaining this effect has been published yet.7,12
The increased need for reliable in-line measurements of fluorescent coatings encouraged us to systematically study the influence of scattering and absorption properties of the sample substrate and layer properties like droplet shape on the fluorescence signal. For the first time, simulations are used to explain experimental findings on the fluorescence emission in thin lubricant layers as well lubricant droplets.
The ultimate aim of our study is to identify the parameters and their influence on the fluorescence emission of fluorescent layers coated on surfaces of industrial products.
Theory
According to the Beer–Lambert Law, incident light with the power P0 is attenuated proportionally to the optical pathlength l of an absorbing layer and the attenuation coefficient α of the medium at the wavelength of the incident light. Therefore, the power of the absorbed light Pabs over a certain optical pathlength l is described by Eq. 1.
In general, for low absorbance values αl ≪ 1 the first term of the Taylor series can be used as valid approximation for the exponential term in Eq. 1.
Application of Eq. 2 on Eq. 1 leads to the linear relation between the power of the absorbed light Pabs and the optical pathlength l.
The quantum yield Q is defined as the ratio of the number of emitted photons to the number of absorbed photons. The power of the fluorescence emission Pem is directly proportional to the power of the absorbed light Pabs, the quantum yield Q and the loss of power due to the Stokes shift between the excitation wavelength λex and emission wavelength λem.
Absorption
As described in Eq. 4 the fluorescence intensity is directly proportional to the light absorbed. For the correct interpretation of fluorescence signals, detailed knowledge of the power and the optical pathlength l of the excitation light inside a fluorescent layer is crucial. Figure 1 illustrates the optical effects influencing the power of the absorbed light.
Schematic drawing of the influences on the propagation of the excitation light Pex as well as the fluorescence emission Pem inside a fluorescent layer on top of a substrate with reflectance RLS.
As illustrated in Fig. 1 refraction as well as reflection occurs at the interface between air and fluorescent layer. The change of the direction of light due to refraction can be described using Snell’s law.
13
In reference to Fig. 1 (left) the angle
For a constant layer thickness d, the optical pathlength l increases with increasing angle of incidence as visualized in Fig. 1 (left). This geometrical relation is inversely proportional to the cosine of the angle θt.
The optical pathlength l inside the fluorescence layer follows Eq. 7 that combines Eqs. 5 and 6.
Furthermore, it is known that a certain portion of light is reflected on an interface between media with different refractive indexes. The reflection and transmission of electromagnetic radiation as a function of refractive indexes, polarization as well as angle of incident can be described by the Fresnel equations.
13
Since this effect depends on the polarization of the incident light, the power Pex of the light has to be split into the portion Pex,p, which is polarized parallel to the plane of incidence, as well to the portion Pex,s, which is polarized perpendicular to the plane of incidence. In our case the transmittance TAL, which describes the portion P0 of the light transmitted into the fluorescent layer, can be described by Eqs. 8 and 9.
Figure S1 (Supplemental Material) shows a plot of the transmittance T as function of the angle of incidence θi for layers with an refractive index of nlay = 1.49. The portion TAL,p of the power of the excitation light Pex transmitted into the fluorescent layer decreases to 91% at an angle of incident of θi = 45° for p-polarized light. In contrast, for s-polarized light the portion TAL,s increases to 99% at an angle of incident of θi = 45°. For the reverse ray direction from fluorescent layer to air, 100% of the p-polarized fluorescence light striking the interface at the so-called Brewster's angle is transmitted out of the fluorescent layer. The Brewster's angle for the assumed refractive index of nlay = 1.49 is θ = 34°. In contrast, total internal reflection of the excitation as well as fluorescent light occurs at angles larger than the critical angle of θc = 42°.
In the case of lubricant droplets it has to be considered that the angle of incidence θi varies for each position on the curved droplet surface. Due to these complex geometrical calculations, we used a ray tracing software for implementing the above equations.
As illustrated in Fig. 1 (left) the excitation light is reflected at the substrate’s surface after propagating through the absorptive layer. The reflectance RLS describes the portion of the excitation light reflected at the substrate. Some portion of this reflected light is reflected at the interface between layer and air. The reflectance RAL can be determined by reversing the direction of propagation in Eqs. 6 and 7. Due to the conservation of energy, the reflectance RAL is determined by one minus the transmittance TAL.
These multiple reflection of the excitation light leads to an increase of the optical pathlength and therefore to an increase of the power of the absorbed light Pabs. Therefore, for low absorbance values αl ≪ 1, Eq. 3 has to be extended in view of these multiple reflections.
Emission
In general, the emission characteristics of fluorophores can be assumed as isotropic. As illustrated in Fig. 1 (right) the power of the emitted fluorescence light
The two other portions of the power are emitted in angles larger than the critical angle θc. For perfectly homogeneous layers on plane substrates, total internal reflection occurs for this portion of the emitted fluorescence light. This portion
As previously described for the excitation light, some portion of the power Pem,LA of the light emitted towards the interface between layer and air, respectively of the power Pem,Ls of the light emitted towards the substrate’s surface, gets reflected multiple times. According to Eqs. 13 to 15, the power of the fluorescence light Pfluo emitted outside the fluorescent layer can be described as a function of the reflectance
According to the Fresnel equations, both reflectance values depend on the angle of incidence a well as polarization. Due to the isotropic emission of the fluorophores, an average reflectance value for all angles between 0° and the critical angle θc can be assumed for Eqs. 13 to 15. Assuming a refractive index of nlay = 1.49 leads to a critical angle of θc = 42°. For orthogonal illumination with θi = 0° the transmittance is TAL,0° = 0.96 for excitation light striking the interface of the fluorescent layer. The average reflectance for angles lower the critical angle is RLA,<42° = 0.07. Assuming these values leads to an increase of the power of the emitted fluorescence light Pfluo by a factor of 4.5 between a substrate reflectance of RLS = 0 and RLS = 1.
In practice, the power Pdet reaching the detector can be described by introducing a geometry factor g that defines the portion of the emitted fluorescence light Pfluo that reaches the detector.
Influence of Substrate Texture
As shown before, the propagation of both the excitation as well as the fluorescence light inside the fluorescent layer influences the power of the emitted fluorescent light. In this paper, we use the so-called angle resolved scatter function (ARS) for the description of scatter properties. The ARS
14
is defined as the power Pscatter scattered into the solid angle Ω normalized to the incident power Pincident.
We use a Gaussian scatter model provided by the ray tracing software Zemax in order to simulate the effects caused by scattering of light at the substrate material. In this model, the scatter distribution contains a dimensionless value σ, which determines the width of the Gaussian distribution of the direction of scattered rays. Values of σ greater than about 5.0 lead to a scatter behavior that is nearly Lambertian. 15 Examples of the scatter behavior for different values of σ are given in the result section.
Experimental
Material
As fluorescent substance, we used the industrial forming oil Multidraw KTL N 16 by Zeller + Gmelin. An Abbe refractometer was employed to determine the refraction index of typical lubricant oils. A double-beam absorption spectrometer (Perkin Elmer, Lambda 900) was used to obtain the attenuation coefficient α(λ) of the lubricant.
The oil was applied on different mirrors in order to realize different substrate reflectances: a dielectric mirror (Thorlabs BBSQ2-E02), an aluminum mirror (Thorlabs ME2S-G01), a gold mirror (Thorlabs ME2S-M01) as well as an absorptive glass (Thorlabs NE260B). Different surface textures were achieved by polishing aluminum samples as well as by glass bead blasting with differently sized glass beads, which were obtained from MHG Strahlanlagen GmbH. A 3D confocal microscope (Keyence, VK 9700) was used to determine the surface roughness of the aluminum samples.
Sample Preparation
In this paper, three methods for sample preparation were applied. We used a previously described 16 thin-layer cuvette to analyze the effect of different substrate reflectances on homogenous oil layers. This cuvette enables the preparation of liquid layers with thicknesses ranging from 20 to 250 µm. To this end, laser cut spacers were placed between a background substrate and a quartz glass slide. In order to stay in the linear range of the absorbance, typical cuvette thicknesses used were in the range of 40 µm. Before filling the cuvette, the actual cuvette thickness was measured using the 3D confocal microscope.
Lubricant was applied directly on the polished and glass bead blasted aluminum samples in order to analyze the influence of different surface textures. The quantity of lubricant applied was determined using a high-resolution balance (Sartorius, MSE225P-100-DU). After lubricant application, a quartz glass window was applied on the droplet to realize a plane lubricant film. The lateral size of the lubricant was determined directly in the fluorescence image. With knowledge of the area coated with lubricant and the weight of the lubricant layer, the average thickness of the fluorescent layer was estimated by using the volumetric mass density of the lubricant oil.
As described in a previous publication, 7 we use a spray unit to apply oil droplets on different substrates. To adjust the area density of lubricant on the surface, the substrate is moved through the oil dust several times at different speeds. The amount of oil sprayed on the surface is determined using a high-resolution balance. Again, the average thickness of the fluorescent droplets is estimated on the basis of the volumetric mass density of the lubricant oil. The contact angle of the oil droplets was determined by means of a drop shape analyzer (Krüss, EasyDrop).
Fluorescence Measurements
We used a previously described 17 optical scanner system to acquire the fluorescence images analyzed in the experimental section of this work. Figure S2 (Supplemental Material) shows the instrumental setup. The optical system of the fluorescence laser scanner is installed 300 mm above the bottom of a sample chamber. The field of view of the system is 300 × 300 mm2. The laser scanner uses a 405 nm diode laser module for the fluorescence excitation. During a scan, the excitation laser induces fluorescence locally on the probe inside the sample chamber. A certain portion of the fluorescence emission excited by the laser is coaxially collected back by the scanning mirrors. A chromatic beam splitter is used to deflect the fluorescence light in a wavelength range from 420 to 520 nm on a detector. The fluorescence signals are detected by a photomultiplier module. As previously described,7,17 the good depth of focus of the coaxial detection and the large field of view enables the use of the described instrumental setup for industrial applications as described in the introduction.
To allow the comparison between measurement systems with different geometry factors g, we normalize all florescence signals to the signal emitted by a solid material fluorescence standard (Labsphere, Type USFS 461).
To realize different angles of incident θi, the samples were placed on a goniometer stage inside the sample chamber of the fluorescence laser scanner used in this work. The electrical field of the excitation laser was aligned parallel to the front of the sample chamber. Thus, the effect of different polarizations can be analyzed by aligning the sample stage parallel and orthogonal to the front of the sample chamber.
Simulation
We used the non-sequential mode of the ray tracing Software ZEMAX for simulations. For simplification, the simulations use only two wavelengths. The excitation light was implemented as rays at 405 nm. The fluorescence light was implemented as rays at 450 nm. Two types of samples were implemented in the simulation: A fluorescent layer as “rectangular volume” object and fluorescent droplets as “standard lens” objects. For the implementation of variable substrate reflectivity, ideal coatings in the range of 0 to 100% reflectance were assigned to the droplet’s substrate. ZEMAX Macro language was used to automatically simulate different setups, e.g., to automatically analyze the total power of all emitted fluorescent rays as a function of sample tilts as well reflectance for a given droplet shape.
To distinguish between effects based on the amount of absorbed light
In order to analyze the emission characteristics of differently shaped droplets, a so called “source object” was assigned to the fluorescent layers. Zemax implements “source objects” as sources defined by the size and shape of their parent object. Rays are spatially distributed uniformly inside the volume of the parent object. The angular distribution of the rays was set to be isotropic, which means they are emitted in all directions with equal probability. A “detector polar object” was implemented for detecting these emitted “fluorescence rays” outside the droplets.
In the third type of simulation fluorescence emission was implemented by assigning scattering properties to the fluorescent materials. ZEMAX allows the definition of a wavelength shift in combination with a scattering angle of 180°. For illumination, again, a “source ellipse” object directs rays towards the sample. The “scattered fluorescence rays,” again, were detected by means of a “detector polar object”. To prevent the detection of reflected excitation light, a long pass filter, which uses the ZEMAX table coating definition, was implemented. Figure S3 (left, Supplemental Material) shows the principle setup of this simulation.
Results and Discussion
To evaluate our theory on the influence of different parameters on the fluorescence emission of thin layers, we first determined the optical properties of the lubricant used in this study. The refractive index of the lubricant KTL N 16 was determined to
The reflectivity of the mirrors used in the experiments is assumed as RLS = 0.99 for the dielectric mirror, RLS = 0.89 for the aluminum mirror, RLS = 0.28 for the gold mirror and RLS = 0.04 for the absorptive glass. The contact angle for droplets of KTL N 16 on glass was determined to (18 ± 3)°. Figure S5 shows an exemplary image of a lubricant droplet acquired by the drop shape analyzer.
Influence of Substrate Reflectance
Figure 2 compares the fluorescence signals for lubricant droplets sprayed on different substrate materials. As described in the Experimental section, the fluorescence signals are normalized to the emission of the solid fluorescence standard USFS 461. As shown in Fig. 2 (top) the fluorescence intensity increases with increasing area densities ρ
A
of lubricant sprayed on the surfaces. In the fluorescence images exemplarily shown in Fig. 2 (top right), this increase in fluorescence signal as well as number of lubricant droplets per area is clearly visible. The average thickness of the fluorescent droplets can be estimated using the volumetric mass density of the lubricant oil. Assuming a volumetric mass density of the lubricant of ρ = 900 kg/m3, the average thickness of the lubricant layer is d = 3.3 µm for an area density of ρA = 3 g/m2. As expected in Eq. 3 the fluorescence signal shows a linear behavior in this thickness range. The continuous lines in Fig. 2 (top) visualize the liner fit functions applied on the original data. The slopes of the fluorescence signal as function of area density ρ
A
of the lubricant KTL N 16 are 0.43%/(g/m2) for aluminum, respectively 0.20%/(g/m2) for gold and 0.10%/(g/m2) for an absorptive filter glass as substrate material.
Influence of the substrate’s reflectance RLS on the detected fluorescence signal Pdet. Experimental results for the detected fluorescence signal Pdet as function of the area density of lubricant droplets applied on different substrates (top). Comparison of the results of the theory presented in Eq. 13 (dashed line) with the results of the ray tracing simulation (blue squares) as well as experiments (orange circles) (bottom). The diagrams show the results for fluorescent droplets (bottom left) as well as fluorescent layers (bottom right).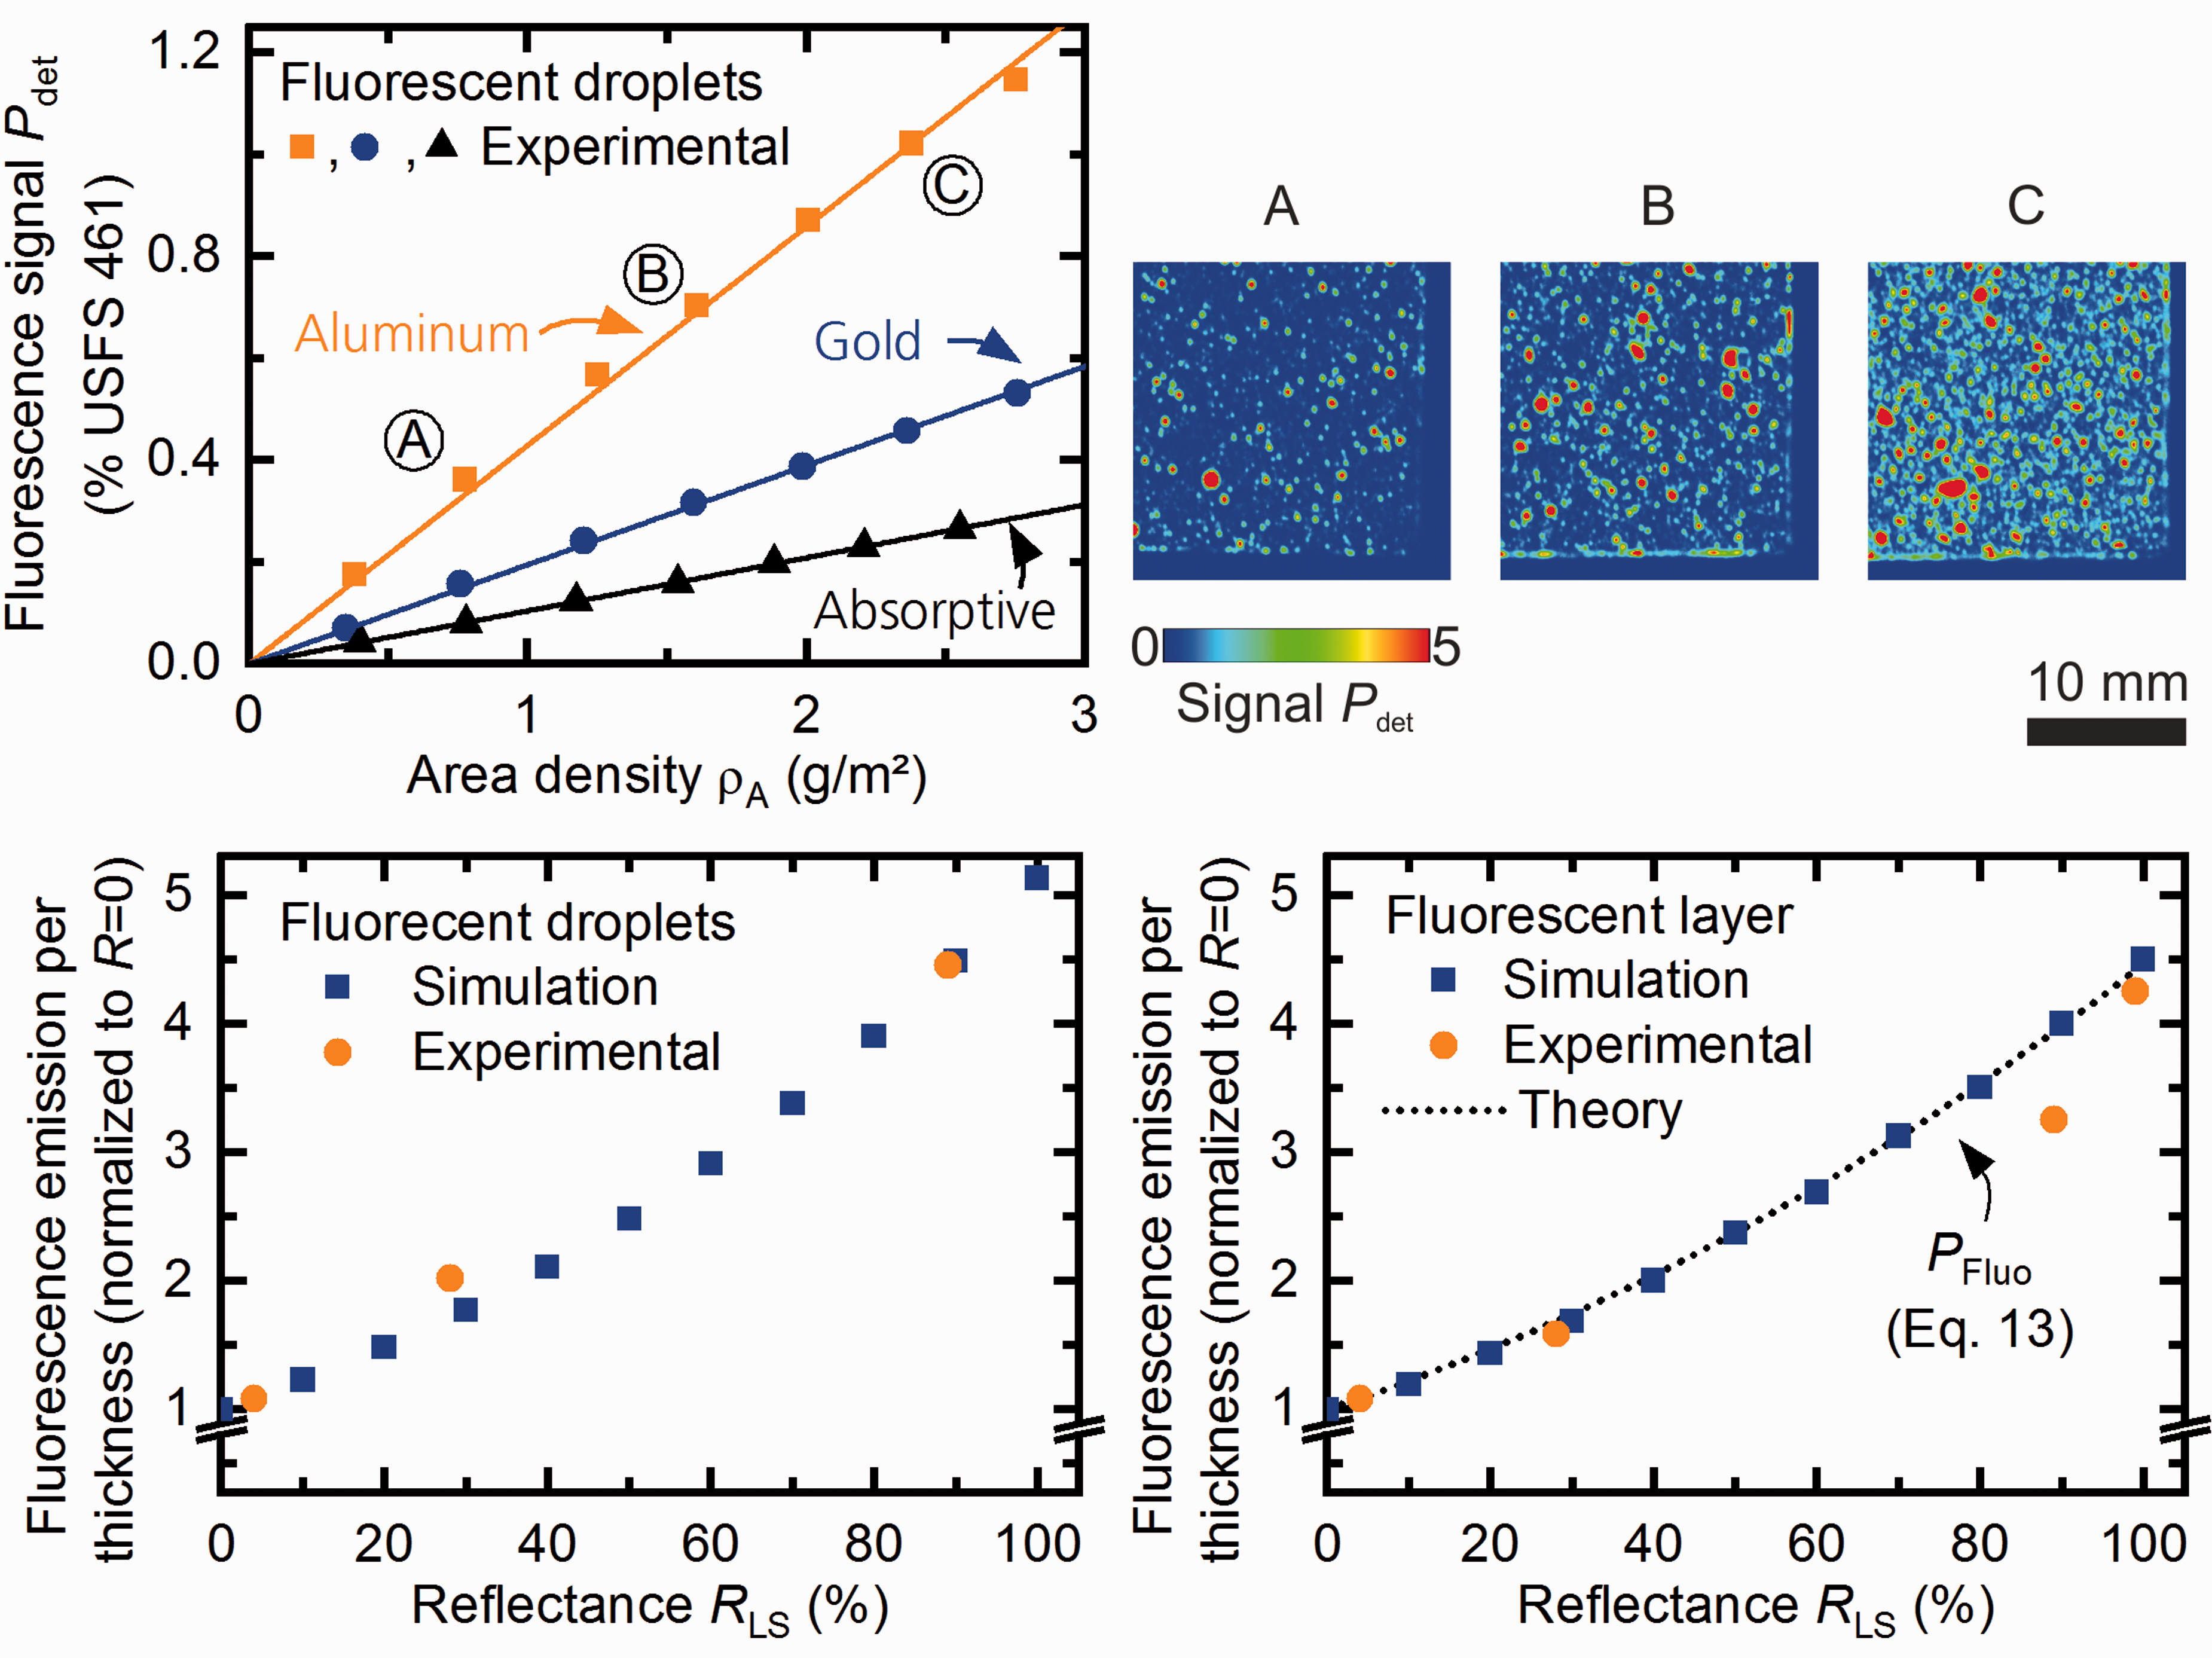
As predicted in the theoretical section of this paper, the fluorescence emission increases with increasing reflectance RLS of the substrate material. For the description of this effect, the slopes of all liner fits shown in Fig. 2 (top) are normalized to the slope of the absorptive filter glass. Figure 2 (bottom left) shows the normalized slopes as a function of reflectance. In addition, the plot in Fig. 2 (bottom left) shows the results of the simulation of the fluorescence emission of fluorescent droplets with a contact angle of 18° as a function of the substrate reflectance. The simulation results and the experiments show a five-fold increase of the detected fluorescence signal per layer thickness between an absorptive and a perfect reflective substrate.
The influence of the substrate reflectance on plane fluorescent layers has been investigated in addition to the previously described experiment using droplets. In this experiment, lubricant was filled into the previously described thin-film cuvette, which was equipped with different mirrors as substrate. Figure 2 (bottom right) shows the detected fluorescence emission per cuvette thickness. All emission intensities are normalized to the detected emission of the cuvette using the absorptive filter glass as substrate. In addition, Fig. 2 (bottom right) compares these experimental results with the results of the ray tracing simulation as well as the theoretically predicted behavior described by Eq. 13. As shown in Fig. 2 (bottom right) the simulation is in excellent agreement with the previously introduced theory. In addition, the experimental results are in good agreement with both the results of the simulation as well as the theory presented in Eq. 13. Deviations from the experimental results can be explained by the uncertainty for the mirrors’ reflectance for the complete wavelength range of the fluorescence emission as well as by uncertainties in the measurement of the cuvette thickness.
Influence of Substrate Texture
In contrast to the previously described experimental setup, samples used in industrial production usually have textured surfaces. To examine the influence of the surface texture, aluminum samples were coated with the lubricant KTL N 16. To realize nearly plane layers, the lubricant layers were covered with a glass. As described in the methods section, the lubricant quantity was determined using a high-resolution balance. An increase of factor 2.1 in the detected fluorescence signal per layer thickness was measured between the polished and the grit blasted aluminum surface. Since both samples were made out of the same aluminum block, the reflectance of the samples is the same and the change in intensity is caused exclusively by the surface texture.
The simulation of the influence of substrate texture is split into two steps. In the first simulation, we analyze the propagation and absorption of excitation light inside a layer as a function of the substrate’s surface scatter properties. In the second simulation, we analyze the behavior of fluorescence light emitted inside the layer. Figure 3 (top) shows the simulation results of the excitation light propagation inside an absorptive layer with a refraction index nlay = 1.49 on top an aluminum surface with different scatter properties.
Simulation of the excitation light propagation inside an absorptive layer with a refraction index nlay = 1.49. The sketches show the propagation of four exemplary rays striking the surface from outside the layer (top). The bottom left plot shows the angle resolved scatter distribution (ARS) for different widths σ of the Gaussian scatter model. Scatter angles θsc larger than the critical angle θc for total internal reflection are marked by the green overlay. The bottom right plot shows simulation results for the absorption as function of the width σ of the Gaussian scatter model.
In Fig. 3 (top), the propagation of four exemplary excitation light rays is visualized for surfaces with different widths of the scattering. It can be seen, that at low scattering widths (here σ = 0.2) there is just a small increase of the optical pathlength l compared to a perfect mirror (σ = 0). For surfaces causing wide angle scattering (here σ = 5), the scatter angles θsc of some of the scattered rays get larger than the critical angle θc for total internal reflection at the interface between lubricant layer and air. As visualized in Fig. 3 (top), this causes some of the excitation light scattered at the substrate’s surface to couple into the fluorescent layer.
Detailed results of the simulations are concluded in the bottom part of Fig. 3. As shown in Fig. 3 (bottom left) the scatter angles θsc increase with an increasing parameter σ of the Gaussian scatter model used in the simulation. For scatter widths of σ > 0.4 scatter, angles θsc of some of the scattered rays get larger than the critical angle θc for total internal reflection at the interface between lubricant layer and air. This means that some of the excitation light scattered at the substrate’s surface couples into the fluorescent layer. This leads to a significant increase of the optical pathlength l and therefore to a significant increase of the power Pabs of the absorbed excitation light. This effect is clearly visible in the diagram shown in Fig. 3 (bottom right).
As described before, fluorescence emission is implemented as an isotropic source inside the fluorescent layer. Figure 4 (top) shows exemplary the propagation of three rays of the emission light inside a layer with refraction index nlay = 1.49 for three surfaces with different scatter properties.
Simulation of the fluorescence light propagation inside a layer with refraction index nlay = 1.49. The sketches show the propagation of three exemplary rays emitted inside the layer (top). The bottom left plot shows simulation results describing the amount of fluorescence light lost inside the fluorescent layer as a function of the width σ of the Gaussian scatter model. The bottom right plot shows simulation results for the fluorescence emission outside the layer as a function of the width σ of the Gaussian scatter model. Results are displayed for the simulation of a model assuming an aluminum substrate.
For fluorescence light emitted inside a refractive layer, again, total internal refection might occur. As visualized in Fig. 4 (top), on a perfect mirror all light emitted at angles fulfilling the condition for total internal reflection is guided inside the refractive layer. In contrast, on scattering surfaces the angle of the light striking the interface between layer and air changes after each reflection for scattering surfaces. Therefore, the power of the light emitted from the layer increases.
In the simulations, detectors were placed on the edges of the lubricant layer to determine the amount of light lost due to total internal reflection. Figure 4 (bottom) shows the distribution of the light emitted inside a refractive layer. As shown in the right diagram, just a quarter of the light emitted inside the layer can be detected outside the layer as fluorescence emission, if the layer is applied on a non-scattering reflective surface. For scattering substrates, the amount of light which fulfills the condition of total internal reflection decreases with increasing width of the scatter angles caused by the surface. This effect is clearly visible in the plot in Fig. 4 (bottom right).
The detected fluorescence signal PFluo outside a fluorescent layer as function of the scatter width σ is directly proportional to the product of the absorbed excitation light Pabs, described in the diagram in Fig. 3 (bottom right), and the portion of the fluorescence light emitted outside the layer, as described in Fig. 4 (bottom right). Therefore, the fluorescence emission per layer thickness increases by a factor of 7.9 for plane fluorescent layers coated on a polished surface respectively a Lambertian surface.
Due to the surface tension, thin perfectly plane layers on Lambertian surfaces are highly unlikely in practice. Therefore, the increase of the fluorescence signal per layer thickness by factor 7.9 shown in the simulation is unlikely to occur on industrial samples. Inhomogeneities in the thickness of the prepared layers as well as non Lambertian scatter properties of the glass bead blasted samples are probable reasons why the maximum increase of the fluorescence signal per layer thickness measured in the experiments in this work is limited to factor 2.1. Fraunhofer IPM has previously reported variations in the fluorescence signal per layer thickness due to different surface textures of metal blanks used for industrial car body manufacturing. 7 These variations reported are in the range of factor two as well.
Influence of Sample Tilt
Industrial applications often require fluorescence analyses on shaped surfaces. To analyze the effect of tilted surfaces on the detected fluorescence signal, we sprayed lubricant droplets on both an aluminum mirror as well as an absorptive glass sample. Figure 5 (top) shows exemplary results of experiments on the change of the detected fluorescence power PFluo as function of the tilt θi. In addition, Fig. 5 (bottom) shows the simulated propagation of excitation light inside a fluorescent droplet coated on an aluminum mirror at different sample tilts.
Influence of sample tilt. Fluorescence images of an aluminum mirror coated with lubricant droplets (top). For image acquisition at different tilts, the sample was placed on top of a goniometer stage (middle). Simulation results for the propagation of three exemplary excitation light rays inside a lubricant droplet at different tilts of the sample (bottom).
The fluorescence images in Fig. 5 (top) clearly indicate an increase of the fluorescence signal PFluo as a function of the sample tilt θi for lubricant droplets coated on an aluminum mirror. The average fluorescence signal detected as a function of sample tilt is plotted in Fig. 8. A significant increase of the fluorescence signal PFluo is detected at angles θi > 30°. As indicated in the results on the corresponding simulation in Fig. 5 (bottom), one reason for this increase is the increasing pathlength l of excitation light inside the lubricant droplet as function of the sample tilt. As described by Eqs. 3 and 4, this leads to an increase in the fluorescence emission.
For a detailed understanding of the effects caused by the sample’s tilt, we processed simulations for differently shaped fluorescent layers on top of both an aluminum mirror as well as an absorptive substrate. In analogy to the simulations on the influence of substrate texture, we again split the simulations in two steps. In the first simulation, we analyzed the propagation and absorption of excitation light inside a layer as function of the sample tilt. In the second simulation, we analyzed the behavior of fluorescence light emitted inside the layer.
Figure 6 shows the results for the simulation of the power of the absorbed excitation light Pabs as a function of the sample tilt θi. These results reveal that the change of fluorescence signal highly depends on the shape of the fluorescent layer as well as the reflectance of the substrate material.
Simulation results for the absorption 
The amount of light absorbed is determined by a superposition of several effects. Figure 6 (top right) presents the simulation results for the absorption inside a plane absorptive layer. Due to the tilt of the sample, the pathlength inside the layer increases. According to Eq. 6 this increase is inversely proportional to the cosine of the ray direction θt of the light transmitted into the layer. The transmitted power at the transition between air and lubricant depends on the angle of incident as well as on the polarization according to the Fresnel equations described in Eqs. 8 and 9. Therefore, the simulated result for lubricant layers on an absorptive substrate (blue lines) is equal to the superposition of the increase of the optical pathlength and the transmission efficiency of the excitation light into the layer both as a function of sample tilt. For aluminum substrates, the polarization-dependent reflectance of the aluminum has to be considered in addition. As shown in Figure S6 (Supplemental Material), the reflectance of an aluminum surface is nearly the inverse function of the transmittance for the coupling of the excitation light into the lubricant layer. As a result, the increase of absorption is directly proportional to the increase of the optical pathlength for absorptive layers on top of aluminum substrates, as shown by the simulation results (orange lines).
Figure 6 (top left) presents the results of the simulation for a nearly semi-spherical droplet with a contact angle of 45°. The decrease of the absorption
The results for flat absorptive droplets with a contact angle of 18° are shown in Fig. 6 (lower left and right). For these droplets on top of reflective substrates, a fourth effect influences the absorption as a function of the sample tilt. At sample tilts of θi larger than 10°, excitation light starts coupling into the droplets at the droplets edges. The droplets act as a kind of light guide and therefore the optical pathlengths increase significantly. This effect is caused by the refraction of light at the edges of the droplet. Due to the flat curved shape, the rays reflected on the substrate are reflected on the interface between absorptive layer and air. Figure 5 (bottom) visualizes this effect by presenting the simulation results of three exemplary rays. As described in the theory section, total internal reflection occurs for angles θ larger than the critical angle of θc = 42° at the interface between the lubricant used in the experiments and air.
Figure 6 (bottom left) shows the change of the absorption for a single droplet with a diameter smaller than the diameter of the excitation laser as a function of the sample tilt. Figure 6 (bottom right) shows the change in the event that additional droplets get illuminated by the tilt of the sample. In this case, the result for a single droplet shown in Fig. 6 (bottom left) gets superimposed by the increase of illuminated absorptive material. Figure S8 (Supplemental Material) presents additional simulation results for droplets with contact angles in the range from 15° to 26°. These results show that the angle at which the absorption Pabs starts to rise increases reciprocally to the contact angle of the absorptive droplet.
As described in the experimental section, the fluorescence detection is carried out coaxially to the excitation laser. In addition, the surface area projected on the detector is larger than the area illuminated by the excitation laser. During tilting of the fluorescent sample, the angle of detection changes in parallel to the sample tilt. Therefore, the angular emission characteristics of the fluorescent layer are directly proportional to the geometry factor g which describes the detected portion of the emitted fluorescence light Pfluo. Figure 7 shows the simulated angular emission characteristics for a plane fluorescent layer as well a flat fluorescent droplet as function of surface reflectance RLS.
Simulation of the angular emission characteristics as a function of the substrate reflectance RLS. The graphs show the angular distribution of the fluorescence emission of a plane absorptive layer (left) as well as a flat droplet with a contact angle of 18° (right). The dashed lines indicate the emission characteristics expected of a Lambertian emitter. Integrated fluorescence signal detected as a function of sample tilt. The diagram shows the results for flat droplets sprayed on an aluminum mirror (orange) and absorptive glass (blue). The graph compares the experimental results (data points) and the fluorescence emission predicted by the simulation (continuous lines). Values for p-polarization (dotted lines) and s-polarization (solid lines) of the excitation light are shown.

The dashed lines in Fig. 7 indicate the angular distribution of the emission expected of a Lambertian emitter. The radiant intensity of a Lambertian emitter is proportional to the cosine of the viewing angle θi. As shown by the simulation results in Fig. 7, fluorescent layers act as Lambertian emitter independent of the geometry of the fluorescent layer, if the layers are applied on top of absorptive substrates.
Figure 7 (left) shows the angular distribution of the fluorescence emission of a plane fluorescent film. Due to the symmetry of a plane film, the angular distribution is independent of the substrate’s reflectance. Figure 7 (right) presents the simulation results for flat absorptive droplets with a contact angle of 18°. As presented in the plots, the emission toward larger angles increases significantly with increasing reflectance RLS. For substrates with 100% reflectance, the radiant intensity emitted towards a viewing angle of 49° is more as twice as high as the orthogonally emitted radiant intensity. As indicated in Fig. 1, some portion of the fluorescence light is emitted at angles larger than the critical angle θc. For fluorescent layers on absorptive substrates, this fluorescence light cannot be detected outside the layer. With increasing reflectance RLS of the substrate material, an increasing portion of this fluorescence light is guided towards the edges of the droplet. Due to the curved shape of the droplets, the requirements for total internal reflection are not fulfilled at the edges of the droplets. Therefore, at the edges of the droplet the fluorescent light is refracted out of the fluorescent layer. Figures S9 and S10 (Supplemental Material) present additional simulation results for droplets with contact angles in the range from 15° to 26°. These results indicate that the emission towards larger angles increases as a function of droplet flatness as well as surface reflectance RLS.
According to Eqs. 4 and 16, the detected fluorescence light is proportional to the product of the power of the absorbed light Pabs and the geometry factor g. The plots in Fig. 8 compare the simulation results to the experimental results described at the beginning of this section.
The plot in Fig. 8 shows the results for flat droplets sprayed on an aluminum mirror (orange) and absorptive glass (blue). The continuous lines in Fig. 8 indicate the product of the simulation result for the absorption Pabs and the angular emission characteristics g. The results presented in the plot are based on simulations for droplets with a contact angle of 15°. The data points in Fig. 8 show the integrated fluorescence signal acquired by the laser scanner system.
The experimental results clearly confirm the polarization dependency predicted in the simulations. Furthermore, the simulated fluorescence signal as a function of the sample tilt corresponds well to the experimental results for both the reflective as well as the absorptive substrate. For lubricant droplets coated on a reflective aluminum substrate, the detected fluorescence signal increases significantly for samples tilts larger 20°. For p-polarized illuminated samples, both the simulation as well as the experimental results show a four-time increase comparing samples tilted θi = 0° and θi = 45°. For s-polarized illumination, the simulation as well as experimental results show an increase higher factor five. As discussed before, both absorption as well as emission characteristics strongly vary based on droplet shape and size, relative to the diameter of the excitation laser. Therefore, deviations of the experimental results can be explained by variation of the geometry and size of the droplets sprayed on the mirror. For absorptive substrates, both simulation and experiments show a decrease of the detected fluorescence signal of less than 10% comparing a sample tilt of θi = 0° and θi = 45°.
Conclusion
We performed a systematic study on effects influencing the amplitude of fluorescence emission of thin fluorescent layer. The results of this study are of outmost relevance for the interpretation of fluorescence images of layers coated on freeform shaped samples. Whereas most fluorescence analysis systems only consider the absorption and quantum efficiency properties of the layer for quantitative thickness measurements, our results indicate that knowledge of at least three additional parameters are necessary for quantification. At first, it has to be considered, that all effects examined in this study highly depend on the shape of the fluorescent layer. This means that for a quantitative interpretation of fluorescent signals it has to be considered, if the signals are emitted from a plane homogeneous layer or from lubricant droplets with known contact angle. Secondly, the reflectance as well as the texture of the substrate material strongly influences fluorescence emission. The presented results show a variation of the fluorescence emission as a function of the substrate’s reflectance by factor 4.5 for flat fluorescent layers respectively factor 5 for fluorescent lubricant droplets with a contact angle of 18°. Thirdly, the tilt of fluorescent layers towards the angle of illumination respectively observation has to be considered. The presented results show an increase of the detected fluorescence signal of at least factor four, comparing signals of flat fluorescent droplets at orthogonal examination, to samples tilted by 45°.
Based on these results, future systems for fluorescence measurements on industrial samples should offer the possibility to correct the identified influences. One possible realization is the implementation of software interfaces in order to import geometry and substrate surface data to the mathematical model used for the quantitative fluorescence analysis. While we presented simulation results of surfaces with ideal scatter properties, future work has to be done to predict the influence of more complex surface textures on the amplitude of the fluorescence signal.
Supplemental Material
ASP885932 Supplemental Material - Supplemental material for Quantitative Measurement of Fluorescent Layers with Respect to Spatial Thickness Variations and Substrate Properties
Supplemental material, ASP885932 Supplemental Material for Quantitative Measurement of Fluorescent Layers with Respect to Spatial Thickness Variations and Substrate Properties by Philipp Holz, Christoph Pönisch and Albrecht Brandenberg in Applied Spectroscopy
Footnotes
Conflict of Interest
The authors report there are no conflicts of interest.
Funding
The research leading to these results has received funding from the German Federal Ministry for Economic Affairs and Energy (Central Innovation Program for SMEs (ZIM), grant# ZF4036504 PO6).

Supplemental Material
All supplemental material mentioned in the text, including 10 figures, is available in the online version of the journal.
References
Supplementary Material
Please find the following supplemental material available below.
For Open Access articles published under a Creative Commons License, all supplemental material carries the same license as the article it is associated with.
For non-Open Access articles published, all supplemental material carries a non-exclusive license, and permission requests for re-use of supplemental material or any part of supplemental material shall be sent directly to the copyright owner as specified in the copyright notice associated with the article.
