
Abstract
Content uniformity is a critical attribute for potent and low-dosage formulations of active pharmaceutical ingredient (API) that, in addition to the formulation parameters, plays pivotal role during pharmaceutical development and production. However, when API content is low, implementing a vibrational spectroscopic analytical tool to monitor the content and blend uniformity remains a challenging task. The aim of this study was to showcase the potentials of mid-infrared (MIR), near-infrared (NIR), and Raman spectroscopy for quantitative analysis of alprazolam (ALZ) in a low-content powder blends with lactose, which is used as a common diluent for tablets produced by direct compression. The offered approach might be further scaled up and exploited for potential application in the process analytical technology (PAT). Partial least square and orthogonal PLS (OPLS) methodologies were employed to build the calibration models from raw and processed spectral data (standard normal variate, first and second derivatives). The models were further compared regarding their main statistical indicators: correlation coefficients, predictivity, root mean square error of estimation (RMSEE), and root mean square error of cross-validation (RMSEEcv). All statistical models presented high regression and predictivity coefficients. The RMSEEcv for the optimal models was 1.118, 0.08, and 0.059% for MIR, NIR, and Raman spectroscopy, respectively. The scarce information content extracted from the ALZ NIR spectra and the major band overlapping with those from lactose monohydrate was the main culprit of poor accuracy in the NIR model, whereas the subsampling instrumental setup (resulting in a non-representative spectral acquisition of the sample) was regarded as a main limitation for the MIR-based calibration model. The OPLS models of the Raman spectra of the powder blends manifested favorable statistical indicators for the accuracy of the calibration model, probably due to the distinctive ALZ Raman pattern resulting in the largest number of predictive spectral points that were used for the mathematical modeling. Furthermore, the Raman scattering calibration model was optimized in narrower scanning range (1700–700 cm−1) and its prediction power was evaluated (root mean square error of prediction, RMSEP = 0.03%). Thus, the Raman spectroscopy presented the most favorable statistical indicators in this comparative study and therefore should be further considered as a PAT for the quantitative determination of ALZ in low-content powder blends.
Keywords
Introduction
Content uniformity is regarded as a critical attribute in the formulation development of low-dose and potent active pharmaceutical ingredients (API). 1 When developing a low dosage tablet formulation, one needs to achieve content uniformity by carefully considering the formulation composition and the production method. Direct compression is one of the simplest tablet manufacturing protocols that encompass only powder blending and compression. Generally, it is feasible in low-dose formulations, where the mechanical properties of the powder blend are primarily conferred by the tablet diluent. However, the content uniformity of the final tablet will rely on an efficient mixing process that should produce a uniform powder blend. Having this in mind, the optimization of the dry powder blending with regard to the API content uniformity is of prime importance. 2
The conventional pharmaceutical manufacturing is performed through a batch process, and the quality assessment relies on end-point laboratory tests that are conducted on collected samples. Currently, high-performance liquid chromatography (HPLC) is a primary analytical method of interest for the determination of powder blend uniformity in dry mixing. It is based on a sampling of the powder blend at different levels in the blender using a sample thief, which is considered as time-consuming, labor intensive, and associated with possible sampling-based errors. 3 The improvement of process understanding and reducing the production cycle times by using on-, in-, and/or at-line measurements and controls are considered as key benefits of introducing process analytical technology (PAT) in the pharmaceutical manufacturing. 4 Such analytical techniques need to demonstrate a capacity for processing a large amount of data in a short period, during the pharmaceutical manufacturing process demands fully satisfied by the vibrational spectroscopy techniques. These techniques offer nondestructive and rapid sample measurements without sample preparation, and as such could be used for real-time analytical monitoring of many processes in pharmaceutical manufacturing. In addition, the ability to provide versatile, multivariate, qualitative, and quantitative data regarding the physical and chemical characteristics of the samples is particularly important for their adaptation as a PAT in the pharmaceutical processing.5,6
Establishing a vibrational spectroscopy technique, that could be further implemented as an efficient PAT tool, needs development and implementation of a suitable statistical analysis method in the processing of physical and chemical data of multivariate nature, where the absorption, transmittance or scattering intensities at different wavelengths are recorded in a single spectrum. 7 Principal component analysis and partial least squares regression (PLS) are the most common multivariate statistical analysis methods for the interpretation of vibrational spectroscopy data. These statistical analysis tools are able to handle large amounts of data with experimental noise, collinearities, and nonlinearities and can be utilized for the development of accurate calibration models, even in the presence of interferences of known or unknown origin. 8 There are many examples of using vibrational spectroscopy techniques in conjunction with a PLS model in the monitoring of API content uniformity in various pharmaceutical solid dosage forms manufacturing processes (i.e., dry and high shear granulation, fluid bed drying, tableting, etc.).9–12 However, when the API is in low dose and/or low content in the overall powder mass, the development of a valid and predictable calibration model for vibrational spectroscopy-based API quantification still remains a challenging task.
Alprazolam (ALZ) is an anxiolytic drug, a 1,4 benzodiazepine compound, indicated for the management of anxiety disorder or the short-term relief of symptoms of anxiety and panic disorder, with or without agoraphobia. 13 ALZ is a potent drug, effective in low plasma concentrations, administered perorally as an immediate-release tablet with a low single dose range ranging 0.5–3 mg. Considering the low dose of ALZ, the immediate release tablet formulations are commonly produced by the dry mixing of the ALZ with the excipients (mainly diluent), followed by direct compression of the powder blend. The ALZ content uniformity of the powder blend is considered as one of the critical attributes in the manufacturing process, thus pointing out the need to introduce a suitable tool for in-depth understanding and optimization of the dry mixing process.
Therefore, the goal of our work was to evaluate the potential of different vibrational spectroscopy techniques, near-infrared (NIR), mid-infrared (MIR), and Raman spectroscopy, for content uniformity evaluation of low-dose formulation of ALZ. For achieving the given task, we aimed in performing analysis of ALZ powder blends with lactose, which is used as a common diluent for direct compression, using the above-mentioned vibrational spectroscopy techniques, and afterward, to develop PLS-based calibration models, and compare the key statistical outcomes regarding the model fit, prediction ability, accuracy (root mean square error), and regression coefficients. The model with the most favorable indicators will be further optimized and evaluated for its predictive power on a separate prediction set.
Materials and Methods
Materials
The ALZ was purchased from Centaur Pharmaceuticals Private Ltd, India. Lactose monohydrate with a trade name Tablettose 80 was obtained from Meggle Group Wasserburg BG Excipients and Technology (Germany).
Methods
Sample Preparation
The ingredients were sieved through 0.8 mm mesh. The binary powder blend (50 g) of ALZ and lactose monohydrate, with varying ALZ content, was prepared by carefully administering the weighed quantity of lactose as the bottom and top layer and adding ALZ as the middle layer in a laboratory beaker. The powder blend was then mixed with a spatula and transferred to a PVC bag for an additional 5 min manual mixing. Afterward, a part of the blend was utilized to produce 10 mm flat surface tablets, using 10 tons of load on a hydraulic press (Perkin Elmer, USA). The tablets were used for Raman and NIR measurements, whereas a sample of the powder blend was directly used to collect the MIR spectra. All the samples were further analyzed for ALZ content using a validated HPLC assay.
Mid-Infrared Spectroscopy
The MIR spectra of the ALZ:lactose monohydrate powder blends were obtained by placing few milligrams of the sample onto the attenuate total reflection (ATR) module of an Alpha Platinum ATR Fourier transform infrared spectrometer (Bruker Optik, Germany). The scanning resolution was 4 cm−1, the scanning region was set to 4000–400 cm−1 and each spectrum averaged from eight scans. Twenty subsamples from each ALZ:lactose monohydrate blend strength were scanned for the development of the calibration models.
Near-Infrared Spectroscopy
The surface of the tablets prepared from the ALZ:lactose monohydrate blend (five tablets per each ALZ strength) was scanned with the fiber optic probe of the MPA Fourier transform near-infrared spectrometer (Bruker Optik, Germany). The scanning resolution was 16 cm−1, while the scanning region was set to 12 500–4500 cm−1.
Raman Spectroscopy
The mapping x,y stage coupled to micro-Raman multichannel spectrometer LabRam300 Infinity (Horiba JobinYvon, France) was used. The Raman effect was obtained using a 532 nm neodymium-doped yttrium aluminum garnet (Nd:YAG) frequency doubled laser without the use of a filter (neither laser photodegradation nor burning was obtained). A 50× objective for magnification was selected from an Olympus MPlanN confocal microscope. To focus the laser beam and gain more than 96% of the laser intensity, a hole of 500 µm and a slit of 100 µm were used. The laser spot size (∼2 µm) on the tablet surface was automatically positioned by the motorized x,y stage for the mapping of a 6 × 6 grid (spectral points). The points were evenly separated 1 mm from each other, to monitor and evaluate tablet uniformity on rather large 5 × 5 mm area to properly address and screen the sample homogeneity. The Raman shift was calibrated with the Raman peak of a silica wafer positioned at 520.7 cm−1. The acquisition time and the accumulation number were set to 5 s and 5 scans, respectively, and each mapping sequence was collected in the 4000–100 cm−1 region. The surface of three tablets prepared from each ALZ:lactose monohydrate blend strength was mapped using the above-mentioned instrumental setup.
HPLC Assay
Each sample or tablet from the ALZ:lactose monohydrate blends were further analyzed with validated HPLC assay to accurately quantify the ALZ content. The whole tablet or 100 mg sample was dissolved in 50 mL methanol by means of ultrasonication for 15 min. The methanol solution was filtered through a 0.45 RC filter, and 25 mL of the filtrate were transferred to a 150 mL volumetric flask. The solution was diluted with 75 mL of methanol, and water was added to the volume mark of the flask. The quantitative analysis was performed on UHPLC NEXERA Lab Solution-2ch (Shimadzu, Japan) using LiChrospher RP Select B (5 µm), 125 × 4 column (MerckMilipore, Germany), flow rate of 1.4 mL/min, column temperature at 30℃, and an injection volume of 20 µL. The detection and quantification were performed using a DAD detector at a wavelength of 220 nm. The mobile phase was prepared from methanol–acetonitrile– potassium dihydrogen phosphate buffer (pH 3.0; 15 mM) (10:45:45, v/v/v). The pH of the potassium dihydrogen phosphate buffer was adjusted using o-phosphoric acid. The ALZ content was calculated on the basis of ALZ peak areas, relative to the standard calibration curve.
Statistical Analysis
Partial least squares analysis was used to develop the calibration models of each vibrational spectroscopy technique using the spectroscopy skin of Simca 14 (Umetrics, Sweden). In addition, the spectra were preprocessed using SNV, first and second derivative with Savitzky–Golay smoothing (15-points in each sub-model) to eliminate baseline shifts or to enhance the quantification of the overlapped bands. Orthogonal PLS (OPLS) was additionally used to eliminate the orthogonal variances and improve the statistical parameters of the model. The correlation coefficients for the X and Y matrices, the predictivity coefficient (Q2), root mean square error of estimation (RMSEE), and the root mean square error of cross-validation (RMSEEcv) were used as the main statistical indicators for the calibration models, while the root mean square error of prediction (RMSEP) was used to measure the predictive power of the most optimal model. RMSEE and RMSEP were computed using Eqs. 1 and 2, while the RMSEEcv was determined by the so-called “leave one out” method. Briefly, a new calibration model is developed (with a new RMSEE) with omitting one data point, then in a following new calibration model the data point is restored but a different data point is removed. The process continues until all data points from the original model are left out one at a time, and the calculated RMSEE values are averaged to compute the RMSEEcv. The variable importance in the projection (VIP) spectrum plot, the coefficient plot, and the observed versus predicted regression plots were used for further analysis of the models. The content of ALZ in the powder blends, determined by the HPLC assay, was used as Y-observed variables in all models, while the acquired Raman, MIR, and NIR spectra were used as X variables in the appropriate models. The calibration model with the most adequate statistical indicators was further optimized for the expected concentration range of ALZ, and its RMSEP calculated with a separate prediction set

in which Yobs – Ypred are the fitted residuals for the observations in the calibration workset and N is the number of observations

in which Yobs – Ypred are the predicted residuals for the observations in the prediction set and N is the number of observations.
Additionally, the relative difference among the observed and predicted data points for each sample set for the most optimal models was calculated using Eq. 3

Results and Discussion
The comparative screening study was performed on small volume powder blends using laboratory-based instruments. A validated HPLC method was used as quantification reference (ALZ linearity range: 0.15–1.2 mg/mL – R2 = 0.999, system precision: relative standard deviation = 0.321%). The lactose and ALZ peak were well separated with adequate resolution (Figure S1).
Development of the MIR Spectra Calibration Model
Lactose powder blends with various ALZ content (0.5 to 10%) were used to develop the MIR spectra calibration model. The MIR spectra of pure ALZ and lactose monohydrate are presented in Figure S2.
The weak band at 3053 cm−1 in the ALZ spectrum could be assigned to C–H stretching vibrations in the aromatic ring. According to Neville and Shurvell, these vibrations in the molecule of diazepam are assigned at 3073 cm−1. 14 The aromatic C–H stretching modes in ALZ were also observed by Muthu et al. in the 3100–3000 cm−1 region. 15 The methylene group at Position 3 of the diazepine ring shows six vibrational modes: symmetric and antisymmetric stretching, scissoring deformation as well as wagging, twisting, and rocking bending modes. The methylene antisymmetric and symmetric C–H stretching vibrations in the ALZ spectrum are reflected by the weak and very weak bands at 2947 and 2852 cm−1, whereas the bands from the corresponding vibrations from the CH3 group appear at somewhat higher wavenumbers (2980 and 2930 cm−1). The methylene scissoring mode and the wagging mode could be assigned as medium bands at 1447 and 1208 cm−1, while the CH2 twisting and rocking modes are not well characterized. These spectral assignments closely correspond to the findings of Neville and Shurvell. 14 The shoulder at 1600 cm−1 in the ALZ spectrum represents C = N stretching vibrations in both the triazolic and benzodiazepine ring, whereas the bands at 1425 and 1445 cm−1 arise from the CH2 and CH3 in-plane bending modes. ALZ contains two benzene rings, thus giving rise to 12 C = C stretching modes which appear in the region 1620–1300 cm−1—the most characteristic being the strong bands at 1612, 1488, 1401, 1322, and 1256 cm−1. 14 In general, the C–H in-plane bending vibrations evolve in the range of 1000–1300 cm−1, while out-of-plane vibrations are noted in the range 1000–700 cm−1. 16 Since ALZ comprises one monosubstituted and one tri-substituted benzene ring, eight pairs of in-plane and out-of-plane bending vibrations in the molecule are expected. The out-of-plane bending modes of ALZ could be assigned to very strong bands at 690 and 745 cm−1, while the in-plane bending modes manifest medium band at 1038 cm−1 and shoulder at 1298 cm−1. The chlorine atom at position seven of the ALZ benzodiazepine ring shows a distinct C–Cl stretching mode that could be assigned to a very strong band at 582 cm−1.
The lactose monohydrate MIR spectrum shows a plethora of bands with high intensities in the regions 3600–3000 cm−1 and 1200–400 cm−1, that could potentially overlap some of the relevant ALZ bands in the MIR spectra of their powder blends, particularly the ones with low ALZ content. The O–H stretching vibrations in the lactose molecule could be assigned to the very weak bands at 3522 and 3318 cm−1. The weak intensity bands from the C–H stretching modes of CH2 groups are observed at 2899 and 2933 cm−1. The CH2 in-plane bending vibrations occur in the 1500–1400 cm−1 region, whereas the bands from the wagging and twisting deformations appear at 1340 and 1298 cm−1. The C–H and O–H rocking vibrations could be noticed as a weak band at 1259 cm−1. The bands at 1201, 1167, 1140, and 1115 cm−1 are assigned to in-plane O–H bending modes and C–O stretching, while the intensive bands at 1031 and 1019 cm−1 are assigned to C–C and C–O stretching vibrations. Three distinct characteristic bands for the α-lactose monohydrate crystalline form appear at 915, 899, and 875 cm−1. Most of the bands in the 800–400 cm−1 region are mainly assigned to the in-plane deformation modes of the endocyclic OCC, OCO, and CCO groups, with the most intensive band at 550 cm−1 originating from the in-plane O–C–O deformations. The presented MIR data and bands interpretation for lactose monohydrate are related to the tentative band assignment reported by Norris and Greenstreet, Wiercigroch et al., and López-Pablos et al.17–19
The MIR calibration model was developed by acquiring scans of 20 samples from each ALZ:lactose powder blend with various ALZ content (0.5–10%). Higher ALZ content powder blends were used to evaluate the effects of the possible overlapping spectral regions and simultaneously emphasize the unique ALZ bands that will affect the variability of the response in the model. A total of 80 spectra were analyzed in: (i) raw form, (ii) by using standard normal variate transformation (SNV), (iii) and in their first and (iv) second derivatives in separate PLS and OPLS models (Fig. 1). Four components were extracted for raw data, SNV, and first derivative PLS models, while three components were extracted for the second derivative PLS model. One main component and an additional three orthogonal components were extracted in the raw data, SNV, and first derivative OPLS, and one main and two orthogonal components were extracted for the second derivative OPLS model. The main statistical outputs are presented in Table I.
MIR spectra of the ALZ:lactose monohydrate blends, colored according to ALZ content (%): (a) raw data; (b) SNV transformation; (c) the first derivative; (d) the second derivative. Main statistical descriptors of the PLS and OPLS-based MIR spectra calibration models.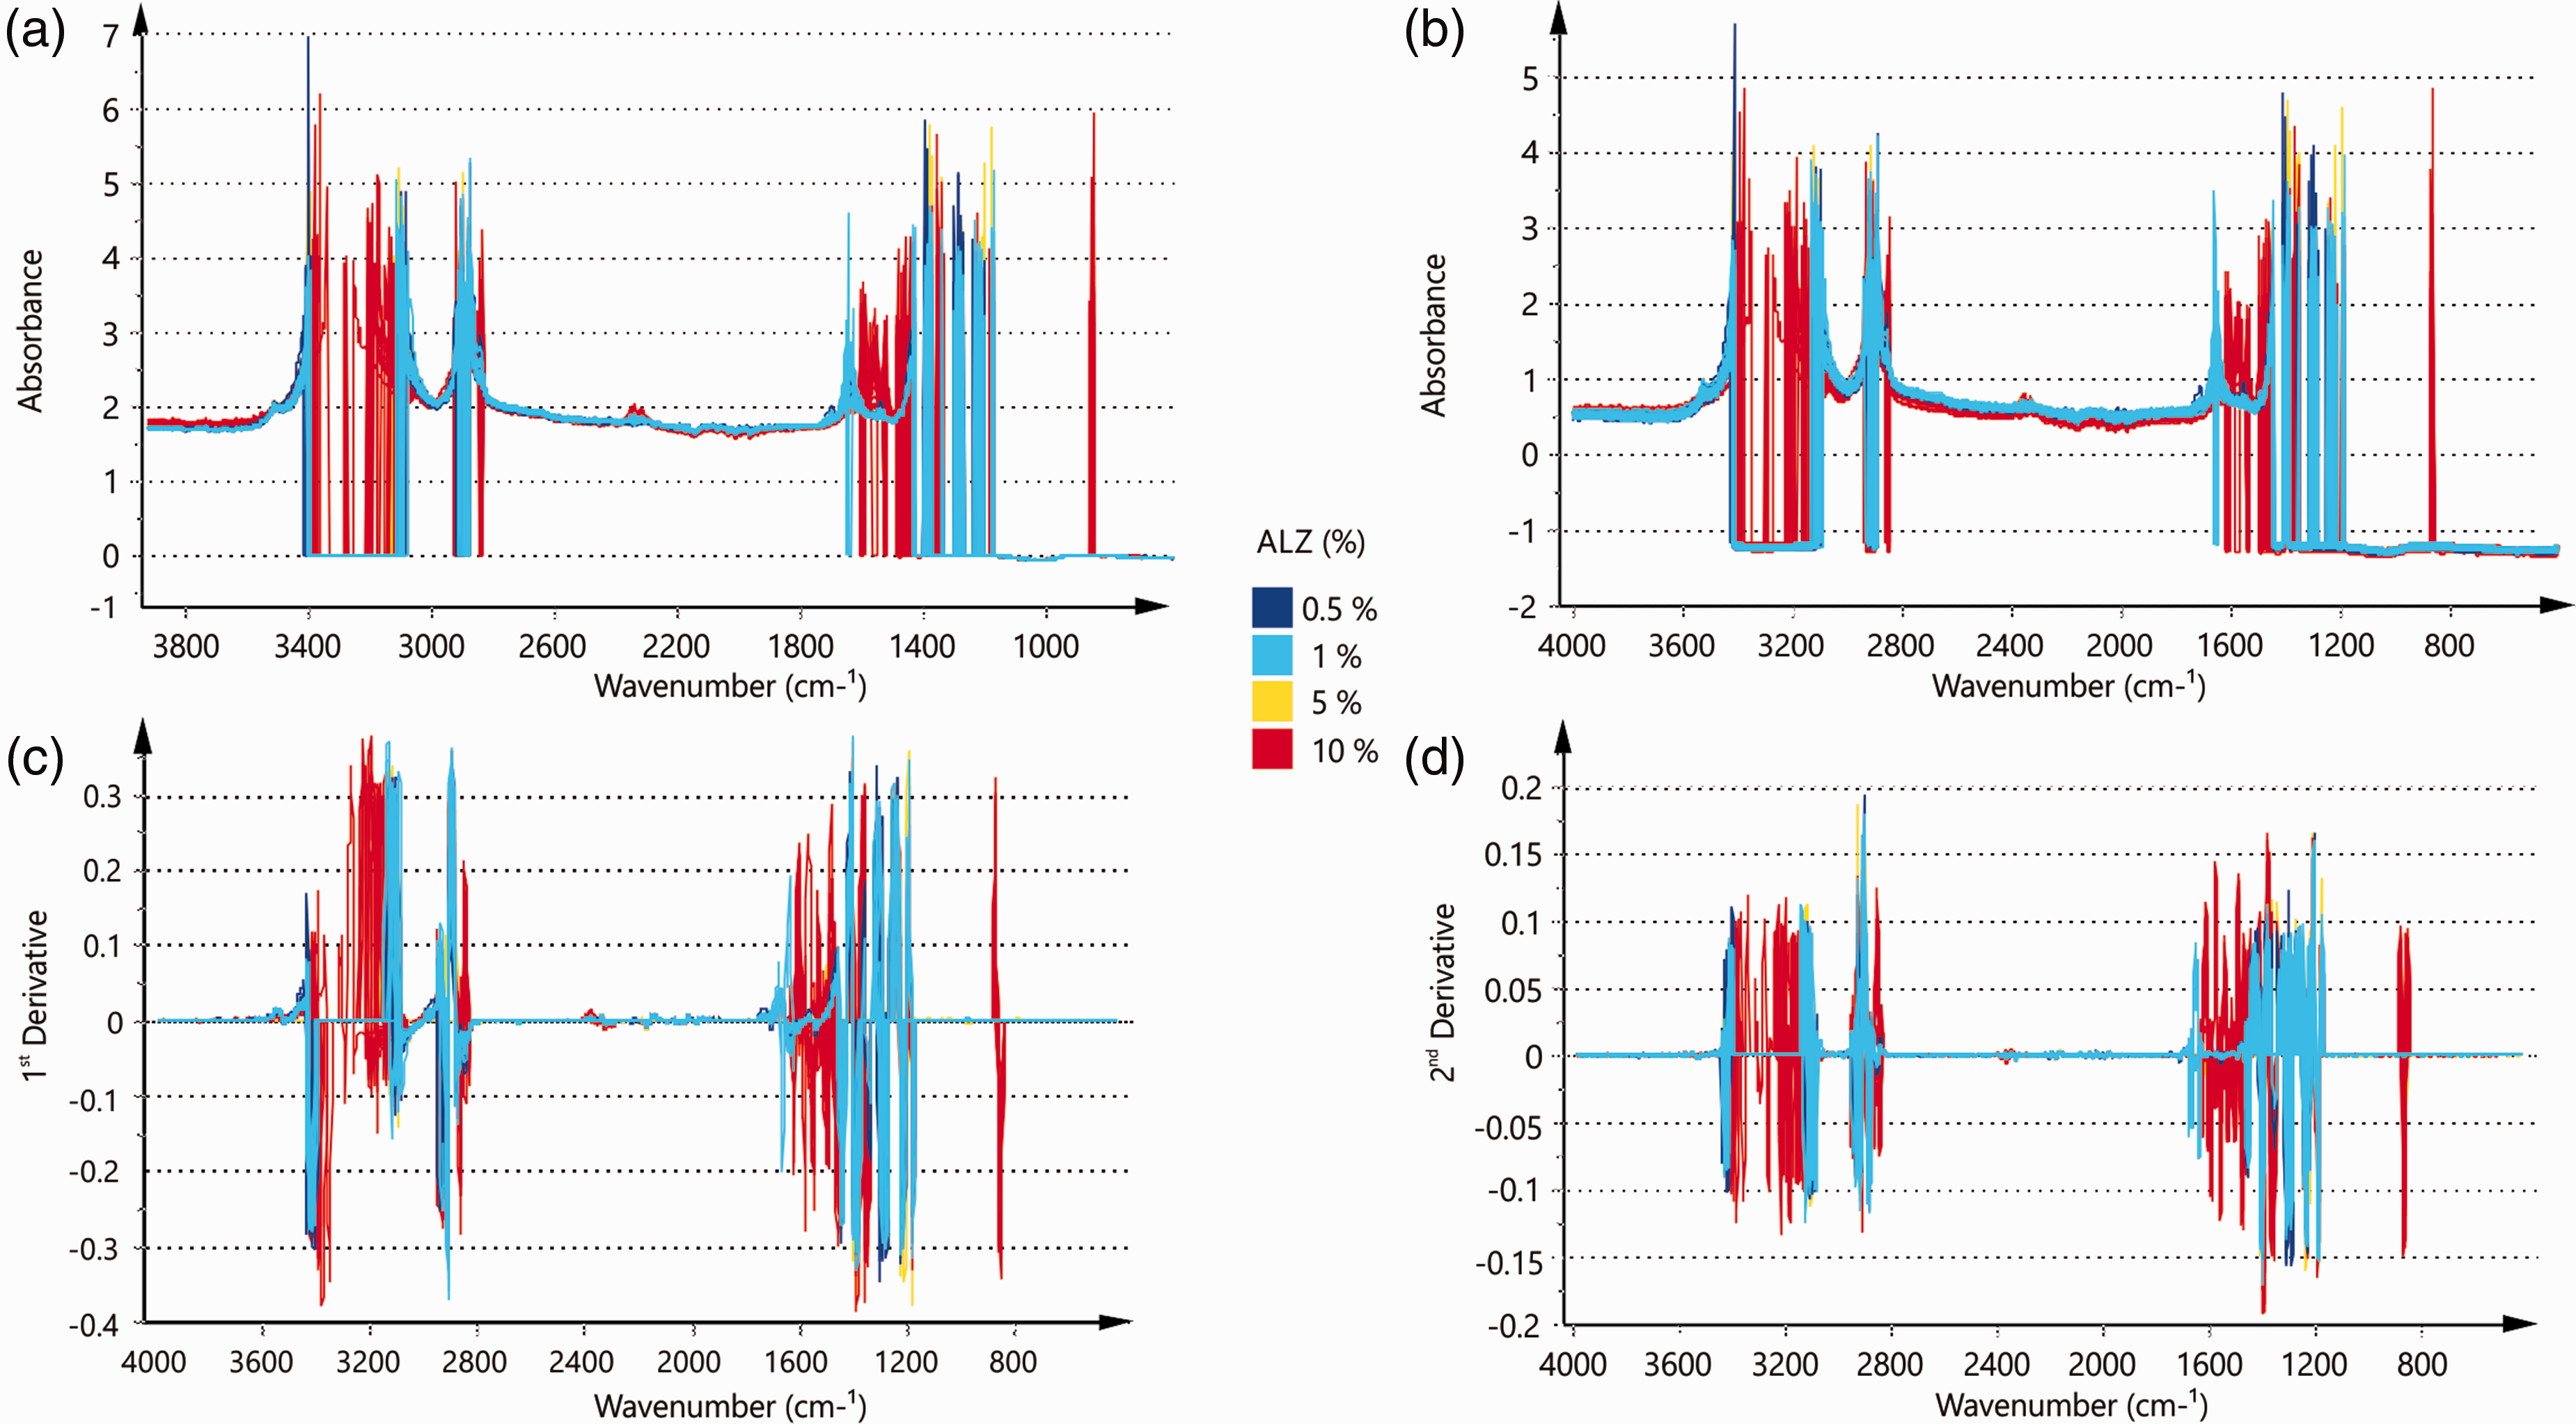
In our case, we employed PLS to correlate two data matrices (X, MIR spectra; Y, ALZ content) in a multivariate linear analysis that extracts principal components of both X and Y data, which are further employed to build the regression model. In addition, we introduced the OPLS to improve the prediction performance of the model by eliminating orthogonal variation in X. The orthogonal variation is usually occurring due to sources of variation that are not correlated with the measured properties, i.e., it is the non-predictive part of X matrix. 20 However, in the case of the MIR calibration data, the orthogonal variation showed no significant influence over the overall prediction error of the models.
The PLS and OPLS models of the MIR spectra, in all transformation modes, were characterized by a high correlation coefficient (R2Y) among the X and Y matrices and high predictivity coefficients (Q2). It means that the models are capable of explaining > 95% of the variations in the Y matrices and, at the same time, are able to predict a new dataset in the matrix. However, lower values of R 2 X indicated that a larger portion of the variation in the X matrices could not be explained by the models. In addition, the values of the RMSEE and the RMSEcv are rather high. These descriptors stand as an absolute measure of the model accuracy. In all the MIR PLS and OPLS models, their values indicated poor accuracy for the quantitative determination of ALZ, when present in low-content powder blends. Such observations probably arise due to specific conditions needed to acquire the ATR-MIR spectra. The low contact area of the ATR crystal tip restricts the scanning volume of the powder blend, thus drastically reducing the probability of scanning a representative/uniformed sample in a single step. An additional limitation is the thickness of the solid sample with regard to the ATR spectra collection from the sample surface that might disturb the good homogeneity. In order to maximum downsize this issue, we have performed scans on 20 different subsamples from each powder blend and managed to obtain statistically relevant data to build the calibration model. Larger ATR crystal would enable scanning of greater sample volumes, obtaining reproducible spectra in a single step. However, in that case, there will be an issue with the nonuniformity of the contact among the sample and the large area ATR crystal that could affect the scanning precision. 21 Diffuse reflectance is another scanning mode that could handle larger sample amount by illuminating its surface and collecting sufficient scattered radiation with ellipsoids and paraboloids. Nevertheless, the diffuse reflectance MIR spectroscopy is a very limited technique with regard to its use for quantitative analysis due to the important role of the physical characteristics of the diluent and the analyte (particle size, surface roughness, refractive index, reflectivity, and absorption characteristics) over the reproducibility of the results. 22
Since the raw data PLS model presented the most favorable statistical descriptors, the following section narrowly encompasses our discussion only on this MIR-based calibration model.
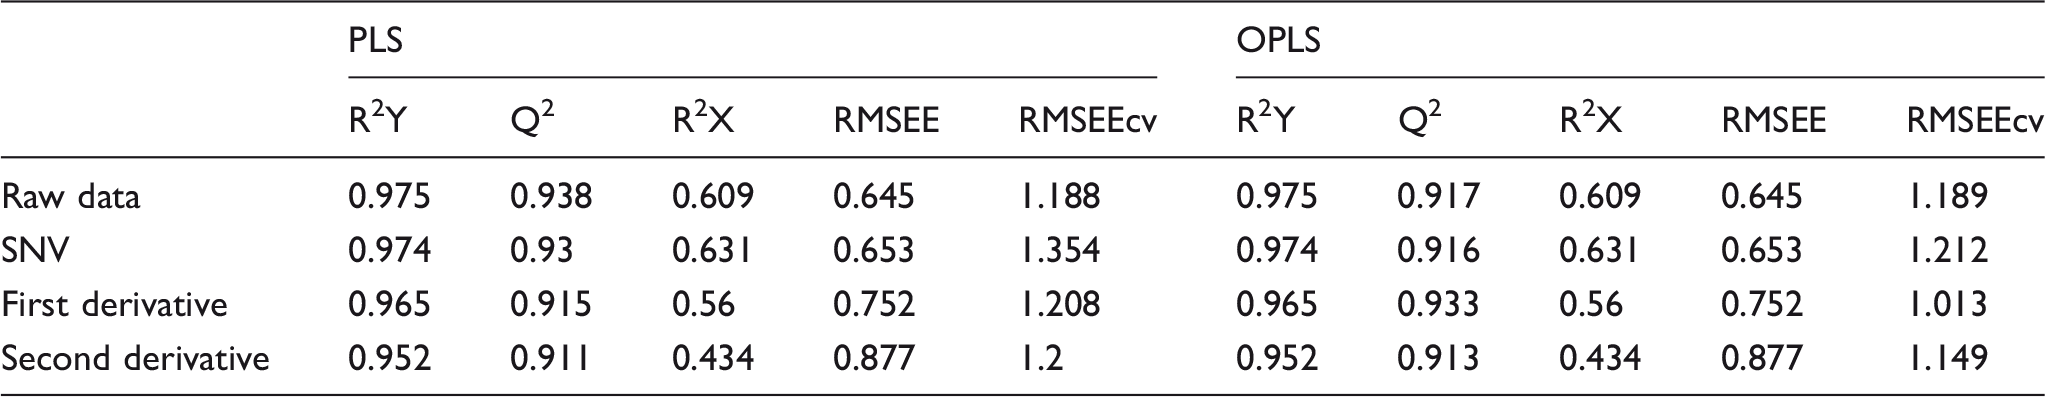
The coefficient, VIP, and Y-observed versus Y-predicted data plots of the raw data MIR PLS model are presented in Fig. 2. The coefficients (B) refer to the linear regression PLS model equation when it is written in its basic form (Eq. 4)
Analysis of the PLS calibration model of the raw MIR spectra of ALZ:lactose monohydrate blends: (a) coefficient plot, (b) VIP plot, (c) observed versus predicted plot.
The size of the coefficient represents the extent of the change in the Y variable when the X variable varies for one standard deviation while the other variables are kept at their averages. These coefficients express how strongly the ALZ content is correlated to the systematic part of each wavenumber of the MIR spectrum. On the other hand, the VIP plot summarizes the importance of the variables both to explain X and to correlate to Y, where VIP values larger than one indicate to “important” X variables (wavenumbers), and values lower than 0.5 indicate “unimportant” X variables (wavenumbers). The Y-observed versus the Y-predicted plot displays the correlation among the observed and predicted data. If the data points lie in close proximity of the regression line then the model could be perceived as accurate.
According to the presented results, the ALZ bands at 3100, 2916, 1613, 1538, 1488, 1444, 1350, 1301, and 832 cm−1 should be considered as the most important quantitative determinants in the MIR spectra of the ALZ:lactose blends. The Y-observed versus Y-predicted plots reveal that the model points are scattered around the regression line, thus confirming the low-model prediction accuracy, discussed previously. The relative difference among the points of the predicted (MIR model determined) and observed (HPLC determined) data reveal significantly greater discrepancy for the batches with lower ALZ concentration, highlighting the subsampling issue of this instrumental setup (Figure S3a).
Development of NIR Spectra Calibration Model
The same sample preparation, as described in the Raman spectroscopy part, was used in the development of the NIR spectra calibration model. The NIR spectra of the pure substances are presented in Figure S4.
The ALZ NIR spectrum (Figure S4a) presents a broad band with two shoulders at 8826 and 8745 cm−1 that originate from the second overtone of the CAr–H stretching and second overtone of the C–H stretching from the CH3 group, respectively. 23 The sharp band at 7289 cm−1 could be assigned as a combination of the second overtone of the C–H stretchings + C–H deformations, while the intensive broad band with maxima at 5966 and 5929 cm−1 and a weak sharp band at 5782 cm−1 are assigned to the first overtone of the CAr–H stretching vibrations. 24 The intensive sharp band at 4660 cm−1 could be assigned to the combined benzene ring C–C and C–H stretching vibrations. 25
The lactose monohydrate NIR spectrum (Figure S4b) is characterized by a distinctive first and second overtone of the O–H stretching vibrations at 6870 and 9579 cm−1, and a combination band of O–H stretching and deformation mode registered at 5170 cm−1. In addition, the third and second overtone of the C–H stretching mode from CH and CH2 groups could be assigned at 10781 and 8259 cm−1, respectively, where the former band also evolves from the third overtone of the ROH mode. The first overtone of the mentioned C–H stretching vibrations from CH2 and CH in the monomer units could be assigned to the bands at 5781 and 5676 cm−1, respectively. 26 The band around 5200 cm−1 is attributed to the combination band of the stretching and bending H–O–H vibrations (lactose monohydrate).
The NIR spectra of the pure substance evidently exhibit very broad and complex structured bands that are significantly overlapped and overlaid, making this spectral part less sensitive for analytical considerations. Despite this limitation, the calibration model was built on five different NIR scans acquired from each ALZ:lactose monohydrate blend with different ALZ content. The spectra were analyzed in their raw form, by using SNV transformation, and in their first and second derivatives (Fig. 3) in a separate PLS and OPLS models, respectively. Four components were extracted for the raw data and SNV PLS models, while three and two components were used for the first and second derivative PLS models, respectively. One main component and an additional three orthogonal components were extracted in the raw data and SNV OPLS models, while one main and additional two and one orthogonal components were employed in the first and second derivative OPLS models, respectively. The main statistical descriptors for the models are given in Table II.
NIR spectra of the ALZ:lactose monohydrate blends, colored according to ALZ content (%): (a) raw data; (b) SNV transformation; (c) the first derivative; (d) the second derivative. Main statistical descriptors of the PLS and OPLS-based NIR spectra calibration models. The region 5500–5000 cm−1 was omitted from the calculations.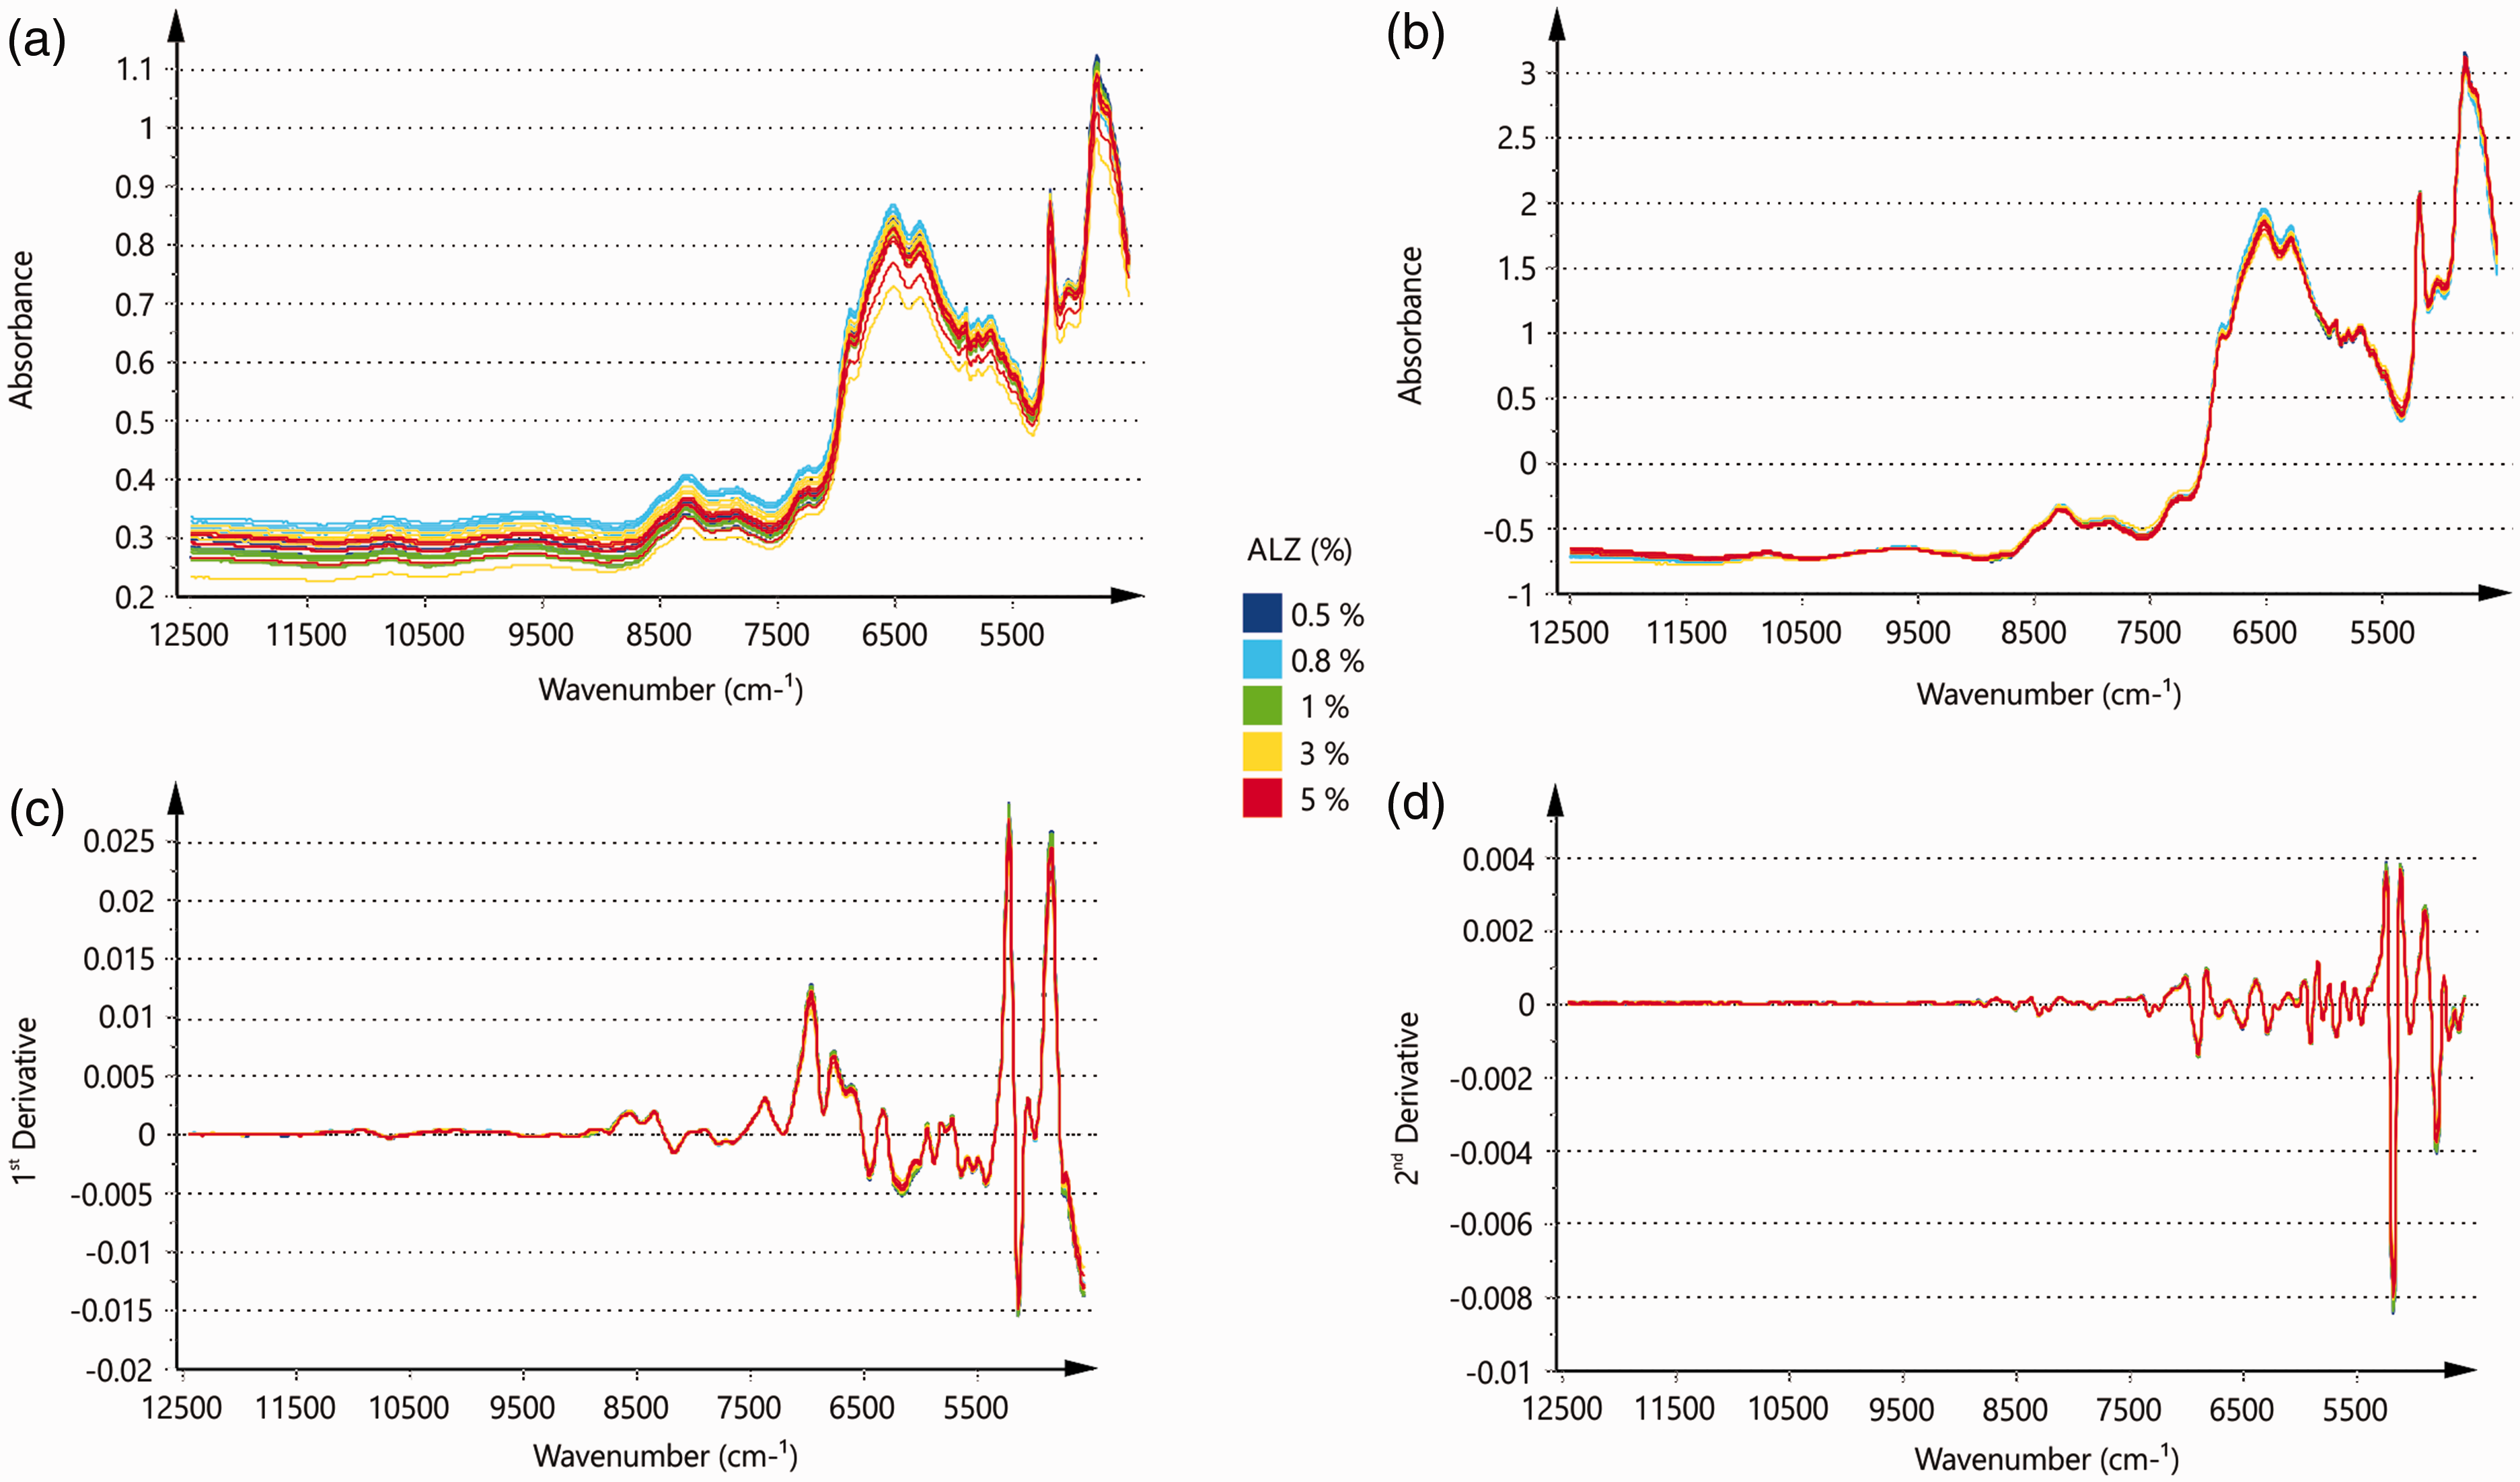
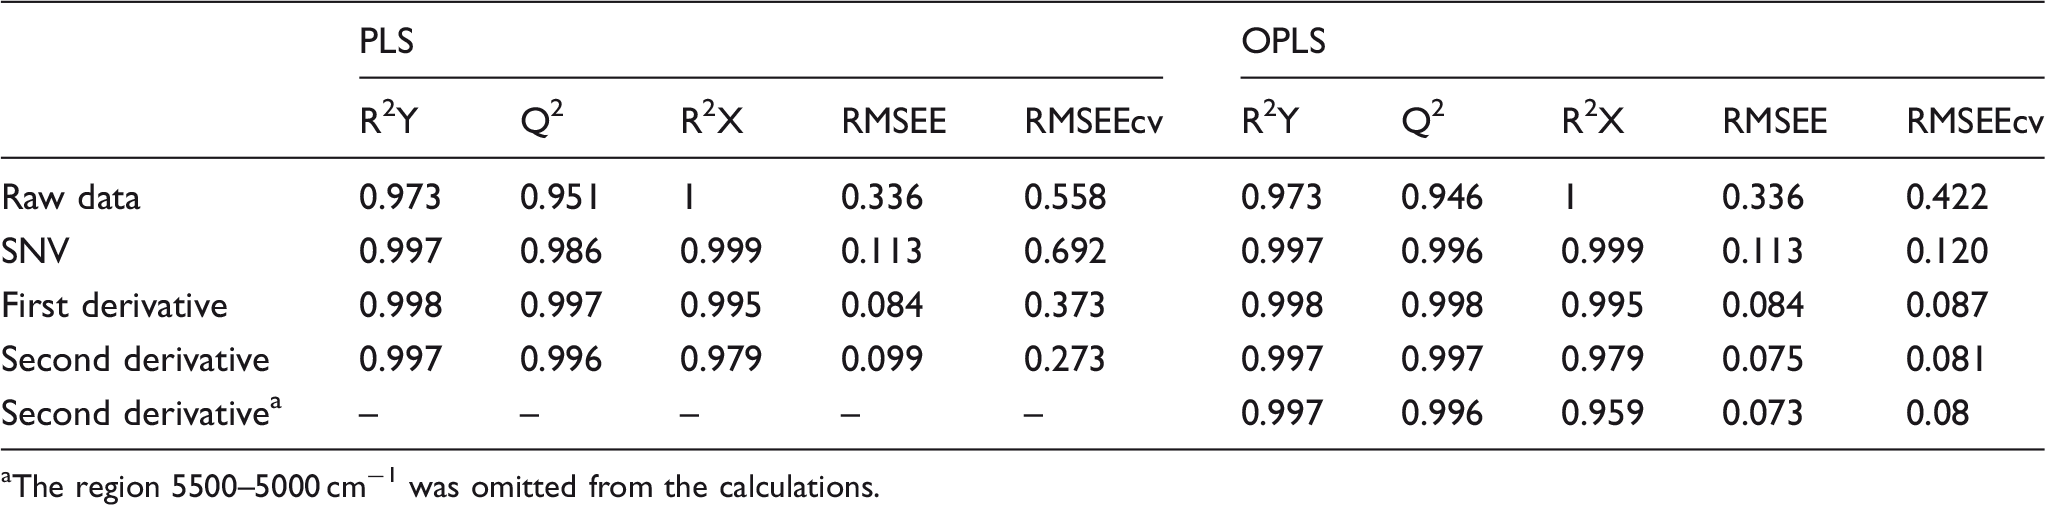
The results from the statistical analysis of the PLS and OPLS models point towards high regression coefficients and predictivity of the NIR calibrations models; however, their accuracy indicators (RMSEE, RMSEEcv) are unfavorable. Raw data models (PLS and OPLS) evidently depict large baseline shifts and the substantial NIR band overlapping of the ALZ and lactose monohydrate arising as major contributors to the low accuracy of the calibration model. Since the baseline shifts affect both the linear and orthogonal variances, the introduction of OPLS modeling cannot significantly improve the accuracy of the model. However, the RMSEE and RMSEEcv were vastly improved in the models that were generated with spectral pre-processing. Considering the above-mentioned interferences, the spectral pre-processing was needed to eliminate the effects of the baseline shifting. In addition, pre-processing helped to derivatize the wide overlapped bands and point out the spectral parts that are indicative of changes in the ALZ content of the scanned samples. OPLS model of the second derivative spectra presented the most favorable accuracy, and we have focused on its data analysis.
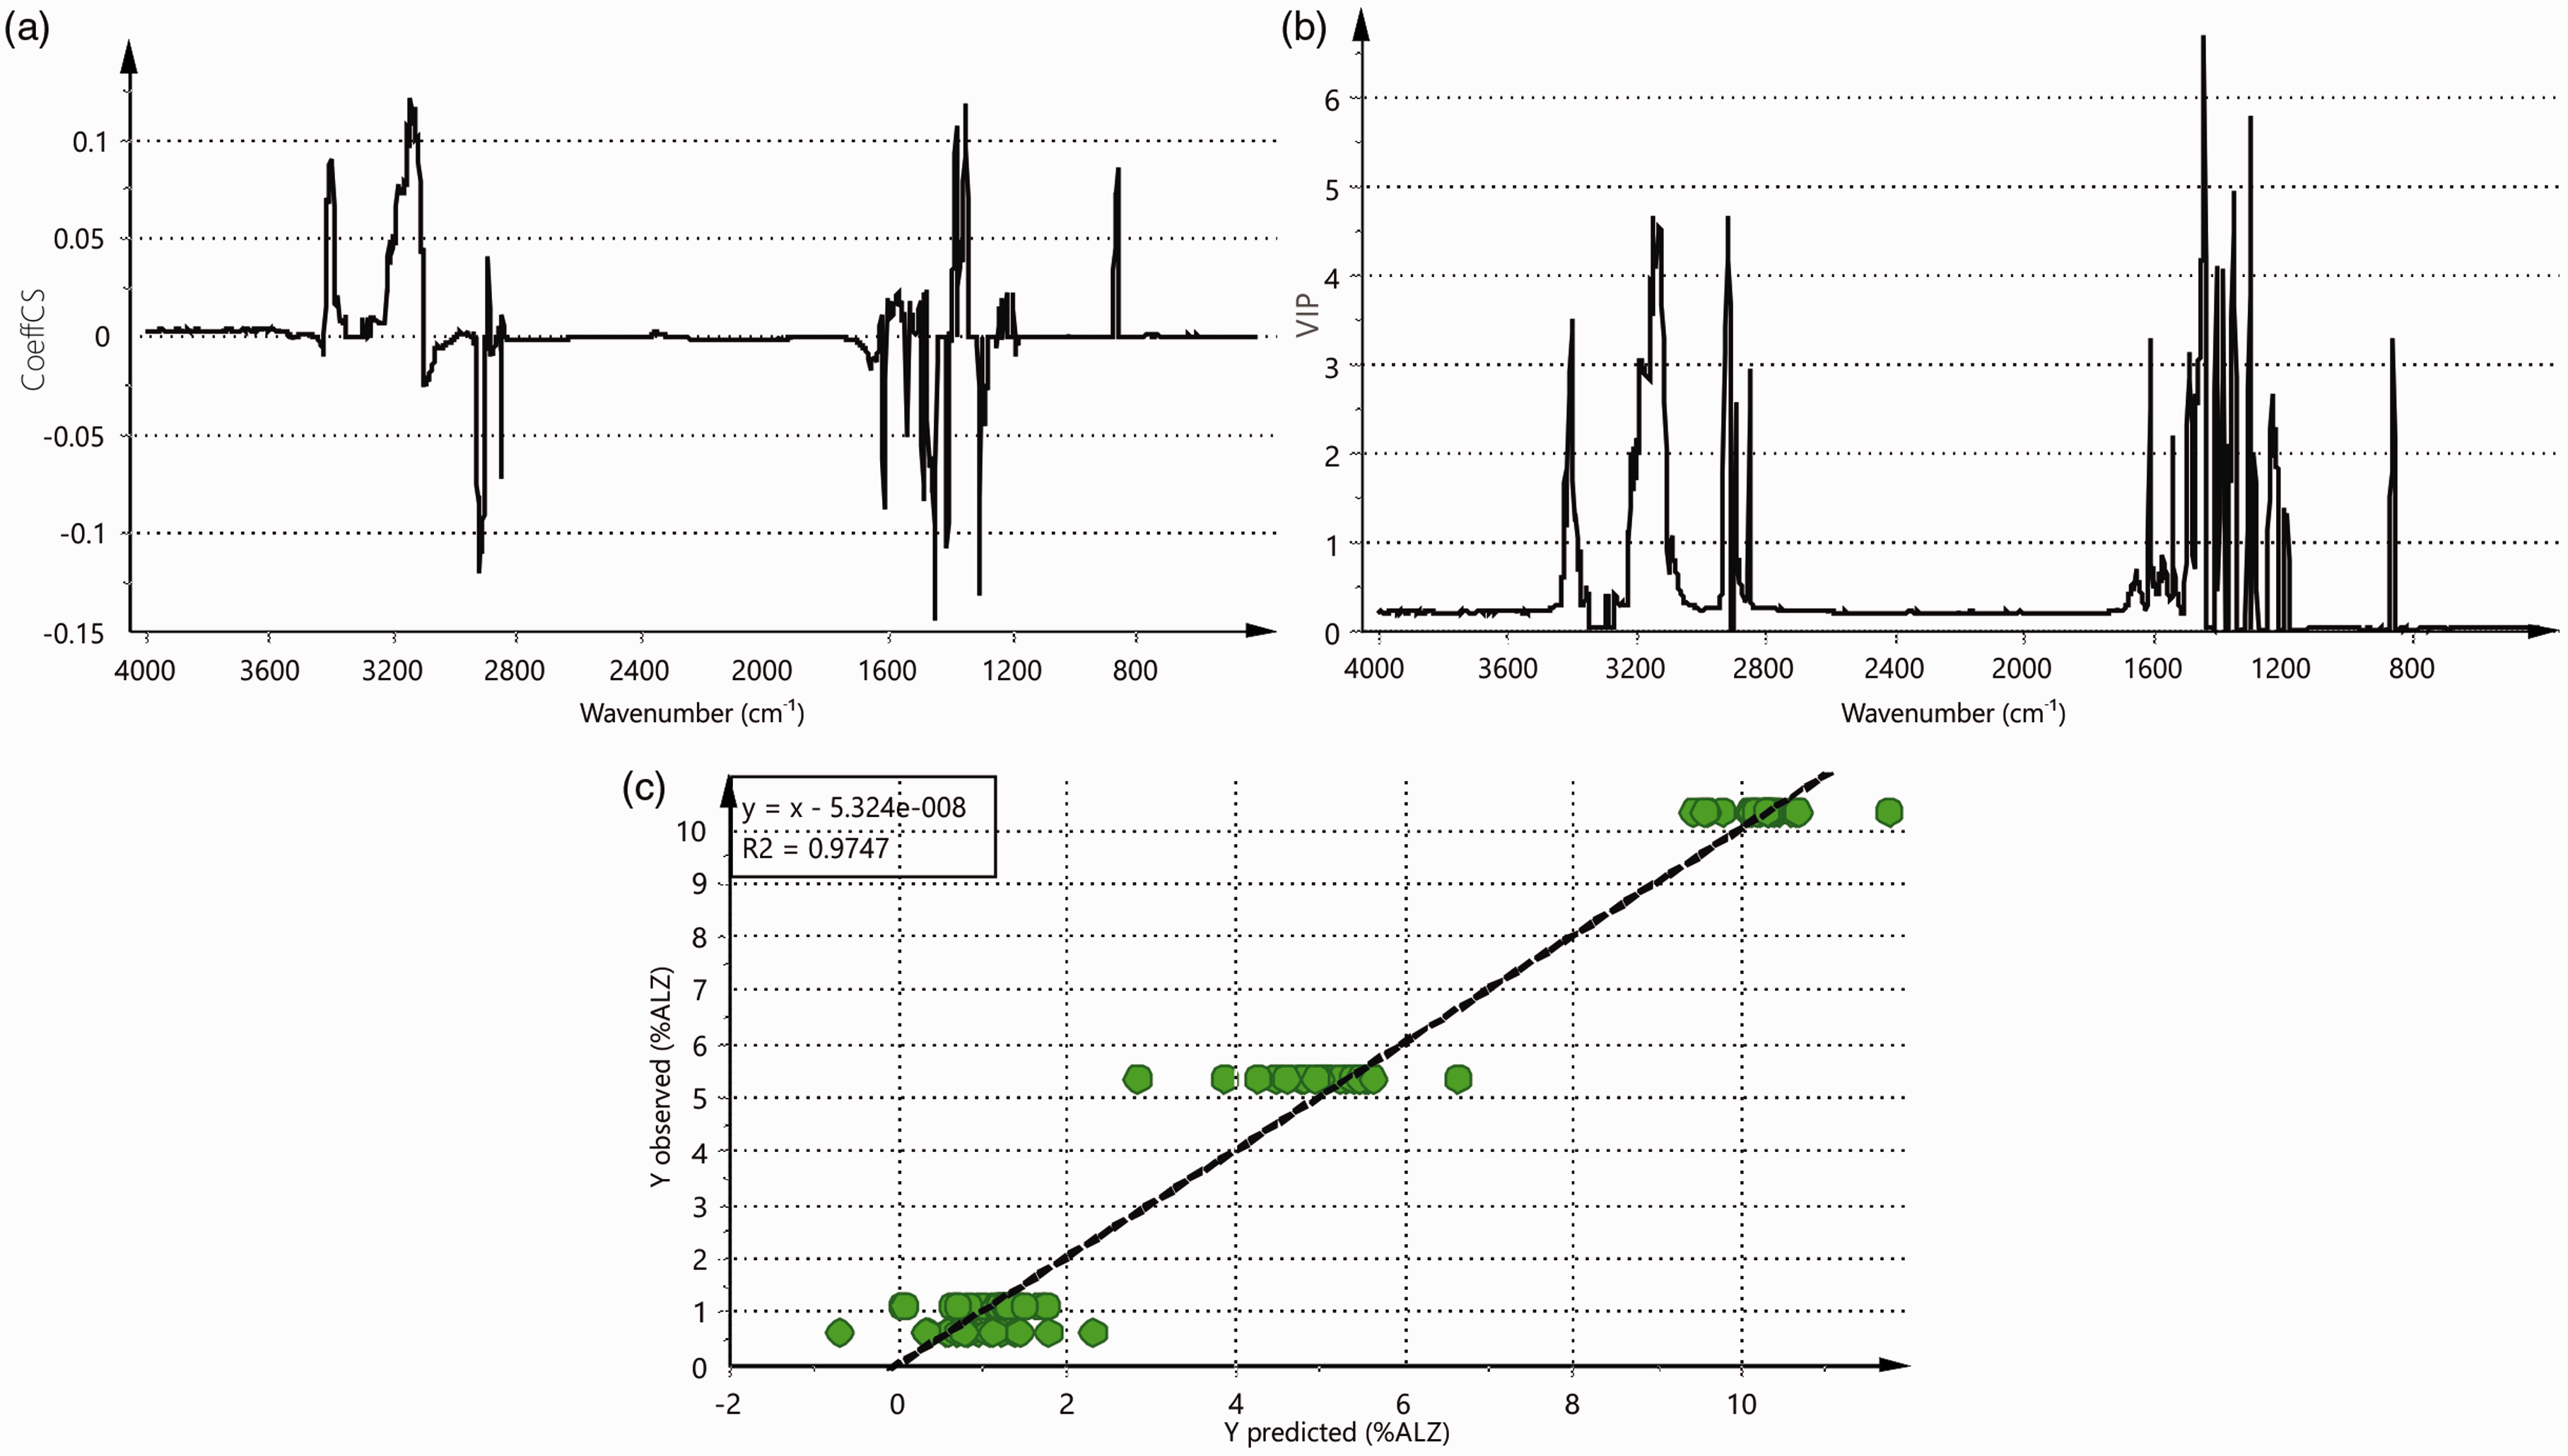
The VIP and coefficient plots and Y-observed versus predicted plot of the OPLS model of the second derivative NIR spectra are presented in Fig. 4. As observed from the VIP plot, the bands at 6087, 4727, 4651, and 4574 cm−1, distinctive to the second derivative of the ALZ spectrum (Figure S5a), were of utmost importance for the prediction of the ALZ content in the ALZ:lactose monohydrate blends. The observation was confirmed by the coefficient plot, where the bands with the highest VIP factor, were assigned with the largest coefficients. Furthermore, to eliminate possible spectral artifacts due to lactose hygroscopic behavior, which was a random (uncontrolled) event in the experiments, the region 5500–5000 cm−1 was omitted from the optimal model (OPLS from NIR spectra second derivative). Thus, the “compacted” OPLS model demonstrated results with minute improvements in the statistical indicators (Table II).
Analysis of the OPLS calibration model of the second derivative NIR spectra of ALZ:lactose monohydrate blends: (a) VIP plot, (b) coefficient plot, (c) observed versus predicted plot.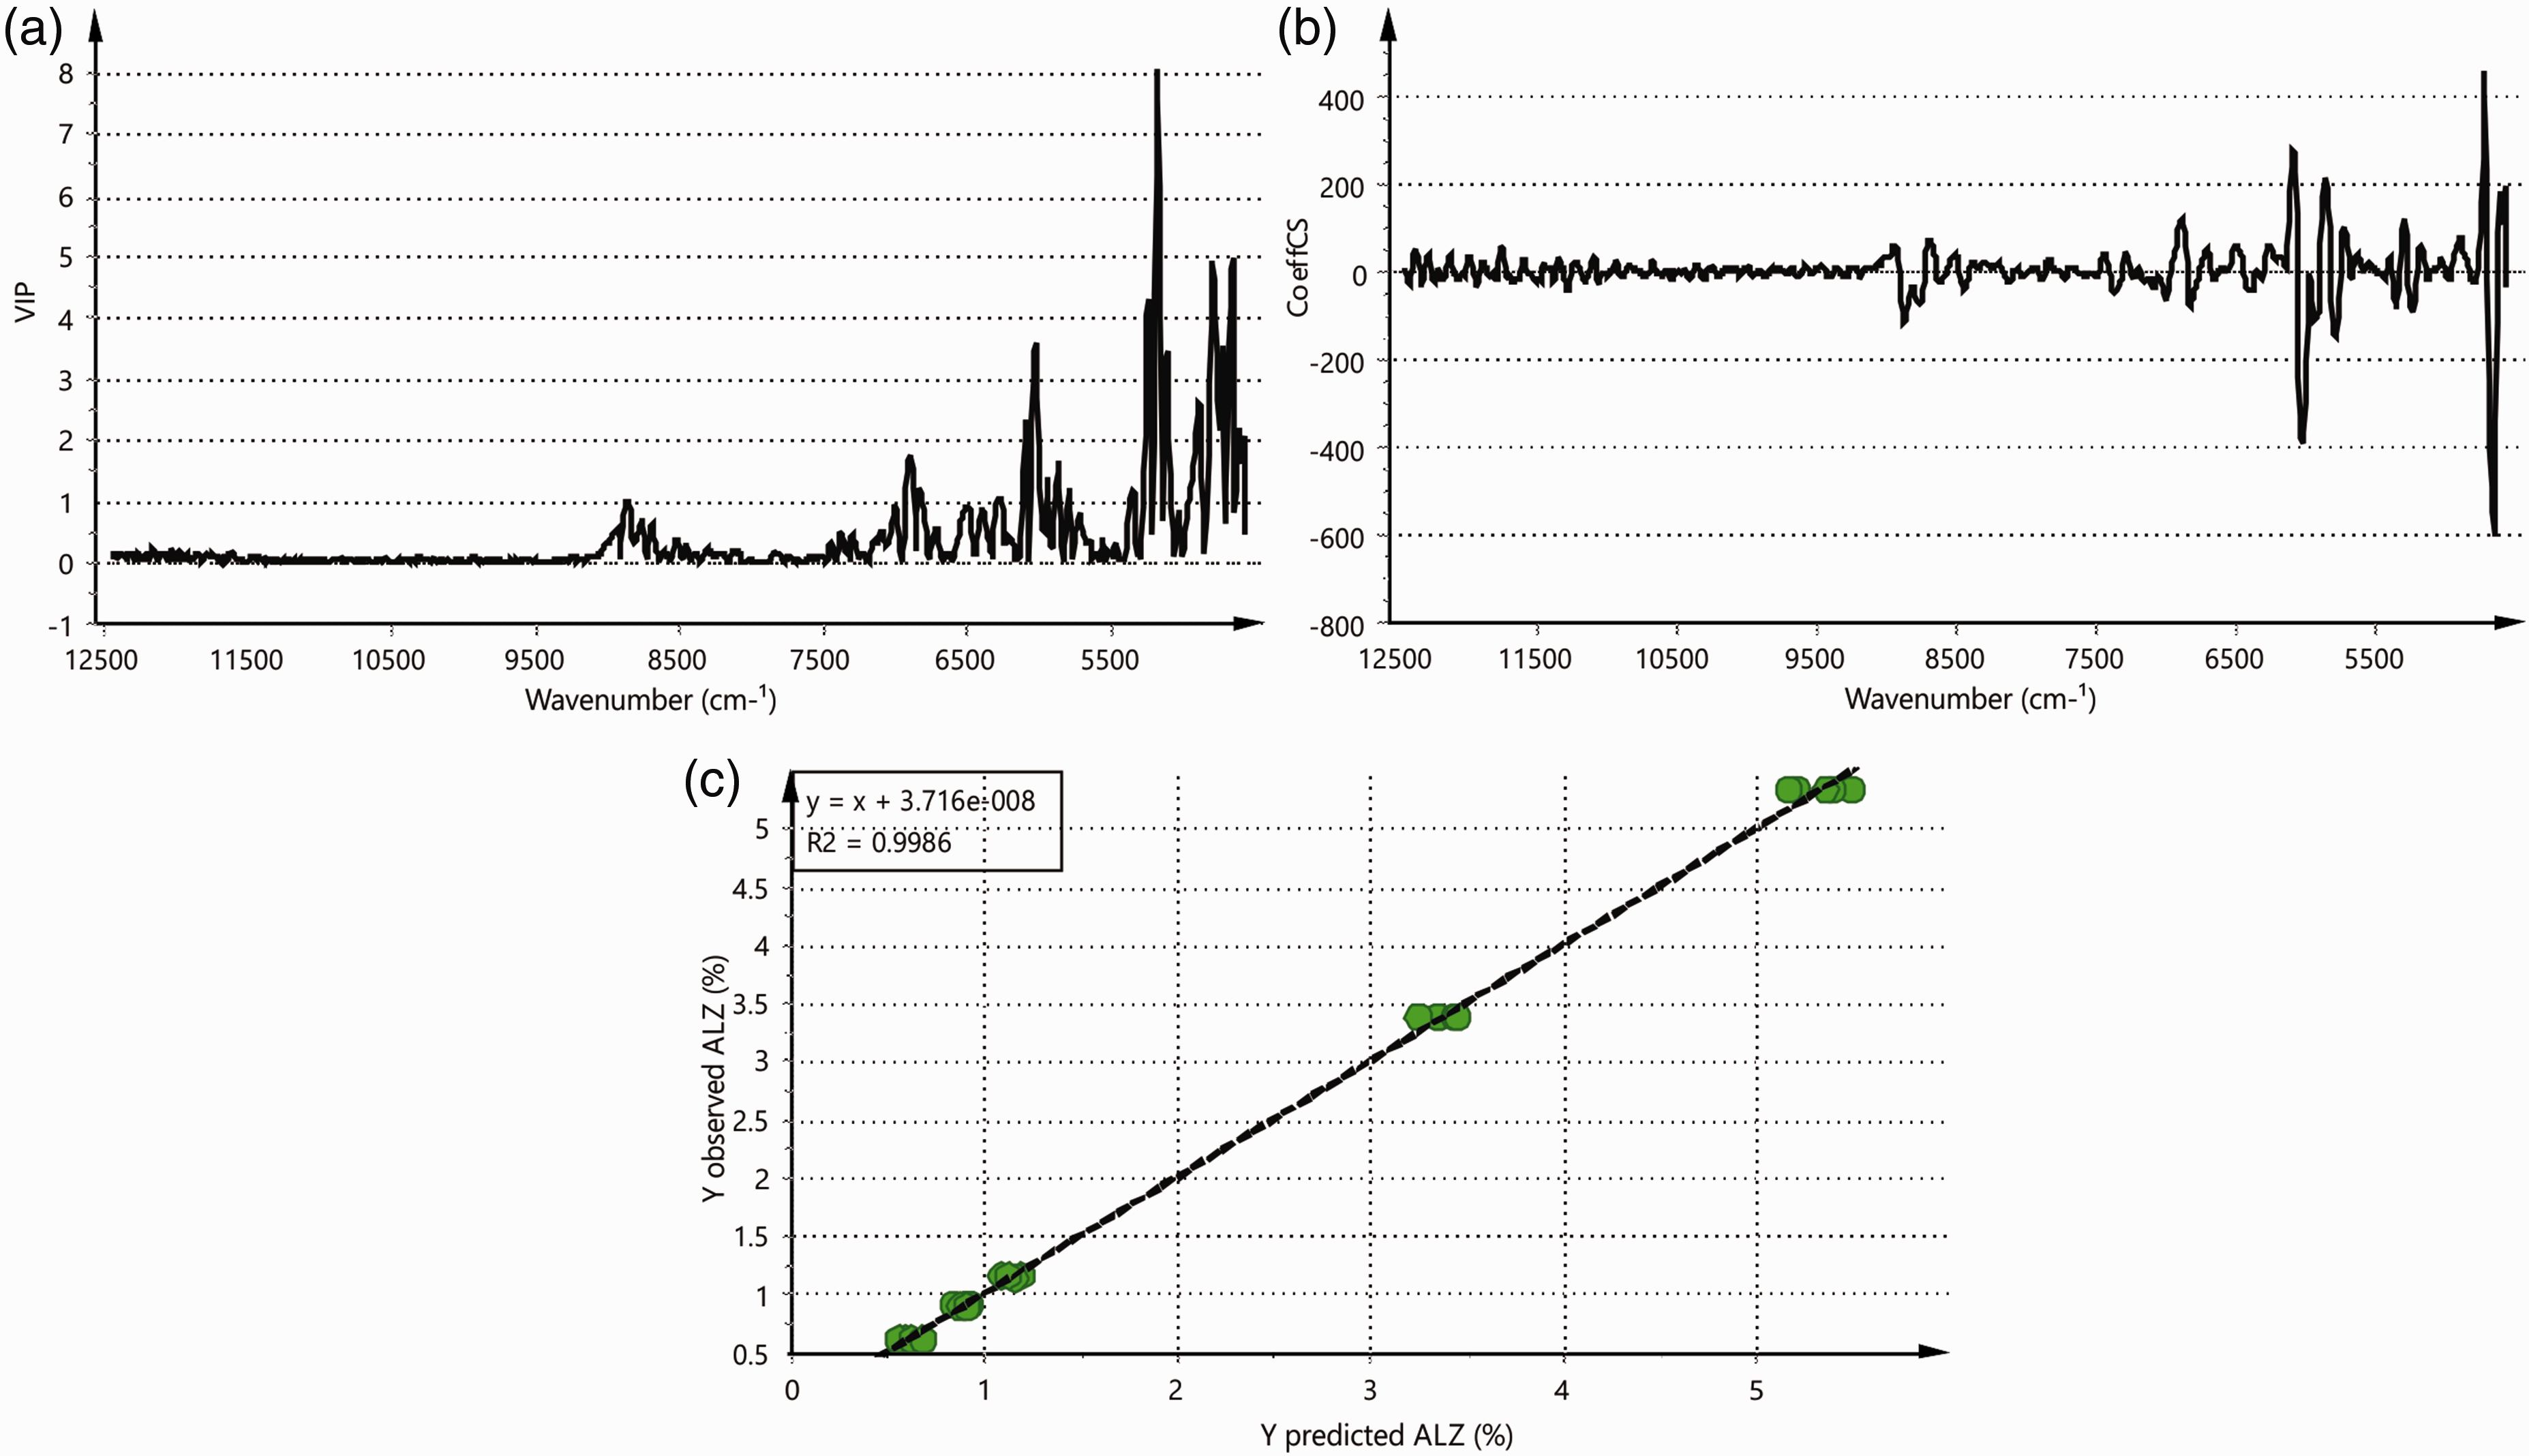
In addition, different NIR scanning modes could be employed for further precision improvement. The literature data emphasize that in cases where sample homogeneity is an issue, the transmission mode would enable higher precision relative to diffuse reflectance, due to the differences in the sample scanning depth and overall sample scanning volume.27,28 In this case, the samples were homogeneous and their whole surface was scanned using the fiber optic probe resulting in a high correlation coefficient among the predicted and measured ALZ content and satisfactory levels of model predictivity. This could be additionally confirmed by the relative difference among the points of the predicted and observed data (Figure S3b). However, due to the poor ALZ NIR spectrum complemented by the overlap of the wide bands from the NIR spectra of ALZ and lactose monohydrate (Figures S4a and S4b, S5a and S5b), the model was built on a lower number of points with appropriate importance for ALZ content prediction (VIP coefficient), resulting in higher RMSEE and RMSEEcv.
Development of the Raman Spectra Calibration Model
All analyzed samples from the powder blends prepared with different ALZ content were compressed to achieve a flat scanning surface and therefore eliminate irregular surface depth and avoid focus misalignments during the Raman mapping scans. The Raman spectra of pure ALZ and lactose monohydrate are presented in Figure S6.
The main feature of the ALZ Raman spectrum is the strong bands at 1593 and 1604 cm−1, which are assigned to the C = N and C = C stretching vibrations. 14 In addition, a very strong band at 996 cm−1 arising from the benzene ring “breathing” mode is characteristic for the unsubstituted phenyl group at position 5 of the diazepine ring. A specific pattern of bands centered at 678, 1022, 1033, 1158, 1264, 1330, and 3067 cm−1 that originate from the 1,4 benzodiazepine ring is also registered in the ALZ Raman spectrum. The band at 678 cm−1 could be assigned to in-plane aromatic ring deformations, while the band at 1022 and 1033 cm−1 are assigned to aromatic in-plane C–H bending vibrations. The skeletal C–C–N stretching vibration in the benzodiazepine ring appears as a strong band at 1158 cm−1, while the aromatic C = C stretching mode gives rise to a weak band at 1264 cm−1 and two superimposed medium intensity bands at 1301 and 1306 cm−1. The medium band at 3067 cm−1 could be assigned to the aromatic C–H stretching vibration. 14
The lactose monohydrate Raman spectrum is characterized by a set of bands in the region 3000–2800 cm−1 that originate from the C–H stretching vibration of both glucose and galactose, with the most intense band originating at 2883 cm−1. The 1400–1200 cm−1 region is populated by weak bands that ascribed to rocking and wagging vibrations of the CH, OH, and CH2 groups, and the region 1200–1000 cm−1 is characterized by similar weak bands originating mainly from C–O and C–C stretching vibrations. In the region of 910–840 cm−1, there is a group of weak bands that could be ascribed to bending vibrations of the C–C–O and C–H bonds and stretching of the C–C bonds. In the remaining part of the spectrum, one weak band positioned at 350 cm−1 is ascribed to COHO and HOH twisting vibrations. 18
The significantly prominent differences between the Raman spectral view of ALZ and lactose, especially the richness of the bands in the ALZ spectrum in the region between 1700 and 1000 cm−1 and appearance of the bands above 3000 cm−1, as well as the exceptionally sharp bands and their narrow full width half-maximum compared to IR spectra, positions Raman spectroscopy ahead of IR spectroscopy as superior technique that enable discriminant features between both compounds.
The calibration model was built on average spectra from 36 scans of each Raman mapping of the compressed ALZ:lactose blends with different ALZ content. The mapping was performed to overcome the issue of inadequate subsampling due to the small scanning surface of the current instrumental setup. Sample rotation during spectral acquisition with temporal averaging of the scans, the spatial averaging of the data acquired by scanning different regions of the sample (mapping), and simultaneous wide-angle illumination (WAI) are available configurations that are able to cope with the subsampling issue. 29 Simultaneous WAI is the most appropriate configuration that utilizes a wider laser beam for large sample area coverage and selective collection of Raman scattering within the covered area. The development of the WAI-based scheme on dispersive instrumentation resulted in the introduction of the pharmaceutical area testing probe. 30 This probe provides up to 6 mm diameter laser spot with a focal length of 25.0 cm and employs an array of 50 optical fibers both for illumination and collection of the scattered Raman signal, thus providing enhanced sample representation and reproducibility for very short time frame relative to the conventional mapping method employed in our experiments.
The spectra were analyzed in their raw form, by using SNV transformation, and in their first and second derivatives (Fig. 5) in a separate PLS and OPLS models, respectively. Four components were extracted for each PLS model, while one main component and an additional three orthogonal components were extracted in the case of OPLS. The main statistical descriptors for the models are given in Table III.
Raman spectra of the ALZ:lactose monohydrate blends, colored according to ALZ content (%): (a) raw data; (b) SNV transformation; (c) the first derivative; (d) the second derivative. Main statistical descriptors of the PLS- and OPLS-based Raman spectra calibration models.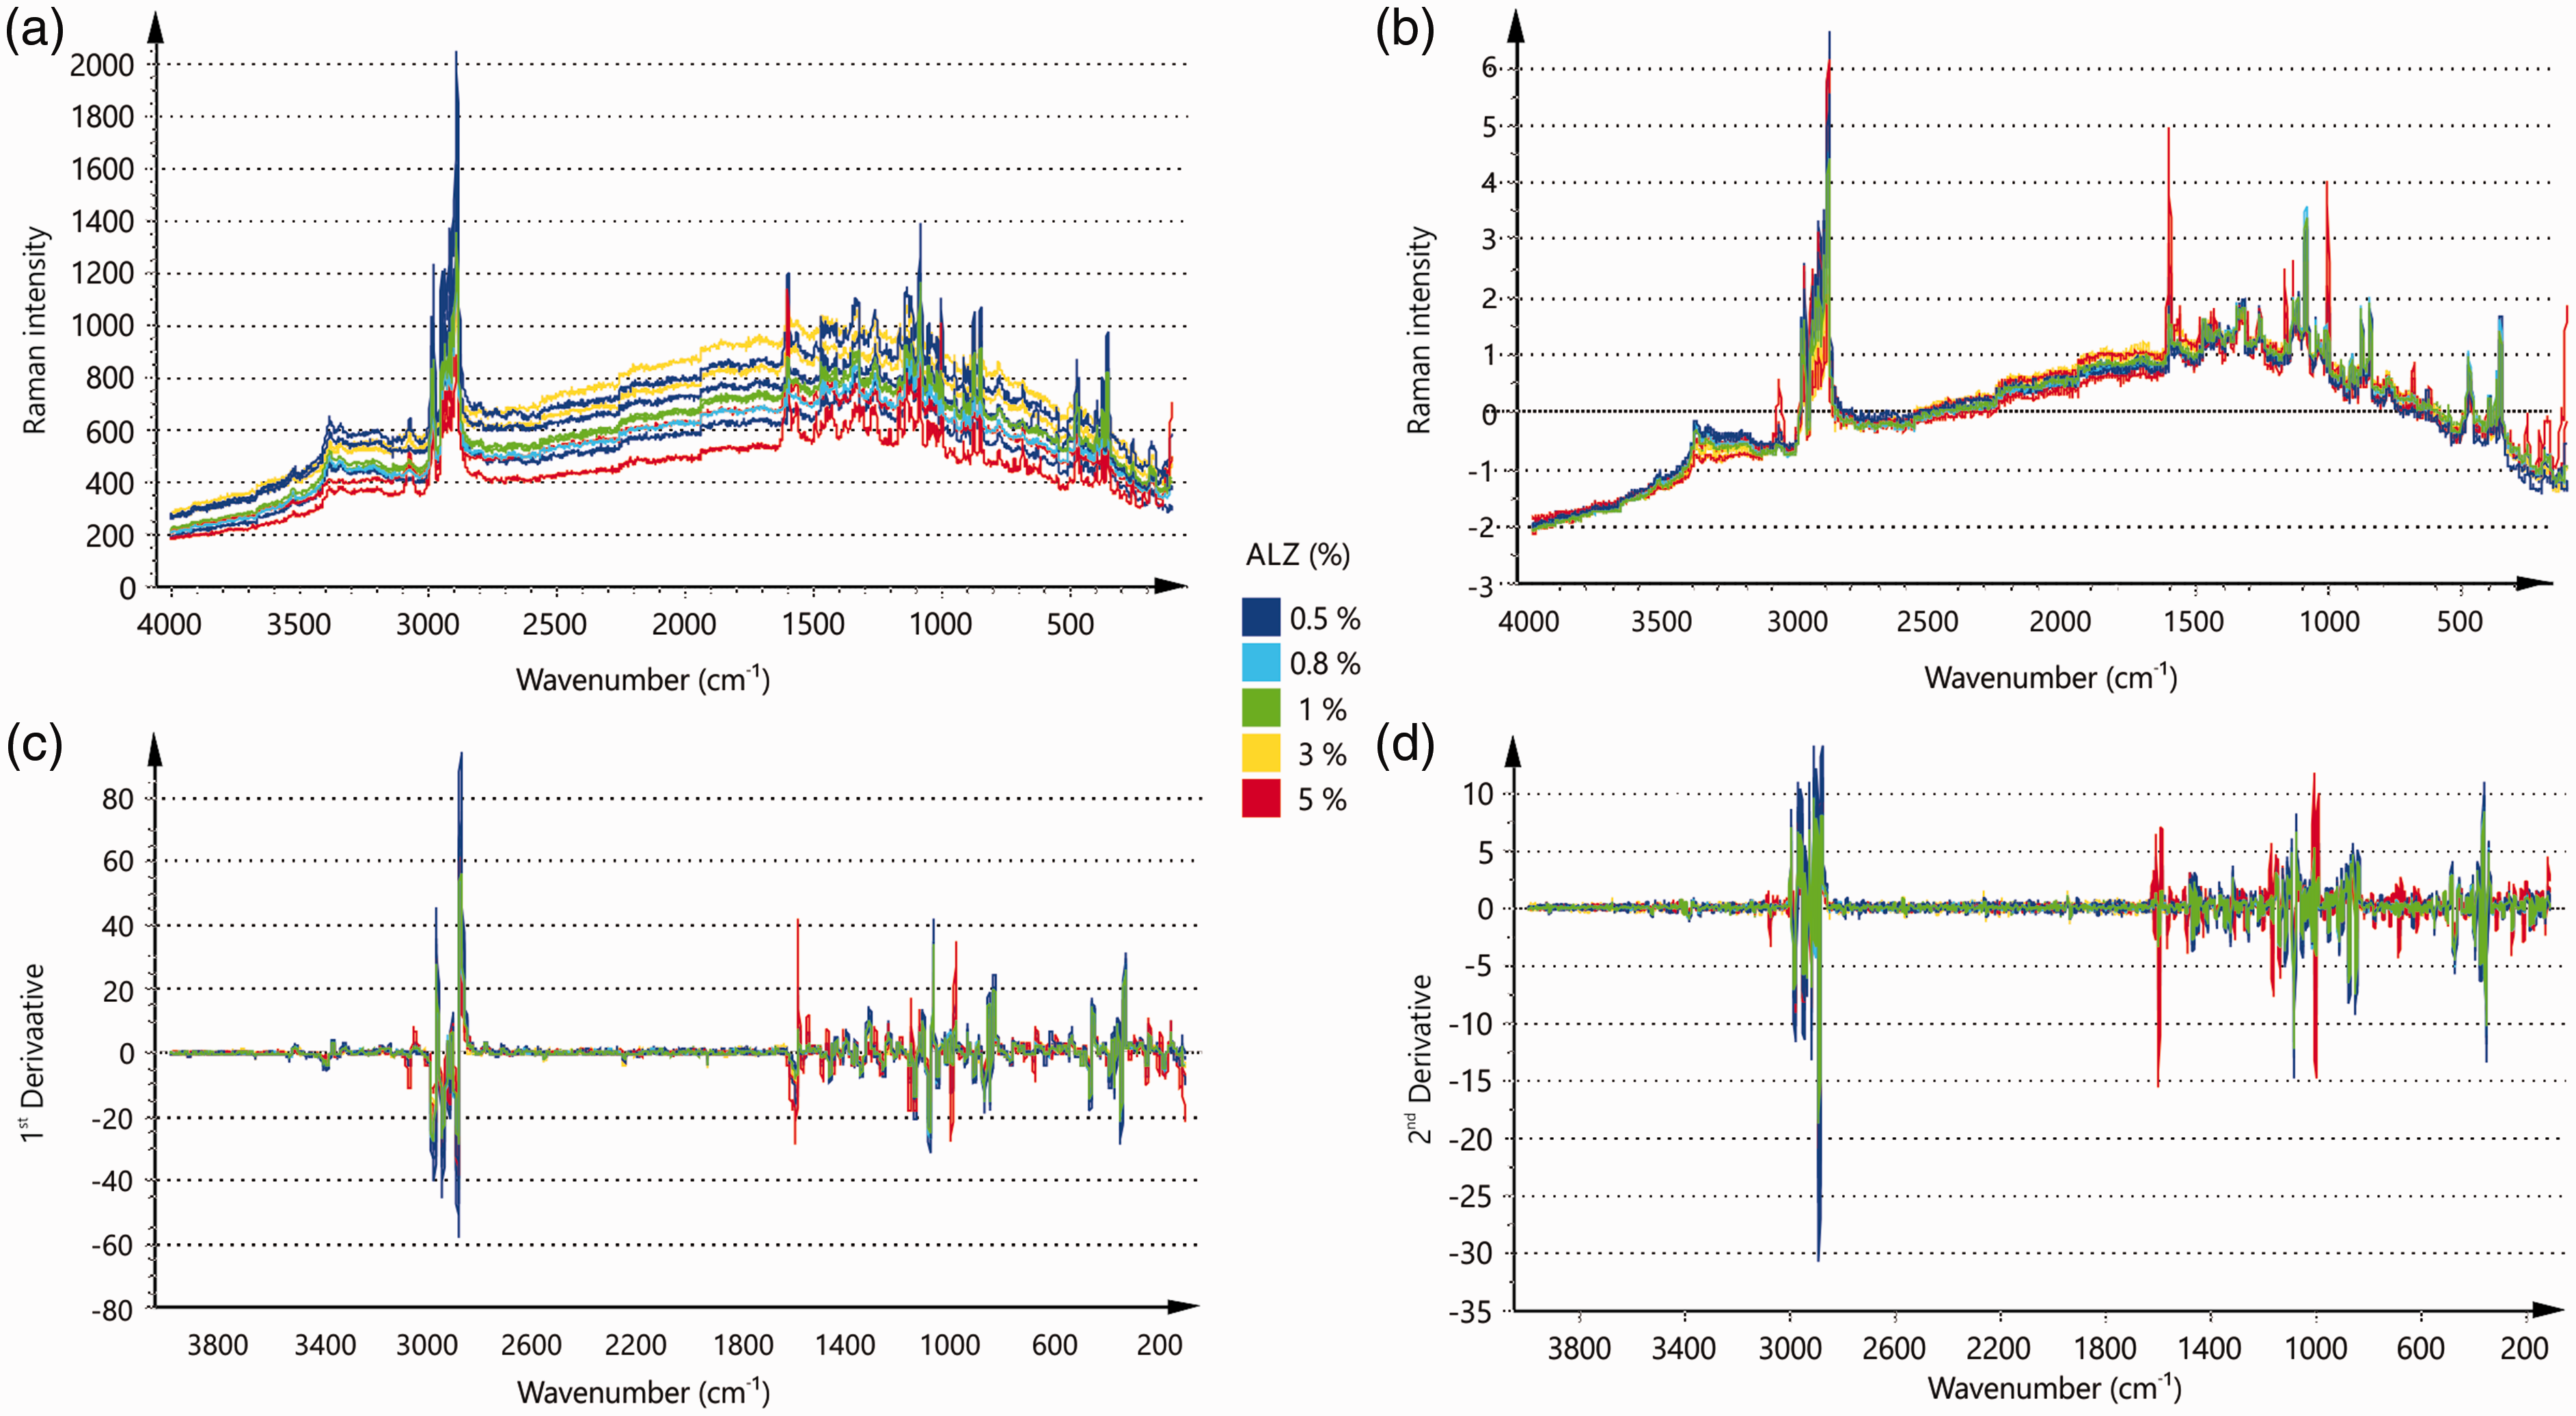
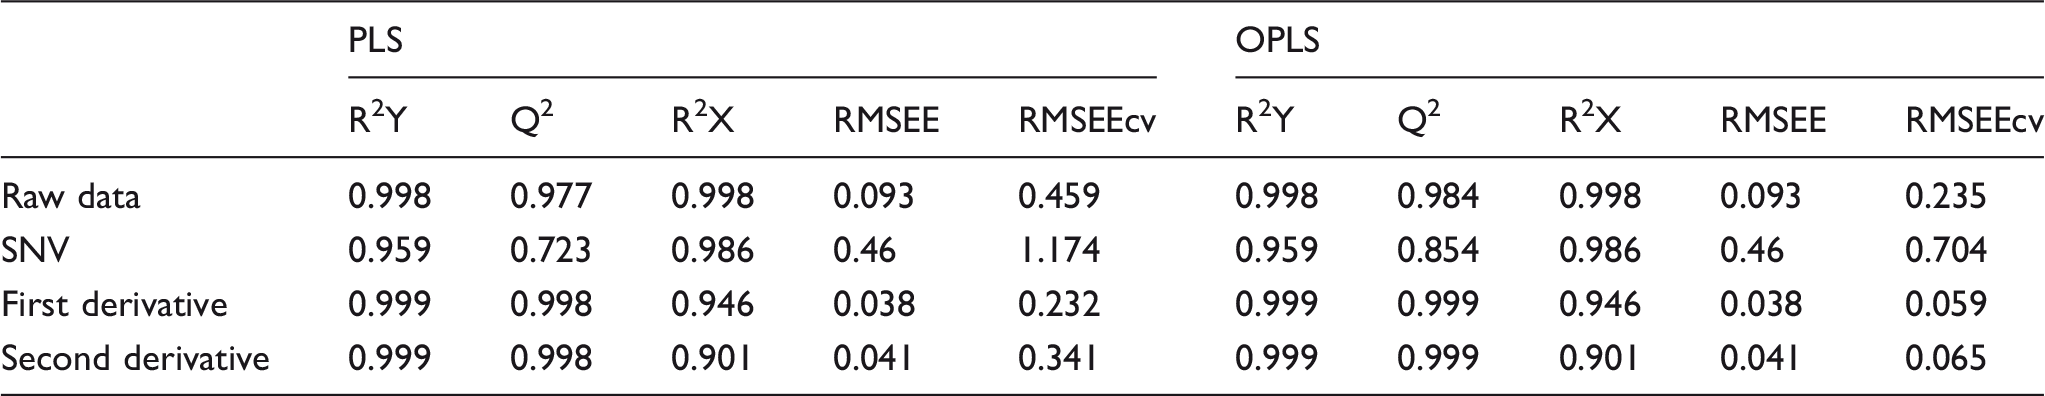
The presented results indicate high regression coefficients and predictivity of both PLS and OPLS models, which means that the models could explain the variations in the acquired Raman spectra and correlate them to the ALZ content. Since the correlation coefficient (R2) among the predicted and observed ALZ content (%) for all models was close to 1, the RMSEE was quite low. However, the cross-validated RMSEE indicated subtle spectral interferences that might affect the model accuracy. The effect of the interferences was suppressed with the application of appropriate spectral pre-processing, which was evident by the significant reduction of RMSEEcv in the PLS models of the derivatived spectra relative to the model that analyzed the raw data. Photon shot noise, fluorescence background, and externally generated noise (i.e., cosmic rays) are considered as common noise sources in the Raman scattering. 31 Therefore, in this case, spectral pre-processing was needed to improve the signal-to-noise ratio and eliminate the interferences that are not correlated to the dependent variables and could affect the model correlation, predictivity, and accuracy. Additionally, the employment of OPLS, significantly increased the accuracy of the models, regardless of the spectral preprocessing, thus confirming the importance of the so-called “orthogonal” variances on the PLS model performance. Taking into account that the calibration models of first-order derivative Raman spectra demonstrated the most favorable statistical descriptors, further part of the work encompasses PLS and OPLS data analysis.
The analysis of both PLS and OPLS calibration models of the first derivative spectra are presented in Fig. 6. Both models depicted nearly the same results patterns, regarding all analyzed parameters. However, the OPLS model demonstrated a reduced VIP score for the spectral parts that were not correlated to the ALZ content. Even though the VIP score reduction was relatively small, when considering the enormous volume of spectral data points that were treated as “orthogonal” variance, it is logical to assume that such intervention will affect the model accuracy. According to the coefficient and VIP score plots (Figs. 6a to 6d), the most dominant bands indicative to the presence and absence of the ALZ content were: (i) 2880, 2890, 2941, 2972, and 2976 cm−1, originating from the first derivative of the lactose monohydrate spectrum (Figure S7b), and (ii) 1129, 1155, 1297, 1309, 1590, 1593, 1601, and 1608 cm−1 selected from the first derivative of the ALZ spectrum (Figure S7a). The regression coefficients of the observed versus predicted plots for both models was 0.999 (Figs. 6e and 6f), and along with the low relative difference among observed and predicted data points (Figure S3c), highlighted the Raman spectroscopy as a promising tool in the quantification of low-API content (ALZ) that might be further considered as an on-line/in-line PAT tool.
Analysis of PLS and OPLS calibration models of the first derivative Raman spectra of ALZ:lactose monohydrate blends: coefficient plots: (a) PLS, (b) OPLS; VIP plots: (c) PLS, (d) OPLS; observed versus predicted plots: (e) PLS, (f) OPLS.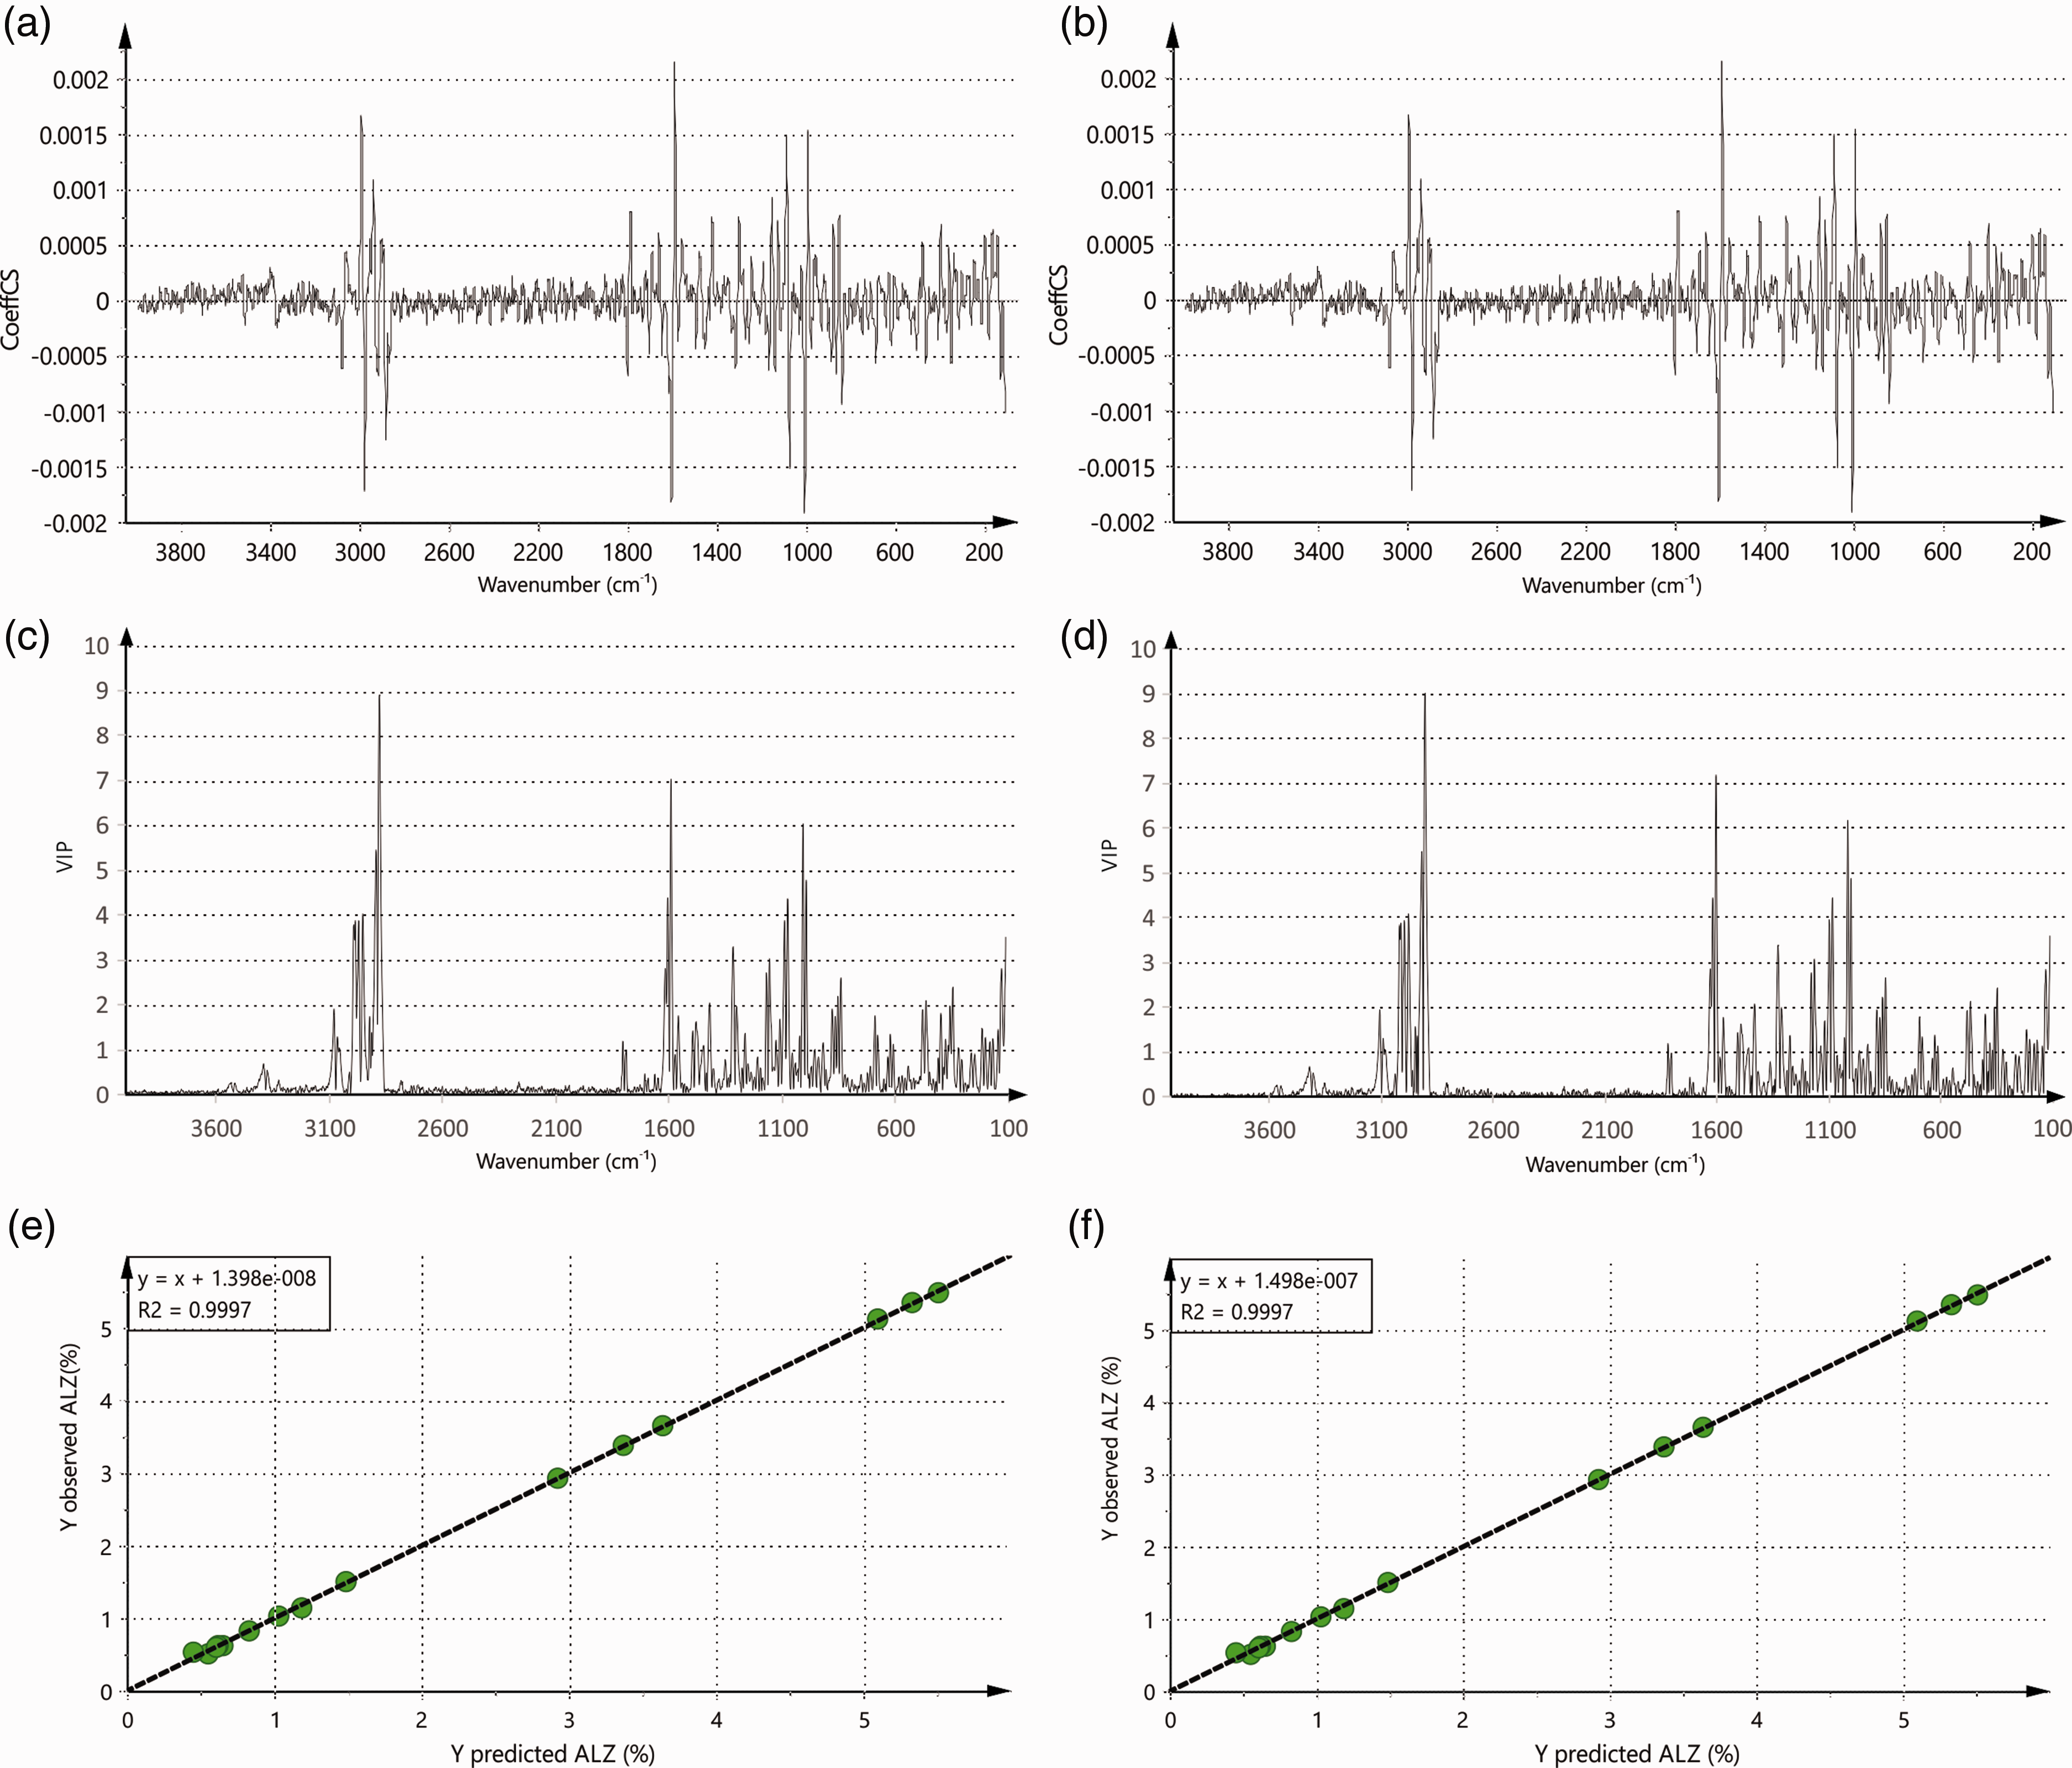
Optimization of the Raman Spectra Calibration Model
The OPLS Raman spectra model provided the most favorable statistical indicators, and its optimization was further processed regarding the scanning time and performance verification in the target ALZ concentration range (<1%). With the insight that most of the variables with a VIP score above 1 were in the 1700–700 cm−1 range, where the majority of the characteristic bands attributed to the specific ALZ bands occurred, the model was further optimized using this spectral region. Narrowing of the scanning range significantly shortened the scanning time (from ≈50 s to ≈25 s per scan), while the model statistical indicators were unaffected (R2X = 0.899, R2Y = 0.999, Q2 = 0.936, RMSEE = 0.026%, RMSEEcv = 0.057%) for the calibration set in the tested ALZ concentration range (0.1–1%). A separate prediction set of 19 random samples was used to evaluate the predictive power of the optimized model and the results were presented in Fig. 7. The obtained RMSEP for the prediction set was 0.03%, which demonstrates the capability of Raman spectroscopy for ALZ (low-API) content monitoring in solid dosage forms production.
Observed versus predicted plot for the prediction set of the Raman spectra model.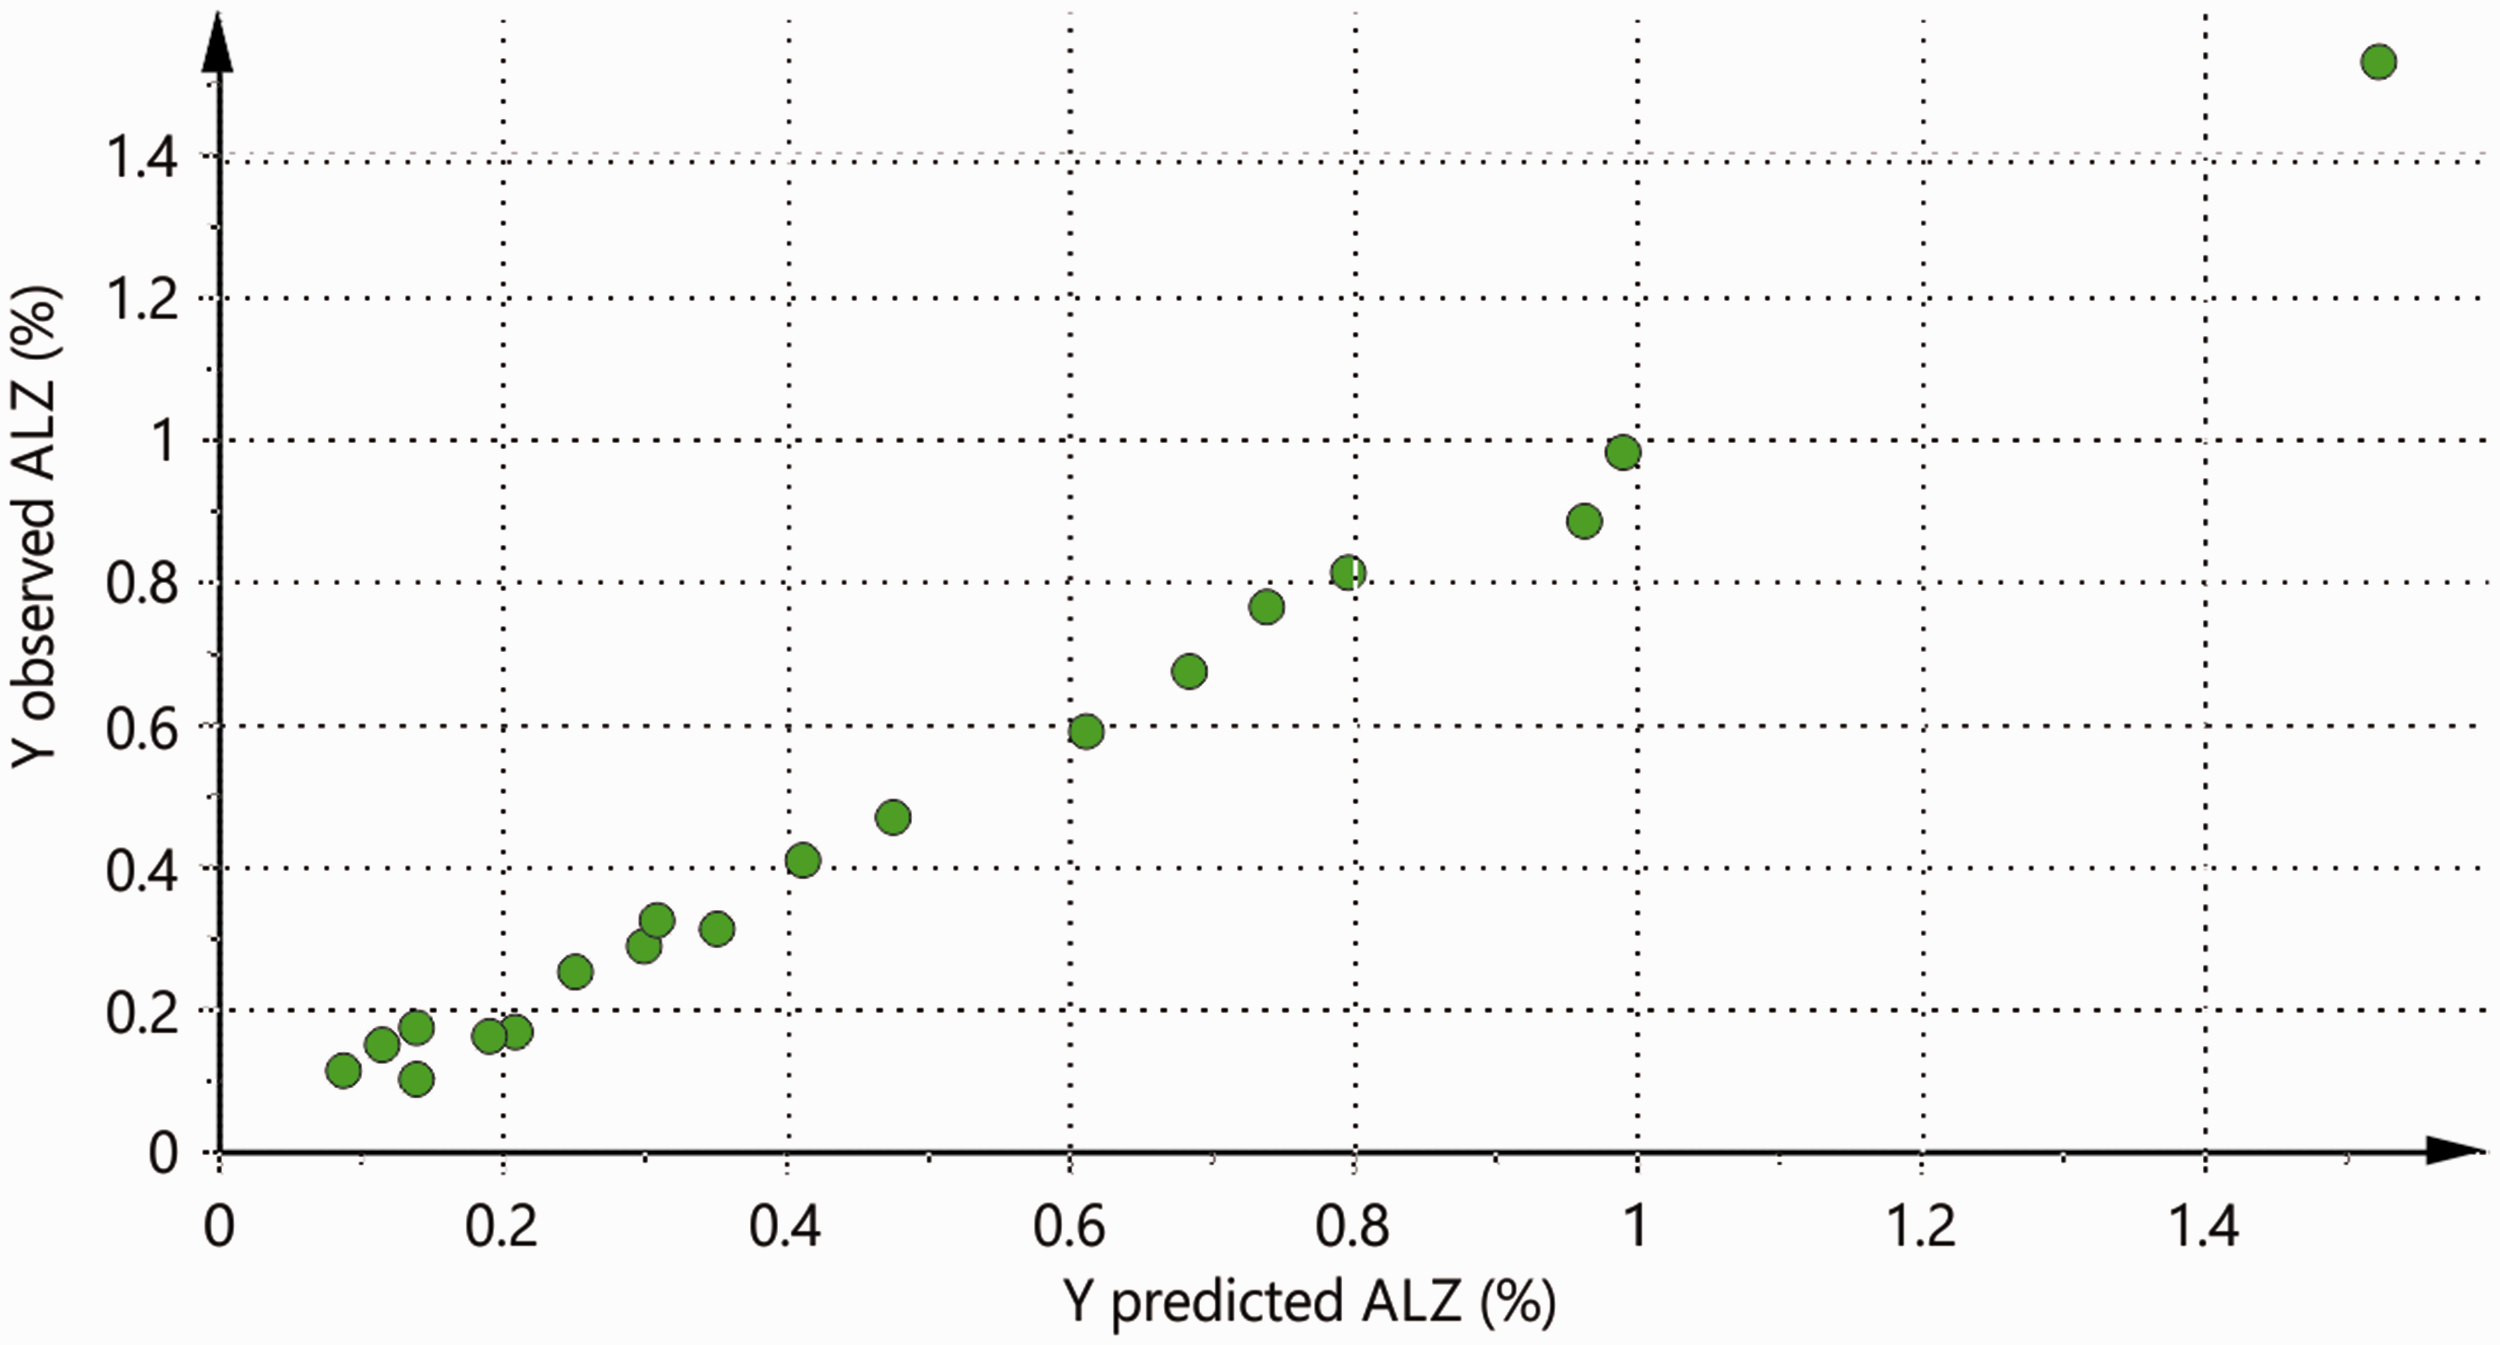
Conclusion
The vibrational spectroscopy techniques are considered as vital sources for monitoring the API content uniformity in pharmaceutical processing. However, when processing low-API contend solid forms, establishing a valid model still remains quite a challenge. Here, we have analyzed the feasibility of the development of a calibration model for the quantitative determination of ALZ in a low-content API form using NIR, MIR, and Raman spectroscopy in conjunction with multiple regression analysis. The experiments were performed in a comparative manner to highlight the main advantages and imperfections of each technique and instrumental setup. All statistical models presented high regression and predictivity coefficients. The insufficient information content extracted from the ALZ NIR spectra and the major band overlapping with those from lactose monohydrate was the main culprit of poor accuracy in the NIR model, whereas poor sampling due to scanning of the low-volume sample was regarded as a main deficiency in the MIR-based calibration model. The statistical models of the Raman spectra of the powder blends scanned in multiple points presented favorable statistical indicators of the accuracy of the calibration model, probably due to the distinctive ALZ Raman scattering pattern, which resulted in the largest number of predictive spectral points being used for the mathematical modeling. Further, the calibration model was optimized regarding the Raman spectral range (1700–700 cm−1) manifesting appropriate predictive capability for the ALZ low-concentration interval. Overall, Raman spectroscopy provided favorable statistical indicators and if used in an appropriate setup, could be further developed into a PAT for the quantitative determination of ALZ in low-content powder blends.
Supplemental Material
ASP905367 Supplemental Material - Supplemental material for A Comparative Approach to Screen the Capability of Raman and Infrared (Mid- and Near-) Spectroscopy for Quantification of Low-Active Pharmaceutical Ingredient Content Solid Dosage Forms: The Case of Alprazolam
Supplemental material, ASP905367 Supplemental Material for A Comparative Approach to Screen the Capability of Raman and Infrared (Mid- and Near-) Spectroscopy for Quantification of Low-Active Pharmaceutical Ingredient Content Solid Dosage Forms: The Case of Alprazolam by Liljana Makraduli, Petre Makreski, Katerina Goracinova, Stefan Stefov, Maja Anevska and Nikola Geskovski in Applied Spectroscopy
Footnotes
Declaration of Conflicting Interests
The author(s) declared no potential conflicts of interest with respect to the research, authorship, and/or publication of this article.
Funding
The author(s) received no financial support for the research, authorship, and/or publication of this article.
Supplemental Material
The supplemental material mentioned in the text, consisting of Figures S1 to S7, is available in the online version of the journal.
References
Supplementary Material
Please find the following supplemental material available below.
For Open Access articles published under a Creative Commons License, all supplemental material carries the same license as the article it is associated with.
For non-Open Access articles published, all supplemental material carries a non-exclusive license, and permission requests for re-use of supplemental material or any part of supplemental material shall be sent directly to the copyright owner as specified in the copyright notice associated with the article.