
Abstract
A monolithic spatial heterodyne Raman spectrometer (mSHRS) is described, where the optical components of the spectrometer are bonded to make a small, stable, one-piece structure. This builds on previous work, where we described bench top spatial heterodyne Raman spectrometers (SHRS), developed for planetary spacecraft and rovers. The SHRS is based on a fixed grating spatial heterodyne spectrometer (SHS) that offers high spectral resolution and high light throughput in a small footprint. The resolution of the SHS is not dependent on a slit, and high resolution can be realized without using long focal length dispersing optics since it is not a dispersive device. Thus, the SHS can be used as a component in a compact Raman spectrometer with high spectral resolution and a large spectral range using a standard 1024 element charge-coupled device. Since the resolution of the SHRS is not dependent on a long optical path, it is amenable to the use of monolithic construction techniques to make a compact and robust device. In this paper, we describe the use of two different monolithic SHSs (mSHSs), with Littrow wavelengths of 531.6 nm and 541.05 nm, each about 3.5 × 3.5 × 2.5 cm in size and weighing about 80 g, in a Raman spectrometer that provides ∼3500 cm−1 spectral range with 4–5 cm−1 and 8–9 cm−1 resolution, for 600 grooves/mm and 150 grooves/mm grating-based mSHS devices, respectively. In this proof of concept paper, the stability, spectral resolution, spectral range, and signal-to-noise ratio of the mSHRS spectrometers are compared to our bench top SHRS that uses free-standing optics, and signal to noise comparisons are also made to a Kaiser Holospec f/1.8 Raman spectrometer.
Keywords
Introduction
The spatial heterodyne spectrometer (SHS), described by Harlander 1 and Harlander et al., 2 is a fixed grating interferometer with no moving parts that can provide high spectral resolution in a very small footprint. The SHS has a large entrance aperture and wide acceptance angle that provides high light throughput for extended sources, at least two orders of magnitude higher than a conventional dispersive spectrometer. 1 The first description of a spatial heterodyne Raman spectrometer (SHRS) was demonstrated for visible Raman spectroscopy,4 UV Raman,5,6 remote Raman,5,7 laser-induced breakdown spectroscopy,8,9 and recently for hyperspectral Raman imaging.10 The SHRS design has advantages for Raman spectroscopy when a small, high resolution spectrometer with a wide field of view is desired. Lamsal et al., showed that the wide field of view can be used to minimize sample degradation in deep-UV Raman measurements by using a defocused laser.5,6 In the case of remote Raman, the wide acceptance angle and large aperture makes the SHRS relatively easy to couple with telescopic optics and minimizes laser pointing stability issues, because small movements of the laser spot on the target do not reduce the amount of light collected by the spectrometer aperture, unlike the case of a dispersive spectrometer where the output of the telescope has to be held in focus on a narrow input slit.7,11
A Raman spectrometer has three main large components, a detector, a laser, and a wavelength discriminator (e.g., a monochromator, spectrograph, or interferometer). Small diode lasers and complementary metal-oxide semiconductor (CMOS) detectors have been previously described for Raman spectroscopy.12–18 This paper focuses on the wavelength discriminator, the SHS, which we previously demonstrated for Raman spectroscopy using free-standing, bench top SHS devices. Here, we describe the use of monolithic SHS (mSHS) devices in a SHS Raman (mSHRS) spectrometer. A Raman spectrometer that incorporates a mSHS should be more compact and rugged than previously demonstrated SHRS systems that were built using bench top components, and this would be advantageous for use in planetary spacecraft where ruggedized devices are desired, and compact size and low weight are a plus. The 2013 Planetary Decadal Survey recommends a high priority be placed on remote sensing technology with a focus on developing and maturing novel, crosscutting, low-mass/power sensors integrated into robust, low-cost system architectures, 19 so a compact, ruggedized SHRS would be desirable for certain types of planetary exploration. mSHS emission spectrometers have been previously described, and they are shown to be robust and tolerant of vibrations.20–23 However, a mSHRS has not been previously described in the peer-reviewed literature. In this proof of concept paper, we describe the use of two different mSHSs, with Littrow wavelengths of 531.6 nm and 541.05 nm, each about 3.5 × 3.5 × 2.5 cm in size and weighing about 80 g, in a Raman spectrometer that provides ∼3500 cm−1 spectral range with 8–9 cm−1 spectral, and 4–5 cm−1 spectral resolution for 150 grooves/mm and 600 grooves/mm grating devices, respectively. The use of devices of this type, combined with small collection and imaging optics, such as a small diode laser and a small CMOS detector, has been previously demonstrated, 24 should make possible the future development of sensitive, high resolution miniature Raman spectrometers.
Experimental
Monolithic Spatial Heterodyne Raman Spectrometer
The mSHRSs described here were custom-built by LightMachinery, Inc. (Canada). Figure 1a shows the various subassemblies that were cemented together using a UV-curable epoxy, to make the monolithic interferometer. Each interferometer consists of two 15 mm × 15 mm diffraction gratings, a 25 mm N-BK7 50:50 cube beam splitter, and two N-BK7 spacers that define the angle the gratings are tilted in the horizontal plane (e.g., the dispersion plane), with respect to the optical axis. All optical faces were antireflection coated to minimize spurious reflections from the zeroth- and second-order diffracted beams. Two types of mSHRS spectrometers were used in these experiments, one-dimensional (1D) and two dimensional (2D). The 1D mSHRS used 150 grooves/mm gratings blazed at 500 nm, with the grating angle set by the spacers, to give a 531.6 nm Littrow wavelength (spacer angles of 2.288°). The 2D mSHRS used 600 grooves/mm gratings blazed at 500 nm, with the grating angle set to give a 541.05 nm Littrow wavelength (spacer angles of 9.377°). For the 2D device, one grating was rotated about the optical axis by 3.5°, to allow the use of a 2D fast Fourier transform to recover wavelengths above and below the Littrow wavelength. This is used to double the spectral range (explained below). Figure 1b shows a picture of the completed interferometer assembly, using a US quarter (25 mm diameter) for scale. Both mSHRS devices are about 3.5 × 3.5 × 2.5 cm in size and weigh about 80 g.
(a) Monolithic spatial heterodyne Raman spectrometer (mSHRS). BS: beam splitter; S: spacers; G: diffraction gratings. (b) A mSHRS compared to the size of a US quarter. (c) Schematic diagram of the mSHRS system. S: sample; L1: collection lens; M: dichroic mirror; F: filters, L2: imaging lens, I: spatial filter; D: CCD detector.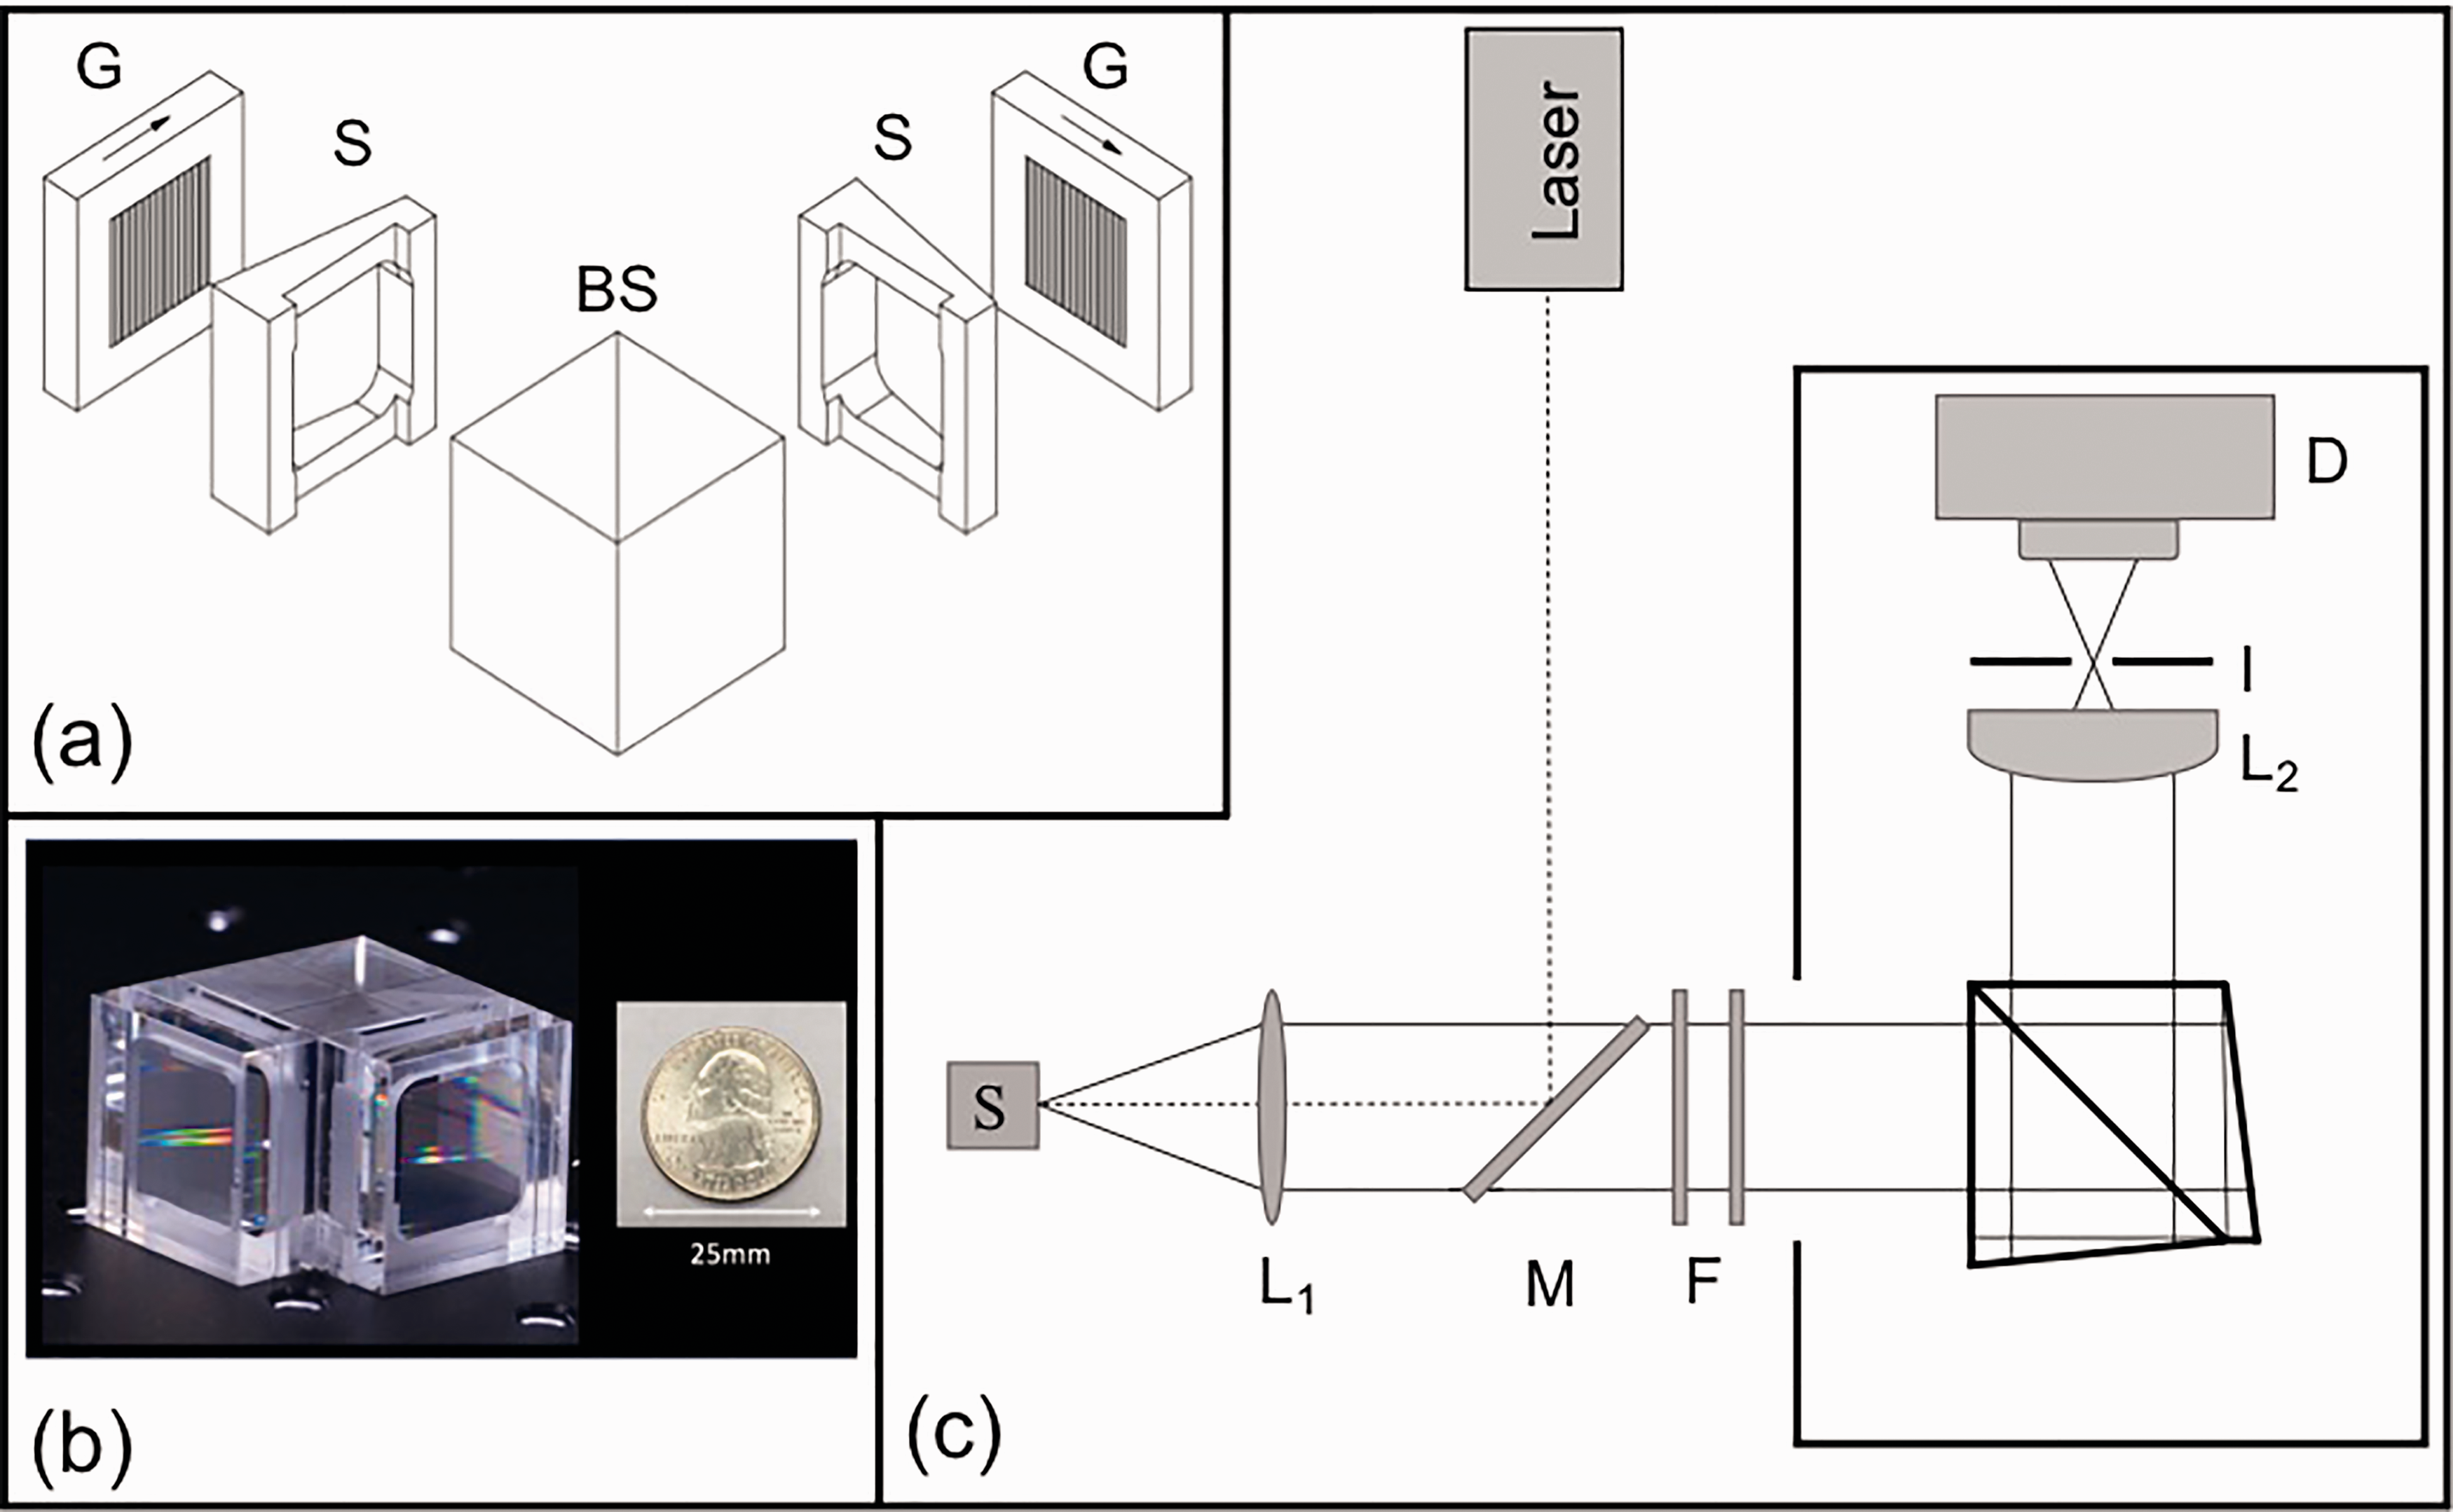
Figure 1c shows the mSHRS spectrometer setup that was used to measure Raman spectra using a 180° back scatter geometry. A 532 nm continuous wave (CW) neodymium-doped yttrium aluminum garnet laser (Opto Engine, MGL-FN-532nm-1W) was used as the excitation source for all spectra shown, with laser power on the sample varying from 33 mW to 530 mW. For most studies, the two times expanded laser beam was directed onto the sample using a 50 mm diameter, 550 nm long-pass dichroic mirror, M, (ThorLabs, DMLP550L) at 45°, then focused onto the sample using a 25 mm, MgF2 coated, f/2 achromatic lens, L1, (Edmund Optics 49766). The same lens also collected the Raman scattered light and collimated it, sending it into the mSHRS through three 14 mm circular apertures placed ∼20 cm apart, to ensure beam collimation and to limit the beam size to 14 mm so as not to overfill the mSHRS gratings. In the case of the comparison studies of the mSHRS and the Holospec dispersive spectrometer, an f/6 laser focusing lens was used to control the beam spot size on the sample (not shown), placed before the 45° laser turning mirror, M. Also, for these studies, a 25 mm, f/4 focusing lens, L1, placed after the dichroic beam splitter was used to focus the laser and to collect and collimate Raman scattered light from the sample. This light was either sent directly to the mSHRS through the 14 mm apertures mentioned above, or redirected using a 45° Al-coated mirror to an f/2 lens and focused into the Holospec spectrometer, matching the Holospec f/#.
Two filters, F, a 532 nm long-pass filter (Semrock RazorEdge, LP03-532RE-25) and a 532 nm holographic notch filter (Supernotch, Kaiser Optical Systems, Inc.) were placed in front of the mSHRS to remove strong laser scatter. For selected samples, additional short-pass filters were used to limit the total spectral range (bandpass) allowed into the spectrometer, including, as needed, a 581 nm short-pass filter (Knight Optical, 581FDS25), a 570 nm short-pass filter (Knight Optical, 570FDS25), and a 650 nm short-pass filter (ThorLabs, FES0650). Three different thermoelectrically cooled charge-coupled device (CCD) detectors were used for these observations. These included a back-illuminated, UV-enhanced CCD detector with 2048 × 512, 13.5 µm pixels, dark current of 0.001 e-/p/s, and a system read noise of 3.5 e- rms (Princeton Instruments-PI, PIXIS-2048 2K/BUV), cooled to −70℃, run at 100 kHz with ADC gain high and in the low noise setting, and controlled using Lightfield 6.3 software, a PI CCD detector with 1340 × 400, 20 µm pixels, dark current of 0.001 e-/p/s, and a system read noise of 3 e- rms (Teledyne Princeton Instruments, PIXIS 400), cooled to −70℃, controlled using WinSpec software, also measured at 100 kHz, with ADC gain high and in the low noise setting, and a CMOS detector with 5544 × 3694, 2.4 µm pixels, a dark current of 0.0024 e-/p/s, and system read noise of 2.7 e- rms (Agena Astroproducts, QHY183M), cooled to about −17℃. The software SpaceCap was used to run the CMOS detector and save spectra as RAW files. A fused silica 105 mm focal length, f/4.5 camera lens (Coastal Optical Systems, Inc., UV-MICRO-APO 111032) was used to image the grating faces onto the CCD detectors at a magnification of ∼1.6 × for the PIXIS 400 and ∼1.8 × for the PIXIS 2K/BUV, so as to fill as much of the detector in the horizontal direction as possible. In the case of the PIXIS 2K, the magnified image filled ∼1900 pixels in the horizontal direction. At this magnification, the CCD was overfilled in the vertical direction. In the case of the PIXIS 400 (8 mm height) and 2K/BUV (6.9 mm height) detectors, ∼34% and 27% of the light was captured on the CCD, respectively. In the case of the CMOS detector, which was much smaller than the CCD detectors, the grating face of the mSHRS was imaged at a magnification of ∼0.9 × , so that the CMOS chip was not over filled in the horizontal direction. This allows for ∼73% of the light to be collected on the detector. For all measurements, a spatial filter, I, was placed one focal length behind the imaging camera lens, on the CCD side, to block higher grating diffraction orders.
Free-Standing Spatial Heterodyne Raman Spectrometer
A lab-built bench top free-standing SHRS was used for some comparison studies, where all optical components were mounted on a floating optical table using conventional optical mounts. The free-standing SHRS used a 25 mm N-BK7 non-polarizing 50:50 cube beamsplitter (ThorLabs, BS013) and a pair of 25 mm, 150 grooves/mm gratings, blazed at 500 nm (Edmunds Optics, #64-402). All other components used in the free-standing SHRS studies were the same as the mSHRS, including the same lenses, filters, size illuminated on the gratings, and detector (Pixis 2K/BUV). The Littrow wavelength was set very close to 532 nm. The mSHRS measurements were also done on a floating optical table.
LabRAM HR Evolution
The micro-Raman instrument used for the mSHRS and micro-Raman comparison measurements was a LabRAM HR Evolution, Horiba with a 76 mW continuous wave (CW) 532 nm laser, using an 1800 grooves/mm grating, with a thermoelectrically cooled 1024 × 256-pixel CCD, (26 µm pixels) detector.
Kaiser Holospec
For some signal-to-noise ratio (S/N) comparisons, a Kaiser Holospec f/1.8 Holographic Imaging spectrometer (Kaiser Optical Systems, Inc.) was used, equipped with the low frequency 532 nm Stokes gratings (HSG-532-LF) which gave a spectral range of about 50–2400 cm−1 with reciprocal linear dispersion of 3.1 nm/mm. A slit width of 25 µm gave a spectral resolution of about 8 cm−1. A 532 CW laser (Opto Engine, MGL-FN-532 nm−1 W) was used for all Holospec measurements. A 25 mm diameter, f/2 achromatic lens was used to focus light into the Holospec, f/# matching the Holospec spectrometer to the collection optics. The PIXIS 400 CCD described above was used for measurements with the Holospec spectrometer.
Samples
Sulfur (J.T. Baker), potassium perchlorate (Alfa Aesar), sodium sulfate (Sigma-Aldrich), and acetaminophen (Sigma-Aldrich) were purchased at 99% + purity and pressed into pellets using a hydraulic pellet press (Carver Laboratory Equipment, model 3912) with a 13 mm stainless steel pellet dye. Gypsum and barite were obtained from an Introductory Earth Science Collection (American Educational, #1201-000). Isopropanol (Sigma-Aldrich), methanol (Fisher), and cyclohexane (Sigma-Aldrich) with 99% + purity were measured in 1 cm quartz cuvettes.
Results and Discussion
Spatial Heterodyne Raman Spectrometer
The basic design and operation of the SHRS has been discussed previously.1–11,20–41 In the interferometer, collimated light is passed through a 50:50 beam splitter, dividing the beam into two parts which are directed onto tilted diffraction gratings. After being diffracted off the gratings, the beams recombine at the beamsplitter as crossing wave fronts. The gratings are titled at an angle, θ
L
, such that a particular wavelength, the Littrow wavelength, λ
L
, is retro-reflected and recombined so that no interference pattern is produced. For any wavelength other than Littrow, the crossed wave fronts will generate a fringe pattern, which is imaged onto the CCD to produce a fringe image. By taking a Fourier transform of the fringe image, an intensity spectrum can be obtained. The intensity of the fringe pattern as a function of position x on the detector is given by Eq. 1

Unlike dispersive spectrometers, the SHRS does not require a slit to control the spectral resolution and the spectral resolution is not a function of the focal length of the device. Instead, the resolving power of the SHRS is proportional to the total number of grooves illuminated on both gratings. For a SHRS built with two fully illuminated gratings of size W and groove density d, the resolving power is expressed as Eq. 3

The collection solid angle is related to the resolving power by Eq. 4. The full acceptance angle for the 150 grooves/mm mSHRS is about 2°, or 1° for the half angle. Due to both the large entrance aperture, ∼15 mm for the mSHRS, and large collection solid angle, the mSHRS has a higher throughput than a conventional dispersive spectrometer of comparable size

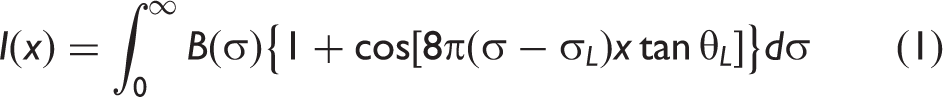
Figure 2 shows example Raman spectra of sulfur, cyclohexane, and potassium perchlorate using the 1D, 531.6 nm Littrow, 150 grooves/mm grating mSHRS. The inserts, I, in this figure show the interferograms for each sample, generated by summing all the rows of the fringe image and applying background subtraction. The fringe visibility (FV) for these interferograms was 0.53, 0.16, and 0.48 for sulfur, cyclohexane, and perchlorate, respectively. A FV of 0.53 indicates that almost half of the signal does not contribute to the spectral intensity, but it still contributes to the noise spectrum. We did notice that the FV was significantly lower for liquid samples than solid samples, suggesting the depth of field of the liquid samples reduced the degree of collimation of the collected light. Fringe images are also shown as inserts, FI, for the sulfur and perchlorate samples. The sulfur spectrum (Fig. 2a) was measured using the PIXIS 400 CCD (1340 pixels) and thus has a smaller spectral range than the other spectra which were measured using the larger PIXIS 2K/BUV CCD (2048 pixels). For an input beam width of ∼ 14 mm, the theoretical resolving power of the 531.6 nm Littrow mSHRS is 4200. The full width half-maximum (FWHM) of the 219 cm−1 band of sulfur was 8 cm−1, about twice as large as the theoretical value of 4.4 cm−1, calculated using a resolving power of 4200. The resolution of the 941 cm−1 potassium perchlorate and 801 cm−1 cyclohexane bands was 10.5 and 11 cm−1, respectively. The measured resolution is a little larger than the theoretical value for reasons that were not determined. Possible reasons include imperfect collimation of collected light, focusing of the CCD imaging lens, or precision of manufacture of the mSHRS device itself.
Raman spectra of (a) sulfur, (b) cyclohexane, and (c) potassium perchlorate with the mSHRS (531.6 nm Littrow, 150 grooves/mm). The interferogram cross sections (insert I) for each spectrum are generated by summing the intensity of each column of pixels in the fringe image (insert FI) and applying background subtraction. Sulfur had a 30 s exposure time, and cyclohexane and potassium perchlorate both had an exposure time of 60 s. The fringe visibility was 0.53 for sulfur, 0.16 for cyclohexane, and 0.48 for potassium perchlorate.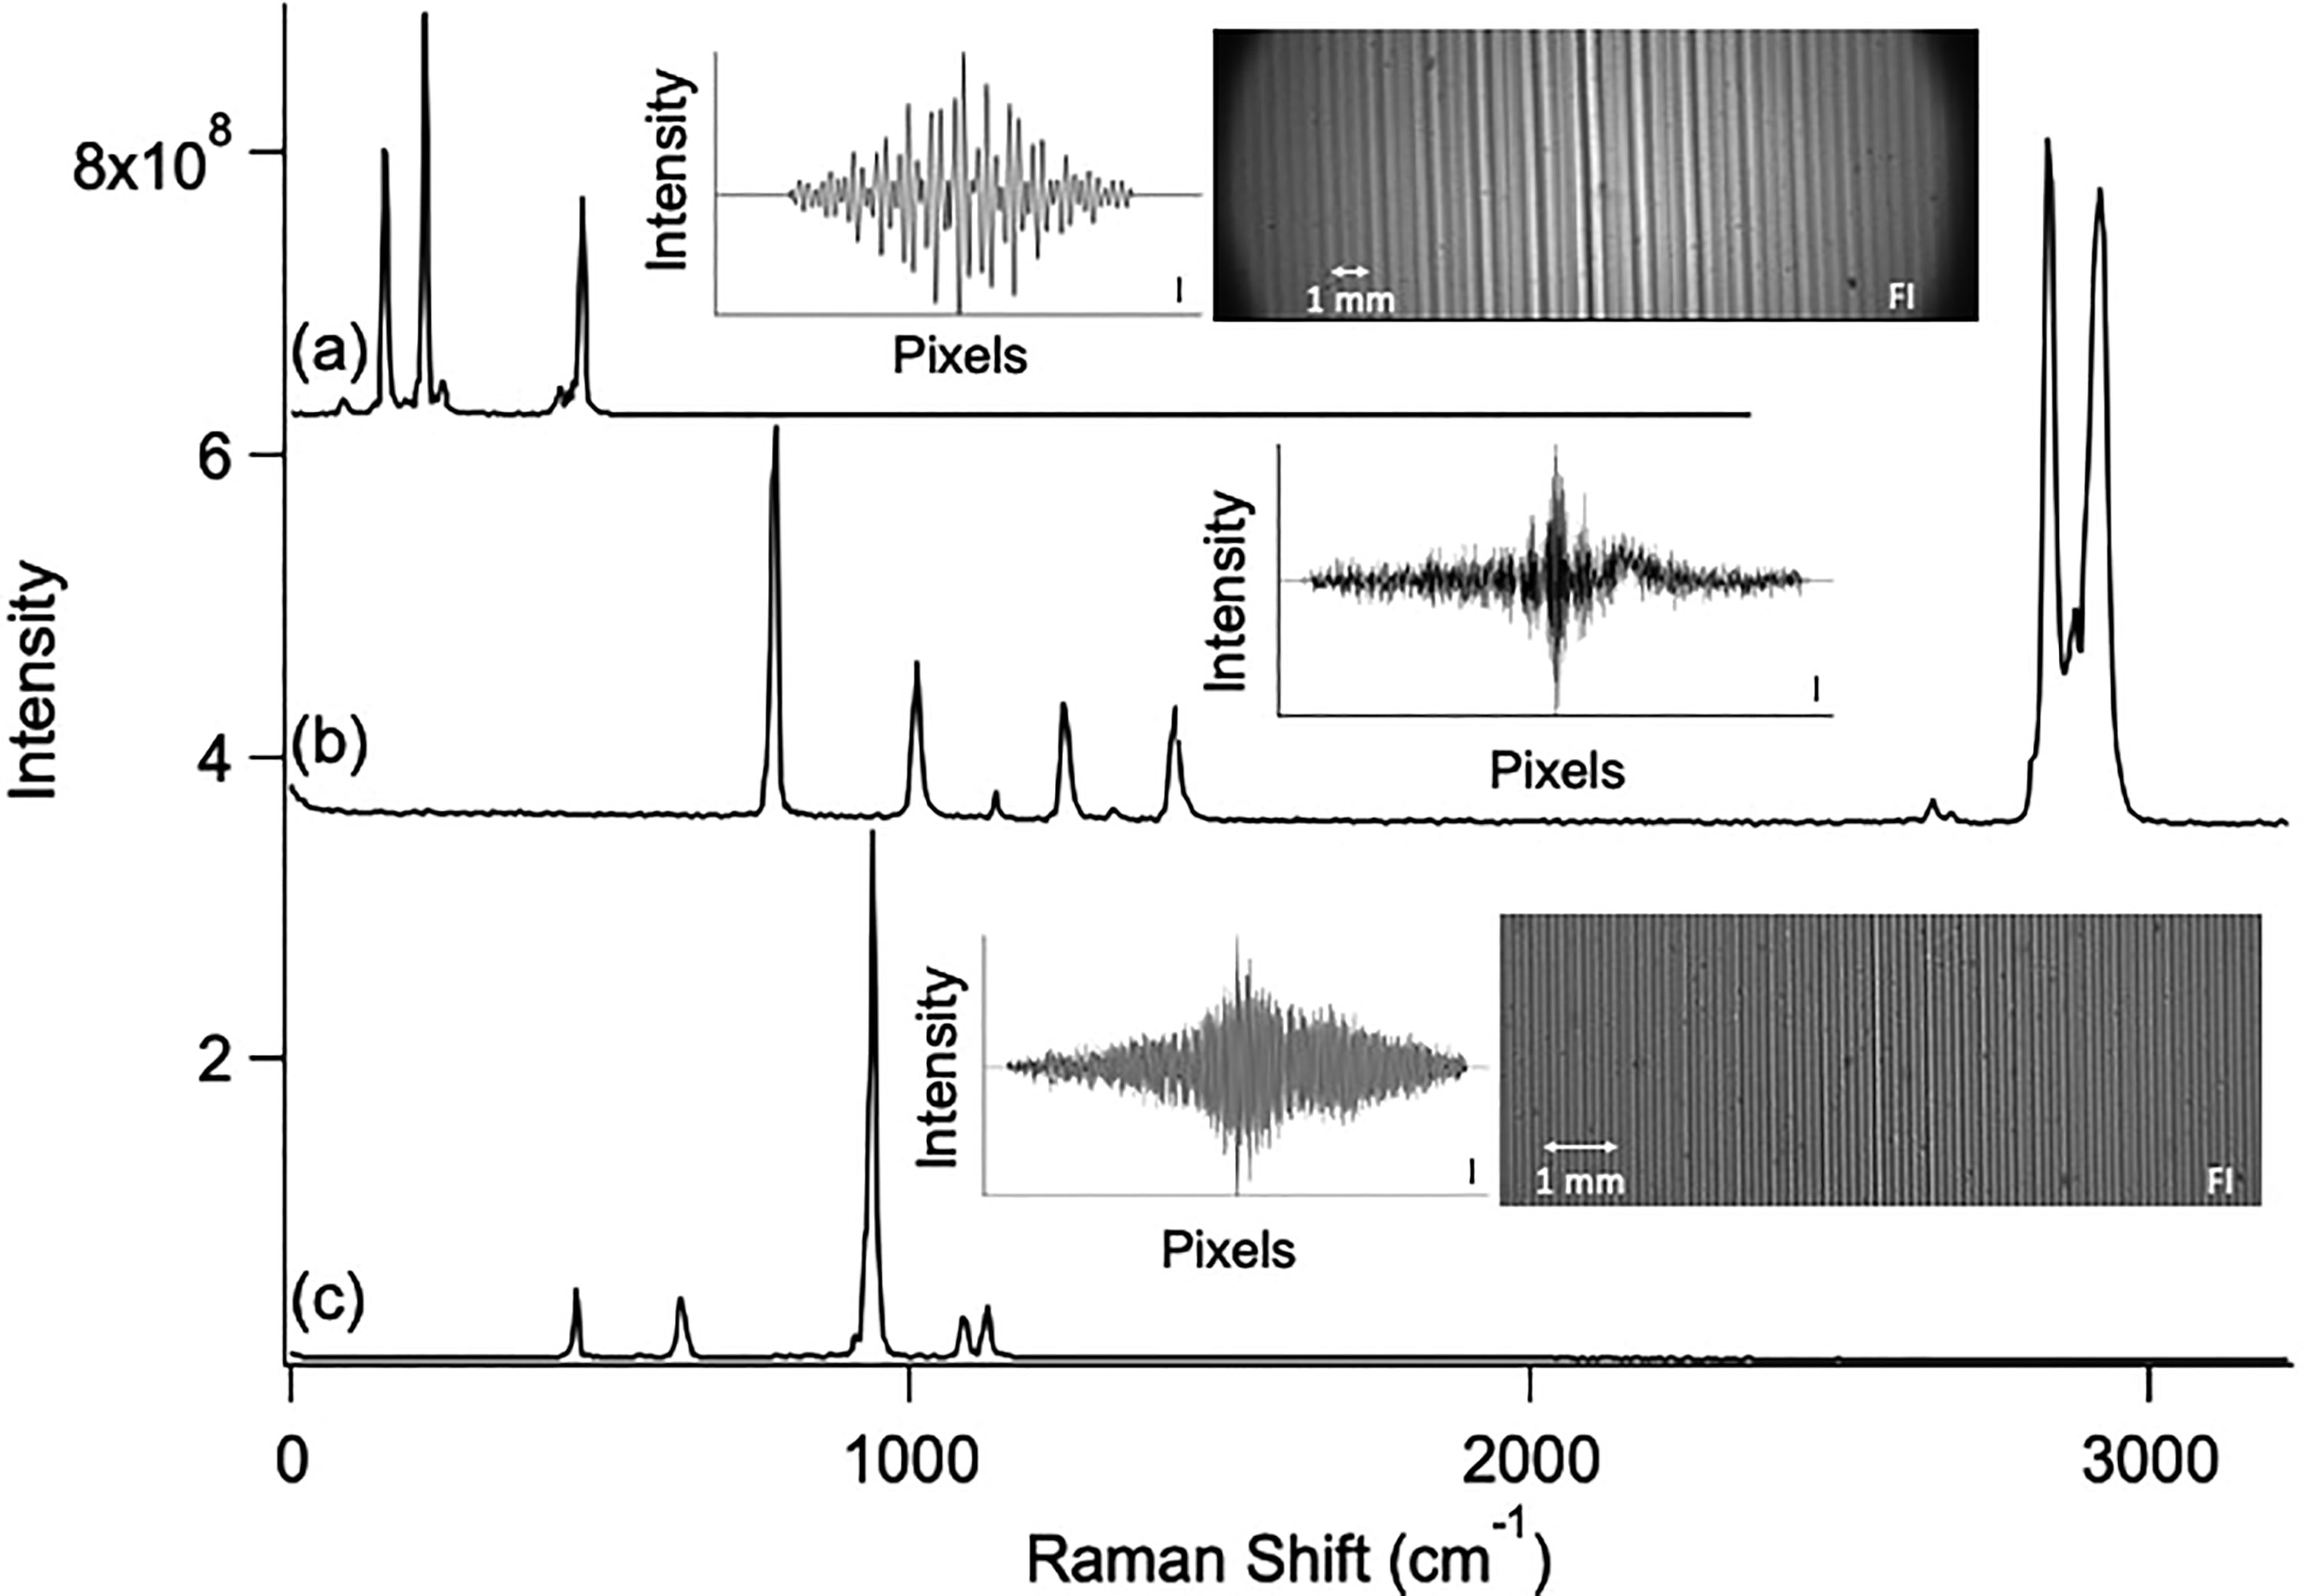
The spectral range of the SHRS is dependent on the resolving power, R, and the number of pixels, n, covered in the horizontal direction on the detector. For wavelength λ, the maximum spectral range of the SHRS is given by Eq. 5

Given a resolving power of 4200 for the mSHS and using ∼1900 pixels on the CCD, the maximum spectral range at the 532 nm laser wavelength (18 796 cm−1) is 120 nm or about a 3450 cm−1 Raman shift using a 532 nm laser. A Raman shift of 3450 cm−1 corresponds to a fringe spacing of about 18 microns (from Eq. 2), which would require a pixel size of 9 µm to resolve, because of the Nyquist sampling criteria. However, with a system magnification of 1.84, this gives an effective pixel size of ∼7 µm, well within the Nyquist criterion for this band shift.
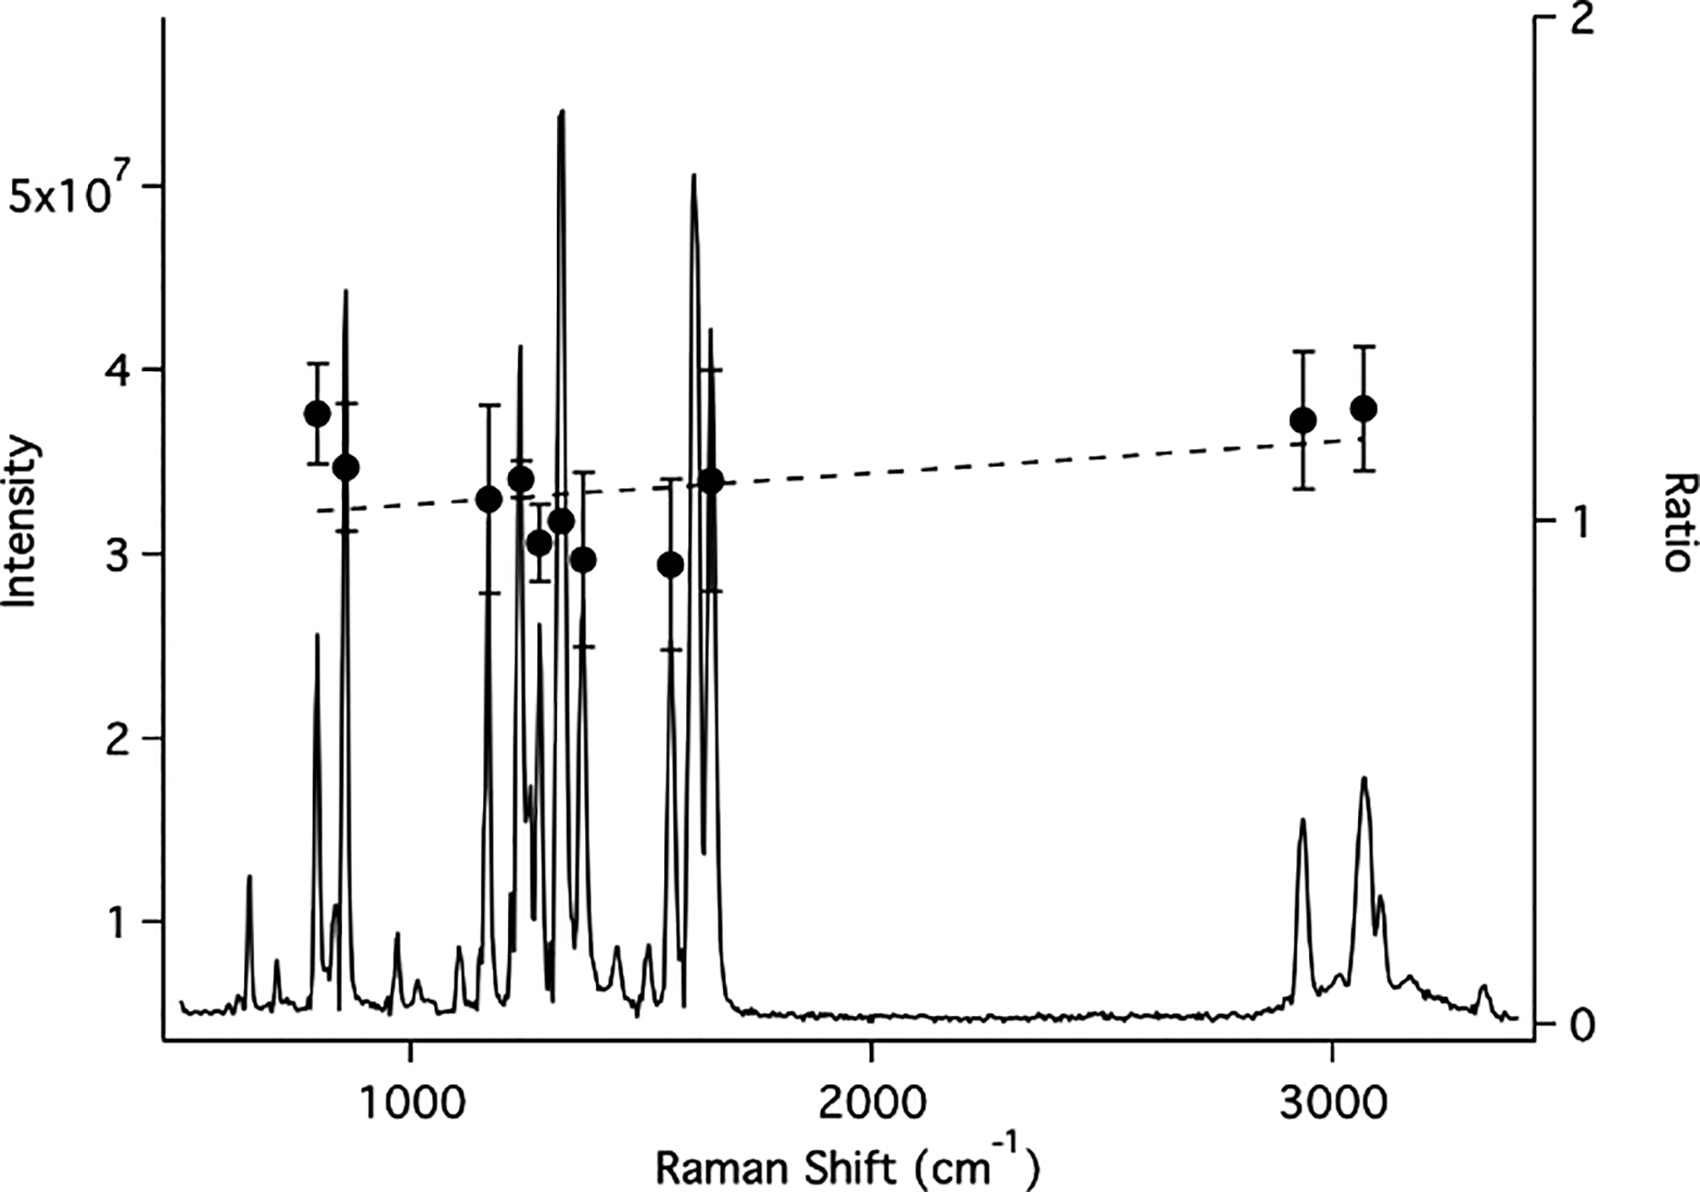
The C–H stretches for the cyclohexane spectrum (Fig. 2b) appear at about 2850 cm−1 and 2930 cm−1, which is within our expected measurable spectral range. The relative intensity of the CH band compared to the band at 801 cm−1 is about 10:1, consistent with reference spectra of cyclohexane.42,43 This demonstrates that the instrument response function of the 150 g/mm mSHRS is relatively flat out to at least 2930 cm−1. This is much better than described free-standing SHRS spectrometers which show a marked drop in sensitivity at wavelengths far from the Littrow wavelength.4,6 This is illustrated in Fig. 3a, which shows Raman spectra of acetaminophen measured with the free-standing SHRS (left) and the mSHRS (right). The acetaminophen spectrum measured with the free-standing spectrum shows a marked decrease in response beyond ∼1000 cm−1, while the mSHRS shows no significant drop off in the response for any of the bands shown out to ∼1600 cm−1. In Fig. 4, showing an extended spectral range for the acetaminophen sample, the response drops off only slightly out to the CH stretch region (e.g., > 3000 cm−1). In this figure, the dashed line shows the instrument response of the 150 grooves/mm mSHRS, calculated as the ratio of the relative intensity of several major peaks in the acetaminophen spectrum to the relative intensity of published corrected spectra.
44
The mSHRS showed significantly larger spectral range and higher sensitivity far from the Littrow wavelength. Again, this is in contrast to previously reported free-standing instruments, which showed a signification relative intensity drop off for shifts far away from Littrow.4,6 The rapid drop off in response for the free-standing SHRS is in part due to the lower FV, but is also likely caused by stability issues. It should be noted that the stability issues with the free-standing SHRS used in these studies might be corrected using higher quality optical mounts and better vibration control.
Raman spectra of (a) acetaminophen, (b) potassium perchlorate, and (c) sodium sulfate with a free-standing bench top SHRS, on the left, and a mSHRS (531.6 nm Littrow, 150 grooves/mm), on the right. The free-standing SHRS had fringe visibilities of 0.17 for sodium sulfate, 0.32 for potassium perchlorate, and 0.21 for acetaminophen, while the mSHRS had fringe visibilities of 0.38, 0.48, and 0.26, respectively. Inserts show the cross section for each spectrum. Raman spectrum of acetaminophen measured with a mSHRS (531.6 nm Littrow, 150 grooves/mm) overlaid with the system response. The dashed line is the estimated instrument response for the mSHRS based on the calculated ratio of measured band intensities to literature values.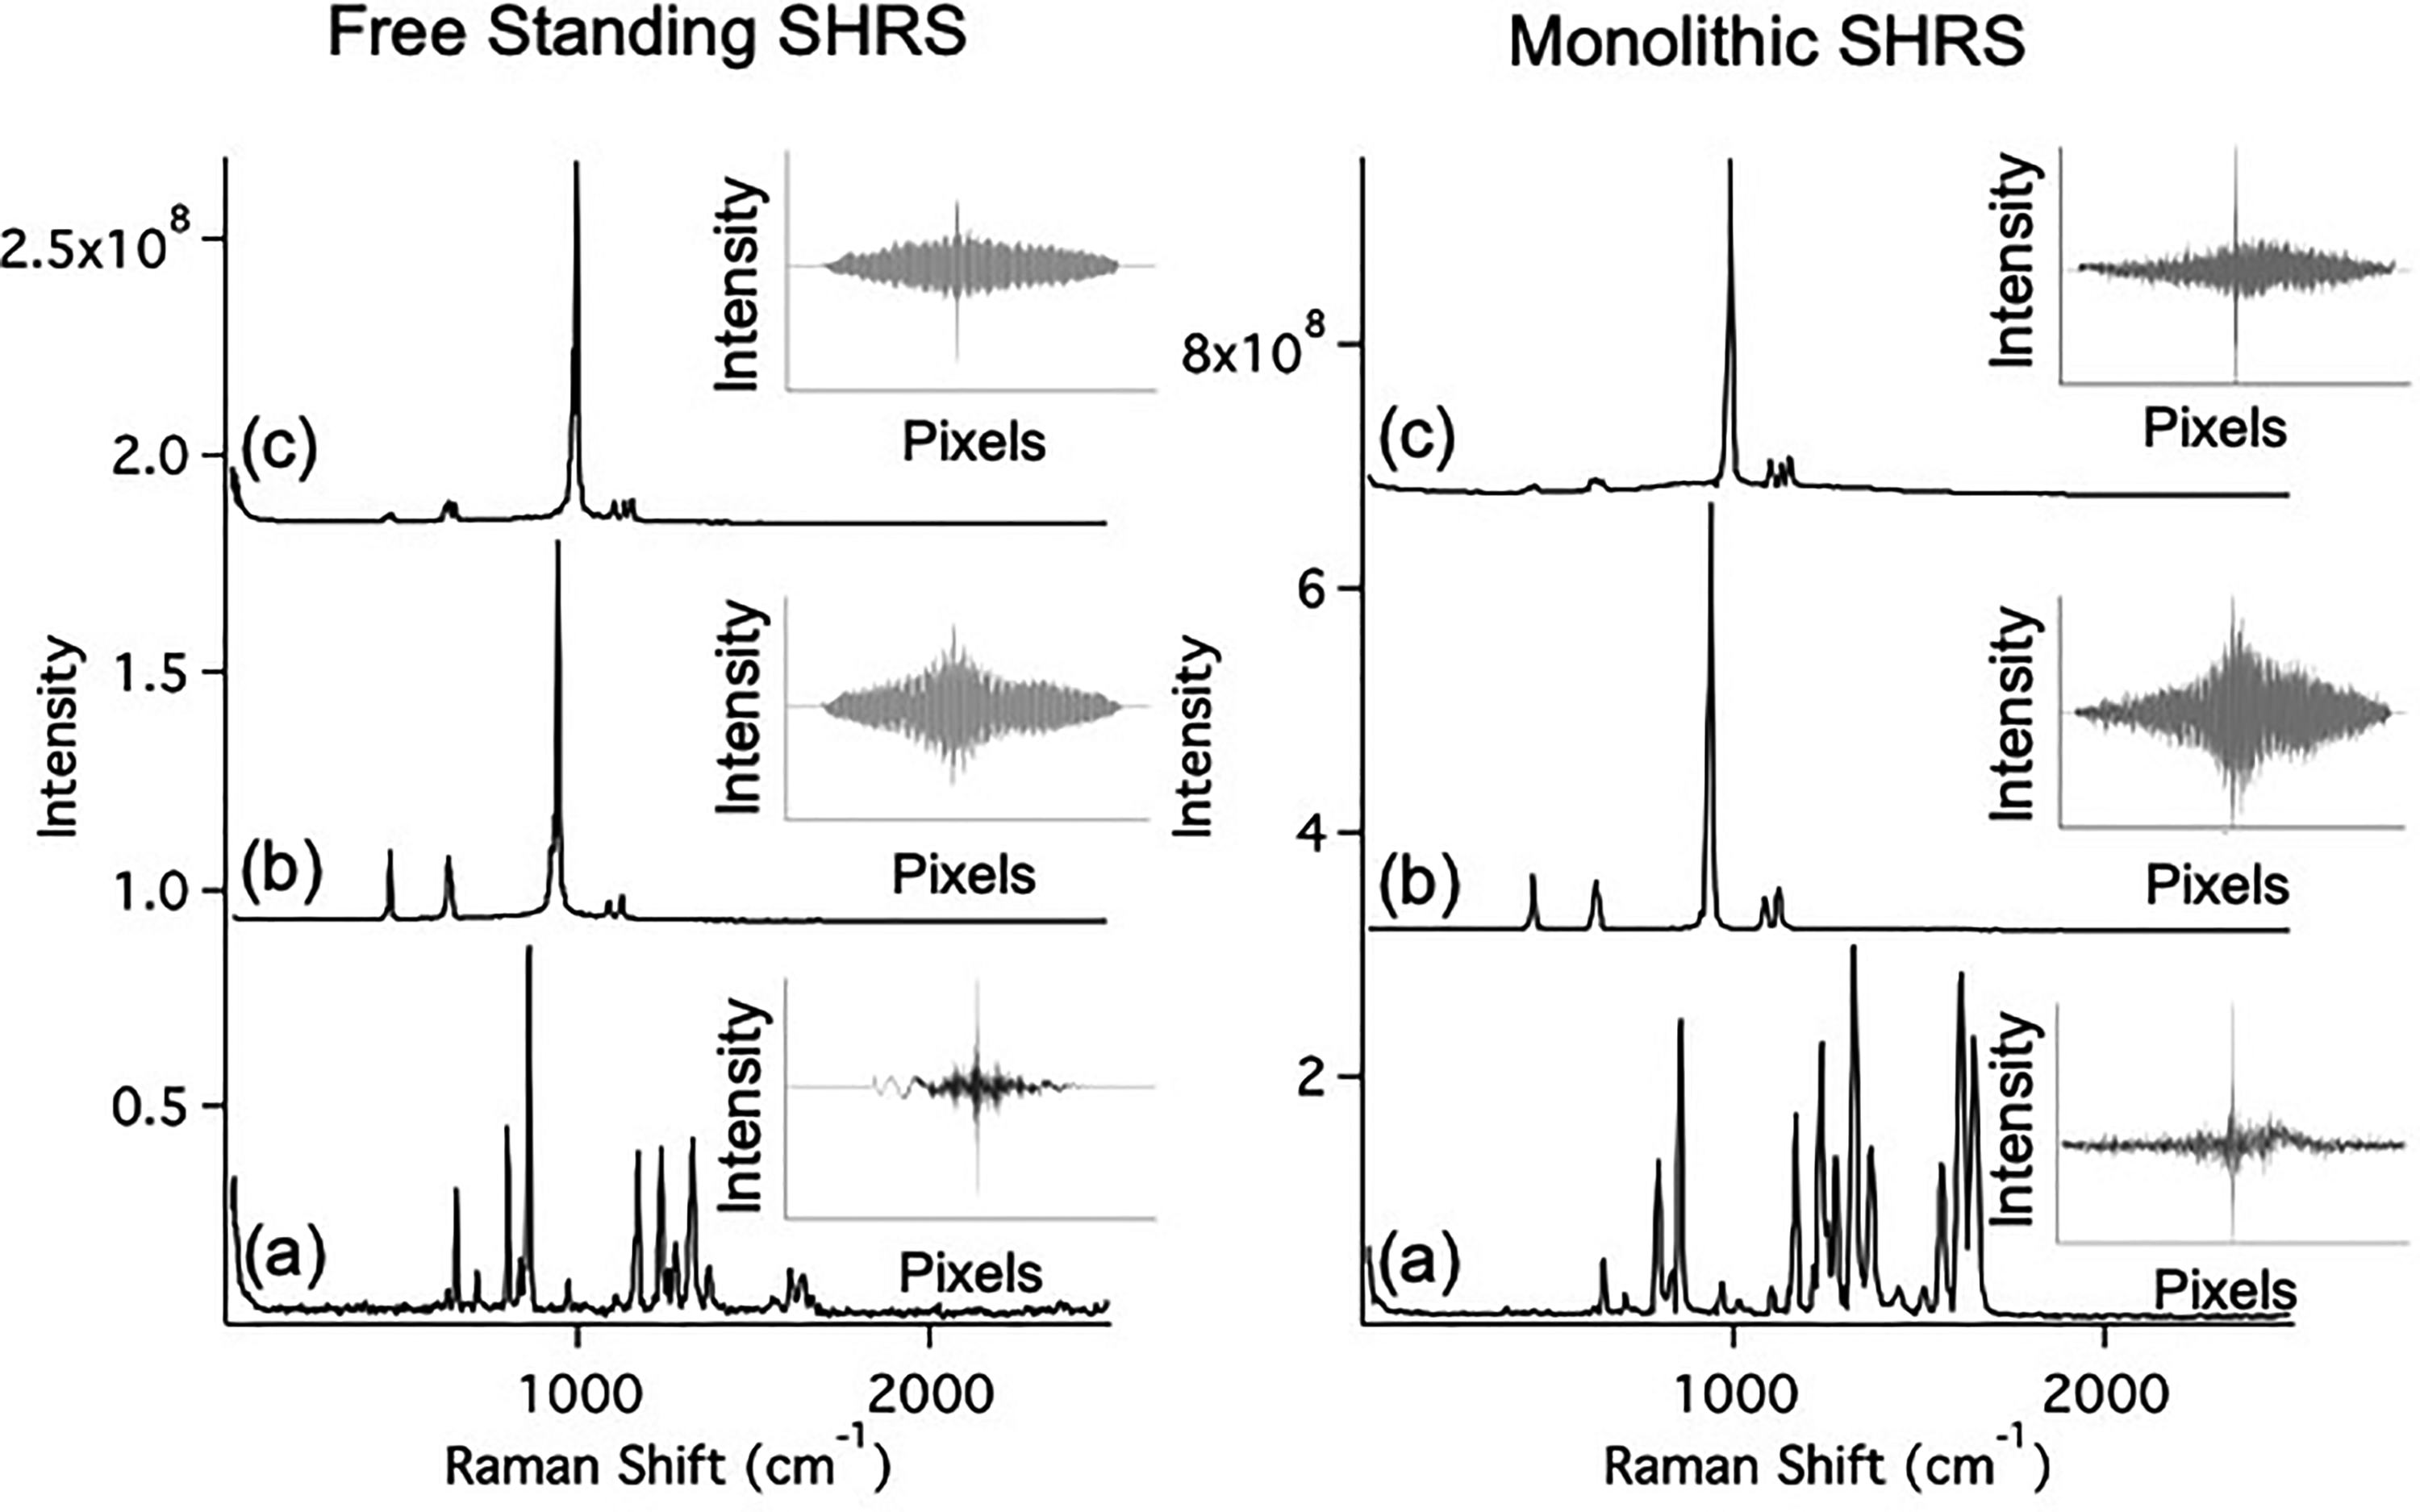
The resolution of the free-standing and mSHRS spectrometers was very similar, 8 cm−1 to 9 cm−1, measured using the 941 cm−1 band of potassium perchlorate (Fig. 3b). This is expected since the resolution depends only on the total number of grating grooves illuminated, and is not much affected by optical alignment, system stability, or overall system sensitivity. The sensitivity, however, of the SHRS is related to the FV as defined in Eq. 6, and the FV mSHRS was much better than the free-standing SHRS

In Eq. 6, Imax and Imin are the maximum and minimum intensities in the interferogram. For an ideal interferogram, the FV is equal to one. When the FV is less than one, it suggests that light reaching the detector does not contribute to the spectral intensity, but still contributes noise to the spectrum. FV is a good measure by which to compare the optical alignment and sensitivity of the mSHRS and free-standing SHRS spectrometers. The mSHRS spectra tended to have a higher FV than the free-standing SHRS, with sodium sulfate, potassium perchlorate, and acetaminophen having fringe visibilities of 0.38, 0.48, and 0.26 respectively, compared to 0.17, 0.32, and 0.21 for the free-standing SHRS. This produced as much as a twofold higher S/N for the mSHRS compared to the free-standing SHRS. In the case of the mSHRS, the S/N values were 3621, 3494, and 379 for KClO4, Na2SO4, and acetaminophen, respectively, while for the free-standing SHRS, the S/N values were 1848, 2460, and 160 for these same samples, measured under identical conditions. The free-standing and mSHRS spectrometers used the same types of components, so the improved S/N in the mSHRS must come from more precise optical alignment and stability in the device itself.
A goal of this study is to determine if the mSHRS design is more vibrationally stable than the bench top, free-standing SHRS spectrometers. Note: the room temperature did not vary by more than 1 ℃ during these studies. In order to assess this, a potassium perchlorate pellet was measured using each spectrometer, and the spectra were calibrated to determine the position of the strong 941 cm−1 perchlorate band with each instrument. A simple calibration curve was generated using five perchlorate Raman lines. This simple calibration was sufficient to show relative band shifts for the relatively broad ∼10 spectral element wide bands. The calibration procedure also provides the precise Littrow wavelength. The sample was then measured each day for nine days with both instruments, 10 days total, with no adjustments to the instruments or collection optics of any kind, other than turning on the laser each day.
The ∼941 cm−1 perchlorate band position determined from the calibration procedure was actually 939.73 cm−1, as shown by the first point in Fig. 5a. The data in Fig. 5a show a variation of the band position over a range of ∼8 cm−1 (937–945 cm−1) for the free-standing SHRS, while there is no detectable change in the band position of the mSHRS device. At most, the mSHRS band changed position by 0.1 cm−1. Thus, the mSHRS demonstrates improved stability over the free-standing SHRS. It should be noted though that the stability of the bench top SHRS might be improved using higher quality optical mounts. The temperature in the lab was not monitored but typically varied by 1 ℃ over the course of a day–night cycle.
The stability of the mSHRS (531.6 nm Littrow, 150 grooves/mm) was compared to a free-standing SHRS by taking a 60 s measurement of potassium perchlorate every day for 10 days. (a) The position of the 941 cm−1 perchlorate peak. (b) Change in the Littrow position, plotted over 10 days. The open circles are the mSHRS and the closed circles are the free-standing SHRS.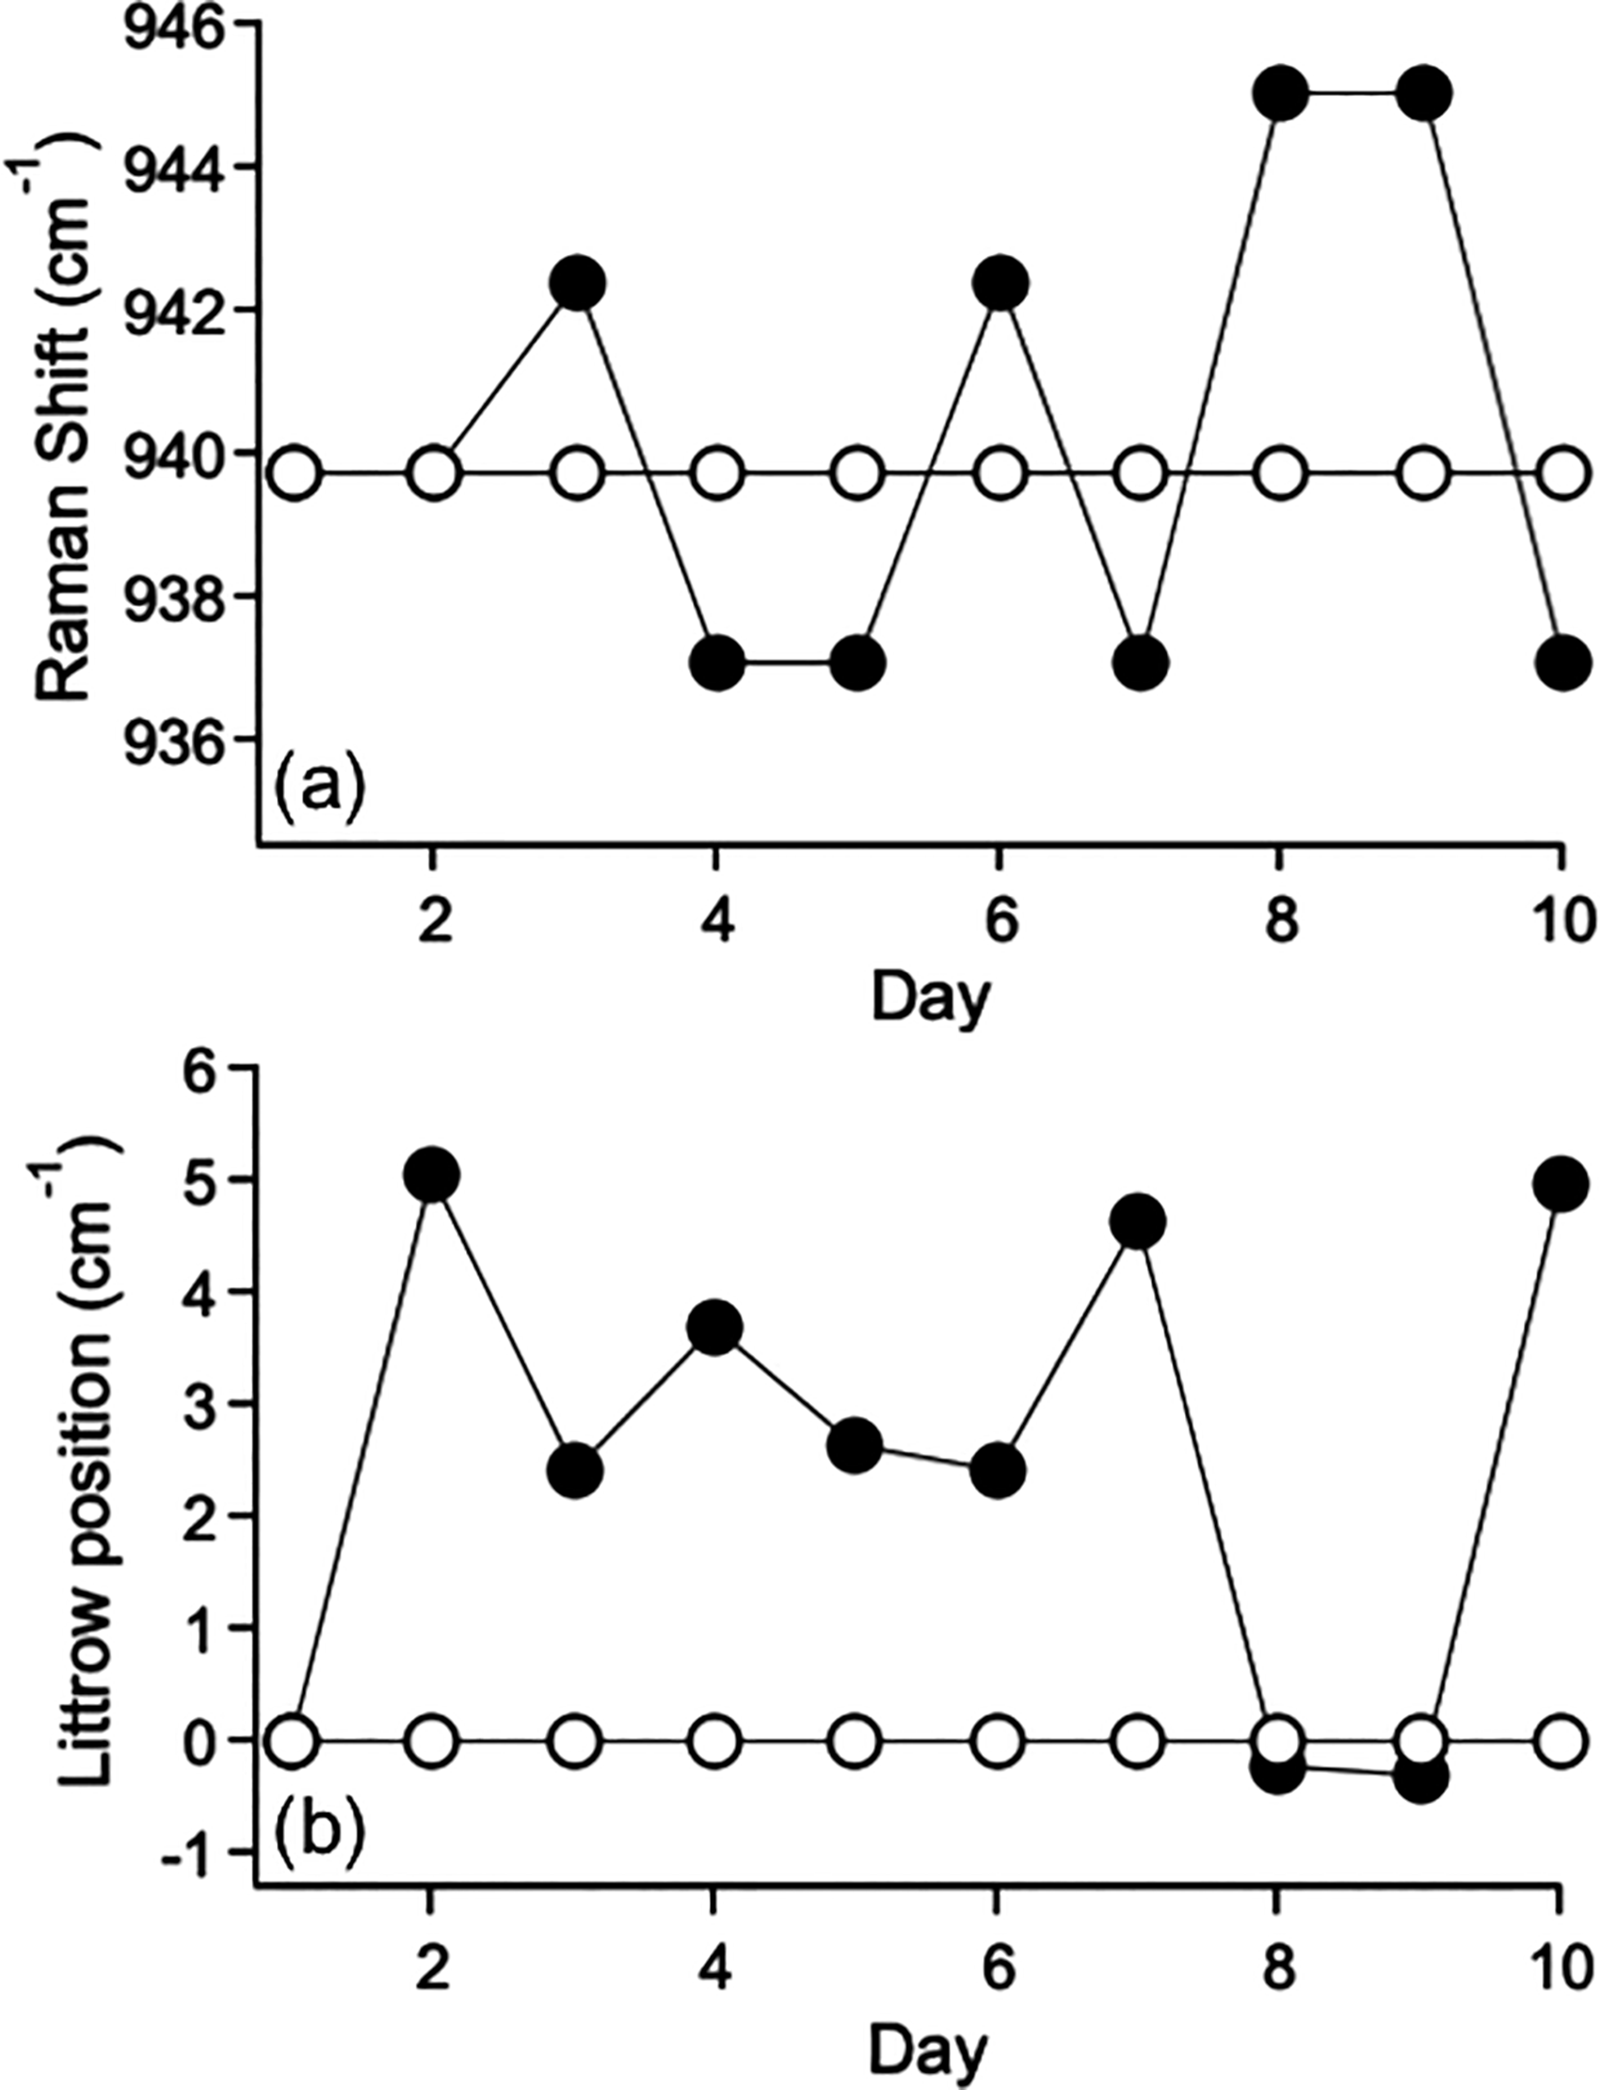
Another way to examine the stability of the calibration of the mSHRS is to recalibrate at the beginning of each day of the 10-day period and note changes in the Littrow wavelength that results from the calibration curve. Figure 5b shows the change in Littrow position over the 10-day period relative to day one, for each spectrometer. Since we are plotting relative change, the day one value is 0 cm−1, by default. Similar to the position of the ∼941 cm−1 Raman band position described above, the free-standing SHRS Littrow position changed more than 5 cm−1 over the 10 day period, whereas mSHRS Littrow position did not change within the precision of the calibration for the entirety of the 10 days. In the case of the free-standing SHRS, the optical components (e.g., gratings, beam splitter, imaging optics) are on separate mounts which can move relative to one another, leading to small changes in the instrument calibration. In the case of the mSHRS, all optical components of the interferometer are bonded together, so there will be minimal drift of the position of the optical components, and even if there are small movements, the optical elements would still maintain alignment relative to one another. Both systems were mounted on floating optical tables.
The throughput of a SHS-based spectrometer is much higher than a typical dispersive monochromator1,4–6,23 because of the large entrance aperture and acceptance angle. However, this does not guarantee that the SHRS will have higher sensitivity or a larger S/N when compared to a conventional dispersive Raman spectrometer. In the case of a very small field of view on the sample, such as using a highly focused laser, only half of the collected light passing through the SHRS reaches the detector because of the beam splitter, and you might expect the S/N and the sensitivity of the dispersive spectrometer to be higher. Also, because noise is equally distributed in the spectrum, the S/N for weak bands will likely be worse for the SHRS when a focused laser source is used. For this reason, in the case of the SHRS, it is important to use bandpass limiting filters to minimize noise contributed from regions outside the spectral range of interest. However, when the sample field of view is large, such as viewing an extended source in transmission or spatially offset Raman, using a defocused laser, or measuring a sample at a remote distance, the sensitivity can be higher and the S/N larger for the SHRS. Another consideration is detector noise. In the case of the SHRS, the entire area of the CCD is typically used to image the fringe pattern, leading to higher detector noise than a dispersive spectrometer where a minimum number of rows on the CCD are typically used, though it is possible to minimize the area of the CCD used by focusing the fringe image onto the detector using a cylindrical lens, thus minimizing detector noise.
The Kaiser Optical Systems Inc. f/1.8 Holospec is a high throughput spectrograph that is designed specifically for Raman spectroscopy. It is commonly used for analytical Raman measurements and is thus well characterized and can be thought of as a “gold standard” for analytical Raman. The Holospec f/1.8 footprint is not too different from the mSHRS once the collection and imaging optics are added. In this comparison study, the detector, laser power, laser focusing optics, and light collection optics were identical for each system. The spectrometer input optics were optimized for each spectrometer (e.g., f/1.8 focusing lens for the Holospec, and f/4 collimating lens for the mSHS). The amount of light entering the Holospec was about 3.4 times higher than that entering the mSHRS because of the 14 mm limiting apertures and additional 93% T laser blocking filter in the mSHRS. Additional losses in the mSHRS included the 50/50 beam splitter. The mSHRS detector was fully illuminated while with the Holospec, the light was focused onto about 55% of the CCD pixels.
Figure 6 shows the 941 cm−1 band for a 1.7 mm thick KClO4 pellet, measured using the (a) Holospec and (b) the 150 grooves/mm mSHRS, with the laser focused on the surface of the sample and using 1, 2, and 3 mm defocused laser spots (the focusing lens was moved away from the sample surface). As expected, the band intensity drops as the laser is defocused for the Holospec, due to the presence of the slit, whereas no loss of performance is observed in the mSHRS.
Raman spectra of potassium perchlorate for focused laser and defocused laser with 1 mm, 2 mm, and 3 mm spot sizes measured with (a) the Kaiser Holospec and (b) the mSHRS (531.6 nm Littrow, 150 grooves/mm). Solid line: Focused laser spot size, dotted line: 1 mm, dashed line: 2 mm, alternating dash–dot line: 3 mm diameter spot size. Each spectrum used an exposure time of 30 s. Inserts show the log(SNR) versus log (intensity) for each laser spot size for four different exposure times, 1, 5, 10, and 30 s.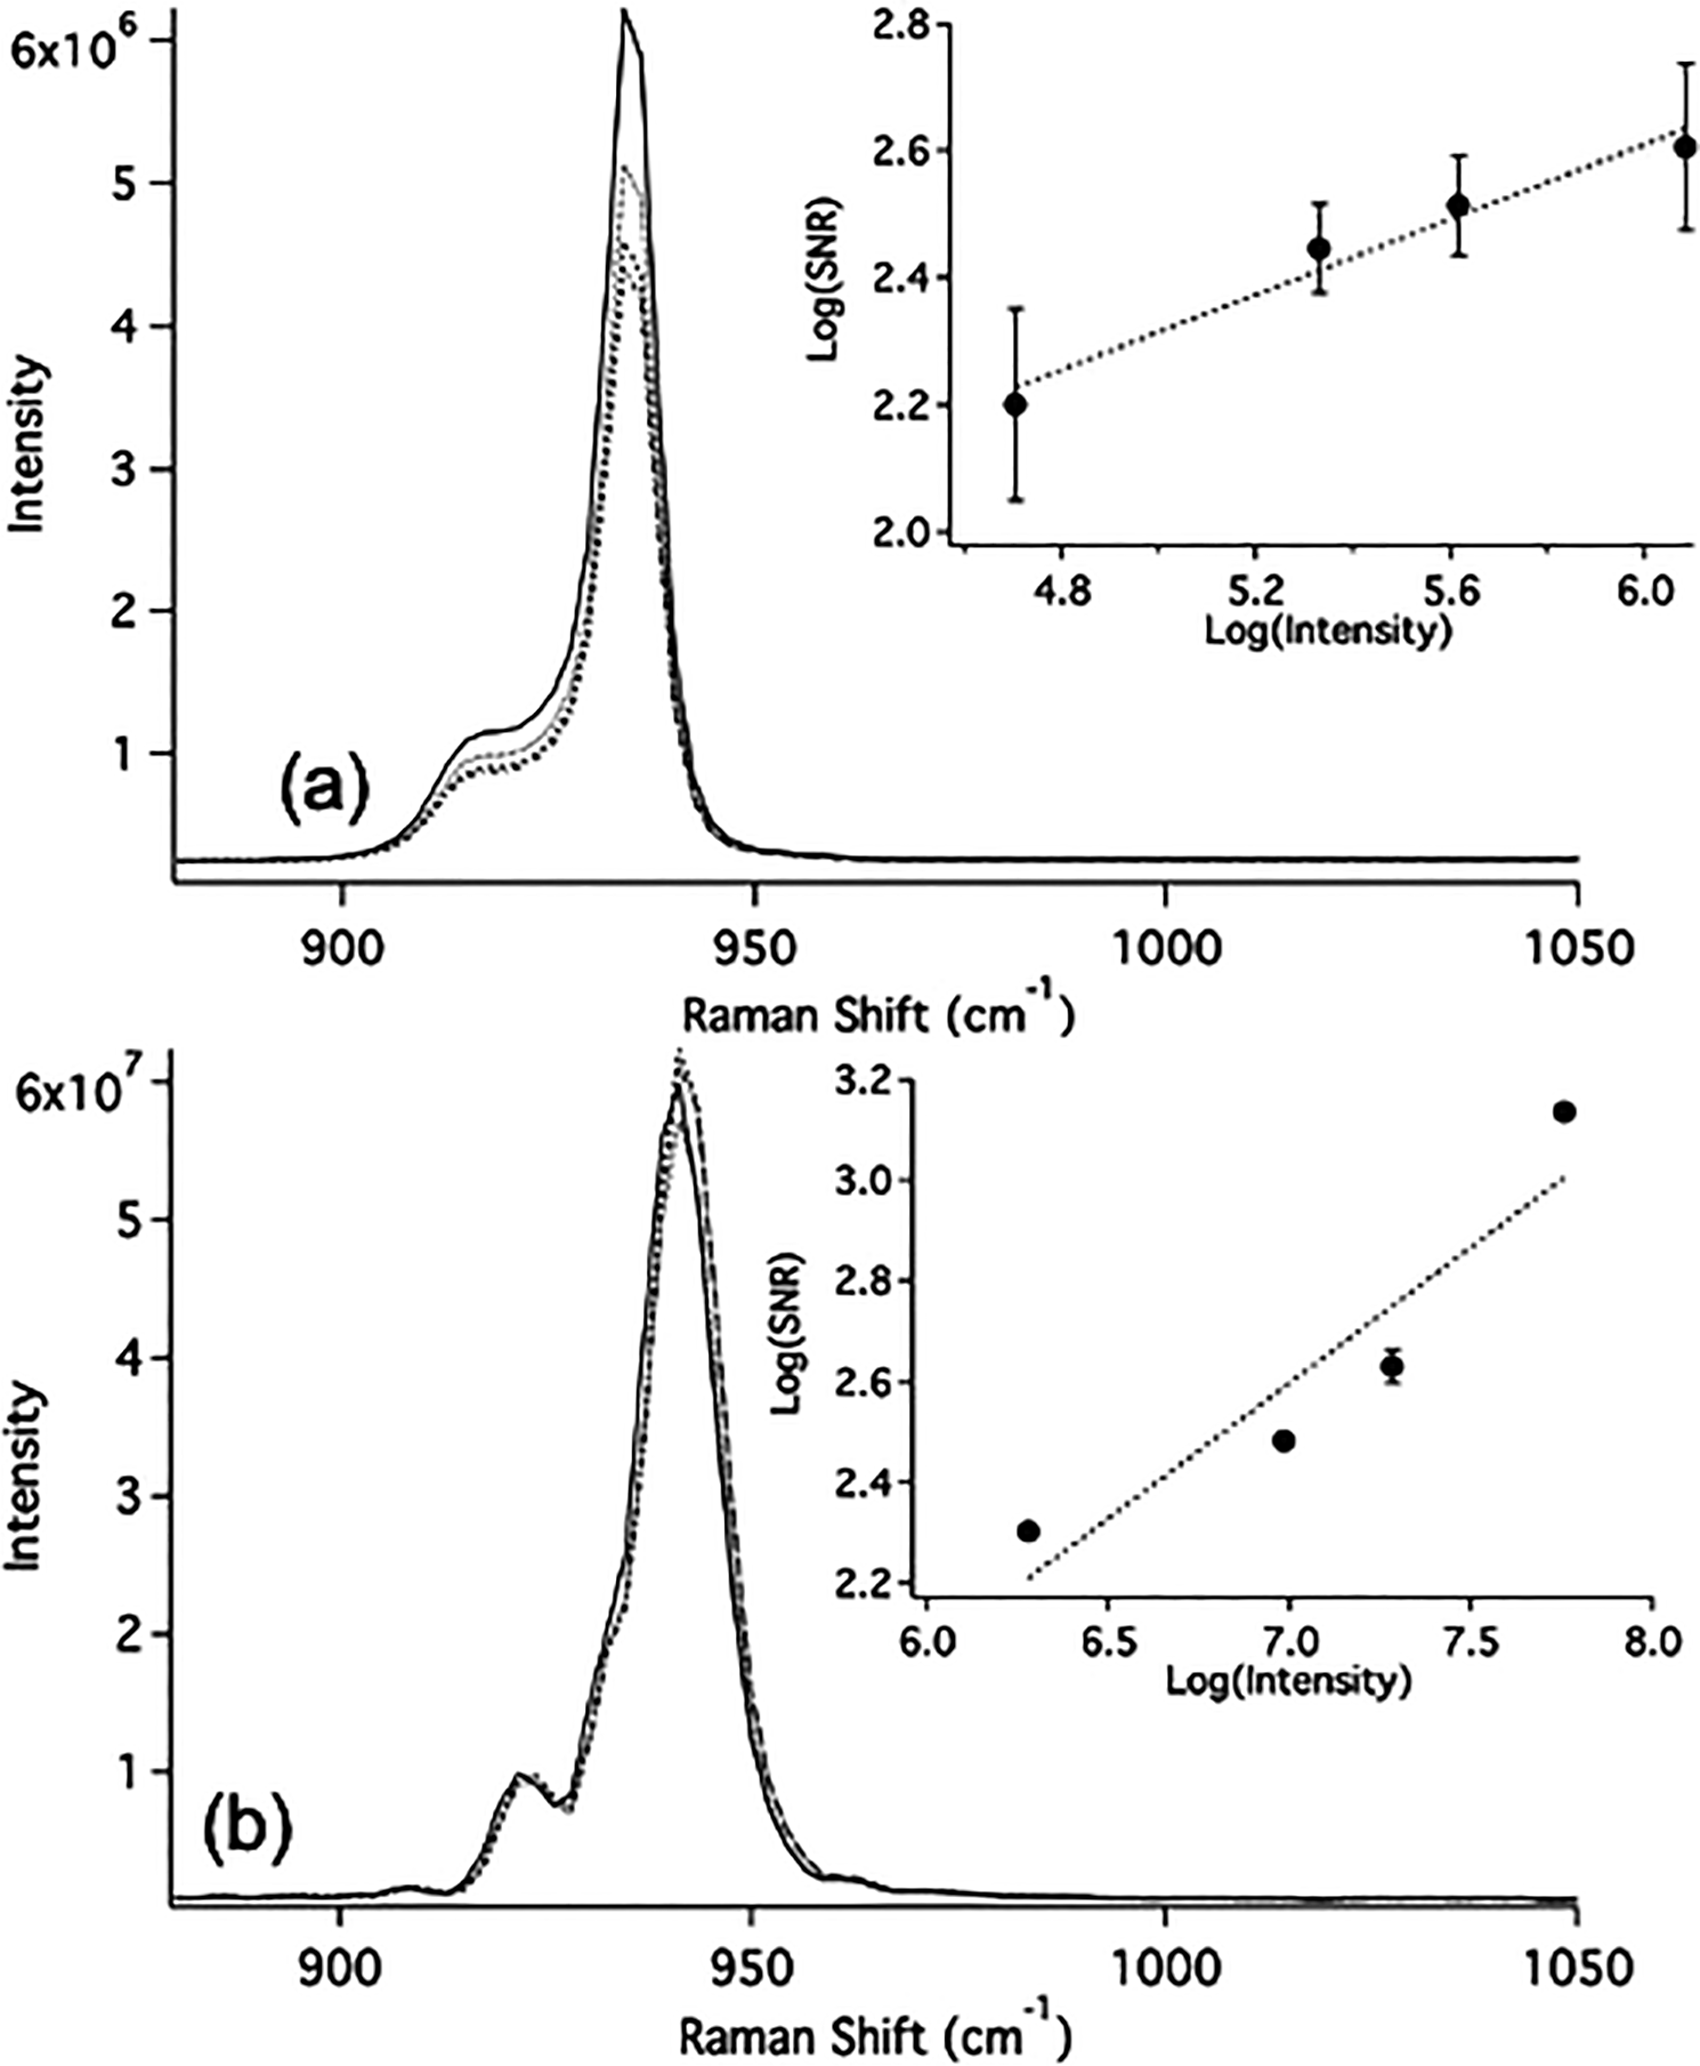
To calculate the S/N for repeated measurements, the perchlorate sample was measured 100 times using exposure times of 1 s, 5 s, 10 s, and 30 s for each spot size. The S/N was calculated as the 941 cm−1 band intensity divided by the standard deviation in the intensity of the 100 repeated measurements. For the mSHRS, the S/N calculated for 100 repeated 30 s exposures was ∼1350–1400. Variations in laser power over this time interval were 0.034% ± 0.031, so the S/N was likely laser jitter (e.g., flicker) limited. For the Holospec, the S/N of 100 repeated measurements was ∼340 to ∼500 for different laser spot sizes. The S/N was much lower than can be accounted for by laser power fluctuations alone. The limiting noise source in a measurement can sometimes be inferred by a log–log plot of S/N versus signal. A slope of one-half is expected for a purely shot noise limited system while a lower value indicates flicker noise. 45 The insets in Fig. 6 show such a plot for the (a) Holospec and (b) mSHRS for 100 repeated measurements. The slope of the Holospec S/N plot is ∼0.3 (with large error), indicating a significant component of flicker noise which is indicated by a small slope value in such a log–log plot. 46 The source of flicker noise can be difficult to pinpoint as it can be caused by any source of signal fluctuations such as laser instability, vibration of optical components, and sample movement among other things. The slope of the mSHRS S/N plot changes from ∼0.25 at low intensities to 0.5 at moderate intensities, increasing to 1 for higher intensities. This plot is not definitive, but the average value of 0.5 suggests a smaller flicker noise contribution than the Holospec.
The spectral resolution of the 2D 600 grooves/mm mSHRS was designed to be optimal at lower Raman shifts by setting the Littrow wavelength to 541.1 nm (316 cm−1), and to give higher spectral resolution than the 150 grooves/mm mSHRS device. Figure 7 shows a comparison of the Raman spectrum of sulfur using the 600 grooves/mm, 2D mSHRS spectrometer (a) compared to the same sample measured using a high-resolution micro-Raman spectrometer (b). The micro-Raman spectrum was a 90 s exposure time and does not show the anti-Stokes Raman bands, limited by filters in the spectrometer. The mSHRS spectrum was a 30 s exposure and shows both Stokes and anti-Stokes bands, though each was measured separately using different filters. A holographic notch filter was used for both measurements to block intense Rayleigh scatter at the laser wavelength. For the Stokes spectral region, a 532 nm long-pass filter (LPF) was used to further reduce Rayleigh scattered light and to block light outside the spectral region of interest from reaching the detector, while for the anti-Stokes spectral region measurement, shown magnified by 10 × , a 530 nm short-pass filter was used. Sulfur was used to determine the spectral resolution of the 2D device. Note that the Littrow wavelength (316 cm−1) is midway between the two strongest sulfur bands at 219 cm−1 and 473 cm−1 (see Fig. 7a). This 2D device was made differently from ones that have been previously described. In this device, one of the gratings was rotated about the optical axis by ∼3.5°, and not tilted vertically as in previous publications. Rotating the grating gives much more precise control of the fringe tilt and is easier to manufacture using monolithic construction. The FWHM of the 219 cm−1 sulfur band was about 4.5 cm−1 for the mSHRS and about 8 cm−1 for the micro-Raman system. The S/N of the mSHRS spectrum was 4101, taken as the intensity of the 219 cm−1 band divided by the standard deviation of the baseline, while the S/N calculated in the same way for the micro-Raman spectrum was much lower, at 1320. Note: Technically, the S/N for the dispersive spectrometer cannot be calculated from the noise in the baseline because noise from the Raman band is localized to that band. However, in the case of a single spectrum, the band intensity to standard deviation in the baseline ratio is often used to estimate S/N. However, this method is useful for mSHRS spectra, since the noise from all spectral bands is equally distributed across the spectrum. If anything, the S/N of the dispersive spectrum is overestimated so this clearly shows a greatly improved S/N for the mSHRS spectrometer.
Raman spectra of sulfur with (a) 2D mSHRS (541.05 Littrow, 600 grooves/mm) using a 30 s exposure and (b) LabRAM micro-Raman with 1800 grooves/mm grating using a 90 s exposure.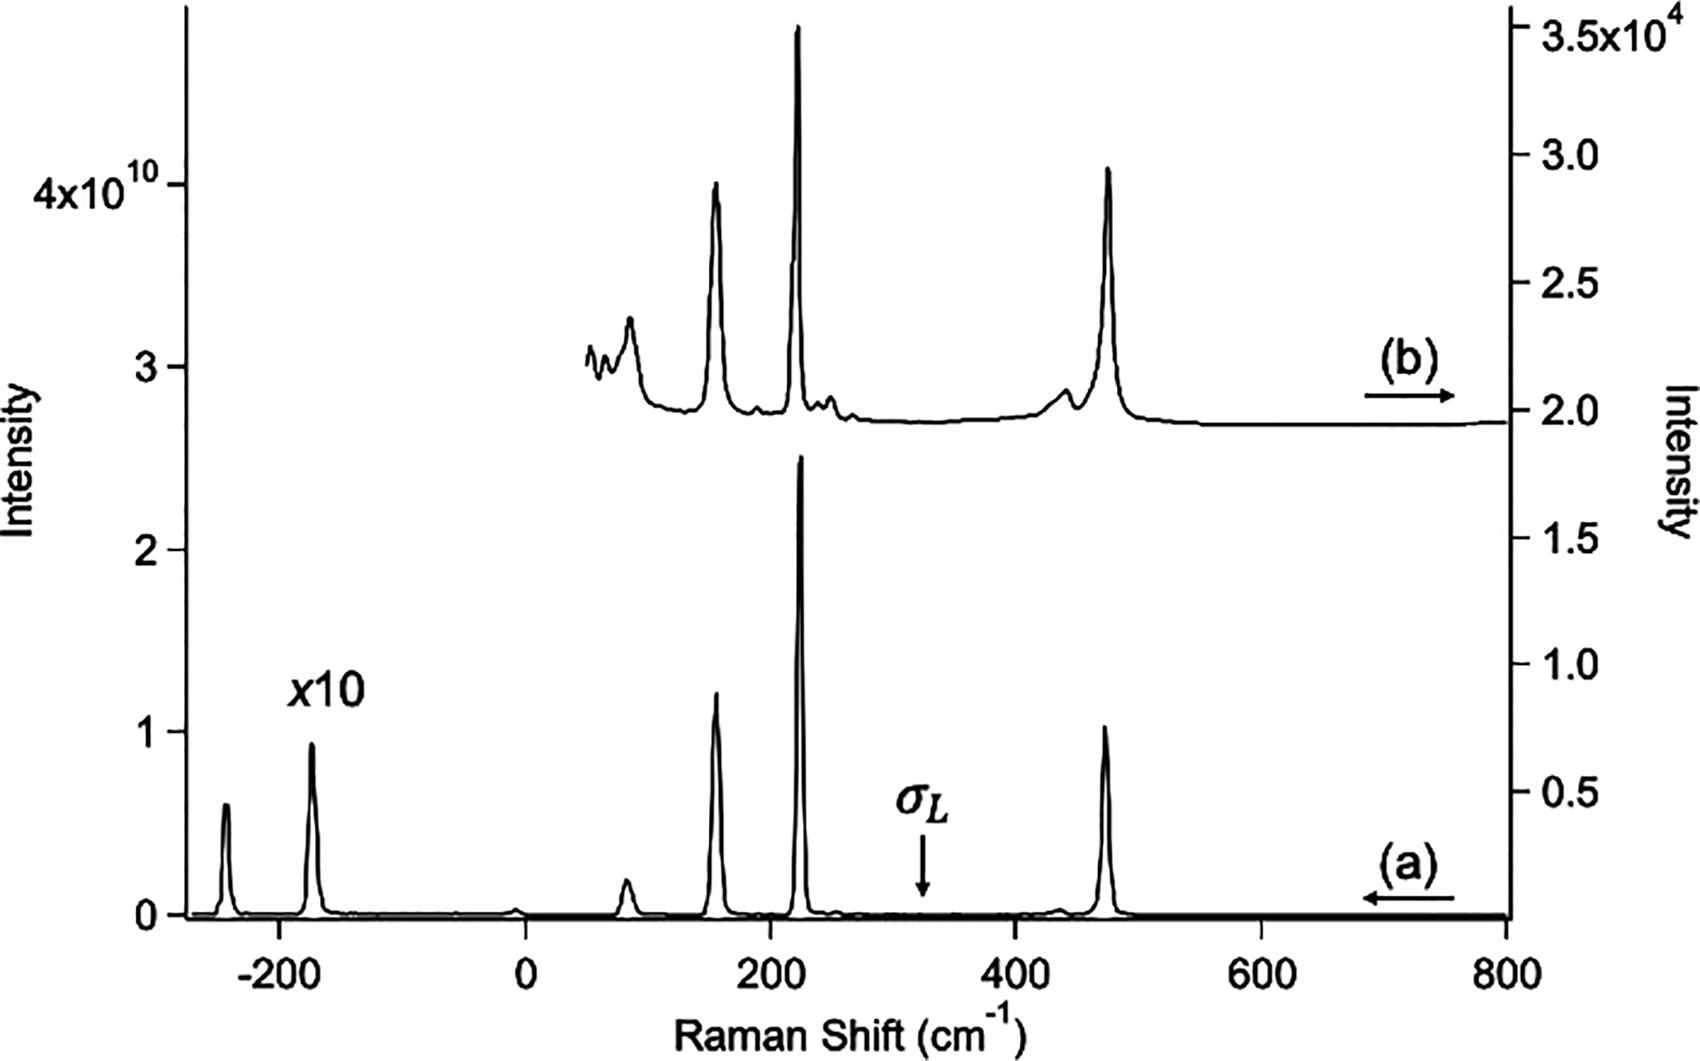
The mSHRS offers the potential to be made exceptionally small and still offer good resolution and spectral range. However, to make a truly small Raman spectrometer also requires a very small detector and laser source. The laser source can in principle be a small diode laser and these are commercially available. In regard to small CCD detectors, CMOS technology offers high performance in a small device, as evidenced by smart phone CMOS cameras, as well as smaller pixels, more pixels, and at a lower cost than a CCD. However, few Raman systems have been described that use low-cost CMOS detectors.12–18 Thus, we decided to do a simple comparison of the performance of the mSHRS, using a small low-cost CMOS imaging detector, to the scientific grade PIXIS 2K/BUV CCD. The CMOS camera we selected for this test is popular for amateur astronomy and costs less than US$1000, yet the performance seems comparable to the PIXIS 2K/BUV CCD for pure samples. Figure 8 shows Raman spectra of (a) isopropanol, (b) methanol, and (c) acetaminophen, measured using the CMOS detector (left) and the PIXIS 2K/BUV CCD (right). We used 15 s exposure times with the CMOS to prevent saturating it and 30 s exposures with the CCD. The S/Ns were similar using either detector. The S/Ns, calculated as the ratio of the baseline subtracted intensity of the chosen band to the standard deviation of a region of the spectrum where no peak were present, were 523, 447, and 334 based on the strongest band in the CMOS spectra of isopropanol, methanol, and acetaminophen, respectively. In the case of the CCD, the S/N values were similar at 433, 353, and 496. The slightly higher values for isopropanol and methanol using the CMOS detector result from less light being lost in the vertical direction on the detector (∼27% loss for the CMOS detector versus ∼73% for the CCD). The lower S/N for methanol using the CMOS detector is consistent with the camera being slightly out of focus, evidenced by lower intensity of the CH bands for this sample in the CMOS spectra compared to the CCD spectra. The smaller size of the CMOS pixels makes this detector much more susceptible to focus issues.
Raman spectra of (a) isopropanol, (b) methanol, and (c) acetaminophen measured with a CMOS detector (QHY-183M, Agena Astroproducts), on the left, and a CCD detector (PIXIS 2K/BUV), on the right. Spectra measured with the CMOS used an exposure time of 15 s and spectra measured with the CCD used an exposure time of 30 s.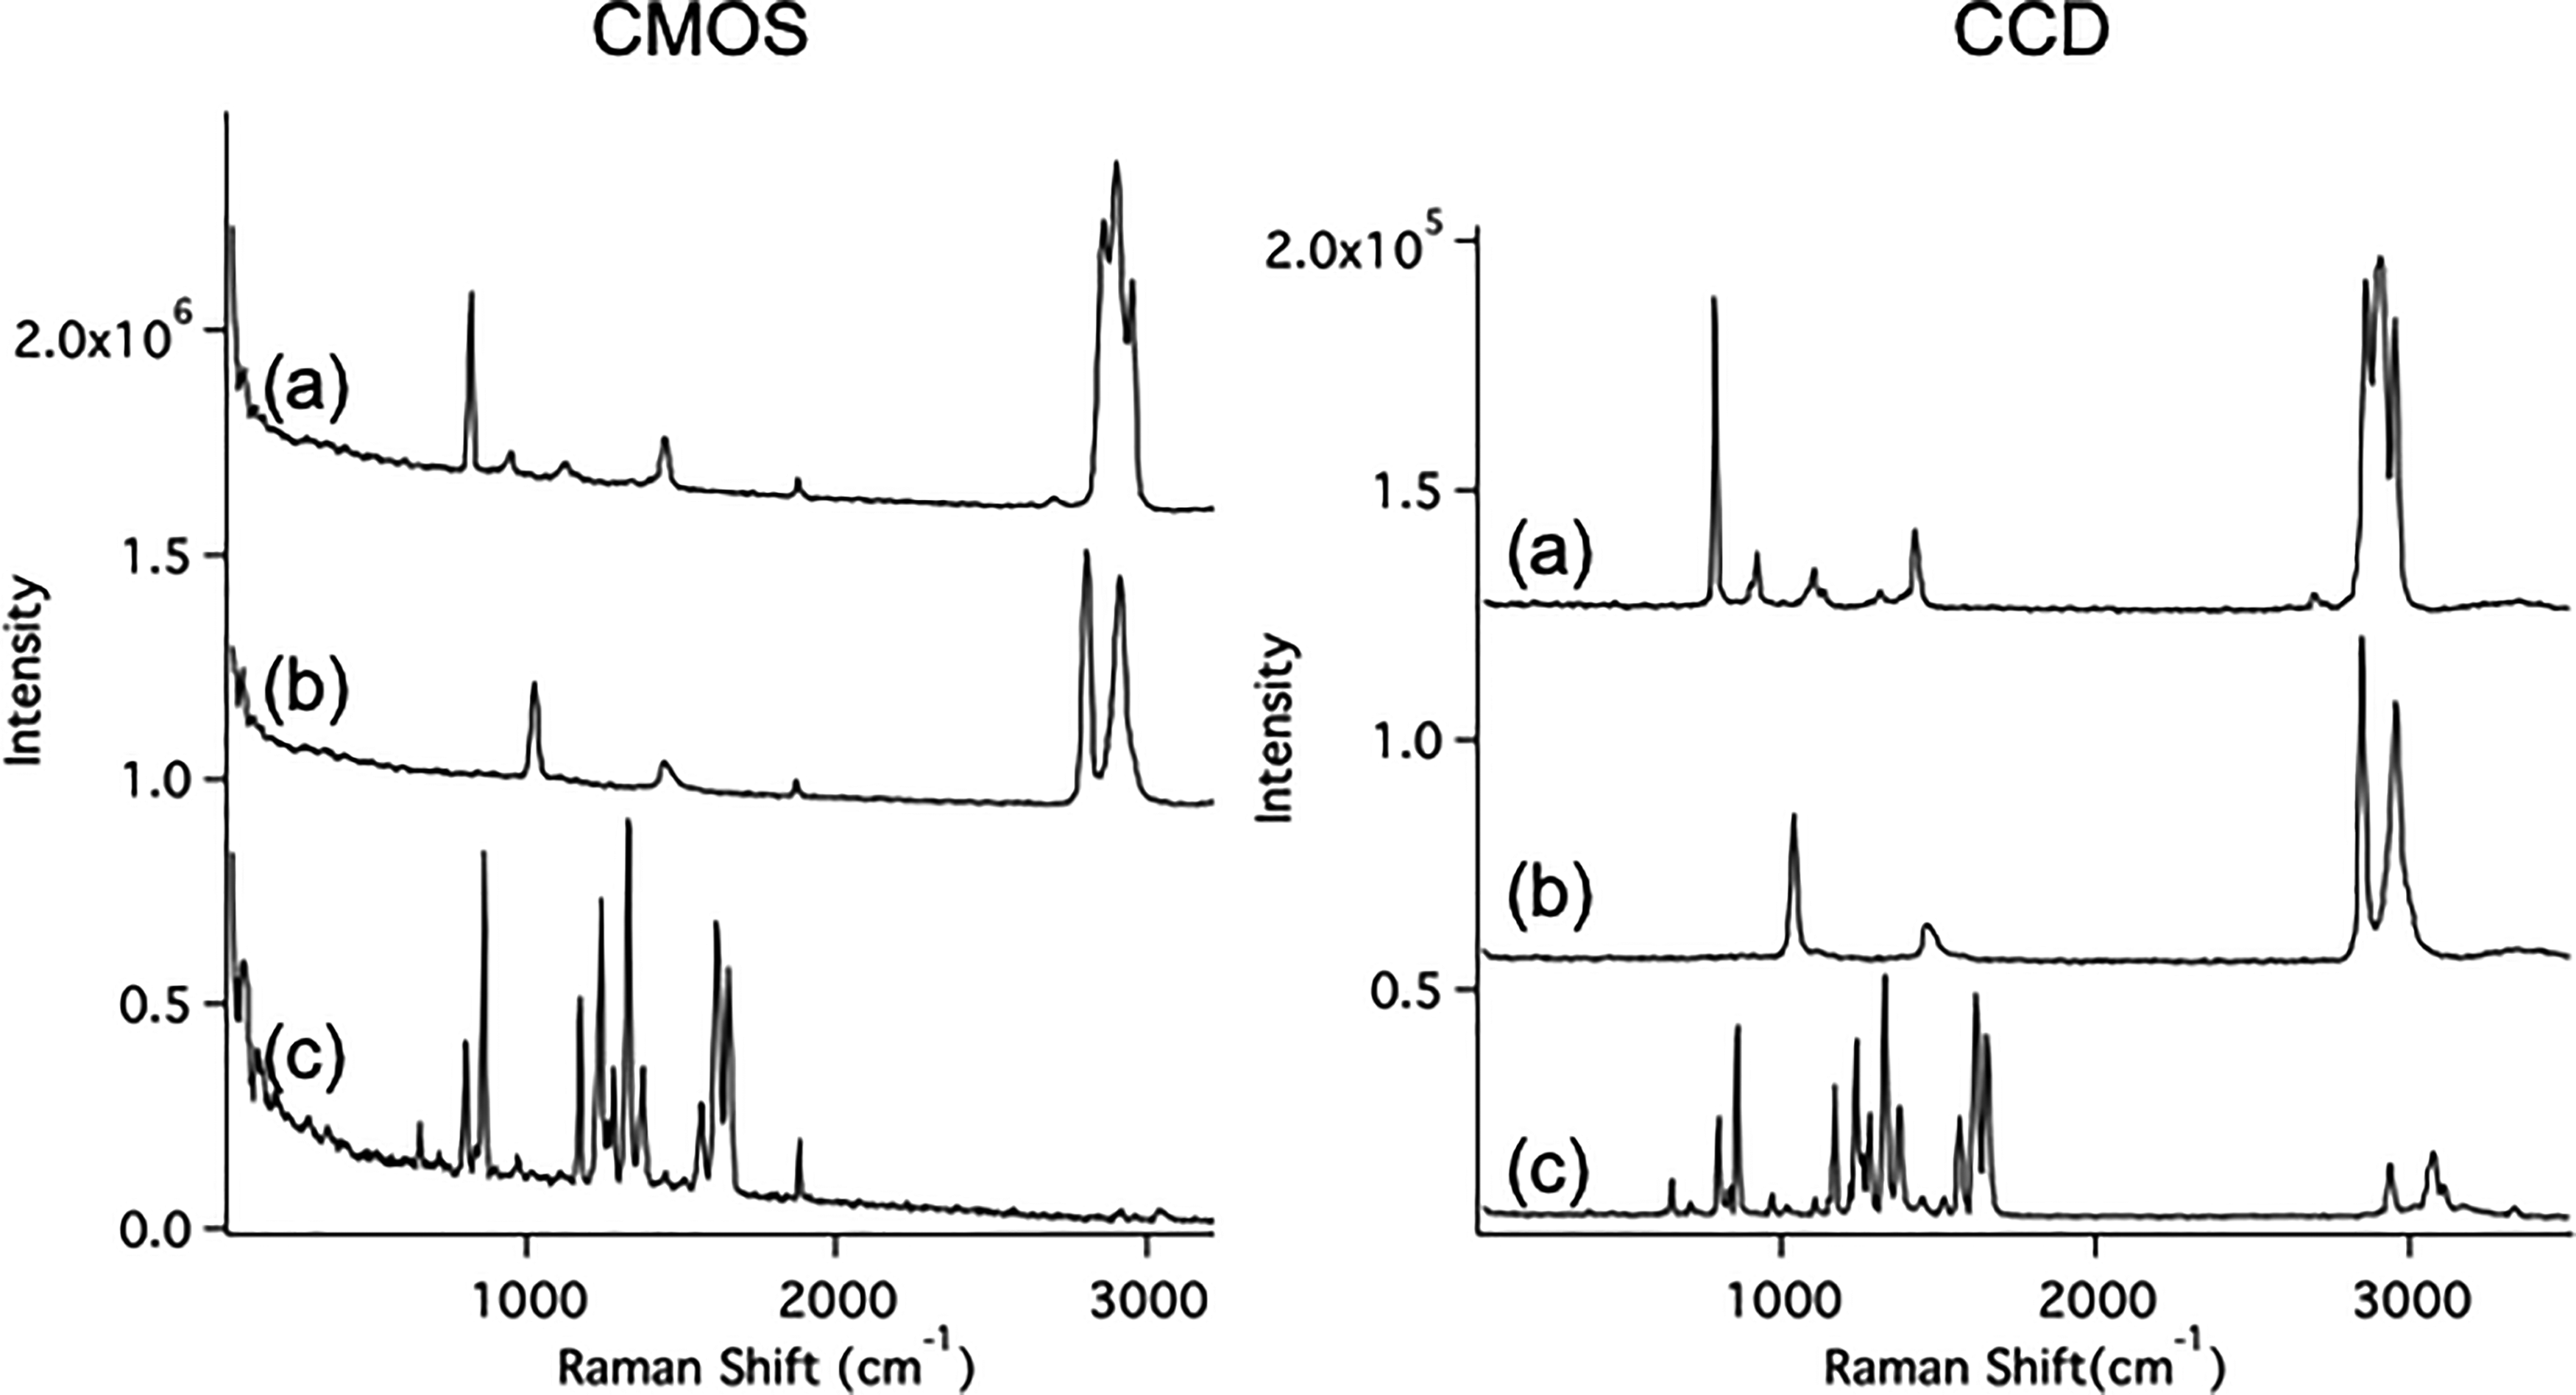
In terms of FV, the CMOS had higher values than the CCD for the liquid samples, 0.52 for the CMOS spectrum of isopropanol and 0.53 for methanol, compared to 0.21 and 0.22 for the CCD. Higher FV is expected for the CMOS detector because it has smaller pixels and used a significantly larger number of pixels (e.g., 5100). In the case of acetaminophen, the FV was 0.26 for both detectors, again suggesting the CMOS was out of focus slightly for this sample.
Both detectors provided a wide spectral range, with bands measured beyond 3000 cm−1. The spectral resolution for the samples was about the same for the CMOS and CCD spectra, ∼12 cm−1 and 15 cm−1 for acetaminophen and isopropanol, respectively. Also, the CMOS measured spectra had a significantly higher background as compared to the CCD, at least in part from increased detector dark noise; the CMOS detector was only cooled to about –17 ℃, compared to –70 ℃ for the CCD.
A remote Raman instrument, called SuperCam, is included on the Mars 2020 Rover. 45 With this in mind, we tested the 150 grooves/mm, 1D mSHRS for remote Raman measurements using two standard Raman reference samples, acetaminophen and potassium perchlorate pressed into pellets, and two mineral samples that are relevant to planetary geology, barite (BaSO4), and gypsum (CaSO4ċ2H2O). For these measurements, the samples were located at 5.13 m distance from the mSHRS, and no collection optics was used other than the 15 mm mSHRS gratings. Laser illumination was on-axis like the previously described measurements; the laser power (CW) at the samples was 530 mW and the laser spot size was about 10 mm. All measurements used an exposure time of 180 s. At 5.13 m, the collection solid angle of the mSHS is 8.5 × 10⁻⁶ sr, which is > 23 000 times less than the bench top measurements discussed previously using an f/2 collection lens.
Figure 9 shows remote Raman measurements of barite (Fig. 9a), potassium perchlorate (Fig. 9b), acetaminophen (Fig. 9c), and gypsum (Fig. 9d). The inserts show the fringe image cross-sections (e.g., interferograms,) for each spectrum. The FV of the interferograms was lower than the bench top measurements, 0.09 for barite, 0.29 for potassium perchlorate, 0.09 for acetaminophen, and 0.05 for gypsum. This is expected since the background was much higher relative to the signal for these non-gated remote Raman measurements—gating is typically used for remote Raman to reduce higher backgrounds that are caused by higher ambient light, a larger laser spot on the sample and higher sample fluorescence, and a smaller collection solid angle. This was despite there being no collection optic to collimate the light into the mSHRS. However, at 5.13 m, all light entering the mSHRS is within the acceptance angle of ∼1º, and thus the resolution should not be diminished.
Remote Raman spectra of (a) barite, (b) potassium perchlorate, (c) acetaminophen, and (d) gypsum at 5.13 m using a mSHRS (531.6 nm Littrow, 150 grooves/mm). Exposure time was 300 s for each measurement. Inserts show the cross section for each spectrum. No collection optics were used to measure the spectra. The fringe visibility was 0.09 for barite, 0.29 for potassium perchlorate, 0.092 for acetaminophen, and 0.05 for gypsum.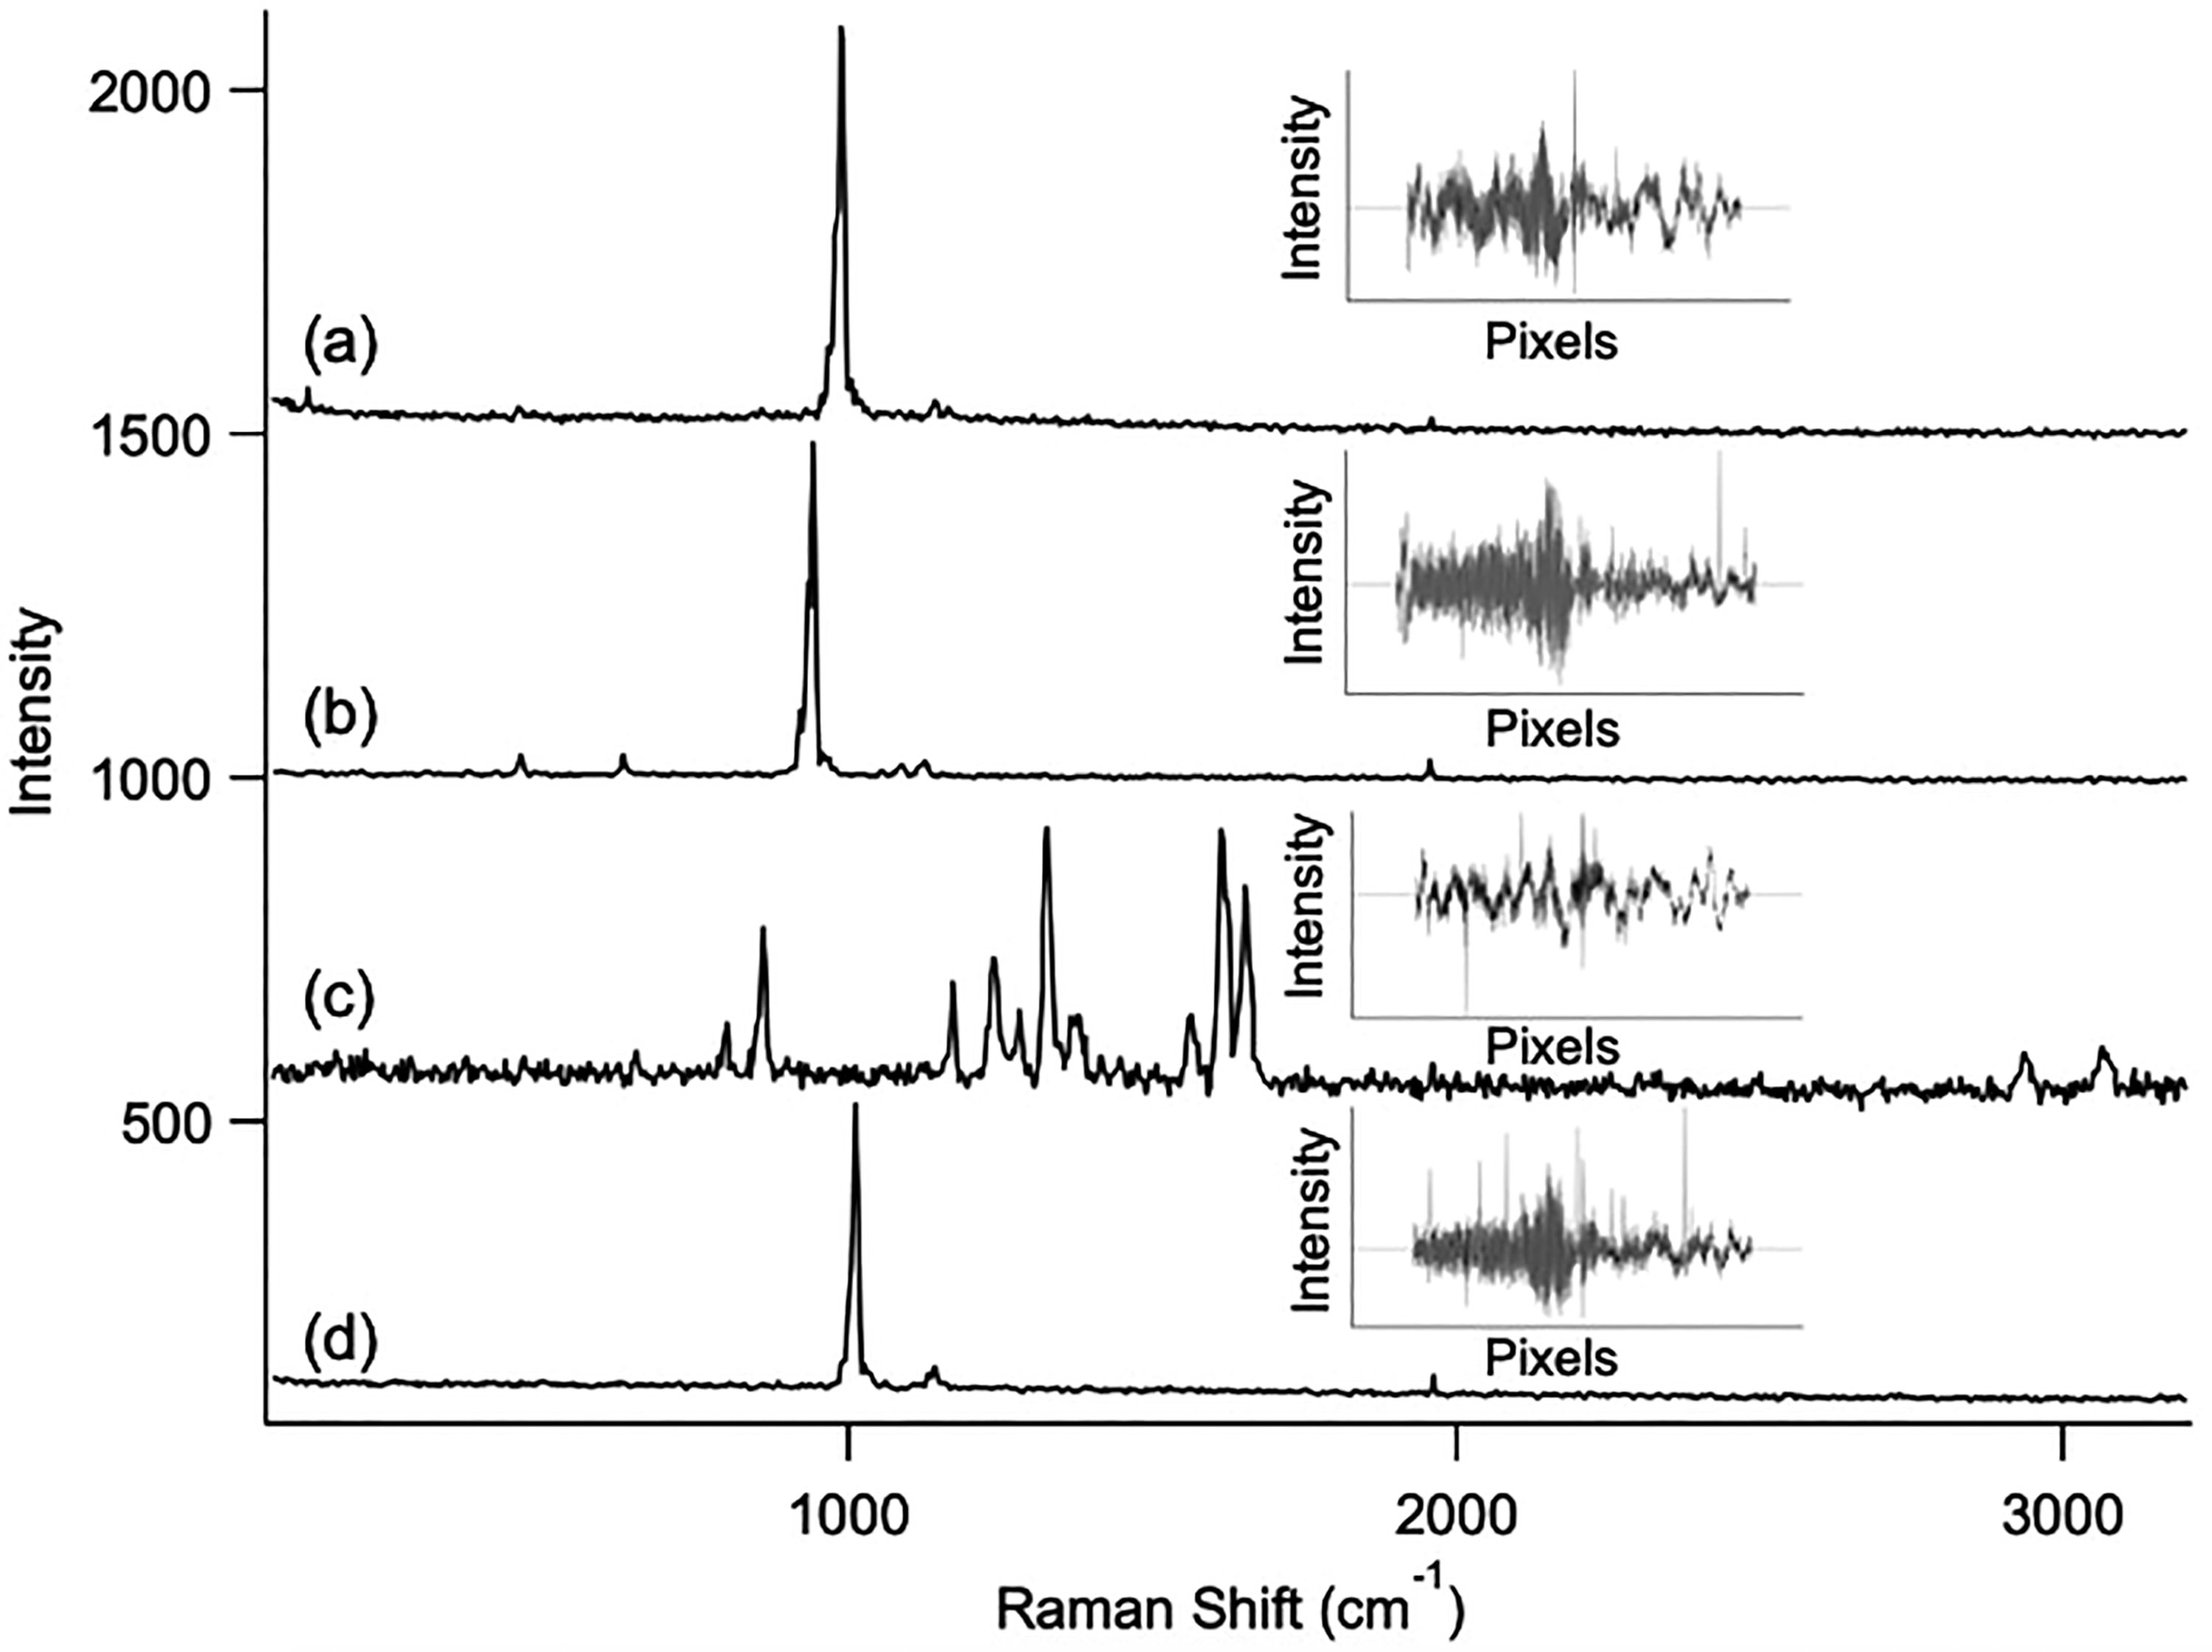
The field of view of the mSHRS is almost 200 mm at a sample distance of 5.13 m (2° full acceptance angle plus the grating width), much larger than the ∼10 mm laser spot size at the sample. This leads to an important advantage of the mSHRS for remote Raman, the alignment is very forgiving of laser pointing stability as well as changes in the field of view of the spectrometer during the measurement, both of which can be an important source of noise in remote Raman measurements using a slit-based spectrometer.
Conclusion
The development of a small Raman spectrometer will require reducing the size of the three main components, the detector—usually a CCD, the laser, and a wavelength discriminator (e.g., a monochromator, spectrograph, or interferometer). Significant progress has been made on small diode lasers and CMOS CCD detectors for Raman spectroscopy.12–18 There are also many miniature Raman spectrometers on the market that use dispersive monochromators as the wavelength discriminator. This paper focuses on the latter component, and describes two different mSHSs, each about 3.5 × 3.5 × 2.5 cm in size and weighing about 80 g, used as the wavelength discriminator in a Raman spectrometer (mSHRS), in both a 1D and 2D configuration. The spectral range of the 1D mSHRS is shown to be about 3500 cm−1 with a spectral resolution of ∼8–9 cm−1, while the resolution of the 2D mSHRS is 4–5 cm−1, higher than a much larger laboratory micro-Raman spectrometer with an 1800 grooves/mm grating. The mSHRS was found to be more stable, have higher S/N, a larger spectral range, and higher spectral resolution than our previously described free-standing, bench top SHRS. However, it should be noted that, in principle, it should be possible to improve the stability differences by using higher quality optical mounts in the bench top system. Signal to noise ratio comparisons for repeated spectral measurements between the mSHRS and a Kaiser Holospec Raman spectrometer using the same detector and laser power gave similar results. Remote Raman measurements were made at a distance of 5.13 m using only the grating of the mSHRS as the collection optics (8.5 × 10⁻⁶ sr collection solid angle). The use of a low-cost CMOS detector with the mSHRS gave similar resolution and S/N to the use of a scientific grade CCD. A new method is demonstrated for recovering 2D spectra using a mSHRS with one grating rotated around the optical axis. Although standard size collection and imaging optics were used with the mSHRS in these studies, the use of miniature optics should be possible since the resolution of the mSHS is not a function of size. The use of smaller optics, such as a small diode laser and a small CMOS detector, has previously been demonstrated, 23 should make possible the development of sensitive, high resolution miniature Raman spectrometers.
Footnotes
Declaration of Conflicting Interests
The author(s) declared no potential conflicts of interest with respect to the research, authorship, and/or publication of this article.
Funding
The authors would like to thank the National Science Foundation (grant numbers CHE-1308211 and OCE-1829333) and NASA (grant numbers NNX14AI34G and 80NSSC19K1024) for funding this work.