
Abstract
Tip-enhanced Raman spectroscopy (TERS) provides the sensitivity required to obtain the vibrational fingerprint of few molecules. While single molecule detection has been demonstrated in UHV experiments, the sensitivity of the technique in ambient, liquid and electrochemical conditions is still limited. In this work, we present a new strategy to increase the signal-to-noise in TERS by spatial light modulation. We iteratively optimize the phase of the excitation beam employing two different feedback mechanisms. In one optimization protocol, we monitor the spectral changes upon aberration correction and tight far-field focusing. In a second protocol, we use a phase-optimization strategy where TER spectra are directly used for feedback. Far-field tight focusing results in average signal enhancements of a factor of 3.5 in air and has no impact on TER signals obtained from solid/liquid interfaces. Using the TER spectrum as direct feedback, we obtain average signal enhancements between a factor of 2.6 in liquid and 4.3 in air. In individual cases, some bands increase by more than one order of magnitude in intensity upon spatial light modulation. Importantly, phase modulation in addition allowed the retrieval of bands that were initially not discernible from the noise. The proposed beam-modulation strategy can be easily implemented in existing TERS instruments and can help to push the detection limit of the technique in applications where the signal-to-noise level is low.
Introduction
Tip-enhanced Raman spectroscopy (TERS) is a surface characterization technique where the Raman signal of, commonly, a (sub) monolayer adsorbate or thin film is enhanced through the generation of a highly localized near-field around a metallic nanostructure of a scanning probe microscope tip. As such, TERS allows the collection of near-field Raman fingerprints with extreme sensitivity and spatial selectivity. Despite the fact that Raman enhancements of five to seven orders of magnitude can be reached with TERS, 1 the technique still has to mature into a routine analysis tool where a low amount of arbitrary surface species can be characterized at sufficiently high signal-to-noise levels in different experimental conditions ranging from ultra-high vacuum to ambient/gas phase to liquid environments.
Crucial to achieve high TERS sensitivity to study adsorbates at atomically smooth surfaces are a tight focusing of the far-field that avoids aberrations caused by optical elements in the beam path, an optimal far-field coupling to the tip or gap plasmons and an efficient detection beam path to collect the highest possible number of TER scattered photons from the sample. Various strategies have been proposed in the literature to achieve improved TER signals and increase the technique’s sensitivity. One common way to improve TERS sensitivity is through tuning the tip (probe) properties, such as material, size and shape, or surface structure,2,3 or the gap properties, such as the tip-sample distance. 4 Other approaches include optimization of the optics, for example, by polarization control, 5 excitation wavelength adjustment to gap and/or molecular resonances,6,7 or minimizing focus distortion. 8
Here, we propose a simple optical approach based on spatial light modulation (SLM) that can be implemented in a straightforward way in any TERS setup and programmed according to the system specifications. With the help of SLM, the far-field focus can be manipulated in size and shape by individually adjusting the pixeled phases in the excitation beam cross-section. SLM is commonly employed in microscopy applications to correct beam aberrations and improve image quality in or across opaque media.9–11 We have shown in an earlier work that it is possible to restore a tight focus with the help of adaptive beam phase shaping even over large working distances of >10 mm across materials of different refractive indices, 12 a typical focusing condition in TERS setups.
Here, we apply the SLM strategy to TERS experiments to a showcase nonresonant PhS monolayer adsorbate at Au(111) in air or water environments, the guinea-pig target species in TER studies. 13 We achieve signal enhancements of up to about one order of magnitude. In this way, also small Raman bands that are not discernible in TER spectra without phase correction increase above the noise level, facilitating sample characterization and increasing the sensitivity threshold of the TERS experiment.
Experimental Section
Sample Preparation
A cylindrical (10 mm diameter, 4 mm height) Au(111) single crystal of 5 N purity (Mateck) is used as substrate in the experiments. After the crystal is cleaned by immersing it into piranha solution (H2SO4:H2O2 of 3:1) over night and subsequently rinsing it with boiling MilliQ water (Ultrapure water, Millipore-Q with a resistivity higher than 18 MΩċcm) and EtOH, the single crystal is flame annealed according to the Clavilier method, 11 cooled in Ar atmosphere (5 N, Westfalen) for 5 to 10 min and immersed in the adsorbate solution.
For adsorption of the PhS molecular monolayer, the freshly annealed Au(111) crystal is immersed in a 10–5 M ethanolic solution of PhS (ethanol absolute for analysis from EMSURE; PhS from Sigma Aldirch, purity ≥99 %) for 12 h. Before mounting the sample in the TERS setup, it is rinsed carefully with copious amounts of MilliQ to remove multilayers of PhS.
For in-water experiments, a special sample cell for the experiments in liquids is used. 14 The cell consists a main body made of KEL-F to which a glass window (coverslip 22 × 22 mm2, 170 µm-thick; Carl Roth) is pasted with UV glue (Loctite 3321). The angle of the cell wall is such that the laser beam is perpendicular to the glass surface. Cell and glass window are cleaned separately following the piranha cleaning protocol described above between experiments. An O-ring is placed between substrate and cell to prevent solution from leaking. The freshly prepared PhS/Au sample is immediately mounted in the liquid cell right after rinsing, and the cell filled with MilliQ water.
Tip-Enhanced Raman Spectroscopy
Our home-built TERS setup is schematically depicted in Fig. 1a and has been described in detail before.
14
Briefly, the setup is based on a commercial electrochemical scanning tunneling microscope (EC-STM) capable to operate in ambient and electrochemical conditions (Agilent 5420) coupled with a Raman spectroscope with 632.8 nm HeNe laser excitation (REO LSRP-3501, 35 mW maximum output power, p-polarized beam). A laser clean-up filter (Semrock MAXLINE LL-632.8-25.0 M) and different gray filters (Thorlabs, filter wheel FW212C) are installed at the exit of the laser for power control. The laser light is focused with an Olympus 50× long working distance objective (working distance: 10.6 mm; numerical aperture: 0.5) at an angle of 55° between the propagation direction of the excitation beam and long tip axis. The TER scattered light is collected in backscattering configuration with the same objective. A long-pass filter (Semrock RazorEdge ultra steep long-pass edge filter LP02-633RE-25) and a dichroic long-pass beam splitter (Semrock RazorEdge Dichroic LPD02-633RU-25 or Iridian 633 DM UY000019) with cut-off values at 79 and 156 or 70 cm–1, respectively, filter out the Rayleigh elastic scattering in the detection path. A complementary metal-oxide semiconductor (CMOS) camera (EoSens MC 1362, Mikrotron) can be integrated in the beam path with the help of a 50:50 beam splitter (Thorlabs CM1BS013) mounted onto a flippable holder to visually inspect the far-field focus and tip-illumination. A Horiba iHR 550 spectrograph equipped with three different gratings of 600, 1200 and 1800 g/mm with a nitrogen-cooled charge-coupled device (CCD) camera (Symphony II, Horiba) is used as a detector. The STM tip-sample bias voltage, E
bias
, was set to 0.1 V for all TERS-based experiments. The tunneling current set-point, I
t
, was chosen to give the most stable tunneling conditions, which was typically 0.5 nA in air and 1 nA in liquid. The laser power (measured after the focusing objective) was between 0.7 and 1.5 mW for in-air and between 1.8 and 2 mW for in-liquid TERS experiments.
(a) Schematic of the TERS setup including SLM extension. Examples for (b) phase contrast, (c) tip-illumination and (d) far-field focusing before (left) and after (right) modulation. Scale bars as indicated.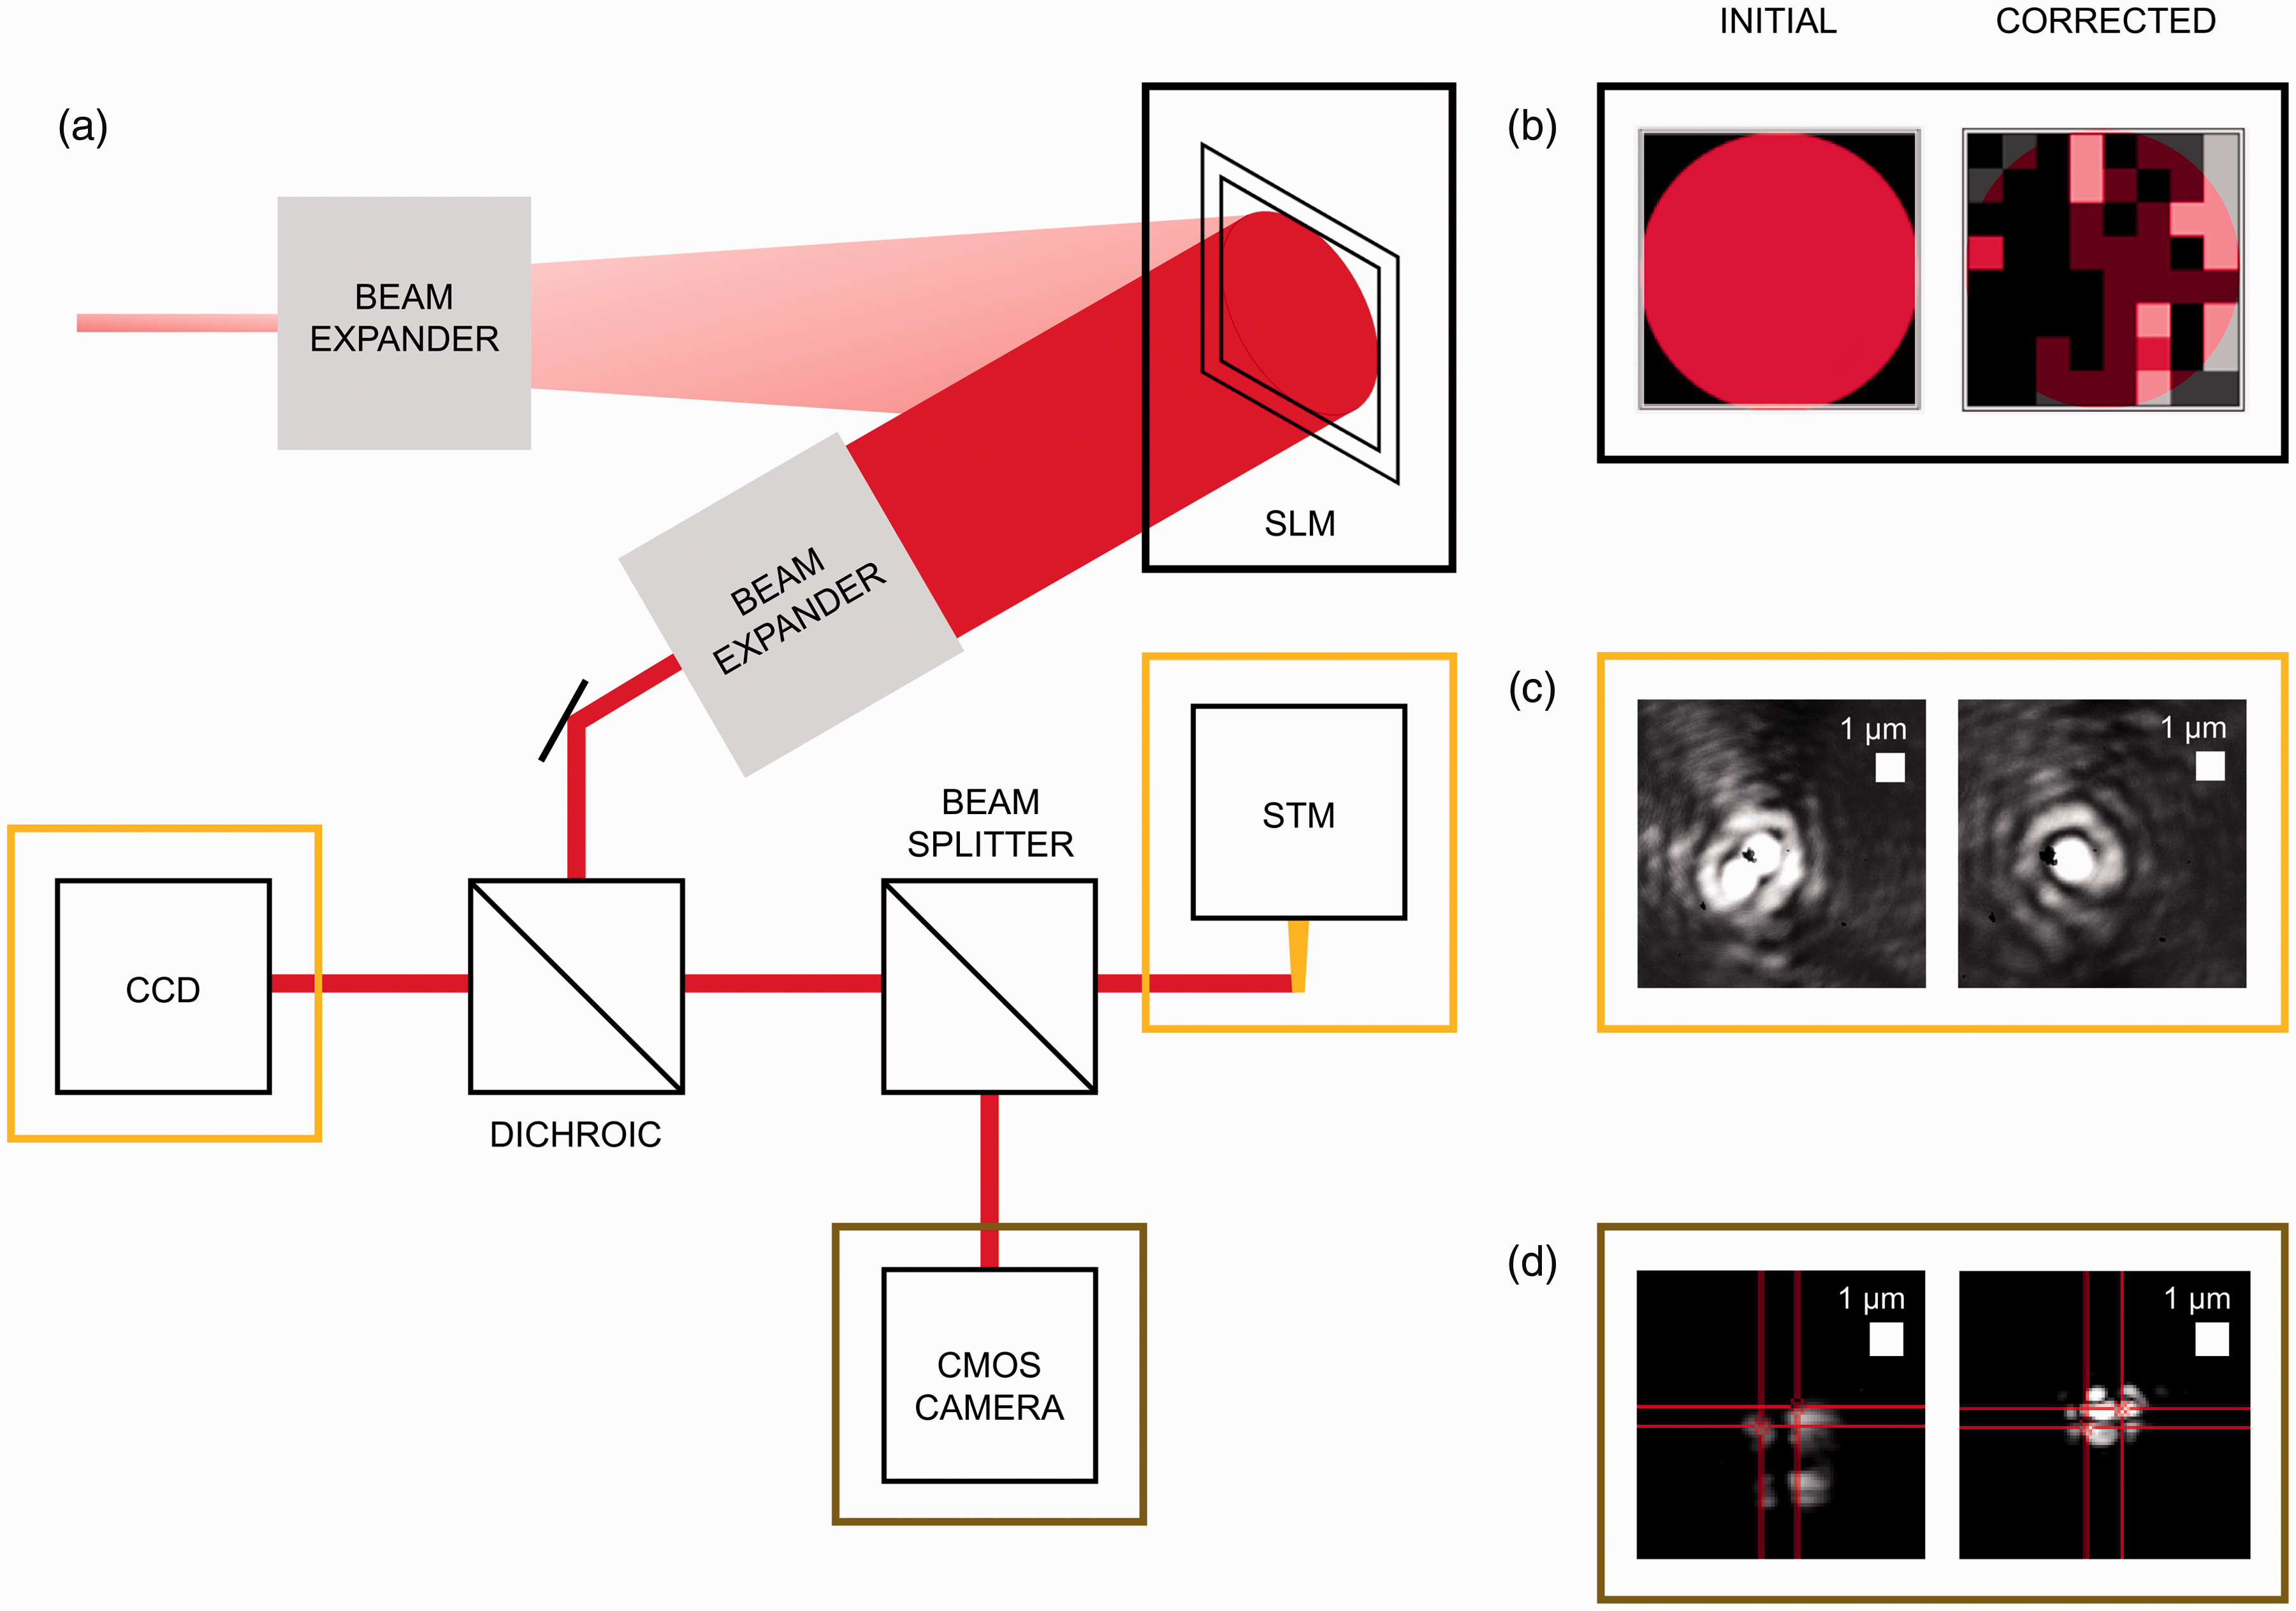
OriginPro 2017 is used to fit Lorentzian peaks (Peak Analyzer, Fit Peaks (Pro), baseline mode) to the raw data without background normalization (see Supplementary Information for details). For linear baseline definition, user-defined points in the spectra are connected by linear interpolation ranging from 391 to 434 cm–1 for the 417 cm–1 mode, from 960 to 1100 cm–1 for the triplet at around 1000 cm–1, and from 1519 to 1652 cm–1 for the peak at 1575 cm–1. To enhance the quality of the resulting fit, inputs are given with fit control.
Spatial Light Modulation
The TERS excitation beam path has been extended by an SLM (Boulder Nonlinear Systems, BNS-XY-PH-P256 in reflective mode, phase modulator) located between the laser and the dichroic filter. The SLM provides a 256 × 256 pixel array of 6.14 × 6.14 mm 2 (24 × 24 µm pixel pitch). To reduce dimensionality and thus experiment time, individual pixels can be combined into superpixels; in this work, a matrix of 8 × 8 superpixels is employed (Fig. 1b). The number of phase values can be adjusted at will by dividing 2π into the desired number of phases up to a maximum of 1000. In this work, the number of evaluated phase values was chosen to be between 4 and 10, i.e., a separation between 0.5 π and 0.2 π between one tested phase and the consecutive one. Before reaching the liquid crystal display of the SLM, the beam cross section is enlarged with a beam expander (Thorlabs BE03M-A) to fill the SLM display. Analogously, the SLM extension path includes a second beam expander (Thorlabs BE052-A) to reduce the size of the phase-corrected beam to slightly overfill the back-entrance of the objective.
For optimal performance of the SLM, the incidence angle with respect to the liquid crystal display should be as small as possible, i.e., under 10° with respect to the display surface normal, to reduce cross-talk effects due to the beam traveling through more than one pixel region. Installing the SLM to achieve such a small angle between incident and reflected beam requires a carefully designed beam path. The mirrors just before and after the SLM have to be mounted at large distances from the SLM to avoid clipping of the beams at the mirror mounts, given the enlarged size of the beam.
The TER signal optimization approach using the SLM is based on modulating the phase of each individual pixel in the expanded excitation beam cross-section before the light is focused by the objective. To find the appropriate phase for each pixel on the SLM, we have implemented an iterative SLM program in Labview (details of the program can be made available from the authors upon qualified request) based on the step-wise sequential algorithm reported by Vellekoop and Mosk. 10 More specifically, the phase of one pixel on the SLM is scanned, while the other pixel phases are kept constant.
For this work, we have employed two different feedback strategies based on either (i) the far-field center intensity on the Au(111) surface as imaged on the CMOS camera, i.e., the highest achievable contrast at the center of the focus, or (ii) on the TER spectral intensity as recorded on the spectrometer CCD, i.e., the maximum TERS band intensity to be reached. For the CMOS-based algorithm, the exposure time and frame rate of the CMOS images can be selected and a region of interest (ROI), here the center of the far-field focus, in the CMOS image that is to be used for the SLM feedback has to be defined. For the TER spectra-based algorithm, a spectral region of interest, e.g. the entire spectral window, particular spectral regions or individual vibrational modes, is chosen to serve for phase correction feedback.
Based on the feedback result, the optimal phase value for each pixel is determined consecutively. Once all pixels have been evaluated, the optimal phases for each of them (across the expanded beam) are applied, and this configuration is used during TER spectral acquisition. To further improve the far-field focusing or TER signal intensity, respectively, the pixel-by-pixel phase scan is repeated up to three times. The manuscript reports on the maximum signal enhancement achieved per experiment unless stated otherwise. The impact of the phase modulation, i.e., the SLM enhancement, is then evaluated by comparing integrated band intensities of the initial spectrum (maximizing spectral intensity by adjusting the far-field/tip illumination through x,y,z piezo movement) and of the spectrum after phase modulation, Icorrected/Iinitial.
Results and Discussion
A general overview of the SLM implementation in the (existing) TERS setup displaying the location of the main optical components is shown in Fig. 1a to illustrate the location of the SLM between the laser source and the dichroic filter. Details about the arrangement of the optical components can be found in the Experimental section. The right part of Fig. 1 shows examples of images of (b) the phase levels of the SLM, (c) the tip illumination and (d) the far-field focus before and after correction, respectively.
The phase image (Fig. 1b) before correction (left) is flat, i.e., all phase levels are adjusted to a random (flat) value. After correction, the gray levels in the image depict the different optimized phase values in each pixel. This optimum phase correction is then used when acquiring TER spectra. Often, an elliptical or nearly spherical phase shape is observed, which is due to the mostly spherical aberrations caused by the side-illumination geometry. 12 The image shown in Fig. 1c illustrates how the tip illumination as visualized on the CMOS camera changes upon TER spectra-based SLM. The focus image at the tip usually does not exhibit any marked differences before/after SLM due to the limited spatial resolution achieved with CMOS imaging. Figure 1d displays the far-field focus on the sample surface as used for far-field-based SLM before and after phase modulation. Here, a clear tightening of the focus and increase in focus center intensity is observed in all experiments.
Figure 2 shows the example of TER spectra before and after phase modulation based on far-field focus correction in air (a) and on TERS intensity feedback in air (b) and in water (c) environments of PhS/Au(111). Note that we were not able to record any successful SLM-enhanced data for far-field correction in water. The depicted spectra are representative data sets that provide an overview of the achieved signal quality in terms of S/N and background shape and intensity. For both in-air and in-water conditions, the well-known TERS fingerprint of PhS/Au(111)13,15 is detected. In air, S/N ratios between around 2 and 6 are routinely achieved before phase shaping for the three PhS modes located at around 1000 cm–1 (ring breathing and aromatic CH stretching). The typically rather weak vibrational mode at 417 cm–1 (CS and AuS stretching) is only rarely visible in the initial spectra. Intensity retrieval of this band can thus serve as a useful indicator for the quality of phase correction and signal enhancement.
Example TER spectra before (black) and after (gray) (a) far-field focus modulation or TER signal modulation (b) in air or (c) in water.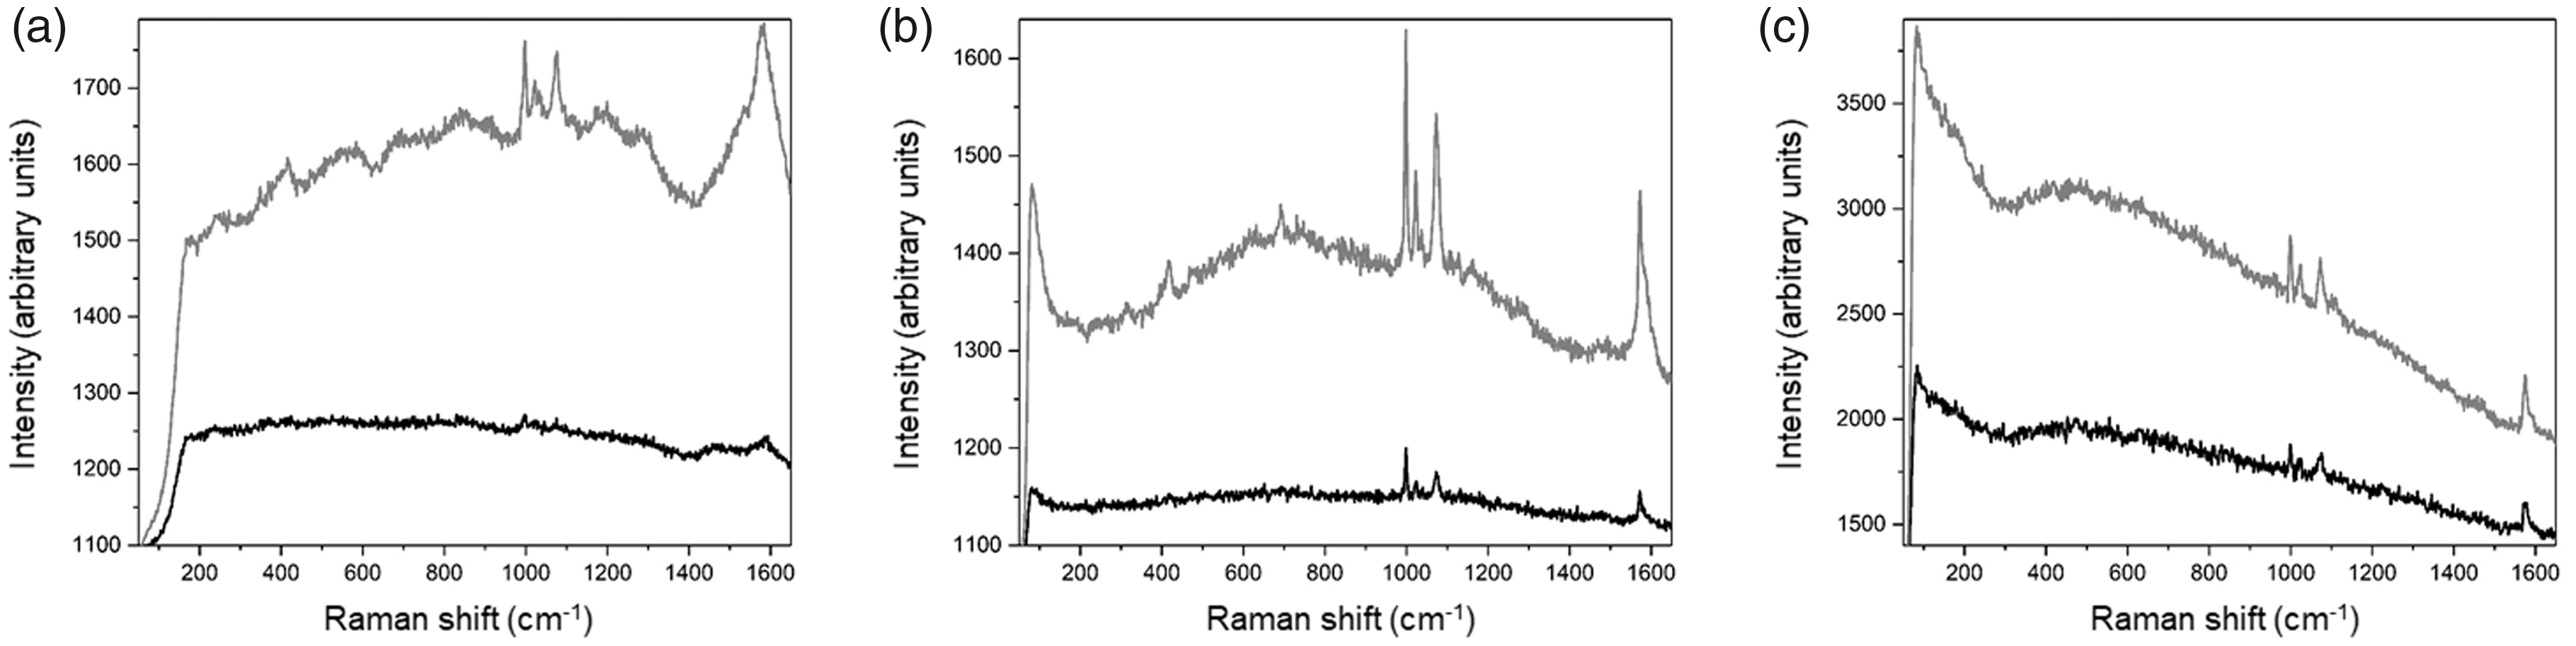
An overview of the achieved maximum SLM-based enhancements of successful phase-correction PhS/Au TERS experiments, Icorrected/Iinitial, is plotted in Fig. 3. The results are divided into CMOS-image-based (black filled stars) and TERS-intensity-based outcomes, the latter distinguishing between in-air (gray filled circles) and in-water (gray empty circles) results. We plot the maximum SLM-based enhancements for the characteristic ring stretches of PhS located at 998, 1024, 1075 cm–1 and for the asymmetric band centered at 1583 cm–1 (C=C aromatic stretching) fitted with three Lorentzians (an example for the peak fitting procedure is given in the Supplementary Information). As not all bands were above S/N in all experiments, the number of data points varies between individual modes. Particularly, it is to be noted that only in three cases, useful SLM-based enhancements could be assigned to the low-wavenumber mode at 417 cm–1 whose intensity was below S/N before correction in the majority of cases.
Overview of maximum intensity enhancements of individual PhS modes, Icorrected/Iinitial, obtained by far-field focus modulation or TER signal modulation as indicated. Black filled stars: far-field (air), gray filled circles: TERS (air), gray empty circles: TERS (water).
With CMOS-based phase modulation, we have achieved an average signal SLM enhancement of a factor 3.5. For individual peaks, we have observed a maximum intensity increase of a factor 12.2, i.e., more than one order of magnitude. However, the CMOS-image-based SLM feedback only provided PhS TER signal enhancement in less than 50% of the trials, and only in-air experiments were successful, despite the fact that the far-field focus center intensity was always successfully enhanced. To exclude that the low success rate of CMOS-based phase modulation is due to difficulties of aligning the (tightened) focus with the tip apex, we ran a complementary set of far-field experiments on MoS2 nanotubes deposited on Au(111) (the PhS monolayer was not detected with conventional Raman spectroscopy with or without phase modulation). For the MoS2 nanotube sample measured in air or in water, we obtained SLM enhancements of the far-field center intensity between 1.7 and 2.6 (see Supplementary Information for details). Also here, far-field intensity improvement did not necessarily lead to an enhancement in the (far-field) Raman signal. As such, we rule out that the low success rate for CMOS-based SLM enhancement is due to difficulties in aligning the tight focus with the gap. Rather, the conventional Raman results point to a non-uniform coverage of adsorbates, as evident on the MoS2 case from the AFM images, and possible also for PhS adsorption at Au(111). In this way, the amount of scatterers in the (corrected) TERS conditions is not necessarily the same as in the initial state, particularly also given the fact of the minute-long SLM iteration times as discussed below, resulting in unsuccessful CMOS-based SLM.
Since the objective of the phase modulation is to reach highest possible TERS intensities and improved S/N, we tested also the alternative approach using the TER spectra directly as feedback. Here, we assume that the far-field focus shape can be optimized to a given experimental tip and gap configuration, and may not necessarily be a tight focus point in the CMOS image, to achieve the best possible far-field/gap coupling. With spectra-based correction, average SLM enhancements reached a factor of 4.3 in air and a factor of 2.6 in water. As such, the spectra-based feedback, on average, performs better than the CMOS-image based one in air. In other words, indeed, as the gap characteristics differ from experiment to experiment, adjusting the far-field focus to the individual gap properties has a clear, positive impact on the TER band intensity.
The spectra-based feedback also allows us to improve the TER signal in water as opposed to the CMOS-based trials. Individual modes could be enhanced by up to a factor of 9.8 in air and 6.1 in water. Importantly, in all in-air trials and in about two-thirds of the in-water trials, the 417 cm–1 mode could be recovered with phase modulation, and also the mode at 470 cm–1 that has previously only been observed in air in exceptionally clear TER spectra. 13 This result proves that SLM is a useful addition to existing TERS setups to improve the S/N to the extent that even Raman bands that are not discernible in the initial TER spectra can be pushed clearly above the noise level.
Furthermore, we tested how the selected spectral region influences the overall SLM enhancement of the TERS bands. Interestingly, choosing a single Raman mode as feedback region resulted in an only negligible band intensity increase of a factor 1.5 on average. The best results as reported in the previous paragraph were obtained by maximizing the total spectral intensity (full CCD range including spectral background) in a first phase modulation iteration and narrowing the feedback to the region around 1000 cm−1 that contains the three main PhS modes in one or two consecutive phase modulation steps. We would like to point out that not in all cases the best corrected TER signal was achieved after three iterations, but could also be found already after one or two SLM iterations, essentially in an unpredictable fashion. Various parameters, like the quality of the initial focusing and tip-illumination, the quality of the STM tip as TERS probe, the stability of the adsorbate and gap configuration, etc. can be expected to play a role for, and currently leave unpredictable, the number of iterations needed to achieve highest SLM enhancement.
Interestingly, the SLM enhancement is not uniform across the whole spectral region, independent of the feedback approach employed. Extreme variations between mode enhancements of factors approximately 2 (1000 cm–1 region) and 9 (1583 cm–1 region) were observed in some cases in the same experiment. Now also, in a few cases, some band intensities are even reduced upon SLM. It is important to note that, as a result of this variation in SLM enhancement across the spectrum, the relative intensity between bands is not always maintained in SLM-correction-based TERS experiments, i.e., different bands can exhibit different enhancements. We observe changes of the energy of the plasmon resonance as indicated by the shape and intensity of the broad TERS background upon beam phase modulation (compare Fig. 2 before and after spectra) that could explain these Raman-shift-dependent enhancements.
The change in background upon SLM can be explained by far-field interaction with spatially non-uniform tip apexes. Altering the illumination geometry through beam shaping may lead to re-focusing to a different part of the tip apex that exhibits a different plasmon or gap mode. Thus, when aiming at extracting quantitative chemical information from the SLM-enhanced TER spectra, it is quintessential to follow a background-normalized analysis routine to account for changes in the background shape, since we expect the modulation not to affect the chemical composition of the sample. Indeed, when we analyzed data that were background-corrected following the procedure proposed by Ren et al., 16 the relative intensities as found in the initial spectrum could be restored.
One important parameter to consider when choosing between far-field or TERS feedback is the total time needed to run up to three iterations to find the optimal phase for a given experiment. For 8 × 8 superpixels, a total of 640 phase levels (64 superpixels with 10 phase levels each) are to be evaluated. CMOS integration times are usually small in the range of 100 s of microseconds, compared to TER spectral integration times that lie in the order of seconds. Further taking into account the communication time between SLM and CMOS through the PC, the rise and fall times of CMOS and SLM, the response time of the SLM and the computing time of the Labview program, one far-field CMOS-based standard iteration will take around 3 to 4 min, resulting in around 15 min for a three-iteration steps optimization, including waiting times between iterations. For the TER spectra-based feedback, evaluating 8 × 8 superpixels with four phase levels each leads to a minimum of 256 s for in-air measurements where we obtain a discernible initial TER signal with an acquisition time of 1 s, or to a maximum of 12.8 min in water with 3 s spectral acquisition time per iteration, or around 45 min for three iterations including waiting times.
These long experiment times pose a high demand for sample stability throughout the SLM. The experimental parameters (mainly excitation power and illumination/integration time) thus need to be adjusted accordingly to prevent from sample degradation and ensure reproducible experiments. In part, sample instabilities, i.e., PhS mobility across or desorption from the Au(111) surface, may be responsible for the wide scattering of SLM enhancements and required iteration numbers observed. When investigating samples that are less prone to degradation in air environment and strong electromagnetic fields, for example, oxide thin films or novel 2D semiconductor materials, one can envision that much shorter SLM times are needed as the excitation powers can be increased. The choice of non-resonant PhS as small organic target species in air or in water environments, on the other hand, depicts a very sensitive, yet at the same time also a very representative TERS system. As such, the results presented in this work serve as a reliable orientation for implementing SLM in general TERS setups for various systems under investigation.
Conclusion
In summary, we present a detailed study on the effect of beam phase modulation on PhS/Au(111) TER signals. Band intensity enhancements of a factor of around four can routinely be achieved in air and in water environments, and one order of magnitude SLM enhancements was observed in individual cases. Importantly, the signal improvement is in all cases sufficient to retrieve also Raman modes that are obscured by noise in the initial TER spectra, as such greatly enhancing the possibility for sample identification and characterization.
All experiments performed with a spectra-based modulation have resulted in an increase of TERS intensity. Further parameters to be tested include the number of superpixels, the number of phase levels in the SLM or the spectral region employed for optimization feedback. In addition, different samples, including target surfaces that are less prone to degradation during TERS experiments, should be tested to obtain a more general picture of the effects of SLM on TERS.
In any case, the work at hand proposes SLM as a valuable and easy to implement addition to TERS setups to push their sensitivity in air, liquid or possibly electrochemical environments in a way that clear identification and characterization of species become possible, particularly in cases of few-molecule detection or investigation of species and/or modes with particularly low scattering cross sections.
Supplemental Material
sj-pdf-1-asp-10.1177_0003702820938065 - Supplemental material for Beam Modulation for Aberration Control and Signal Enhancement in Tip-Enhanced Raman Spectroscopy
Supplemental material, sj-pdf-1-asp-10.1177_0003702820938065 for Beam Modulation for Aberration Control and Signal Enhancement in Tip-Enhanced Raman Spectroscopy by Giovanni Giuzio, Natalia Martín Sabanés and Katrin F. Domke in Applied Spectroscopy
Supplemental Material
sj-pdf-2-asp-10.1177_0003702820938065 - Supplemental material for Beam Modulation for Aberration Control and Signal Enhancement in Tip-Enhanced Raman Spectroscopy
Supplemental material, sj-pdf-2-asp-10.1177_0003702820938065 for Beam Modulation for Aberration Control and Signal Enhancement in Tip-Enhanced Raman Spectroscopy by Giovanni Giuzio, Natalia Martín Sabanés and Katrin F. Domke in Applied Spectroscopy
Footnotes
Acknowledgments
We thank Leonie Driessen for technical support in the sample cell design, Jürgen Worm for creative and fast software solutions, Marc-Jan van Zadel and Florian Gericke for technical support and Stefanie Jung for preparing the figures for the manuscript.
Declaration of Conflicting Interests
The author(s) declared no potential conflicts of interest with respect to the research, authorship, and/or publication of this article.
Funding
The author(s) disclosed receipt of the following financial support for the research, authorship, and/or publication of this article: The authors acknowledge generous project funding through the Emmy Noether Program of the Deutsche Forschungsgemeinschaft (DO 1691/1-1) and through the Boehringer Ingelheim Plus 3 Program.
ORCID iDs
Giovanni Giuzio https://orcid.org/0000-0002-6869-0058 Katrin F Domke ![]()
Supplemental Material
All supplemental material mentioned in the text is available in the online version of the journal.
References
Supplementary Material
Please find the following supplemental material available below.
For Open Access articles published under a Creative Commons License, all supplemental material carries the same license as the article it is associated with.
For non-Open Access articles published, all supplemental material carries a non-exclusive license, and permission requests for re-use of supplemental material or any part of supplemental material shall be sent directly to the copyright owner as specified in the copyright notice associated with the article.