
Abstract
The purpose of this study was to understand the ordered structure of starch in rice flour based on a physical modification with non-heating, milling, and water sorption through the structural evaluation of rice flour using small-angle X-ray scattering (SAXS) and infrared spectroscopy within the 4000–100 cm−1 region. The SAXS pattern of the samples with low moisture contents subjected to milling yield a band within the 0.4–0.9 nm−1 of the q range owing to a lamellar repeat of starch with an ordered structure in rice flour. We proposed an order parameter using the intensity of the SAXS band to quantify the order structure of starch in rice flour, and the true density was negatively correlated with the order parameter. Infrared band at 990 cm−1 in COH bending mode applied to the hydroxyl group of C6 shifted to a low wavenumber corresponding to the order parameter. A linear correlation was found between the order parameter and the 990 cm−1 and band at 861 cm−1 owing to COC symmetrical stretching of glycoside bond and CH2 deformation of the glucose unit of starch, 572, 472, and 436 cm−1, owing to the pyranose ring in the glucose unit of starch. The identified infrared bands are effective for quantifying the ordered structure of starch at the lamellar level. When subjected to water sorption, the band position at 990 cm−1 shifted to a higher wavenumber above a water activity of 0.7. This result revealed that the water-induced transition of glass to rubber of starch in rice flour can be clearly evaluated through infrared spectroscopy using the band at 990 cm−1. In addition, the band at 861 cm−1 also shifted to a higher wavenumber, whereas those at 572 and 436 cm−1 did not show a significant shift. These results indicate that water sorption slightly affects the internal structure and may mainly affect the surface of starch.
Keywords
Introduction
Rice flour consists mainly of starch, and its physicochemical properties, such as the particle size, crystallinity, and amylose/amylopectin ratio, depend strongly on its structure within the micro-to nanometer range.1–3 Although the strict structure of rice flour is an advantage in terms of its environmental impact, its designed modification is necessary for diverse applications.4–8 Milling is commonly used as a processing method to produce ideal materials for practical applications, and makes it possible to induce changes in the physicochemical properties of starch. 9 Yamada et al. suggested that the water-holding ability of milled starch increases with the milling time. 10 Moreover, the process-induced transition was confirmed by increasing the temperature and water content of the starch. 11 It was indicated that the solid state of starch transited from glass to a rubbery-like state through a physical modification. 12 Indeed, the changes in the surface of starch particles in rice flour were reported through scanning electron microscopy in our previous research. 13 Nevertheless, the ambiguity of the structure of starch in rice flour constrains the interpretation of its solid state, and thus structural models in non-thermal processing, such as milling and water sorption, are still under investigation.
Small-angle X-ray scattering (SAXS) is useful for investigating the structure of materials at the nano to micrometer scale. As Gilbert et al. pointed out, SAXS is one of the critical characterization techniques for probing food structures with a long-range order that cannot be investigated using other approaches. 14 In a study on starch, Cameron and Donald found SAXS peaks related to crystalline lamellar repeats, and suggested that a change in SAXS intensity occurred owing to the change in the long-range order structure, which is semicrystalline consisting of amorphous and crystalline repetitions of amylopectin. 15 Thus, it is considered that useful information about the lamellar structure of starch-based materials such as rice flour can be obtained from the intensity profile of SAXS rather than its peak position. Although changes in the order structure owing to perturbation after processing, such as melting and/or gelatinization, have been reported,16–18 to the best of our knowledge, few studies have been performed on the mechanical impact of using gradually modified rice flour.
Vibrational spectroscopy such as infrared (IR), near-infrared (NIR), and Raman spectroscopy are sensitive to changes in the internal structure of polymetric materials, including biological materials.19–25 Numerous studies have been carried out regarding not only changes in the crystallinity of starch in rice flour during processing but also those in its chain conformation, and helicity and local structure by vibrational spectroscopy often combined with wide-angle X-ray diffraction.25,26 Specifically, FT-IR has been used extensively to quantify the short-range order as a crystalline phase index of starchy materials.27–30 Our research group has investigated the structural changes in starch, proteins, and lipids of rice flour subjected to different milling methods based on the IR spectra within the 4000–1200 cm−1 region. 31 This study not only demonstrates the potential of IR spectroscopy for an evaluation of the internal structure of starch in rice flour, it also provides new insight into the adsorption properties of non-ideal solids.
It is well known that IR spectra within the 1200–900 cm−1 region provide structural information regarding the crystalline structure of starch. In particular, the ratio of the band at 1047 cm−1 owing to the ordered or crystalline structure and the band at 1022 cm−1 owing to the amorphous structure has been used to estimate the amount of ordered structure of starch. 32 Van Soest et al. 27 suggested a qualitative determination method for short-range structures based on the IR spectra, and the change in this structure corresponded to a change in the water content. Nevertheless, only a few IR studies have reported the phase transitions of starch-based samples.32,33 Although the absorbance ratio of the two peaks at 1047 and 1022 cm−1 within the 1200–900 cm−1 region was used to quantify the ordered structure of starch,32,34,35 a method for determining the specific bands and using the ratio index has remained ambiguous, and a spectra pretreatment method for identifying the specific bands has not been well established.
In the IR spectra the 900–100 cm−1 region, bands due to vibrations of skeletal modes and ring modes are observed for starchy samples. 32 Moreover, it is known that the prominent water librational L2 band with a maximum at 670 cm−1, which is sensitive to the water structure, expands to the whole region of 900–100 cm−1.34,35 Cho et al. reported that the L2 band was assigned mainly to an intermolecular vibration mode in which a number of water molecules are bound and vibrate cooperatively. 36 Thus, the region below 900 cm−1 is attractive because not only can structural information about both the solution and powder sample be obtained, so can information on high-moisture samples such as foods, whose bands are often saturated in intensity in the 4000–900 cm−1 region. An investigation below 900 cm−1 is also valuable for understanding the ordered structure that cannot be obtained from another IR region. Danker et al. recently demonstrated the spectral change at 900–500 cm−1 and suggested the importance of water in maintaining the whole structure of the starch itself. 22 However, the spectral behavior of rice flour at below 900 cm−1, which reflects a physical modification, has not been fully investigated.
Therefore, the aim of this study was to propose a quantification method for the ordered structure of starch in rice flour using SAXS and FT-IR spectroscopy. In our previous study conducted within the 4000–1200 cm−1 region, we showed that not only did the band shift to a higher wavenumber owing to the CH stretching of lipids at approximately 2930 cm−1, its CO stretching band at 1740 cm−1 disappeared from water sorption. 31 These results suggested that these bands are markers for the structural changes of the rice flour surface through a physical modification without heating, but are only indirect markers for evaluating the starch content in rice flour. Therefore, in the present study, focusing on the behavior in the IR region at below 900 cm−1, the possibility of a quantitative evaluation of changes in the ordered structure in starch of rice flour and the interaction between solid, especially starch and water molecules by physical modification has been investigated when subjected to milling and water adsorption.
Materials and Methods
Sample Preparation
White rice (Oryza sativa L. cv. Nipponbare) harvested in 2017 from Miyagi Prefecture, Japan, was pulverized using a jet mill (SPM-R290, Nishimura Machine Works Co., Ltd.). The diameter of the rotor for this machine was 290 mm, and dry and wet mills were used. In the case of wet mill, the rice was soaked in water during 5 h prior to milling. The rotations were gradually changed in three steps for each mill method to develop the model rice flour with a gradually different size; thus, six different samples were prepared in this study (DM1-3 and WM1-3). The particle size (mean diameter) of DM1-3 was 26.28, 26.38, and 26.50 µm and that of WM1-3 were 25.28, 25.59 and 25.77 µm, respectively. The “α-formed” sample was also prepared, and the white rice was subjected to α-type milling at 130 ℃. The sample preparation method was the same as that used in our previous study. 13
Small Angle X-ray Scattering
Small-angle X-ray scattering (SAXS) in the 0.06–4.00 of 2θ range was measured using a Smart Lab (Rigaku Co.) with 0.01 intervals of 2θ. The tube current and X-ray voltage were 200 mA and 45 kV, respectively. The sample powder was filled in a sample holder with a thickness of 1 mm and was sealed with a polyethylene film. The holder was placed vertically in the instrument, and the sample was exposed to X-rays. The water content of the sample was less than 15% to obtain data for the glass phase at room temperature. 33
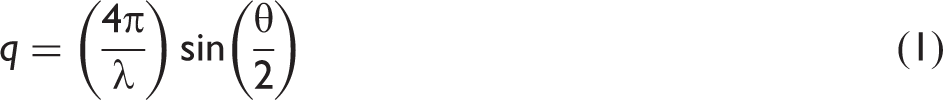
The magnitude of the scattering wave vector q (nm−1) is defined as follows
True Density
Rice flour samples were vacuum-dried for 15 h, and the true density of the samples was measured through a dry measurement based on a fixed volume expansion method (AccuPyc II 1340, Micromeritics Instrument, Co.). The samples were the same as those used for SAXS measurements.
Water Activity and Moisture Contents
To evaluate the water-induced transition of rice flour, the samples were subjected to a water sorption process. Each sample was kept in nine desiccators at 25 ℃, including lithium chloride (LiCl), potassium acetate (CH3COOK), magnesium chloride (MgCl2), lithium nitrate (LiNO3), sodium bromide (NaBr), strontium chloride (SrCl2), potassium iodide (KI), barium chloride (BaCl2), or potassium dichromate (K2Cr2O7), respectively, to produce the samples within the 0.11–0.98 aw range. The samples were settled in desiccators to reach the water sorption equilibrium. The actual water activity (aw) of each sample was measured using a water activity meter (LabMaster–aw, Novasina). Desiccators were prepared to control the relative humidity. The aw of each sample in the desiccator was also dried at 105 C for 72 h, and the moisture content of each sample was calculated using a dry solid basis.
Spectral Measurement
The samples were moved to an FT/IR6300 spectrometer (Jasco. Co., Tokyo, Japan) immediately after removal from the desiccator. Attenuated total reflection (ATR)-IR spectra of the samples within the 4000–100 cm−1 region were measured using an ATR unit (ATR-ProOne; Jasco Co., Japan) equipped with a diamond prism under room temperature conditions. The ATR-IR spectra were obtained using single-reflection mode. The spectra were recorded with a spectral resolution of 4 cm−1, and 256 scans were conducted for each spectrum. The spectra obtained were transferred to analytical software (Spectral Manager, Jasco Co.) and subjected to ATR correction. To identify the specific bands and correct the baseline drift, the spectra obtained were subjected to a second derivative procedure including Savitzky–Golay smoothing (second-order and 11 points).
Results and Discussion
Proposed Quantitative Estimation Method for the Order Structure of Starch in Rice Flour with Glass States
Figures 1a and 1b show the SAXS patterns in 0.04–2.85 nm−1 of q range of rice flour samples with a moisture content below 15% subjected to dry and wet milling, and α-formed samples. The intensity of SAXS within the entire range changed exponentially, and no specific peak was observed for any of the samples. However, in Fig. 1a, a weak band in the 0.5–0.9 nm−1 range of the scattering vector, q, can be seen. The band did not appear in the SAXS pattern of the α-formed sample (Fig. 1b). The correcting band within the 0.5–0.9 nm−1 range was observed more clearly for the starch itself.
16
As is well known, the scattering band corresponds to a lamellar repeat distance or Bragg spacing in starch granules.
16
Several research groups have suggested that the band reflects the total average thickness of the crystalline and amorphous regions in the lamellar structure.16,17 In fact, Cameron and Donald
15
revealed that the band corresponds to a 9–10 nm lamellar repeat (2π/q). Furthermore, Yuryev et al.
37
suggested that the intensity of this band depends on the amount of ordered semi-crystalline structures and/or on the differences in electron density between crystalline and amorphous lamellae on the amorphous background. Although the band does not appear in the pattern of the α-formed sample, it is extremely likely that the intensity of this band indicates the ordered structure of starch in rice flour.
Small angle X-ray scattering (SAXS) patterns in the 0.04–2.85 nm−1 of q and for (a) samples of DM1-3 and WM1-3 subjected to dry and wet milling and (b) α formed rice flour. Note that DM1-3 and WM1-3 were prepared by jet mill with different rotation numbers. In the case of WM, the rice materials were soaked during 5 h prior to milling.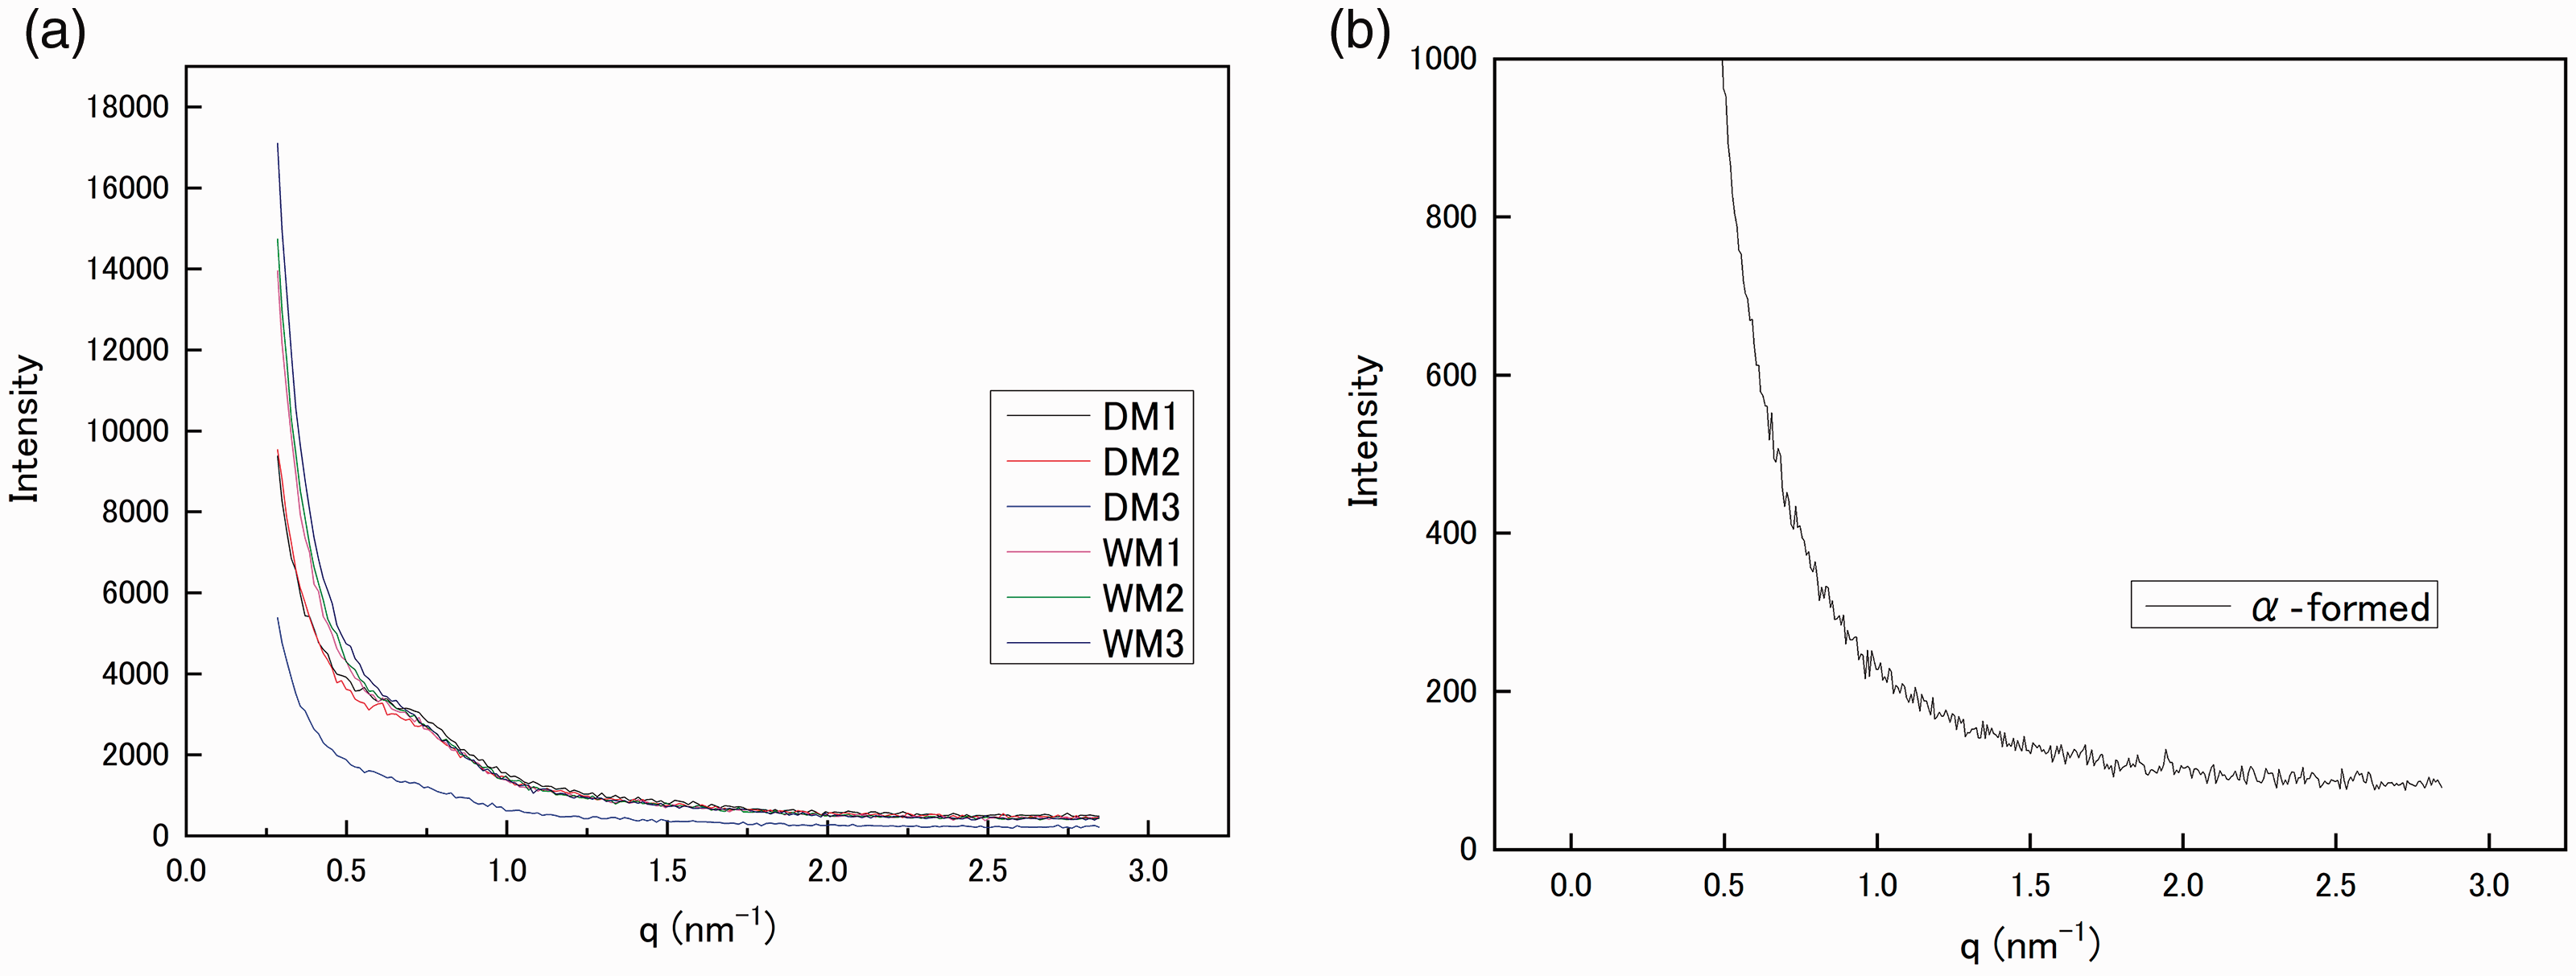
Thus, an estimation method for the ordered structure of the lamellar level in starch using the intensity of the 0.5–0.9 nm−1 band of q based on SAXS is empirically proposed in the present study. Normally, within a wide-angle region, the crystalline part is extracted by subtracting the amorphous part from the crystalline sample. In this study, the scattering pattern of the α-formed sample was described well by the double exponential equation as follows

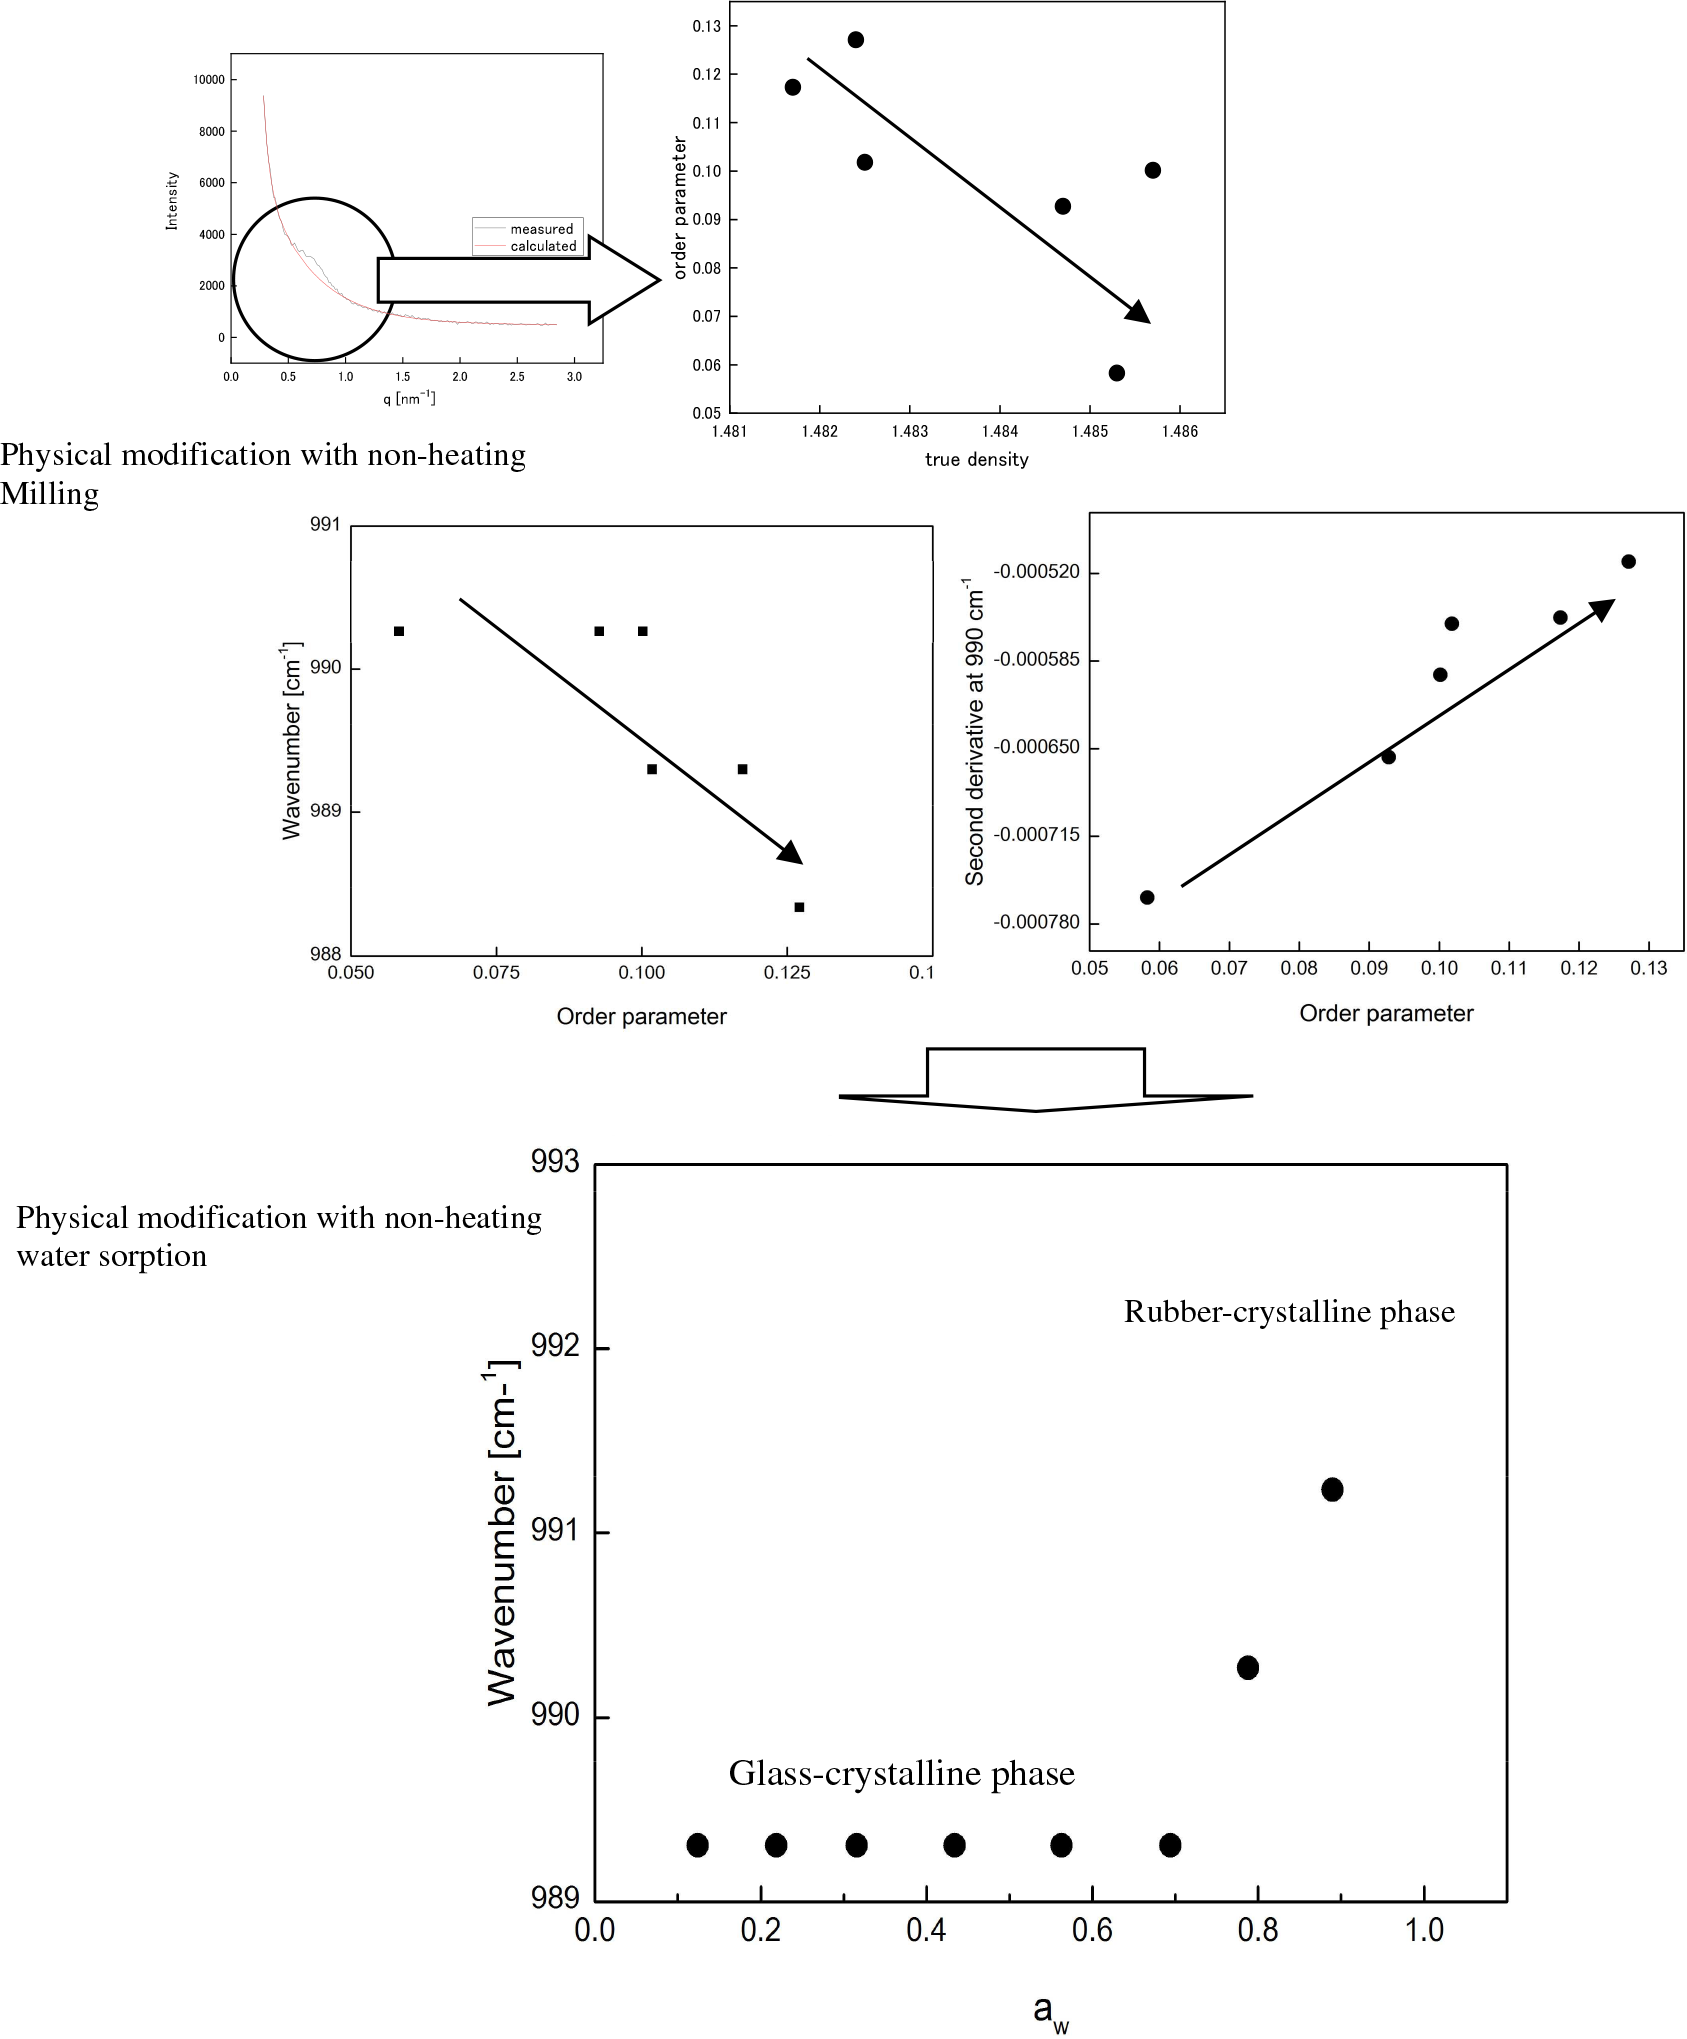
The parameters A, B, k1, and k2 are determined for each rice flour and the baseline is simulated within 0.4–2 nm−1 of the scattering vector, q. Note that the range of 0.5–0.9 nm−1 is excluded from the input value. The simulated and measured SAXS patterns are compared in Fig. S1 (Supplemental Material). The band corresponding to the ordered structure of starch in rice flour was identified in the 0.4–2 nm−1 range of q, and the integrated intensity of this band is defined as the order parameter for the rice flour in this study. The relationship between the true density and order parameter of starch in rice flour calculated using SAXS is shown in Fig. 2. A negative correlation between the order parameter and true density was observed. As described above, the order parameter reflects the lamellar level of 9–10 nm.
15
Semi-crystalline samples are formed, where the lamellar repeat consists of crystalline and amorphous parts. The crystalline lamellar part has linear chains where more than 10 glucose units re-associate to form helical structures, and the branching points consist of amorphous lamellar.
38
Moreover, the semi-crystalline structure in the lamellar structure of starch is most likely described as a chiral side-chain liquid crystalline polymer.
39
In the model, the structure of starch in rice flour is expected that the amylopectin chain in granules is organized using a flexible backbone, flexible spacer, and rigid mesogens made of aligned double helices.
39
Because there is a negative correlation between the true density and the order parameter when subjected to milling, the structure of starch in rice flour is slightly disordered and the true density may be increased. Thus, it is extremely likely that the ordered structure of starch in rice flour forms steric bulk in lamellar level. Interestingly, the bandwidth of the SAXS pattern of rice flour shown in Fig. 1 was wider than that reported by Cameron and Donald.
15
Namely, it may be suggested that the ordered structure of starch in rice flour distributed inhomogenously compared with that of pure starch.
Relationships between true density and order parameter of starch in rice flour calculated by SAXS.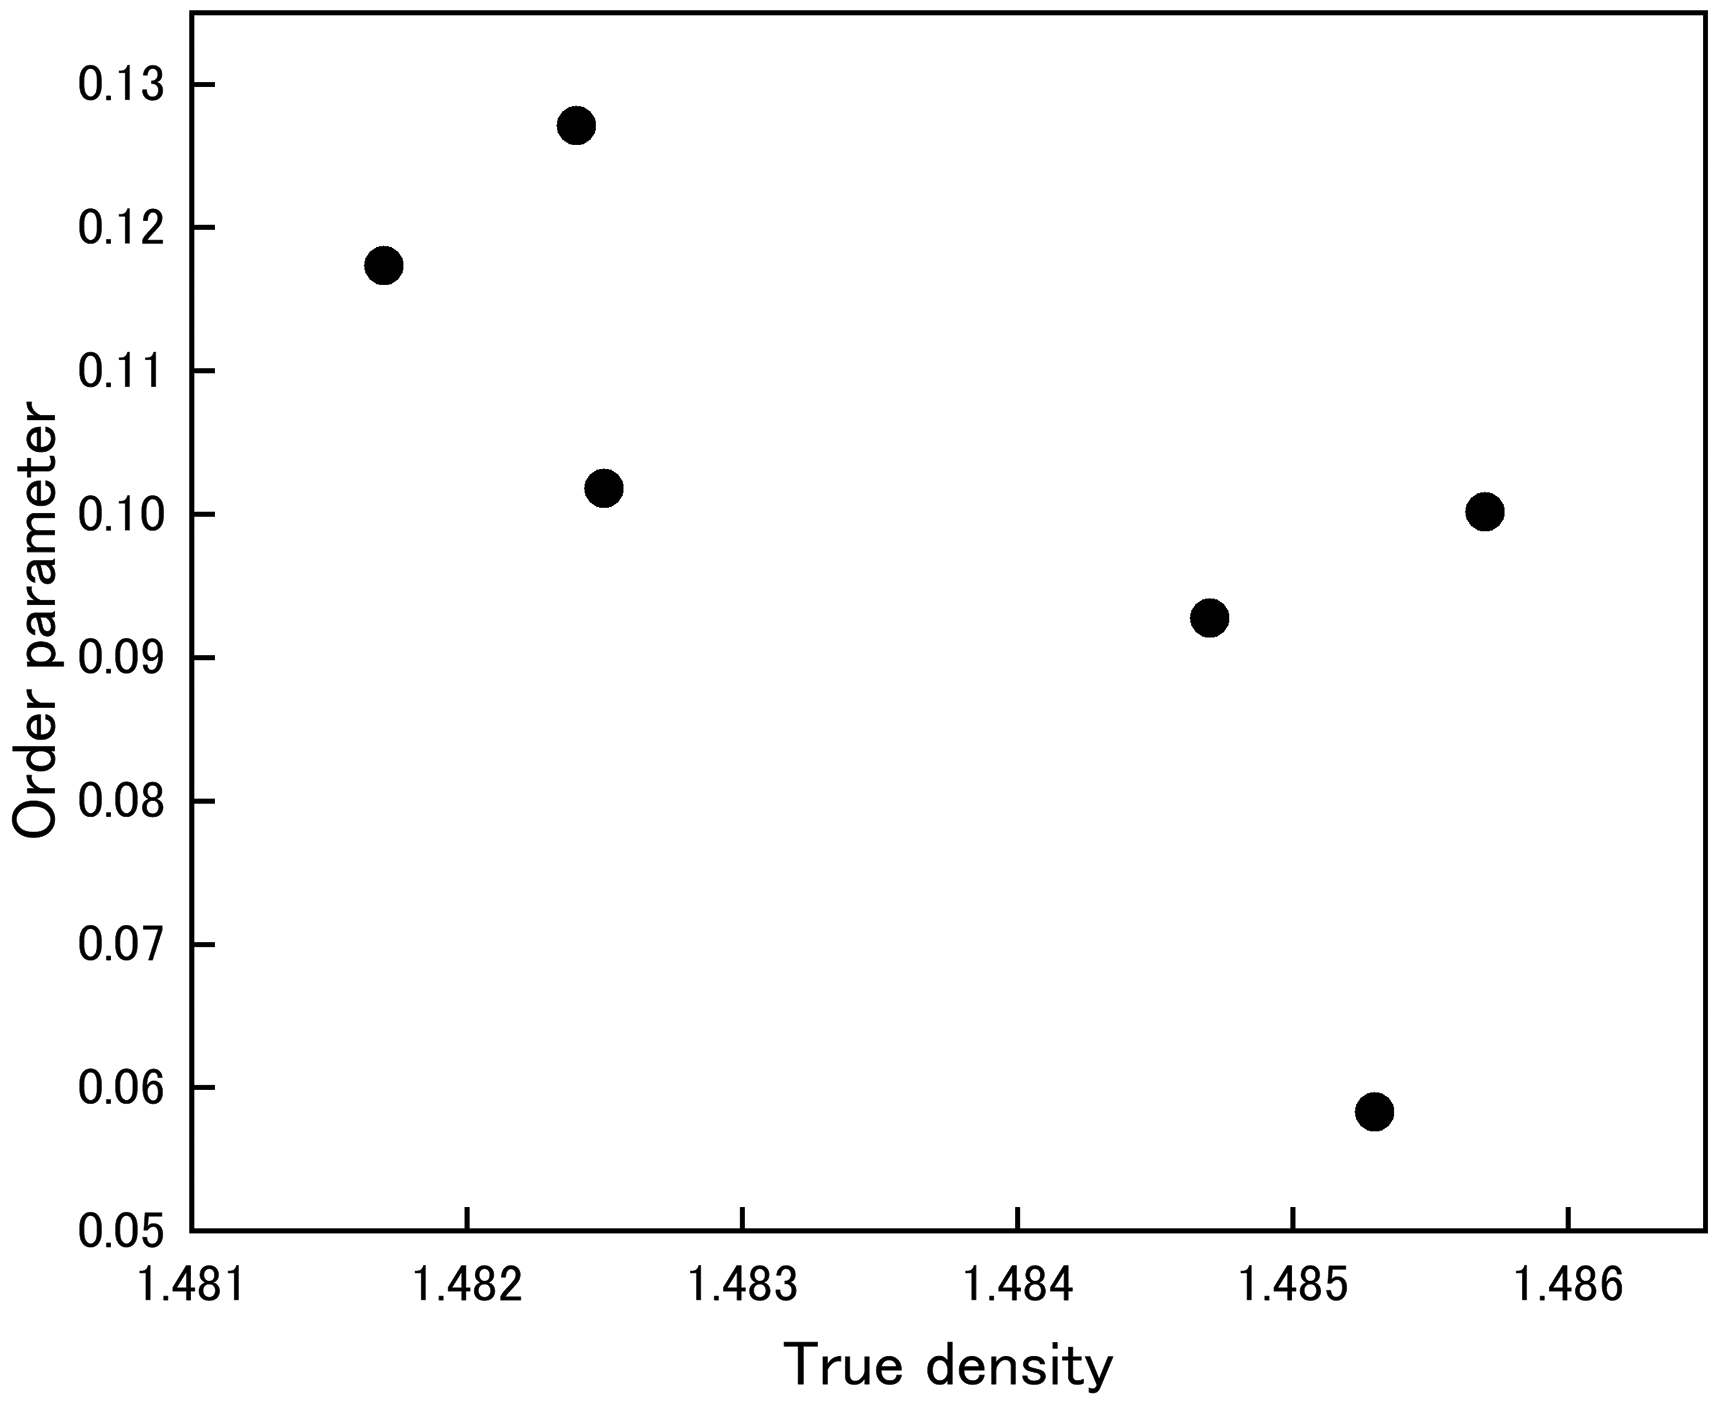
ATR-IR Spectra in the 4000–900 cm−1 Region of Rice Flour with Glass State
The ATR-IR spectra in the 4000–900 cm−1 region of rice flour in a glass state with moisture content below 15% are shown in Fig. 3.
ATR-IR spectra (a) and its second derivative spectra (b) in the 4000–900 cm−1 region of rice flours.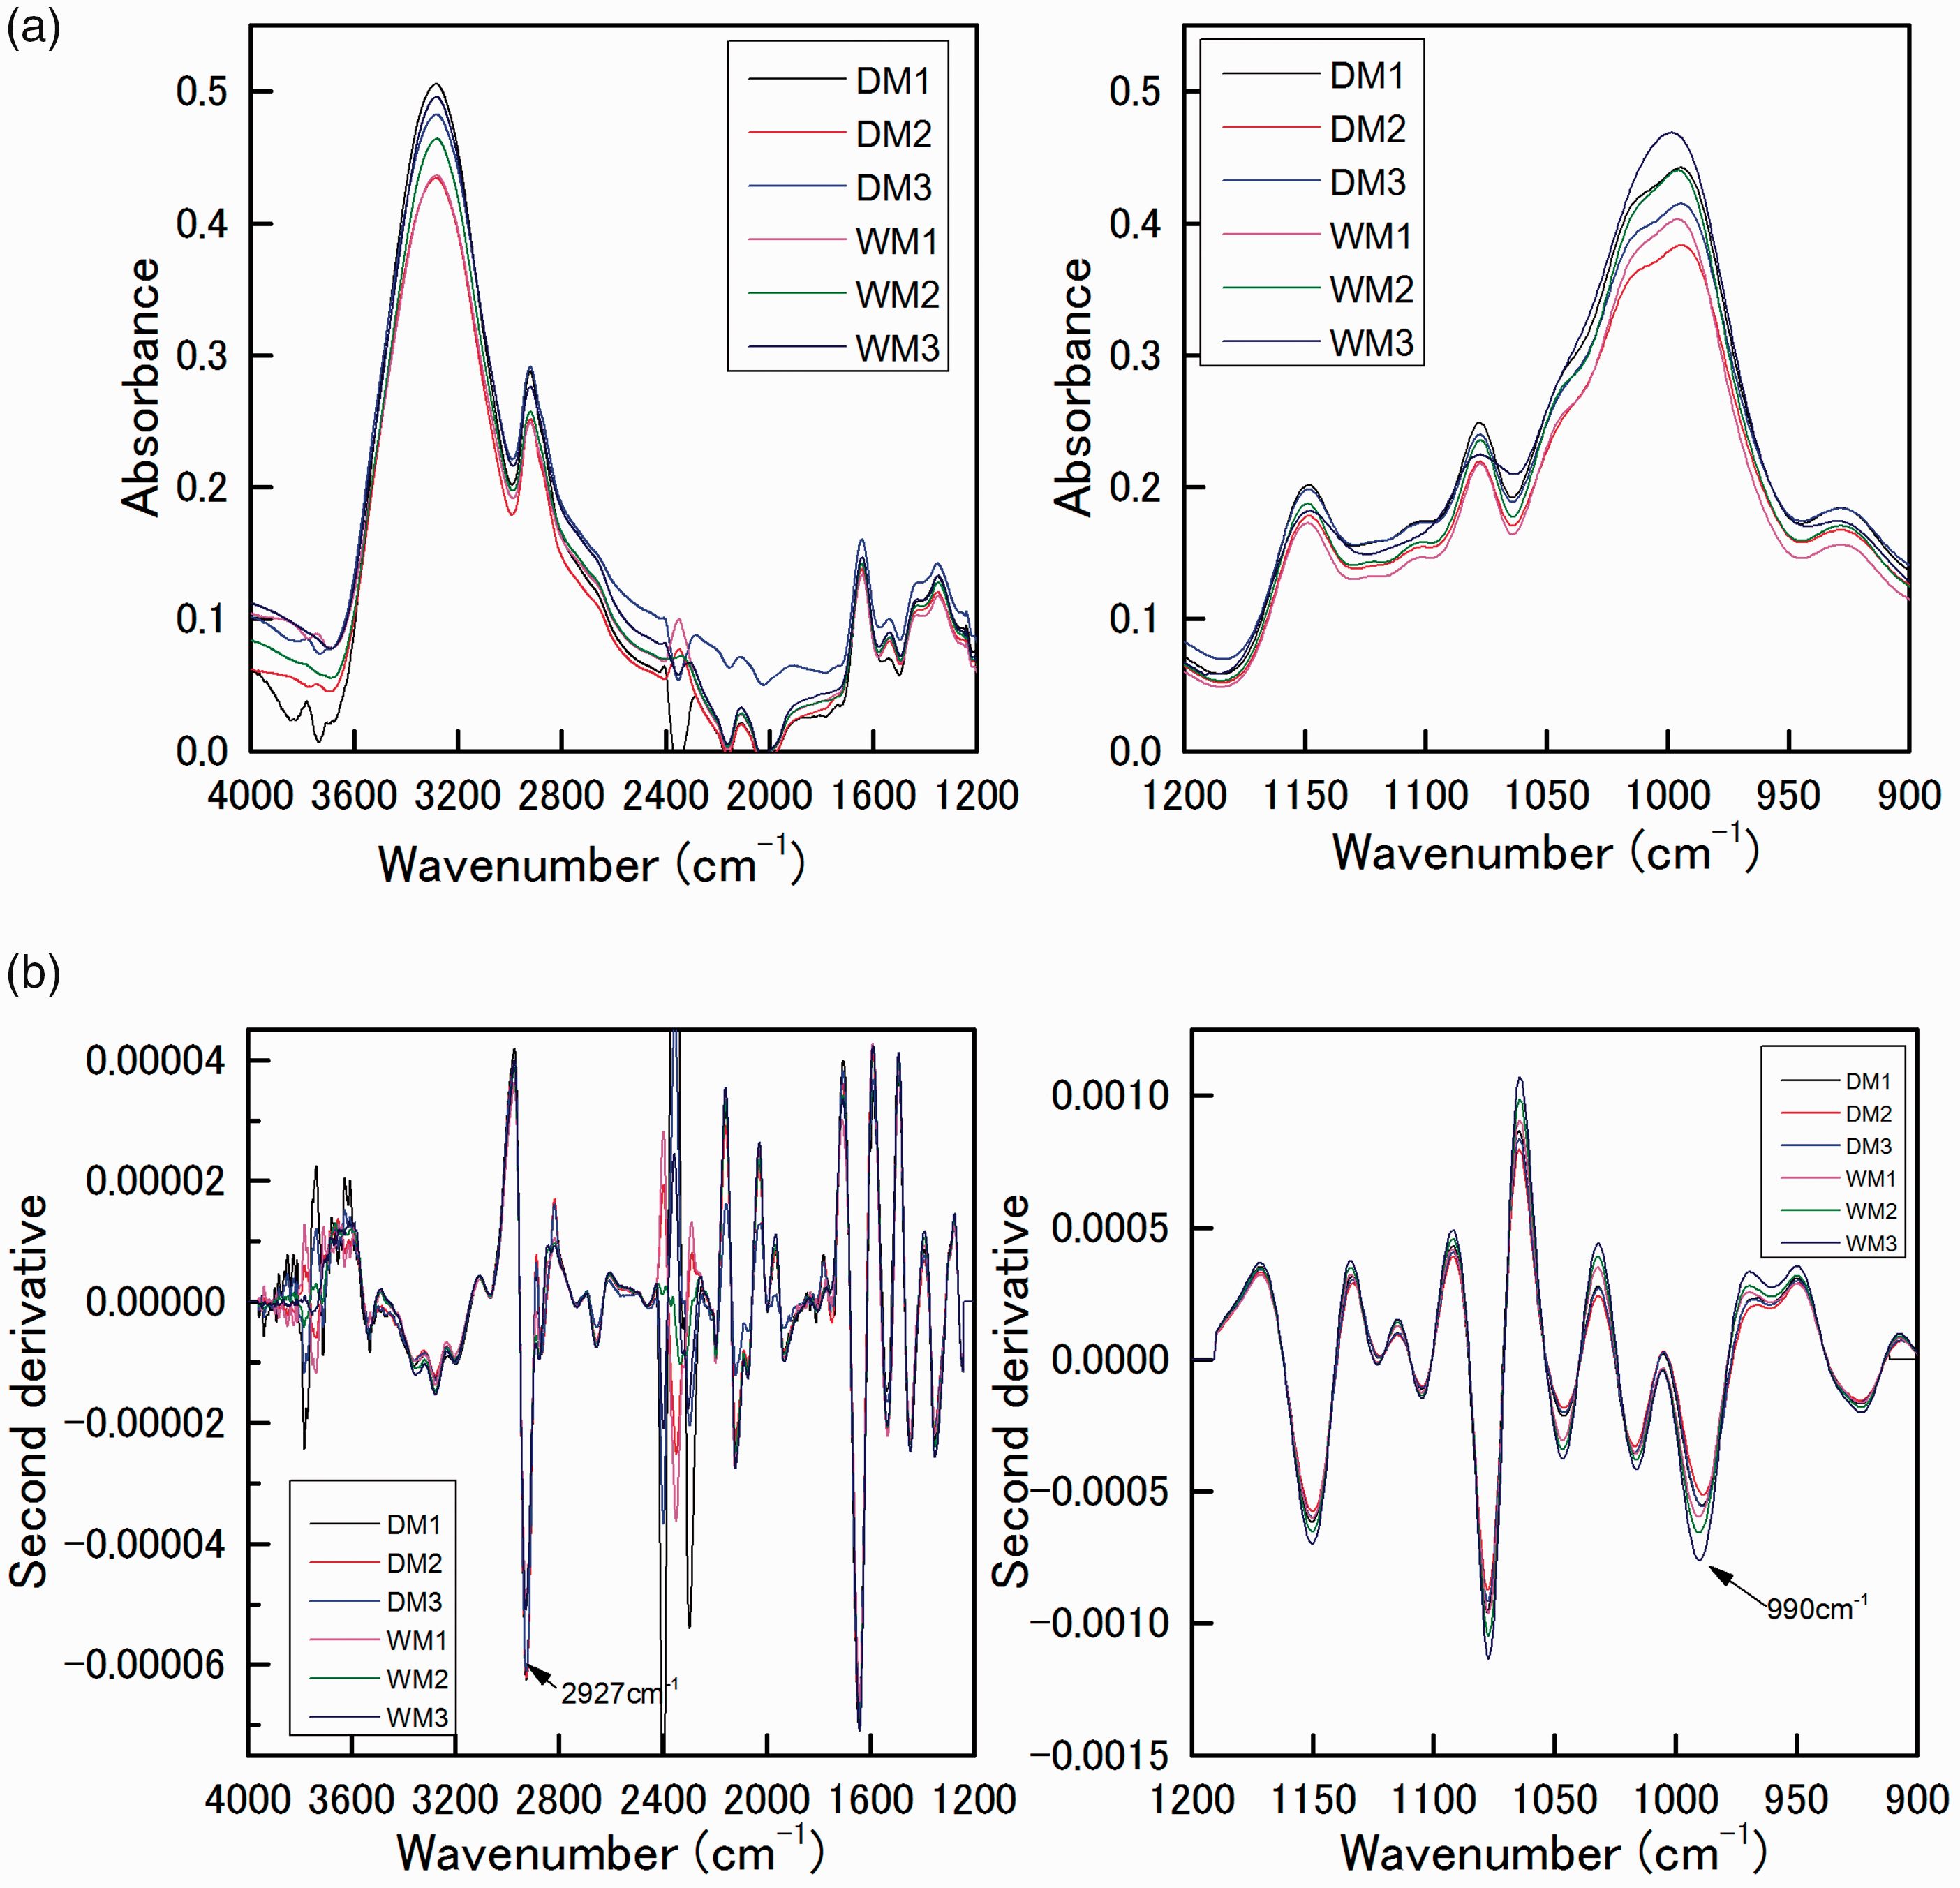
The broad band within the 3600–3100 cm−1 region is due to the OH stretching vibration mode of water containing starch.23,25 The band centered at 2927 cm−1 is assigned to the CH stretching modes, mainly of starch, proteins, and lipids.25–27 Within the 1900–1200 cm−1 region, the bands appear at approximately 1640, 1530, 1470, and 1370 cm−1. The band at 1640 cm−1 contains contributions from the HOH bending vibration mode of water and the amide I mode of proteins.24,39 The 1200–900 cm−1 region, the bands at 1150, 1124, and 1103 cm−1 are mainly due to the CC and CO stretching modes of starch, and the bands at 1046, 1016, and 990 cm−1 arise mainly from the COH bending of C6 of the D-glucopyranosyl residue. 27 The band at 930 cm−1 was assigned to the skeletal mode vibrations of the α1→4 skeletal glycoside bond of the starch. 21
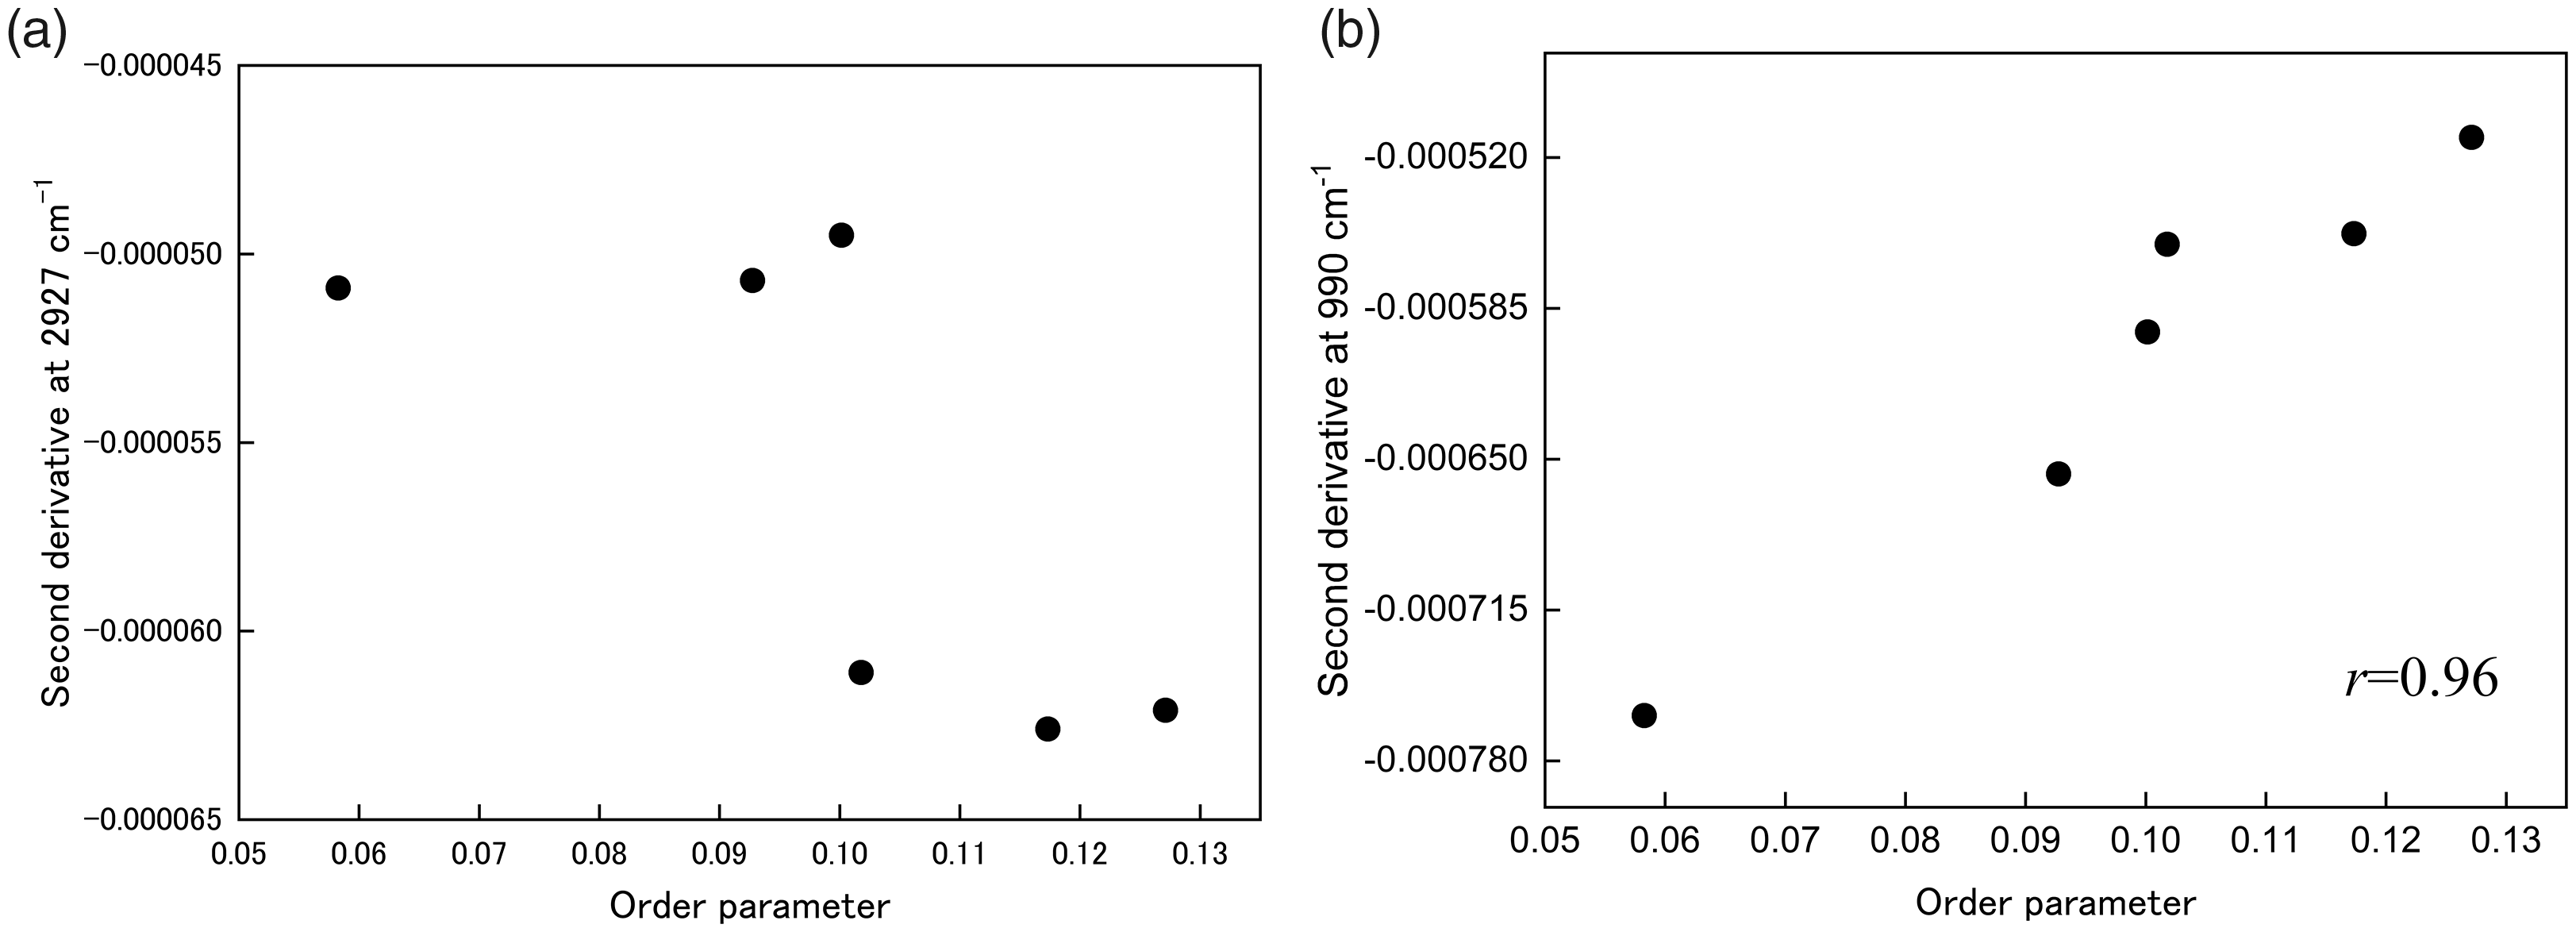
To identify the specific bands for the quantification of changes in the solid state of starch in rice flour, changes in the band positions and intensities were investigated. It was found that the bands at 2927 and 990 cm−1 changed during the milling process. Because the band positions and intensities at 2927 and 990 cm−1 changed among the samples in the 4000–900 cm−1 region, the correlation between the band position and the order parameter was investigated, as shown in Fig. 4. The band positions at 2927 and 990 cm−1 shifted to a lower wavenumber with an increase in the order parameter. Whereas the change in intensity of the band at 2927 cm−1 did not change according to the order parameter, as shown in Fig. 5a, the intensity of the band at 990 cm−1 has a strongly negative correlation with the order parameter (r = 0.96, Fig. 5b). The band at 2927 cm−1 was identified in our previous study;
31
however, its position did not change after milling. Thus, the band may have changed as a result of the interaction between the C O group of lipids and water on the starch surface. It was not confirmed whether the intensity change of the 2927 cm−1 band (Fig. 5a reflected the order parameter of the solid state of starch.)
The change in the peak position of identified band at (a) 2927 and (b) 990 cm−1 in the 4000–900 cm−1 region corresponding to order parameter calculated from SAXS. Second derivative intensity of the identified band at (a) 2927 and (b) 990 cm−1 corresponding to order parameter calculated from SAXS.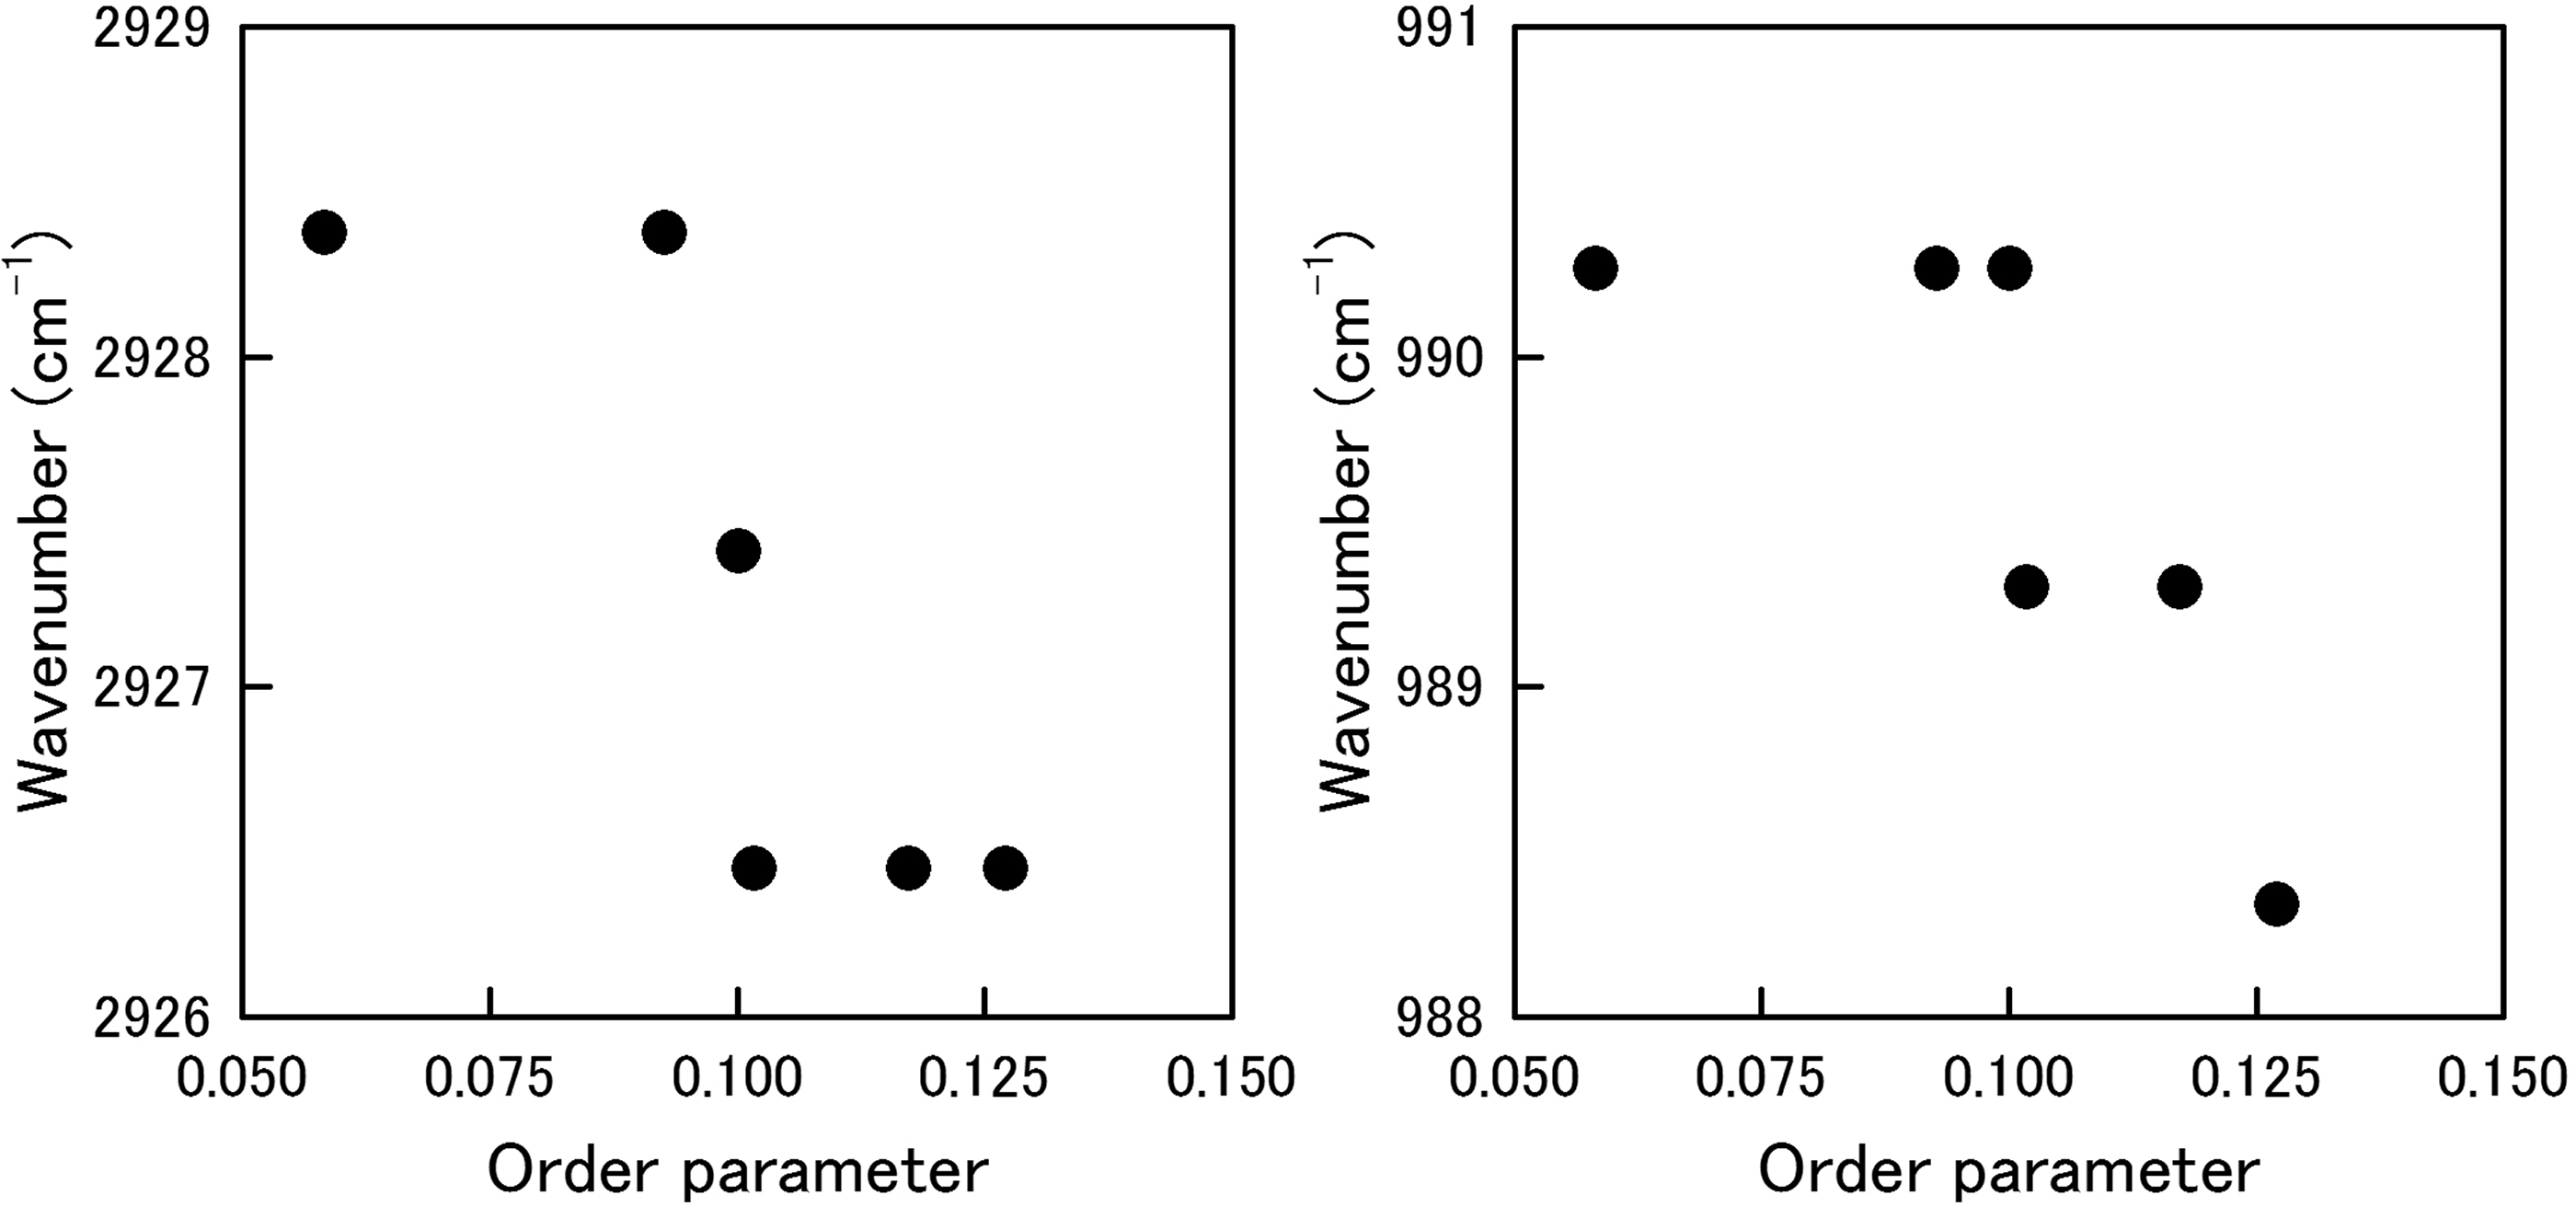
The band at 990 cm−1 is sensitive to water–starch interactions owing to hydrogen bonding because of the COH bending mode of the hydroxyl group of C6 in the starch.23,27,32 It is likely that an increase in the ordered structure enhances the intermolecular interactions in the starch.
A number of previous reports have suggested the effectiveness of the intensity ratio of the two bands at 1046 and 1022 cm−1 as an index for the contents of the ordered structure of the starch itself because these bands are sensitive to the amount of ordered or crystalline starch and amorphous starch, respectively.27,30 In the rice flour applied in the present study, a correlation between the ratio of the second derivative intensities at 1046 and 1022 cm−1 and the order parameter of the starch was confirmed (data not shown). In this study, it was found that the correlation of the 990 cm−1 band with the order parameter was similar to that reported in van Soest et al. 27 Because a negative correlation was found between the order parameter and the true density, as shown in Fig. 2, it is considered that the decrease in the intensity of the spectra is due to the gradual decrease in the electron density. Thus, it is likely that the ordered structure gradually collapsed by milling. Consequently, the band at 990 cm−1 was identified as the specific band to quantify the order structure of starch in rice flour in the 4000–900 cm−1 region.
ATR-IR Spectra in the 900–100 cm−1 Region of Rice Flour with Glass State
Figures 6a and 6b show the ATR-IR spectra and their second derivatives in the 900–100 cm−1 region.
ATR-IR spectra (a) and its second derivative spectra (b) in the 900–100 cm−1 region of rice flours.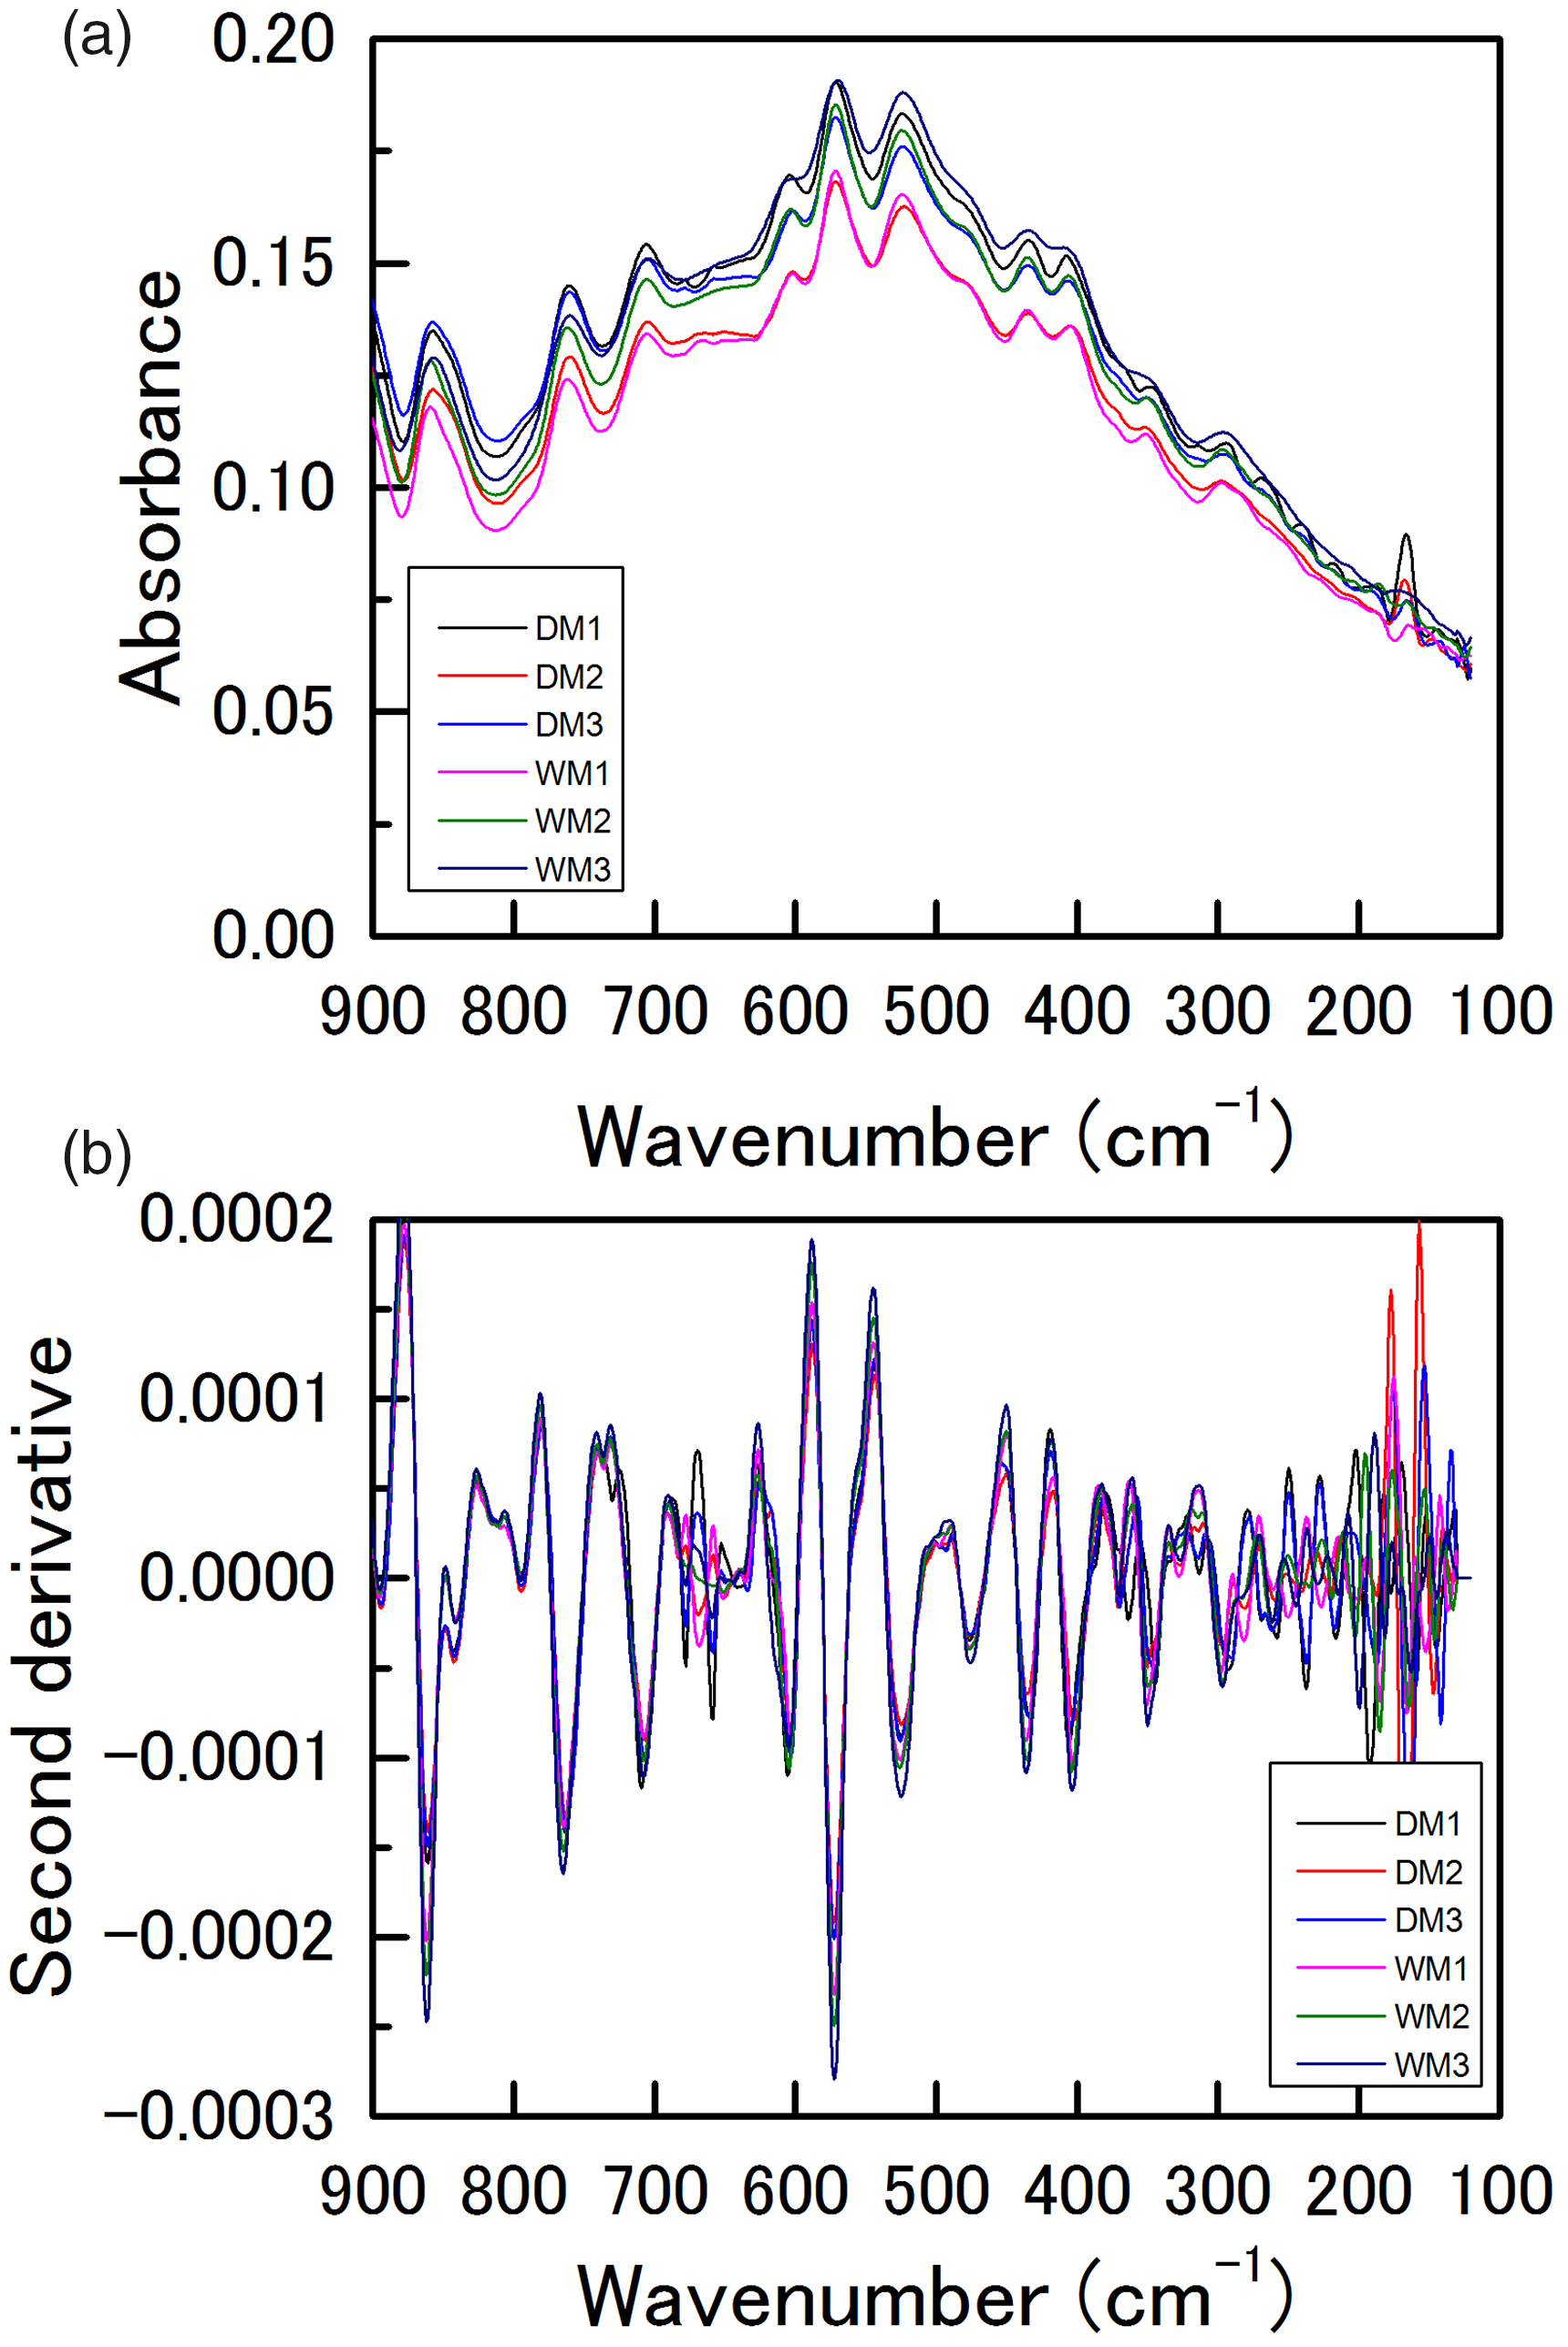
The band at 861 cm−1 may be due to the coupling of the COC stretching of glycoside bond and CH2 deformation of glucose.
27
A band at 763 cm−1 was assigned to the CC stretching,
28
and bands at 572, 526, and 436 cm−1 arose from the skeletal modes of the pyranose ring in the glucose unit of starch.21,29 A negative correlation was also found between the intensities of the bands at 861, 572, 476, and 436 cm−1 and the order parameter (correlation coefficient r ≧ 0.7); an example of the correlation of the second derivative intensity at 436 cm−1 and the order parameter is shown in Fig. 7. Because these bands mainly reflect the vibration of the glucose unit in starch, the result provides more direct evidence than the other regions in which the ordered structure of starch forms steric bulk. Thus, these bands have a potential to estimate the order structure with lamellar level.
Second derivative intensity of the identified band at around 436 cm−1 corresponding to order parameter calculated from SAXS pattern.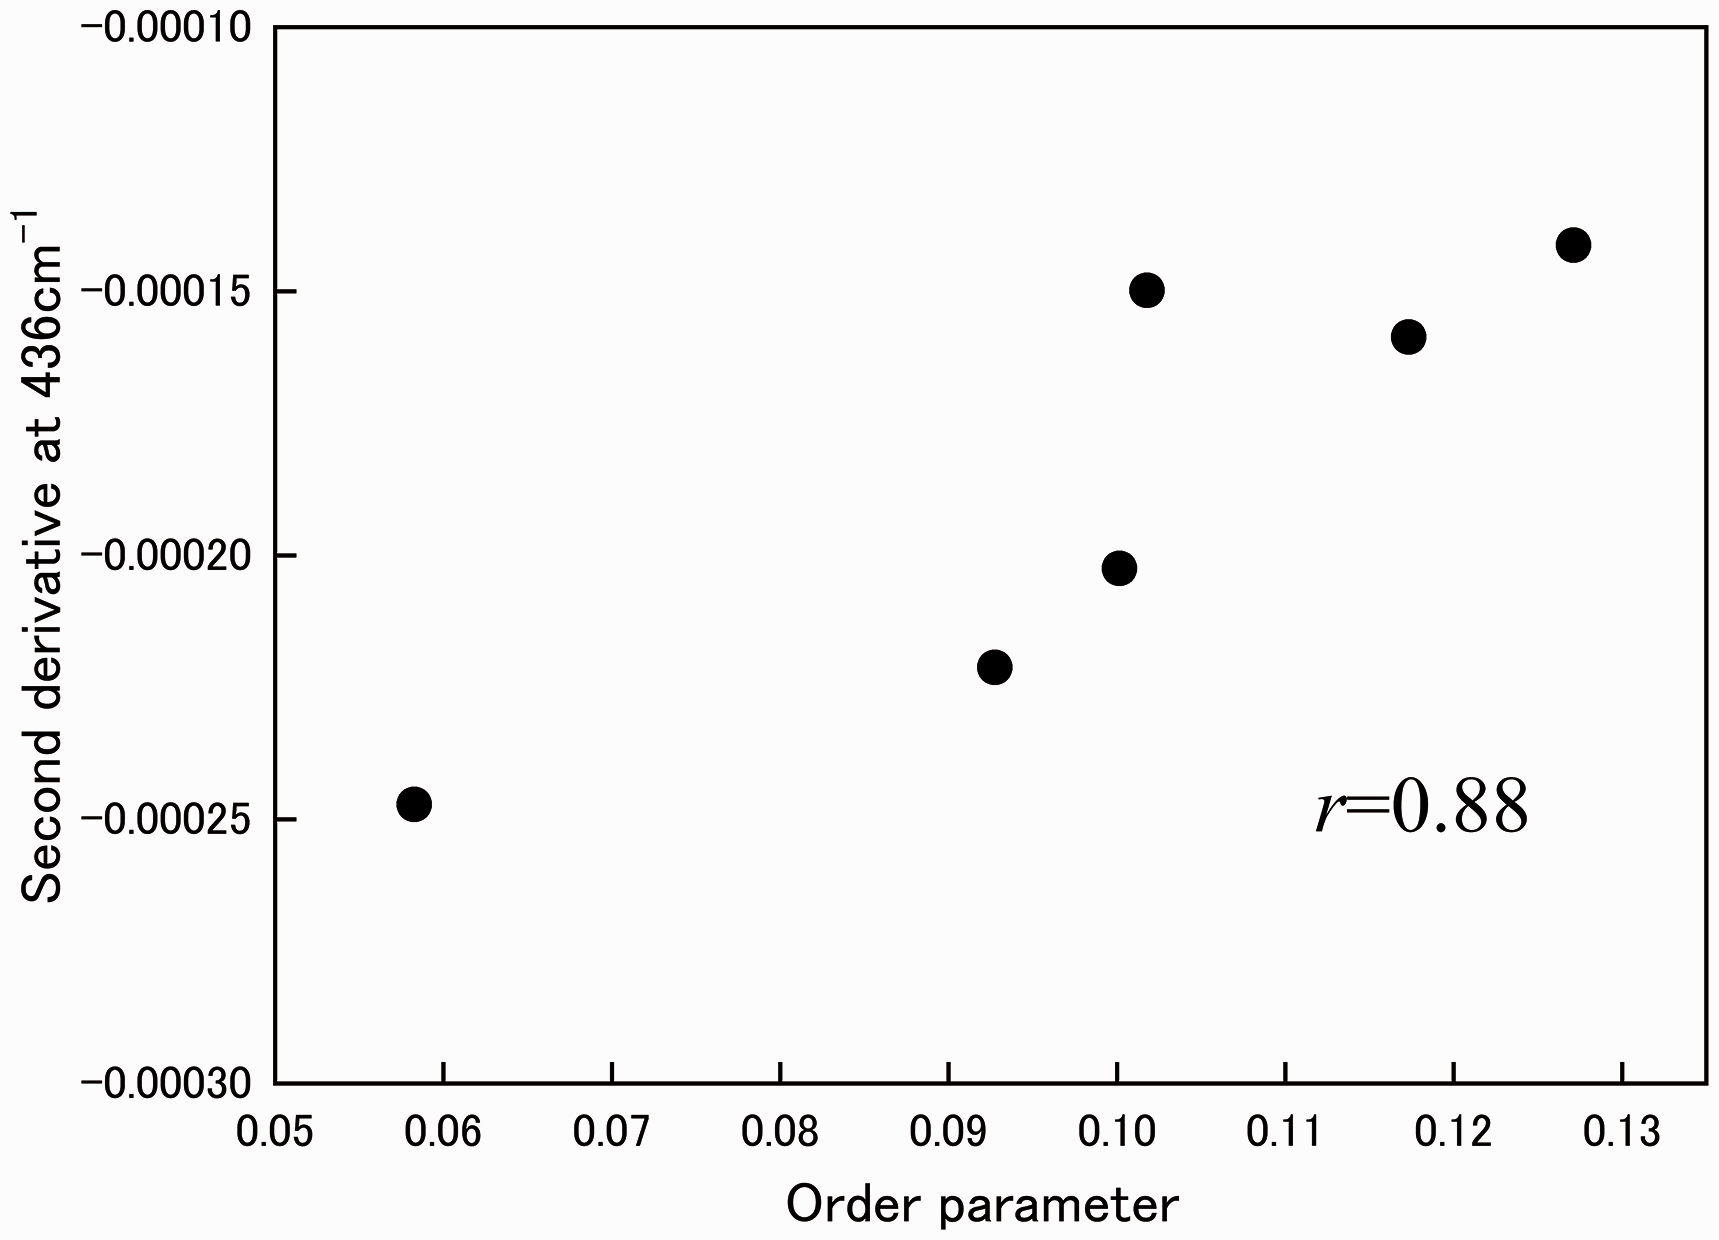
Identification of Water-Induced Transition of Glass to Rubber Through FT-IR Spectra
The water sorption isotherms of each rice flour are shown in Fig. S2 (Supplemental Material). Water content showed a gradual variation within 0.1–0.7 of the aw range, and a rapid increase was observed at above a high aw. Thus, the behavior of the water sorption isotherm showed a nonlinear change within the entire region. As reported in our previous study, 31 the results seemed appropriate for evaluating the relationship between water and the water activity of rice flour using a nonlinear adsorption model. The water sorption isotherm in the present study was described well by the Guggenheim Anderson de Bour (GAB) model, as shown in the Supplemental Material 2.
Because the band at 990 cm−1 is sensitive to a water–starch interaction,
27
it should be useful to identify the glass-to-rubber transition of starch induced by the water content. Figures 8a and 8b show the wavenumber shift of the 990 cm−1 band in the second derivative spectra of DM1 and WM2 during the sorption process, respectively.
Change in the peak position at around 990 cm−1 of (a) DM1 and (b) WM2 corresponding to aw.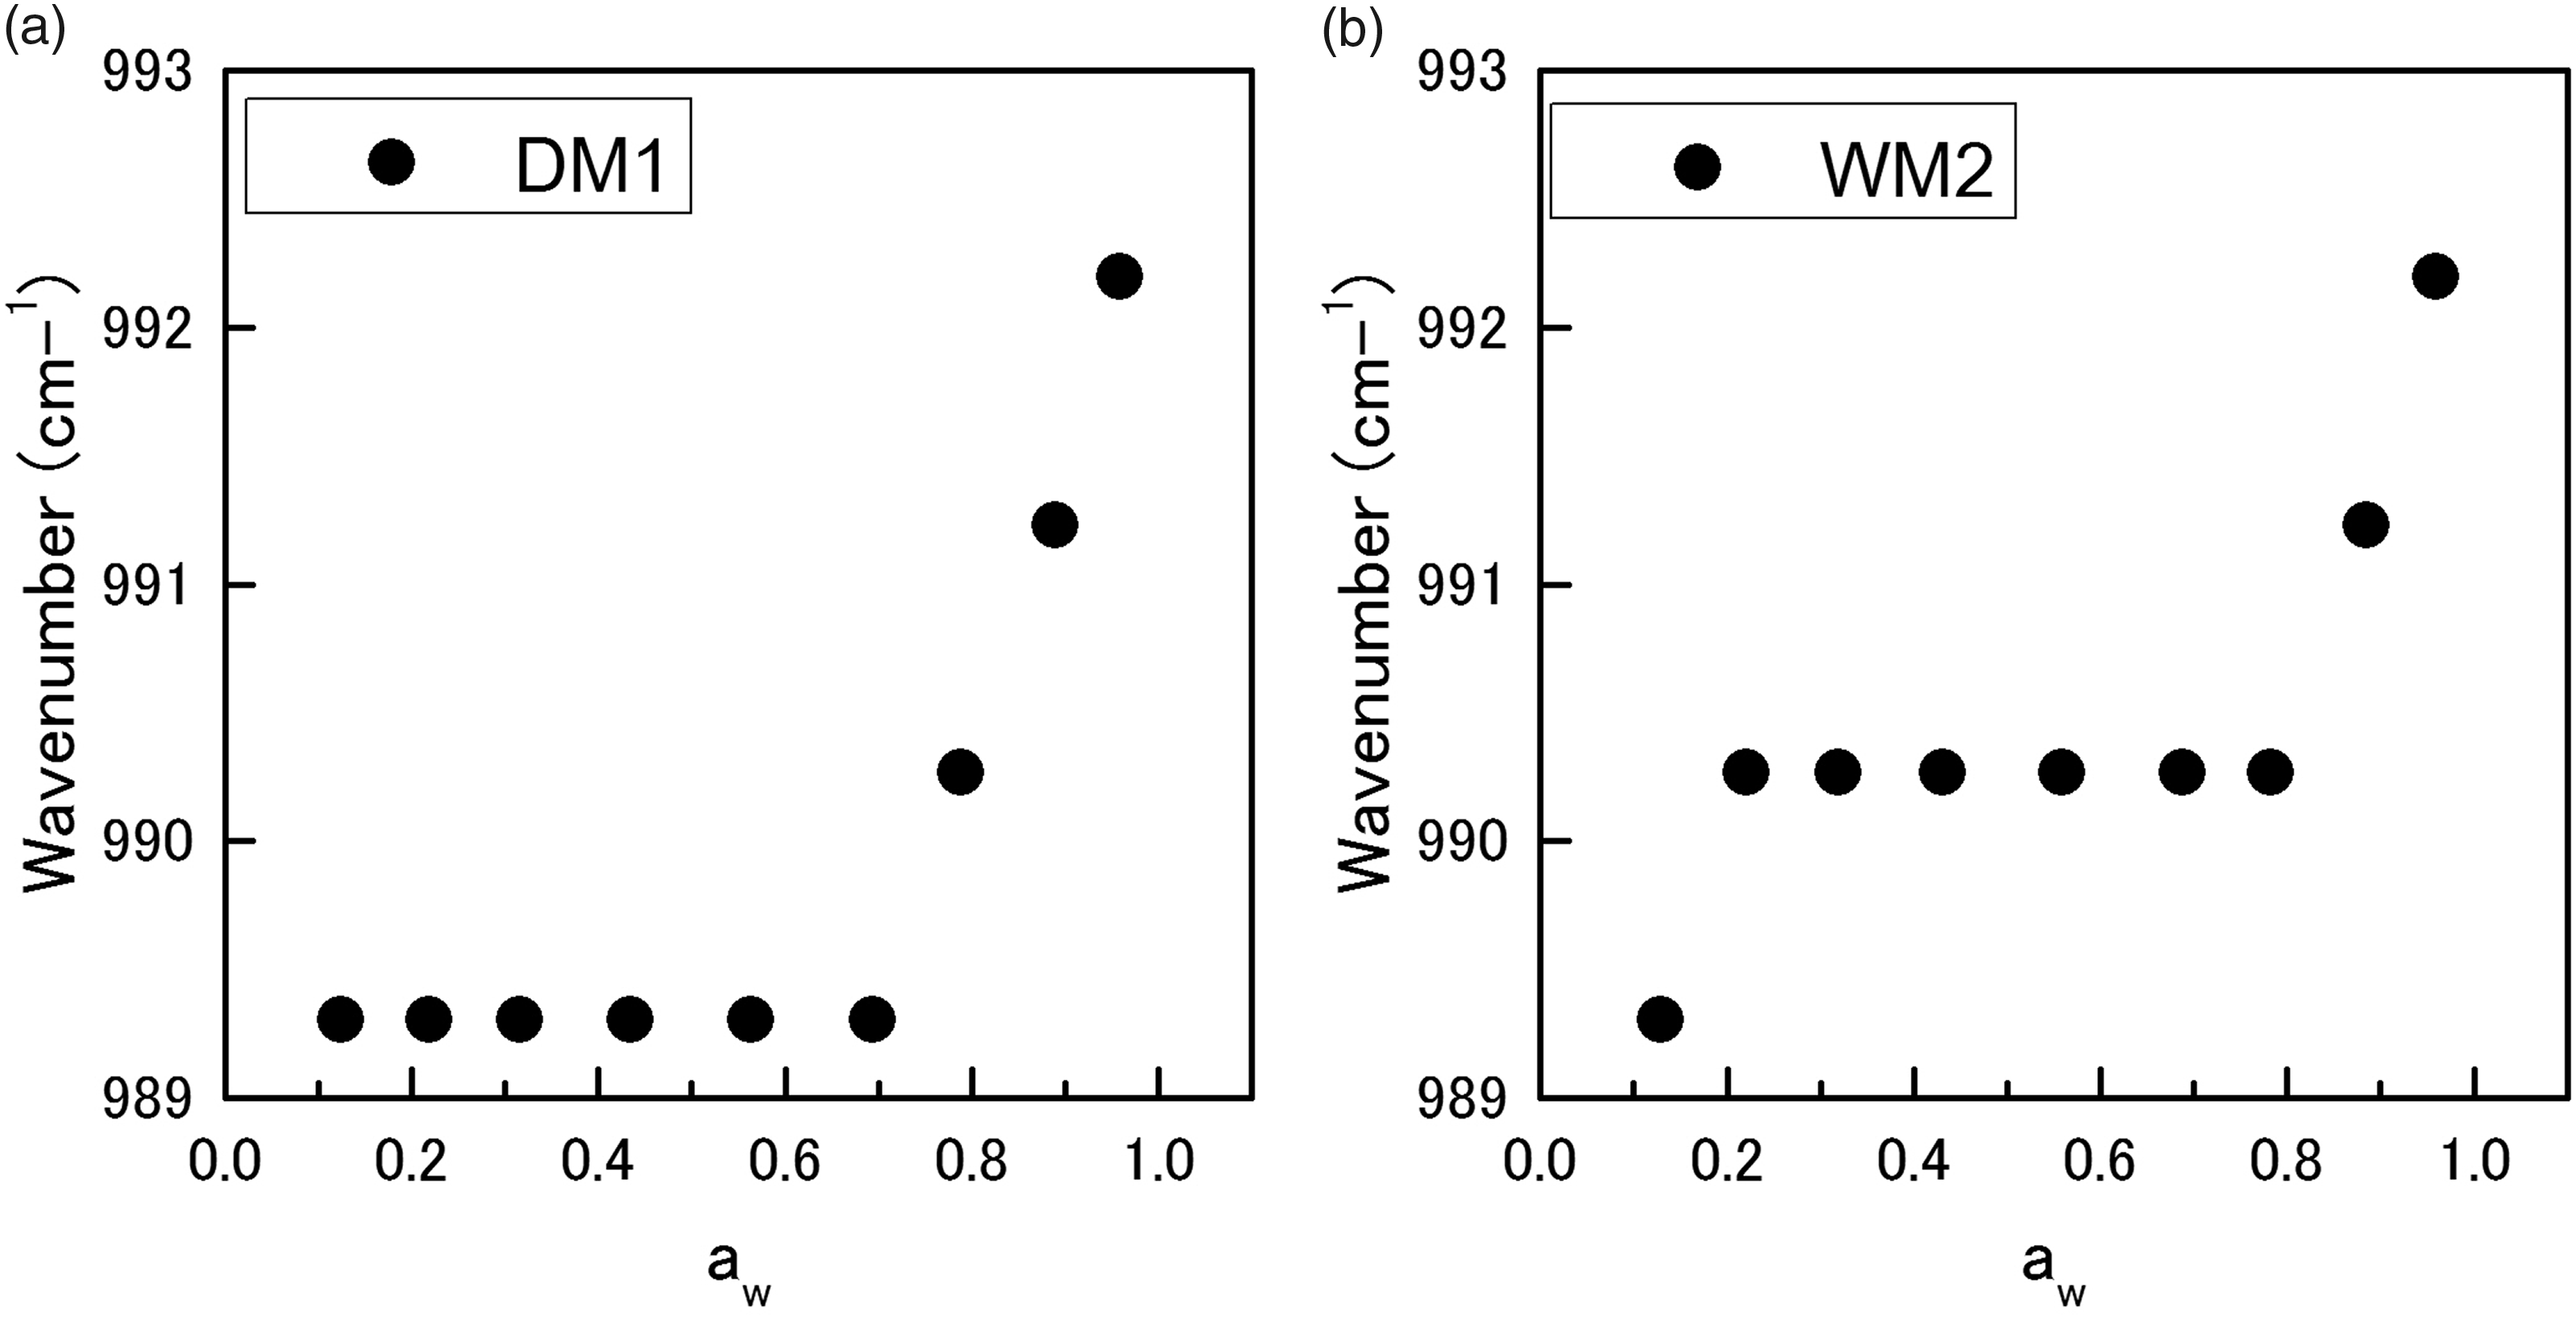
The band position at approximately 990 cm−1 was constant in the 0.1–0.7 aw range, and then gradually shifted to a higher wavenumber at above aw = 0.7. According to the increase of water in starch, a molecular motion is initiated, enabling molecule segments to side one over another. 33 It is clearly confirmed by the band shift at approximately 990 cm−1 that the glass–rubber transition was induced by water in the range of aw ≧ 0.7 in the case of dry-milled samples (Fig. 8a). Interestingly, the shift of this band for wet-milled samples was initiated from aw ≥ 0.8 (Fig. 8b). Thus, wet-milled samples exposed to hydration during processing are very likely to exhibit a delayed phase transition.
It can be seen that the baseline within the 900–100 cm−1 region gradually increased with an increase in the water content, as shown in Fig. S3 (Supplemental Material). The change in the baseline is due to the increase in the libration of water molecules with a maximum intensity at approximately 670 cm−1.
35
Because the baseline change was gradual according to the water content, it was confirmed that the band is sensitive to quantifying the water content in the case of a powder sample. The band positions of the identified bands were 861, 572, 476, and 436 cm−1 during the sorption process, as shown in Fig. 9. It should be noted that the band at 861 cm−1 was shifted to a higher wavenumber. By contrast, the bands at 572 and 436 cm−1 showed a slightly low wavenumber shift.
Change in the peak position at (a) 861, (b) 572, and (c) 436 cm−1 of DM1 and WM2 in the 900–100 cm−1 region corresponding to aw.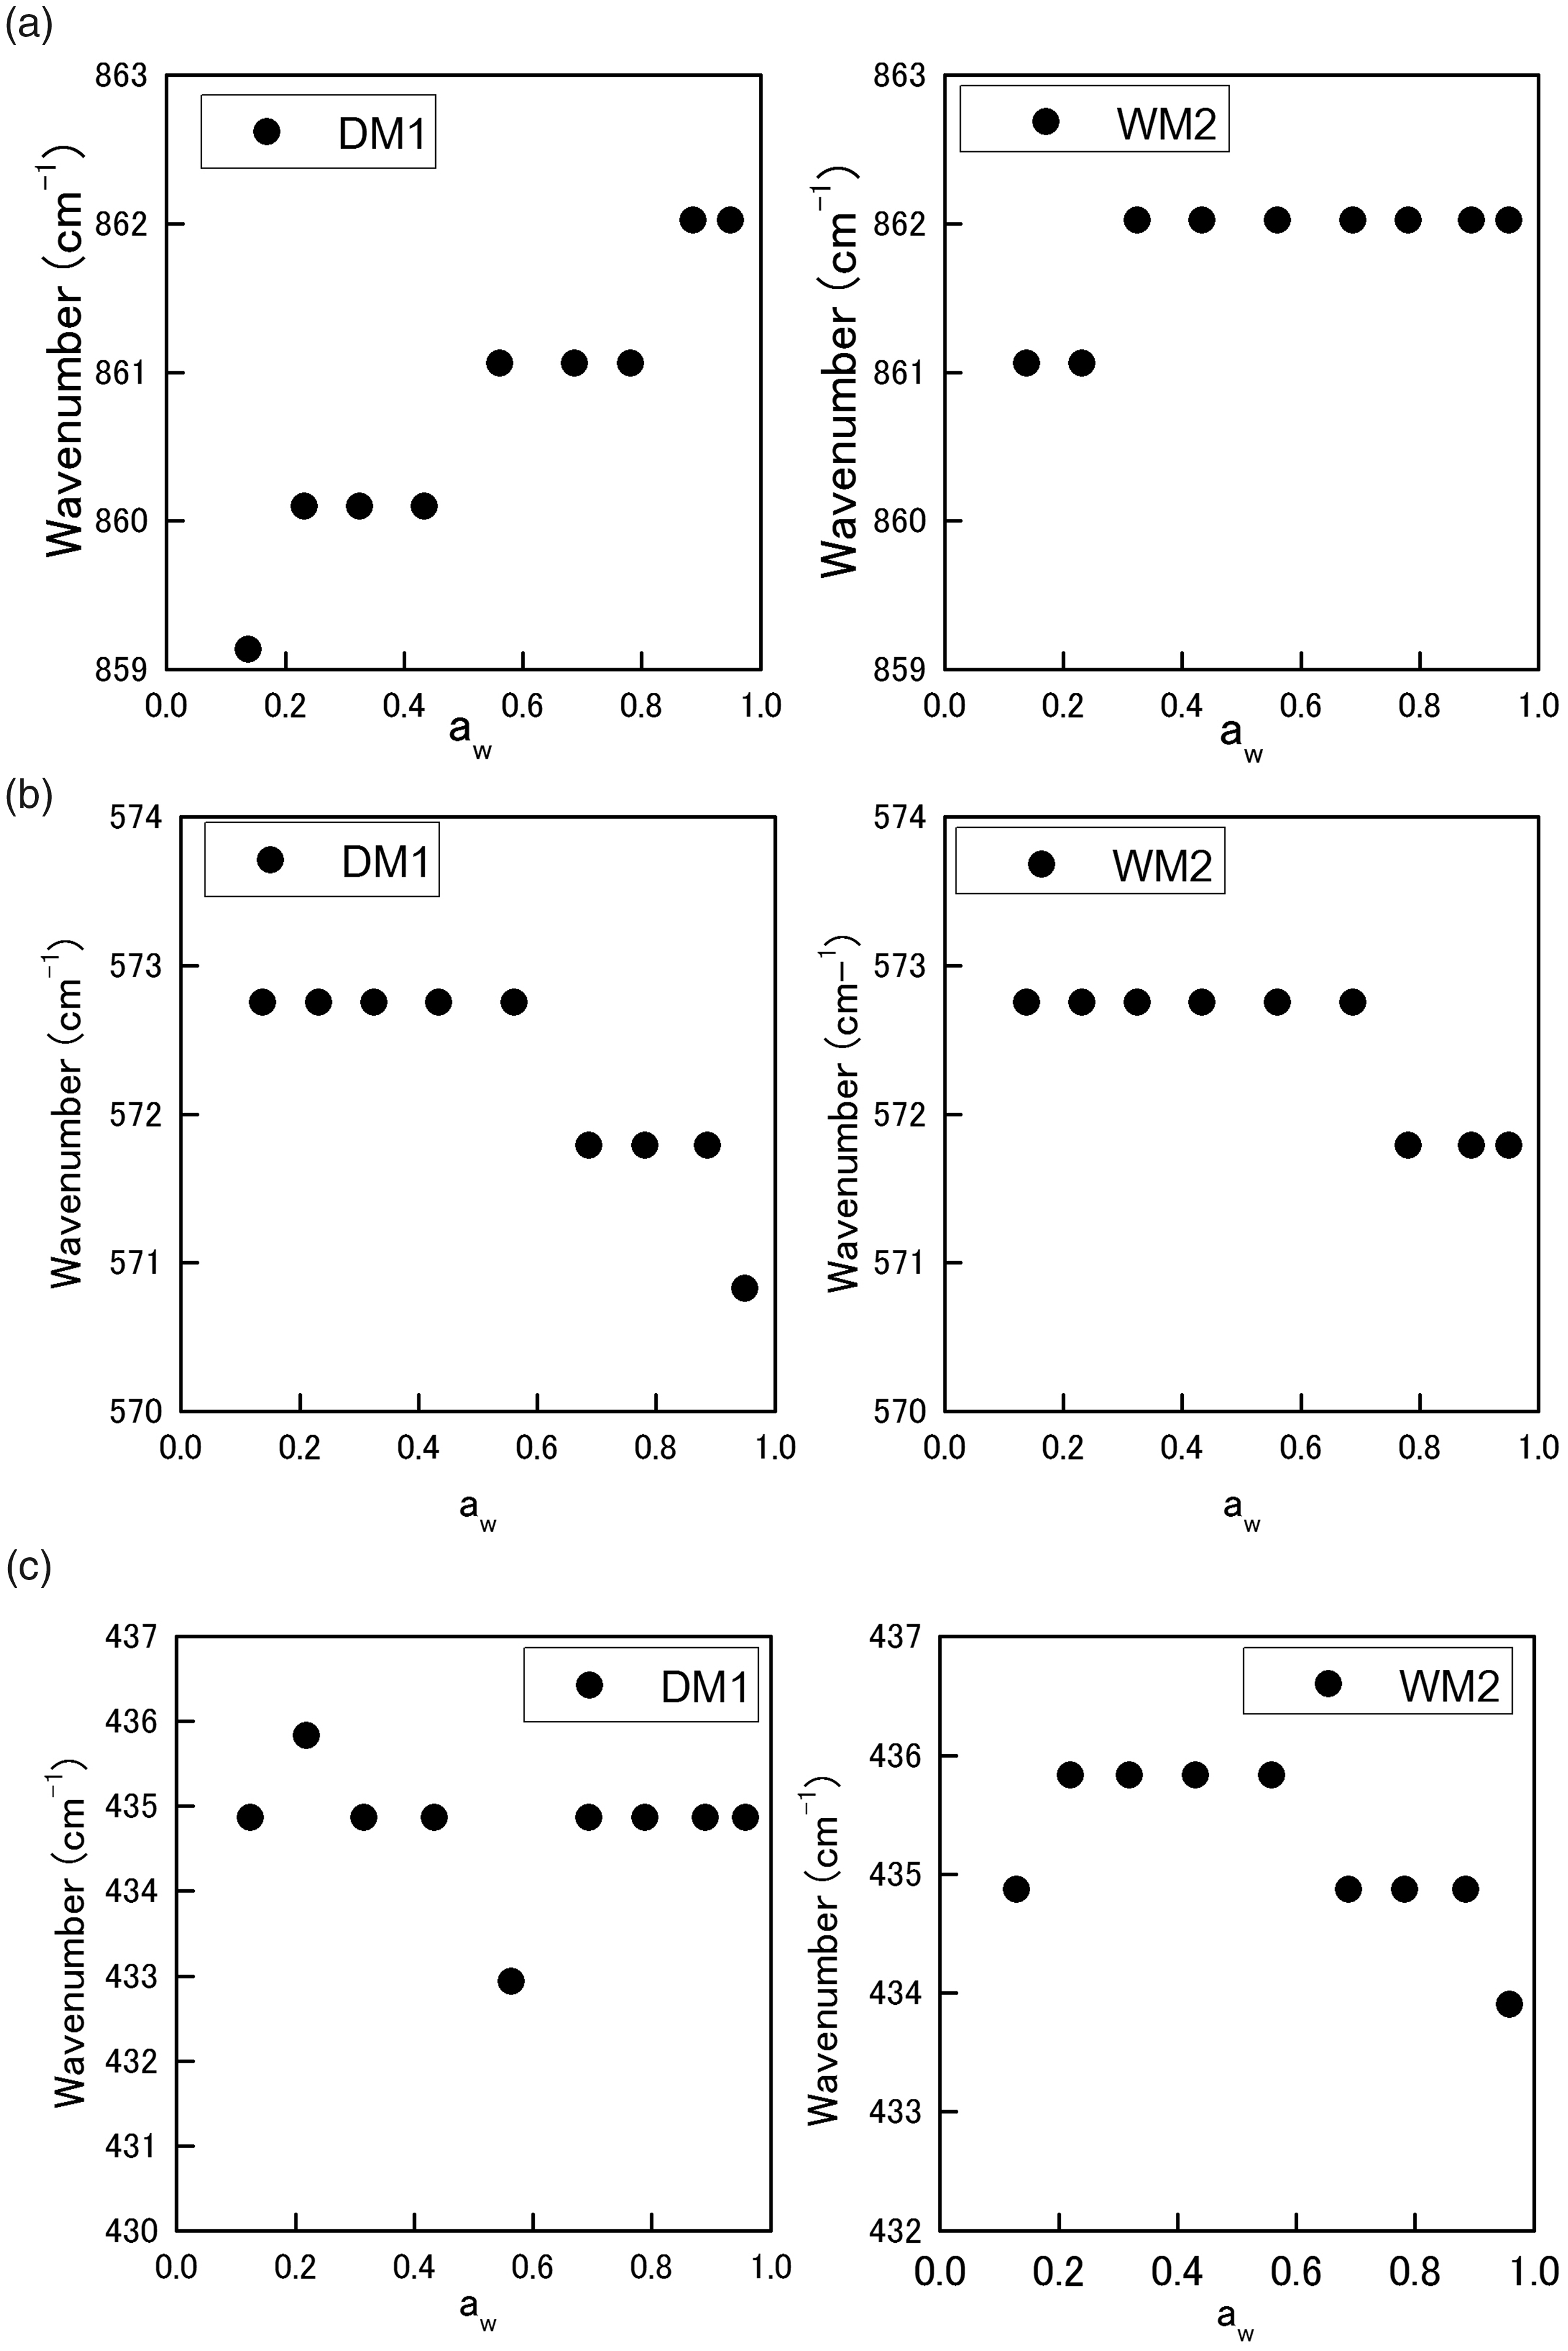
The structure of starch forms a mesophase from a glassy state driving to a nematic structure to a hydrated lamellar smectic structure, which induces a mobility of the flexible backbone and spacers.15,32 When increasing the water in starch, molecular motion is initiated, enabling molecule segments to side one over another. 33 It was clarified that this phase transition occurred gradually when the water activity was 0.7 or higher by the band shift at 990 cm−1. Tako et al. 40 reported that the intramolecular hydrogen bonding between the CH2OH of C6 and –OH and O plays a key role in stabilizing the structure. The penetration of water molecules in starch induced a relaxation of the COH of C6 in glucose because of the hydrogen bonds between water molecules. Consequently, the bonds of COH in glucose were relaxed, and the bands at 990 cm−1 shifted to higher wavenumber. For band position at 861 cm−1, it suggested that the increase in hydrogen bonds according to water sorption may have affect in relaxation of not only CH2 of glucose unit but also the glycoside bond between glucose molecules. Thus, the band at 861 cm−1 also indicated the relaxation of the local structure by water sorption into the solid. The changes in the bands at 572, 476, and 436 cm−1 were insignificant during the sorption process. Because these bands reflect the pyranose ring of starch, it is considered that the water sorption did not significantly affect the crystalline structure. By contrast, the effect of physical modification owing to water sorption to starch in rice flour may occur at the surface of the starch particle and does not affect the structure including crystallinity. Consequently, glass- and rubber-like crystalline phases were formed in the starch of rice flour during the water sorption process. Thus, the results demonstrate that the GAB model can explain the different solid states of starch based on a single prediction curve.
Conclusion
The ordered structure of starch is a constraint factor for application in diverse fields for starchy foods such as rice flour. Understanding the internal structure of rice flour and the quantification of such structure is important for creating useful materials. The aim of the present study was to develop a new methodology to quantify the internal structure of rice flour through a comprehensive analysis of SAXS and FT-IR spectroscopy.
The SAXS pattern in the q = 0.06–3.0 nm−1 range was obtained, and a specific band reflecting the lamellar structure of starch occurred, except for α-formed rice flour. The order parameter calculated using the SAXS pattern was negatively correlated with the true density. Thus, the change in the value of the order parameter suggested that structural modification may have occurred at the lamellar structure (including amorphous /crystalline) level. Moreover, since order parameter was negatively correlated with true density, it is extremely likely that the ordered structure at lamellar level did not distributed densely.
The ATR-FT-IR spectra in the 4000–100 cm−1 region were obtained from rice flour with low water content. The bands at 2927 and 990 cm−1 owing to CH stretching and the COH bending mode of C6 in the starch of rice flour, respectively, changed among the samples. The band positions of these bands shifted to lower wavenumbers with an increasing order parameter, although the band intensity at 2930 cm−1 was not clearly correlated with the order parameter.
The band at 861 cm−1 owing to COC symmetrical stretching of glycoside bond and CH2 deformation of glucose, and those at 572, 476, and 436 cm−1 owing to the vibration of the pyranose ring of starch were observed within the 900–100 cm−1 region. A negative correlation was observed between the intensity of these bands and the order parameter. Thus, bands at 990, 861, 572, 476, and 436 cm−1 were identified to estimate the order structure of the lamellar scale of starch.
The band at 990 cm−1 shifted to a higher wavenumber above aw = 0.7. The behavior of the bands at 990 cm−1 indicated the glass–rubber transition of starch owing to water sorption. It was thought that the band shift at 990 cm−1 reflects the change caused by the water molecule during the intramolecular interaction of COH and O in glucose. However, the change in the band at 861 cm−1 also shifted to a higher wavenumber, and the positions of the other bands did not change significantly during the water sorption process. According to increase of hydrogen bonding not only CH2 in glucose unit, but also the glycosidic bond was slightly affected, resulting in an 861 cm−1 shift. The band behavior at 572, 476, and 436 cm−1 indicated that the crystal structure of starch was maintained during the sorption process. Consequently, it is likely that the internal structure of the starch was not significantly affected by water sorption. The results demonstrate that the starch in rice flour formed a glass-like crystalline phase with low water activity and a rubber-like crystalline phase with high water activity.
Supplemental Material
sj-pdf-1-asp-10.1177_00037028211028278 - Supplemental material for Quantification of Starch Order in Physically Modified Rice Flours Using Small-Angle X-ray Scattering (SAXS) and Fourier Transform Infrared (FT-IR) Spectroscopy
Supplemental material, sj-pdf-1-asp-10.1177_00037028211028278 for Quantification of Starch Order in Physically Modified Rice Flours Using Small-Angle X-ray Scattering (SAXS) and Fourier Transform Infrared (FT-IR) Spectroscopy by Daitaro Ishikawa, Jiamin Yang and Tomoyuki Fujii in Applied Spectroscopy
Footnotes
Authors’ contributions
Daitaro Ishikawa and Jiamin Yang conducted the experiment and analysis of the spectra and drafted the manuscript. Tomoyuki Fujii designed the study and suggested the experimental method. He also reviewed the final manuscript.
Declaration of Conflicting Interests
The author(s) declared no potential conflicts of interest with respect to the research, authorship, and/or publication of this article.
Funding
The author(s) disclosed receipt of the following financial support for the research, authorship, and/or publication of this article: A part of this study was financially supported by the Iijima Memorial Foundation for the Promotion of Food Science and Technology (2019), and Tohoku Initiative for Fostering Global Researchers for Interdisciplinary Sciences, MEXT.
Supplemental material
All supplemental material mentioned in the text, consisting of figures, is available in the online version of the journal.
References
Supplementary Material
Please find the following supplemental material available below.
For Open Access articles published under a Creative Commons License, all supplemental material carries the same license as the article it is associated with.
For non-Open Access articles published, all supplemental material carries a non-exclusive license, and permission requests for re-use of supplemental material or any part of supplemental material shall be sent directly to the copyright owner as specified in the copyright notice associated with the article.