
Abstract
In this work, luminescence processes in polycrystalline NaLaF4:Tm3+ and NaLaF4:Tm3+,Yb3+ materials were studied. Luminescence spectra and decay kinetics measurements were performed for NaLaF4 doped with various Tm3+ concentrations (0.01, 0.1, 0.5, 1, and 2 mol%) under direct excitation to 3P0, 1D2, 1G4, and 3H4 states. It was found that some of the Tm3+ excited states are more affected by Tm3+ concentration than other states. Under infrared excitation of Yb3+, energy transfer to Tm3+ occurred and intensive ultraviolet and blue up-conversion luminescence was observed. Possible up-conversion mechanisms are discussed. Spectroscopic measurements show that long-duration excitation radiation reduces ultraviolet up-conversion luminescence intensity, and this intensity reduction is related to sample heating due to high excitation radiation density and a poor heat sink from samples. It was found that sample configuration for spectroscopic measurements is crucial to correctly describe measured up-conversion luminescence spectra.
Introduction
Blue and ultraviolet radiation sources are crucial in science and industry. Halogen lamps and LEDs are options to use as radiation sources to obtain radiation in these spectral regions. But in some cases in which the usual radiation sources cannot be used, other types of blue and ultraviolet radiation sources must be used, for example, luminescent micro- and nano-particles for small light sources that could be excited in various ways. 1
Due to the Stokes shift in luminescence processes excitation photon (in photoluminescence), energy must be equal to or greater than the emitted luminescence photon energy. Therefore, to excite blue (∼2.8 eV) and ultraviolet (>3.1 eV) luminescence, even higher excitation photon energy is required. Ultraviolet radiation with shorter wavelength (higher photon energy), X-ray, accelerated electrons, or radiation sources could serve as excitation sources. 1
To avoid the use of excitation radiation sources with higher photon energy, other approaches can be used to obtain blue and ultraviolet luminescence. Using the gradual absorbing energy of several excitation photons with lower energy, it is possible to emit one photon with higher energy afterwards. 2 Such a process is called up-conversion luminescence and is commonly observed in rare-earth-doped materials. 2
One of the rare-earth elements, Tm3+, has a unique energy state layout. As a result, intensive luminescence in different spectral regions can be observed after excitation of Tm3+ to one of the excited states. 3 For example, ultraviolet and blue luminescence can be observed when Tm3+ is excited into 1 D2 state. 3
Materials doped with Tm3+ and Yb3+ exhibit great up-conversion luminescence properties. 4 After excitation with infrared radiation (∼975 nm) such materials emit up-conversion luminescence in a wide spectral region from ultraviolet to visible and infrared. 4 These materials in polycrystalline or nano-particle forms are: NaYF4, NaYbF4, YF3, YbLiF4, Gd3Ga5O12, and others.5–9
Previous research studies of our group have shown that NaLaF4 doped with rare-earth elements are a promising means of observing intensive up-conversion luminescence.10–12 Some luminescence properties of Tm3+-doped NaLaF4 in oxyfluoride glass ceramics have been described in de Pablos-Martín et al. 13 To my knowledge, up-conversion luminescence properties of NaLaF4 doped with Tm3+ and Yb3+ under ∼975 nm excitation is not described in the scientific literature.
In this manuscript, up-conversion luminescence of NaLaF4 doped with Tm3+ and Yb3+ is presented. The Tm3+ concentration effect on NaLaF4:Tm3+ luminescence and up-conversion luminescence properties of NaLaF4 doped with Tm3+ and Yb3+ are given. It is well known that up-conversion luminescence intensity is related to excitation power density, 14 but I will show how high excitation radiation density (at ∼976 nm) reduces Tm3+ ultraviolet up-conversion luminescence intensity and how it is related to the sample temperature. This might explain some of the experimentally observed Tm3+ up-conversion luminescence properties from a novel aspect.
Experimental
The NaLaF4 samples doped with Tm3+ (0.01, 0.1, 0.5, 1, 2 mol%) and Yb3+ (2 mol%) were synthesized from high purity (4 N) precursors (LaF3, NaF, TmF3, and YbF3) with the ratios (44–x)LaF3:56NaF:xTmF3, x = 0.01, 0.1, 0.5, 1, and 2 mol% and 41.9LaF3:56NaF:0.1TmF3:2YbF3. The mixture of precursors was annealed in an He/F2 (90%/10% ratio) gas flow at 150 ℃ for 1 h and afterwards in an Ar atmosphere at 750 ℃ for 1 h. The obtained polycrystalline powder was ground and annealed following the latter procedure. Afterwards, the synthesized polycrystalline material was washed with deionized water to remove traces of residual NaF and dried at 100 ℃ for 1 h in an He/F2 gas flow (around 3 nL/h [normal liters per hour]). White polycrystalline powder of NaLaF4 with chosen Tm3+ and Yb3+ concentrations were obtained that resulted from this synthesis method. The polycrystalline powder was pressed to obtain tablets for spectroscopic measurements.
An X’Pert Pro MPD, or materials powder diffractometer (Malvern PANalytical), was used for the X-ray diffraction (XRD) measurements. The diffractometer was equipped with a copper anode (λXRD = 0.154056 nm). Operational voltage was 40 kV and the current was 30 mA. To excite luminescence, a tunable (210–2300 nm) pulsed NT342/3UV laser (pulse length ∼5 ns, repetition frequency 10 Hz; Ekspla) was used. The laser wavelength was varied with a step of 0.1 nm. Up-conversion luminescence was also excited using a 976 nm continuous wave laser diode (Thorlab). Through all experiments, the laser diode power was kept constant at 0.7 W on 3 mm 2 (0.23 W/mm 2 ). An intensified charge-coupled device (ICCD) camera iSTAR DH734-18F-A3 (Andor) and DU401-BV CCD camera (Andor) connected to SR-303i-B monochromato-spectrometer (Andor) were used to detect luminescence. Luminescence decay kinetics were obtained as a series of delayed luminescence spectra recorded after the excitation laser pulse using an iSTAR DH734-18F-A3 camera (Andor). All spectral measurements were corrected using the experimental setup spectral response.
Results
Sample Characterization with X-Ray Diffraction
X-ray diffraction analysis performed on synthesized samples shows that polycrystalline NaLaF4 was successfully obtained (Fig. S1, Supplemental Material) without any traces of starting materials. The XRD results also revealed that NaLaF4 diffraction peaks were shifted to higher diffraction angles with an increase of rare-earth element content, Tm3+, Yb3+ (Fig. S1, Supplemental Material). This is because both Tm3+ and Yb3+ have a smaller ionic radius than La3+ and Na+, therefore the crystalline structure is tensed and has a smaller lattice constant resulting in XRD peaks that are shifted to higher angles.
Attempts were also made to synthesize NaLaF4 with higher Yb3+ concentrations, for example, 5 mol%. The absorption of infrared excitation radiation in a more efficient manner allows one to observe more intensive up-conversion luminescence. For these samples, the measured XRD patterns (not shown here) revealed additional diffraction peaks that could not be attributed to the NaLaF4 crystalline phase, meaning NaLaF4 synthesis was unsuccessful. Higher Yb3+ and Tm3+ concentrations meant that the NaLaF4 crystalline lattice is more tensed because of the Yb3+ and Tm3+ smaller ionic radius, which was therefore more diverted from the ideal NaLaF4 crystalline structures. In addition, these deformed crystalline lattice structures might create clusters that do not allow even distribution of dopant ions inside the NaLaF4 crystalline lattice.
Therefore, the above described NaLaF4 synthesis process seems to be limited with permitted rare-earth ion dopant concentration. Nevertheless, the method used is simple and effective for synthesis of NaLaF4 doped with low rare-earth ion concentration.
Tm3+ Luminescence and its Dependence on the Tm3+ Concentration
The 4f electrons of Tm3+ have many energy states that are spread through a wide energy range of up to 38 000 cm−1, allowing one to observe complex luminescence spectra with many luminescence bands in a wide spectral range from ultraviolet to visible and infrared. Therefore, before analyzing up-conversion luminescence of NaLaF4 doped with Tm3+ and Yb3+, traditional (Stokes) luminescence of Tm3+ was analyzed. Luminescence spectra of NaLaF4:Tm3+ (0.1 mol%) after direct excitation to
3
P0,
1
D2,
1
G4, and 3H4 states with appropriate excitation wavelengths (289 nm, 355 nm, 470 nm, and 689 nm, respectively) are shown in Fig. 1. The Tm3+ energy level scheme and the observed radiative transitions are shown in Fig. S2 (Supplemental Material). Luminescence spectra of NaLaF4:Tm3+ (0.1 mol%), under various excitation wavelengths at room temperature. Luminescence spectra are normalized for each spectral region.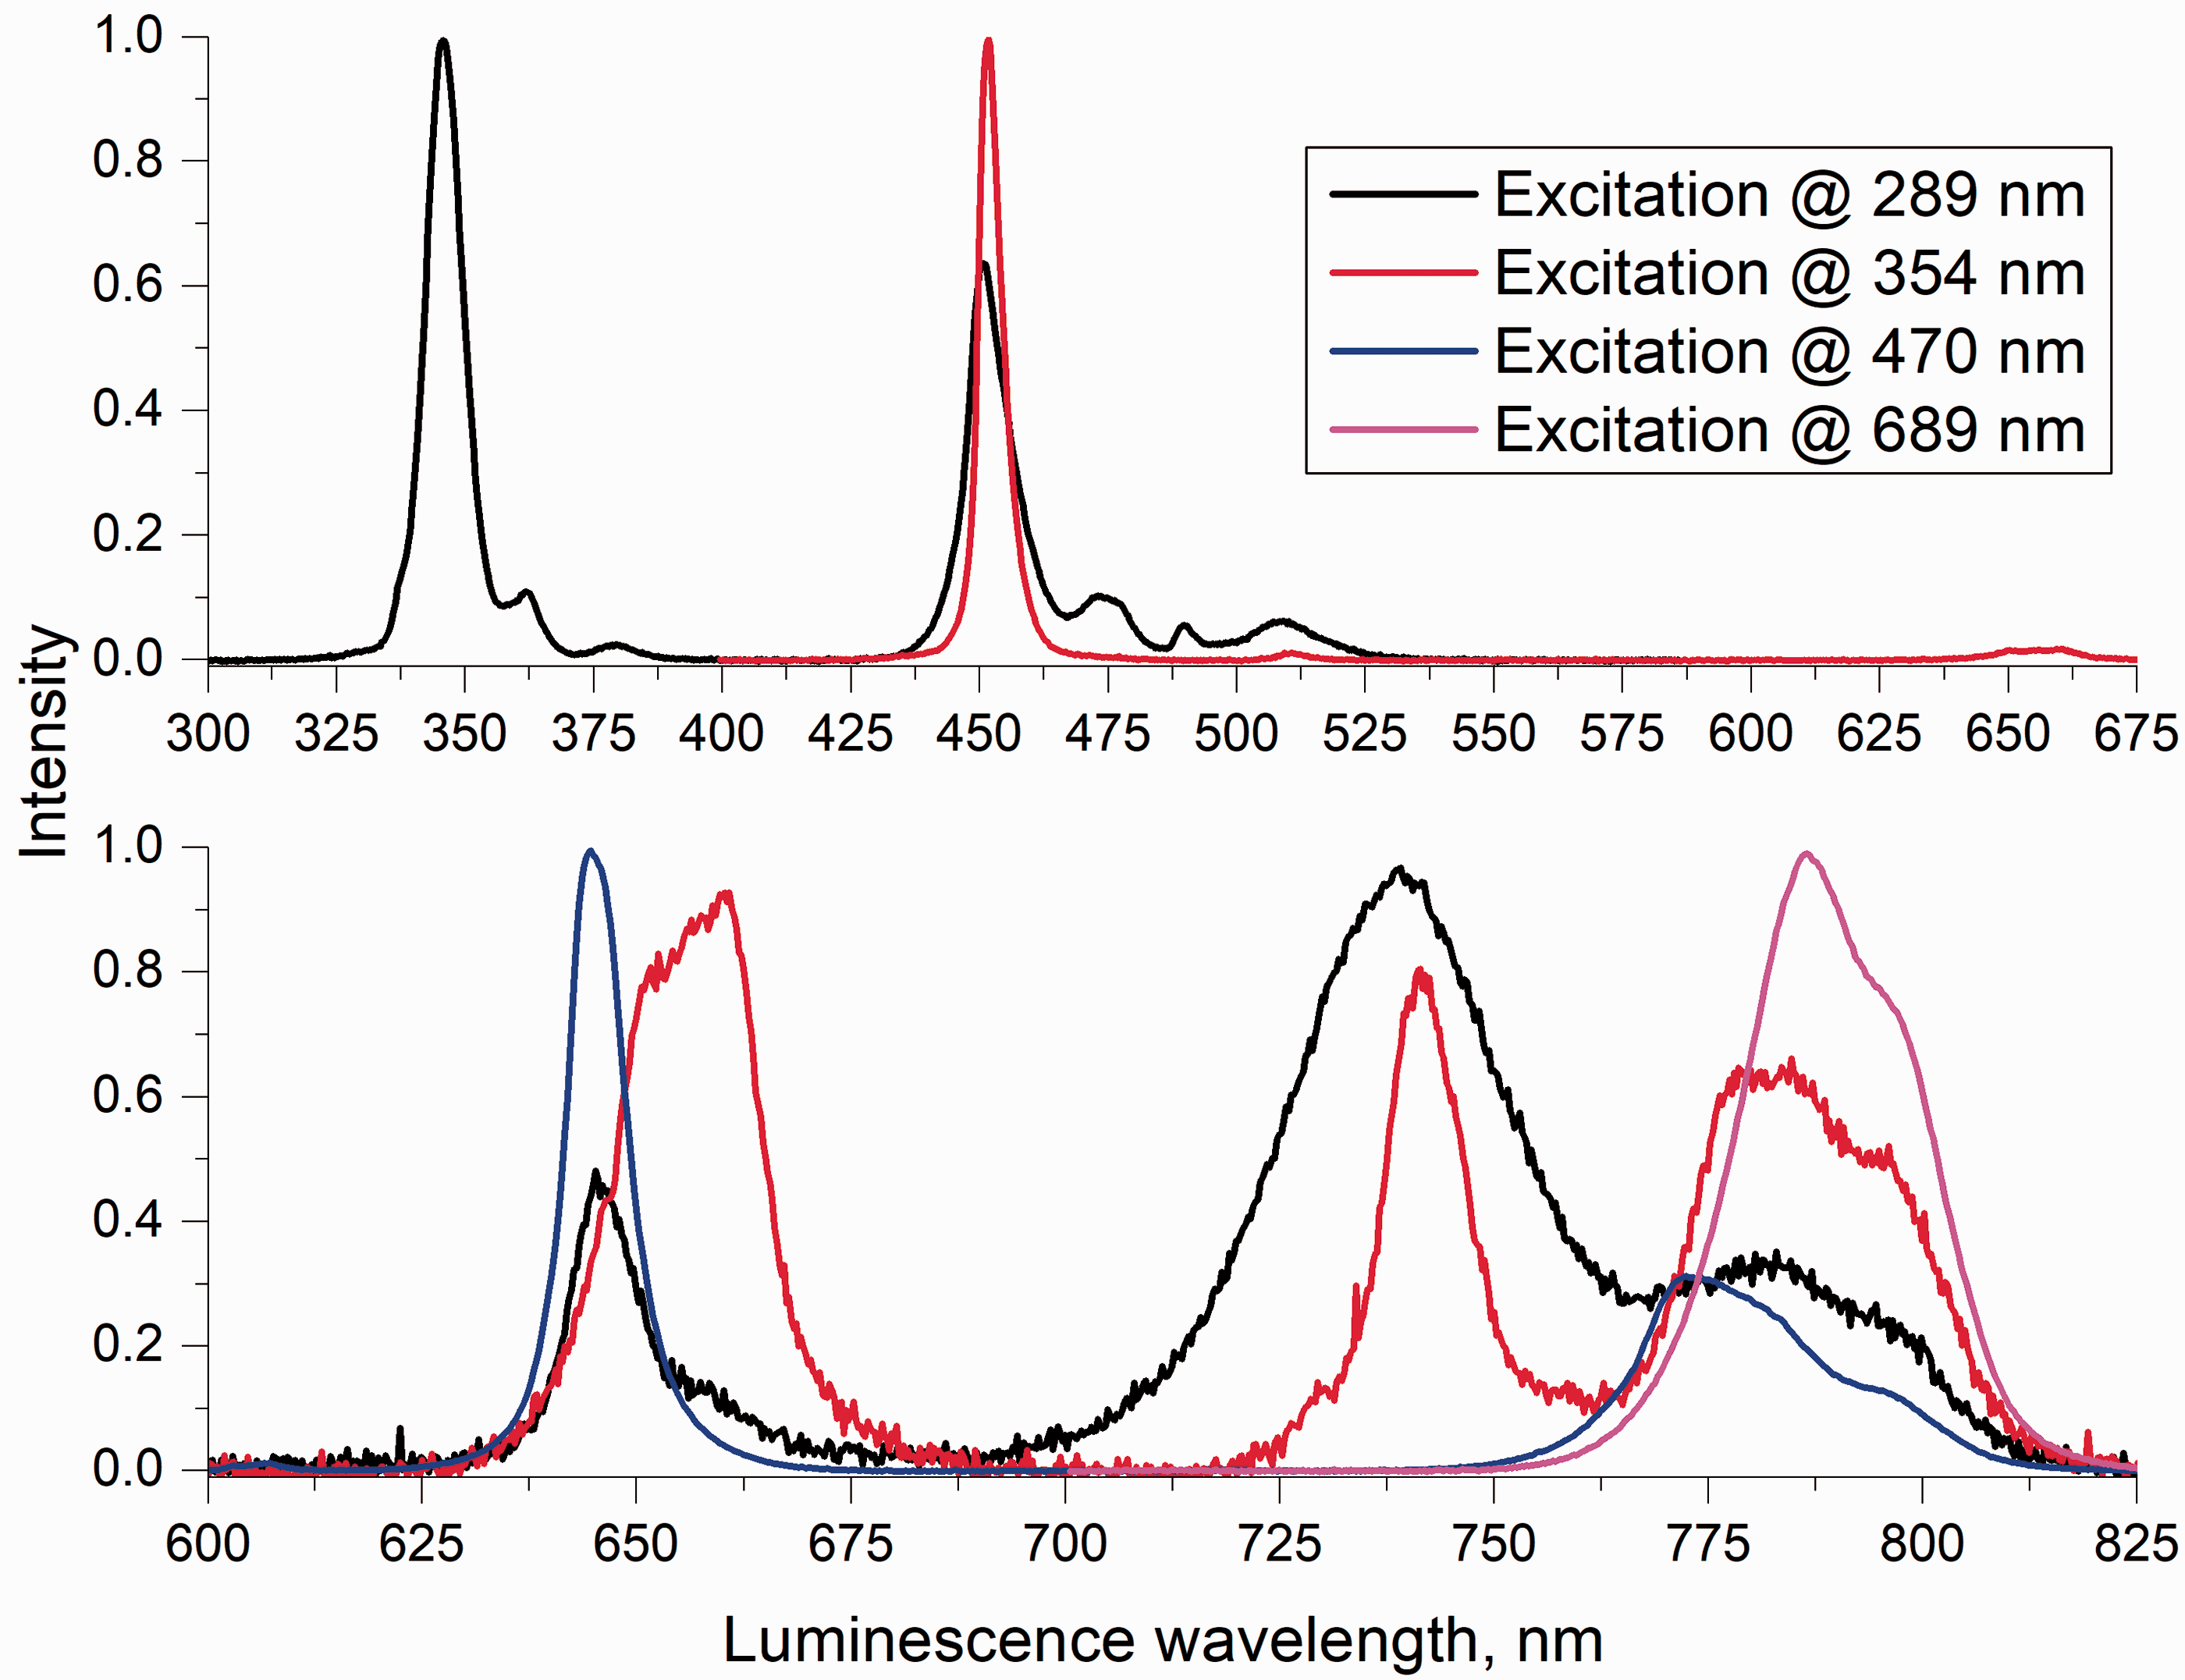
It is worth mentioning that 1 D2 → 3 F4 and 3 P0 → 3H5 radiative transitions resulted in luminescence bands centered at the same wavelength of 450 nm (Fig. 1). A similar observation was made for 1 D2 → 3 F2 and 3 P0 → 1 G4 transitions that resulted in a luminescence band at 740 nm. In luminescence spectra, these transitions differ only by luminescence band width: The luminescence bands related to 3 P0 → 3H5 and 3 P0 → 1 G4 transitions are a little bit wider than the luminescence bands related to 1 D2 → 3 F4 and 1 D2 → 3 F2 transitions. The luminescence bands that overlap from different radiative transitions show the possible complexity of the up-conversion luminescence processes.
Some luminescence bands kinetics consist of raise part in the beginning of kinetics followed by decay part. This can be observed, for example, for the luminescence band at 362 nm ( 1 D2 → 3H6) after 289 nm excitation to the 3 P0 state or for the luminescence band at 800 nm (3H4 → 3H6) after 470 nm excitation to the 1 G4 state. The rising part in luminescence kinetics means that the observed energy state becomes populated after the end of excitation radiation (after excitation laser pulse) via radiative transitions from higher state.
To avoid losing excitation energy from excited 3 P0, 1 D2, 1 G4, and 3H4 states due to energy transfer processes, 0.1 mol% Tm3+ was chosen to study up-conversion luminescence in Tm3+- and Yb3+-doped NaLaF4.
Up-Conversion Luminescence of NaLaF4:Tm3+ (0.1 mol%), Yb3+ (2 mol%)
Under the laser diode, the 976 nm excitation of NaLaF4:Tm3+ (0.1 mol%), Yb3+ (2 mol%) intensive characteristic blue Tm3+ luminescence was observed. The measured up-conversion luminescence spectrum (Fig. 2) consisted of Tm3+ luminescence bands from excited
3
P0,
1
D2,
1
G4,
3
F3,2, and 3H4 states. The most intensive up-conversion luminescence bands were at 345 nm (
3
P0 →
3
F4), 362 nm (
1
D2 → 3H6), 450 nm (
3
P0 → 3H5 and
1
D2 →
3
F4), 475 nm (
1
G4 → 3H6), 645 nm (
1
G4 →
3
F4), 700 nm (
3
F3,2 → 3H6), and 800 nm (3H4 → 3H6). The measured up-conversion luminescence spectrum shows that infrared excitation radiation was converted to blue and ultraviolet radiation and the up-conversion luminescence kinetics for the most intensive luminescence bands are shown in Fig. 2 (inset); all of them consist of a rising part, reaching maximum intensity, followed by decay, indicating that energy states become populated after an excitation pulse. In most cases, this is attributed to the energy transfer process from excited Yb3+ to Tm3+. Up-conversion luminescence spectra of NaLaF4:Tm3+ (0.1 mol%), Yb3+ (2 mol%) under laser diode 976 nm excitation at room temperature. Inset shows up-conversion luminescence decay kinetics for the main luminescence bands under 976 nm excitation.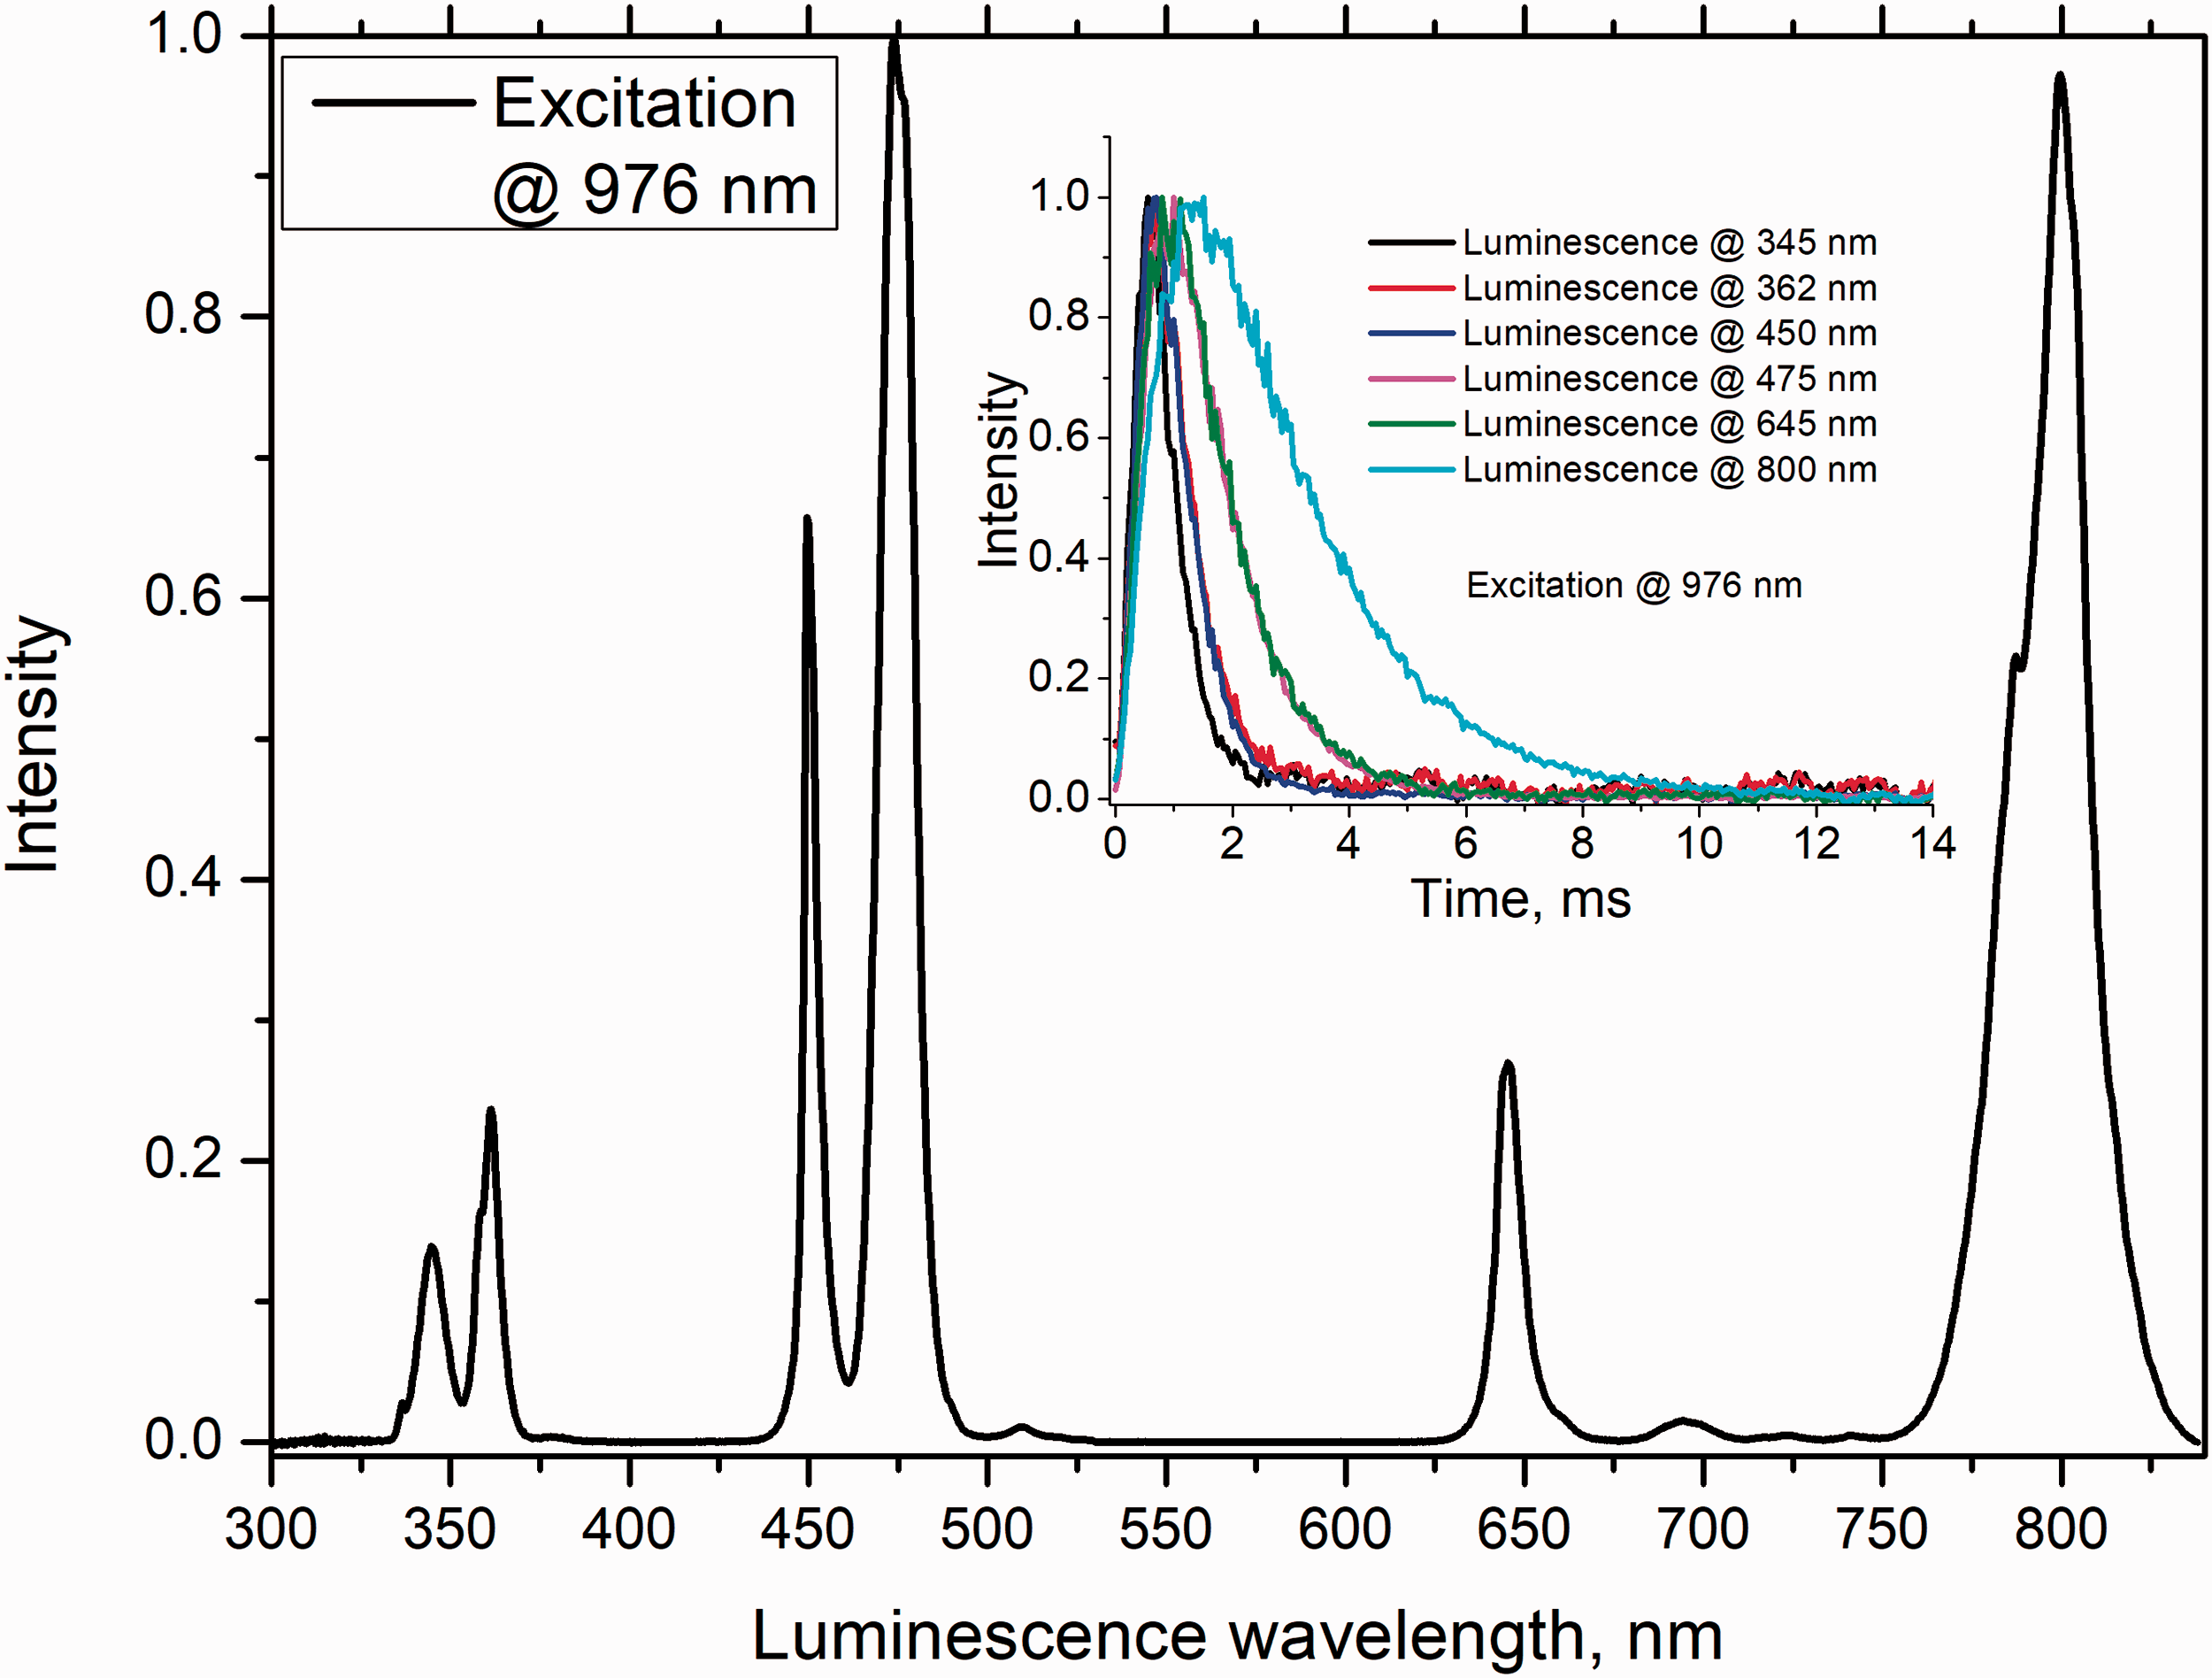
The excitation wavelength at 976 nm was not chosen by chance. Up-conversion excitation spectra measurements in wide spectral region (900–1040 nm) were performed to ascertain the best excitation wavelength to excite Tm3+ up-conversion luminescence. The obtained up-conversion luminescence excitation spectra for different up-conversion luminescence bands using pulsed excitation source is shown (Fig. 3), which reflects the Yb3+ absorption spectrum and follows the excitation energy transfer from Yb3+ to Tm3+. The 800 nm up-conversion luminescence excitation band is wide (∼100 nm), meaning that it can be excited in a wide spectral range (920 nm–1020 nm). Up-conversion luminescence excitation spectra for luminescence bands that are related to Tm3+ transitions from
1
G4,
1
D2, and
3
P0 states become narrower as the up-conversion luminescence arises from an increasingly higher state; 976 nm is an excitation wavelength at which all up-conversion luminescence bands are excited most efficiently. The narrowing of up-conversion luminescence excitation bands is related to a correlation between the Yb3+ absorption (σGSA) and up-conversion excitation spectra (σ) relation, σ = (σGSA)″, where n is the number of Yb3+ absorption steps required for excitation of the Tm3+ up-conversion luminescence.
15
For higher Tm3+ excited states, n needs to increase, therefore the intensive Yb3+ absorption lines in the up-conversion luminescence excitation spectra becomes more pronounced. Moreover, intensity of the ultraviolet and other luminescence bands related to higher Tm3+ excited states are more sensitive to variations of excitation radiation wavelengths. Normalized up-conversion luminescence excitation spectra of NaLaF4:Tm3+ (0.1 mol%), Yb3+ (2 mol%) for various up-conversion luminescence bands. Excitation spectra were acquired using tunable impulse laser.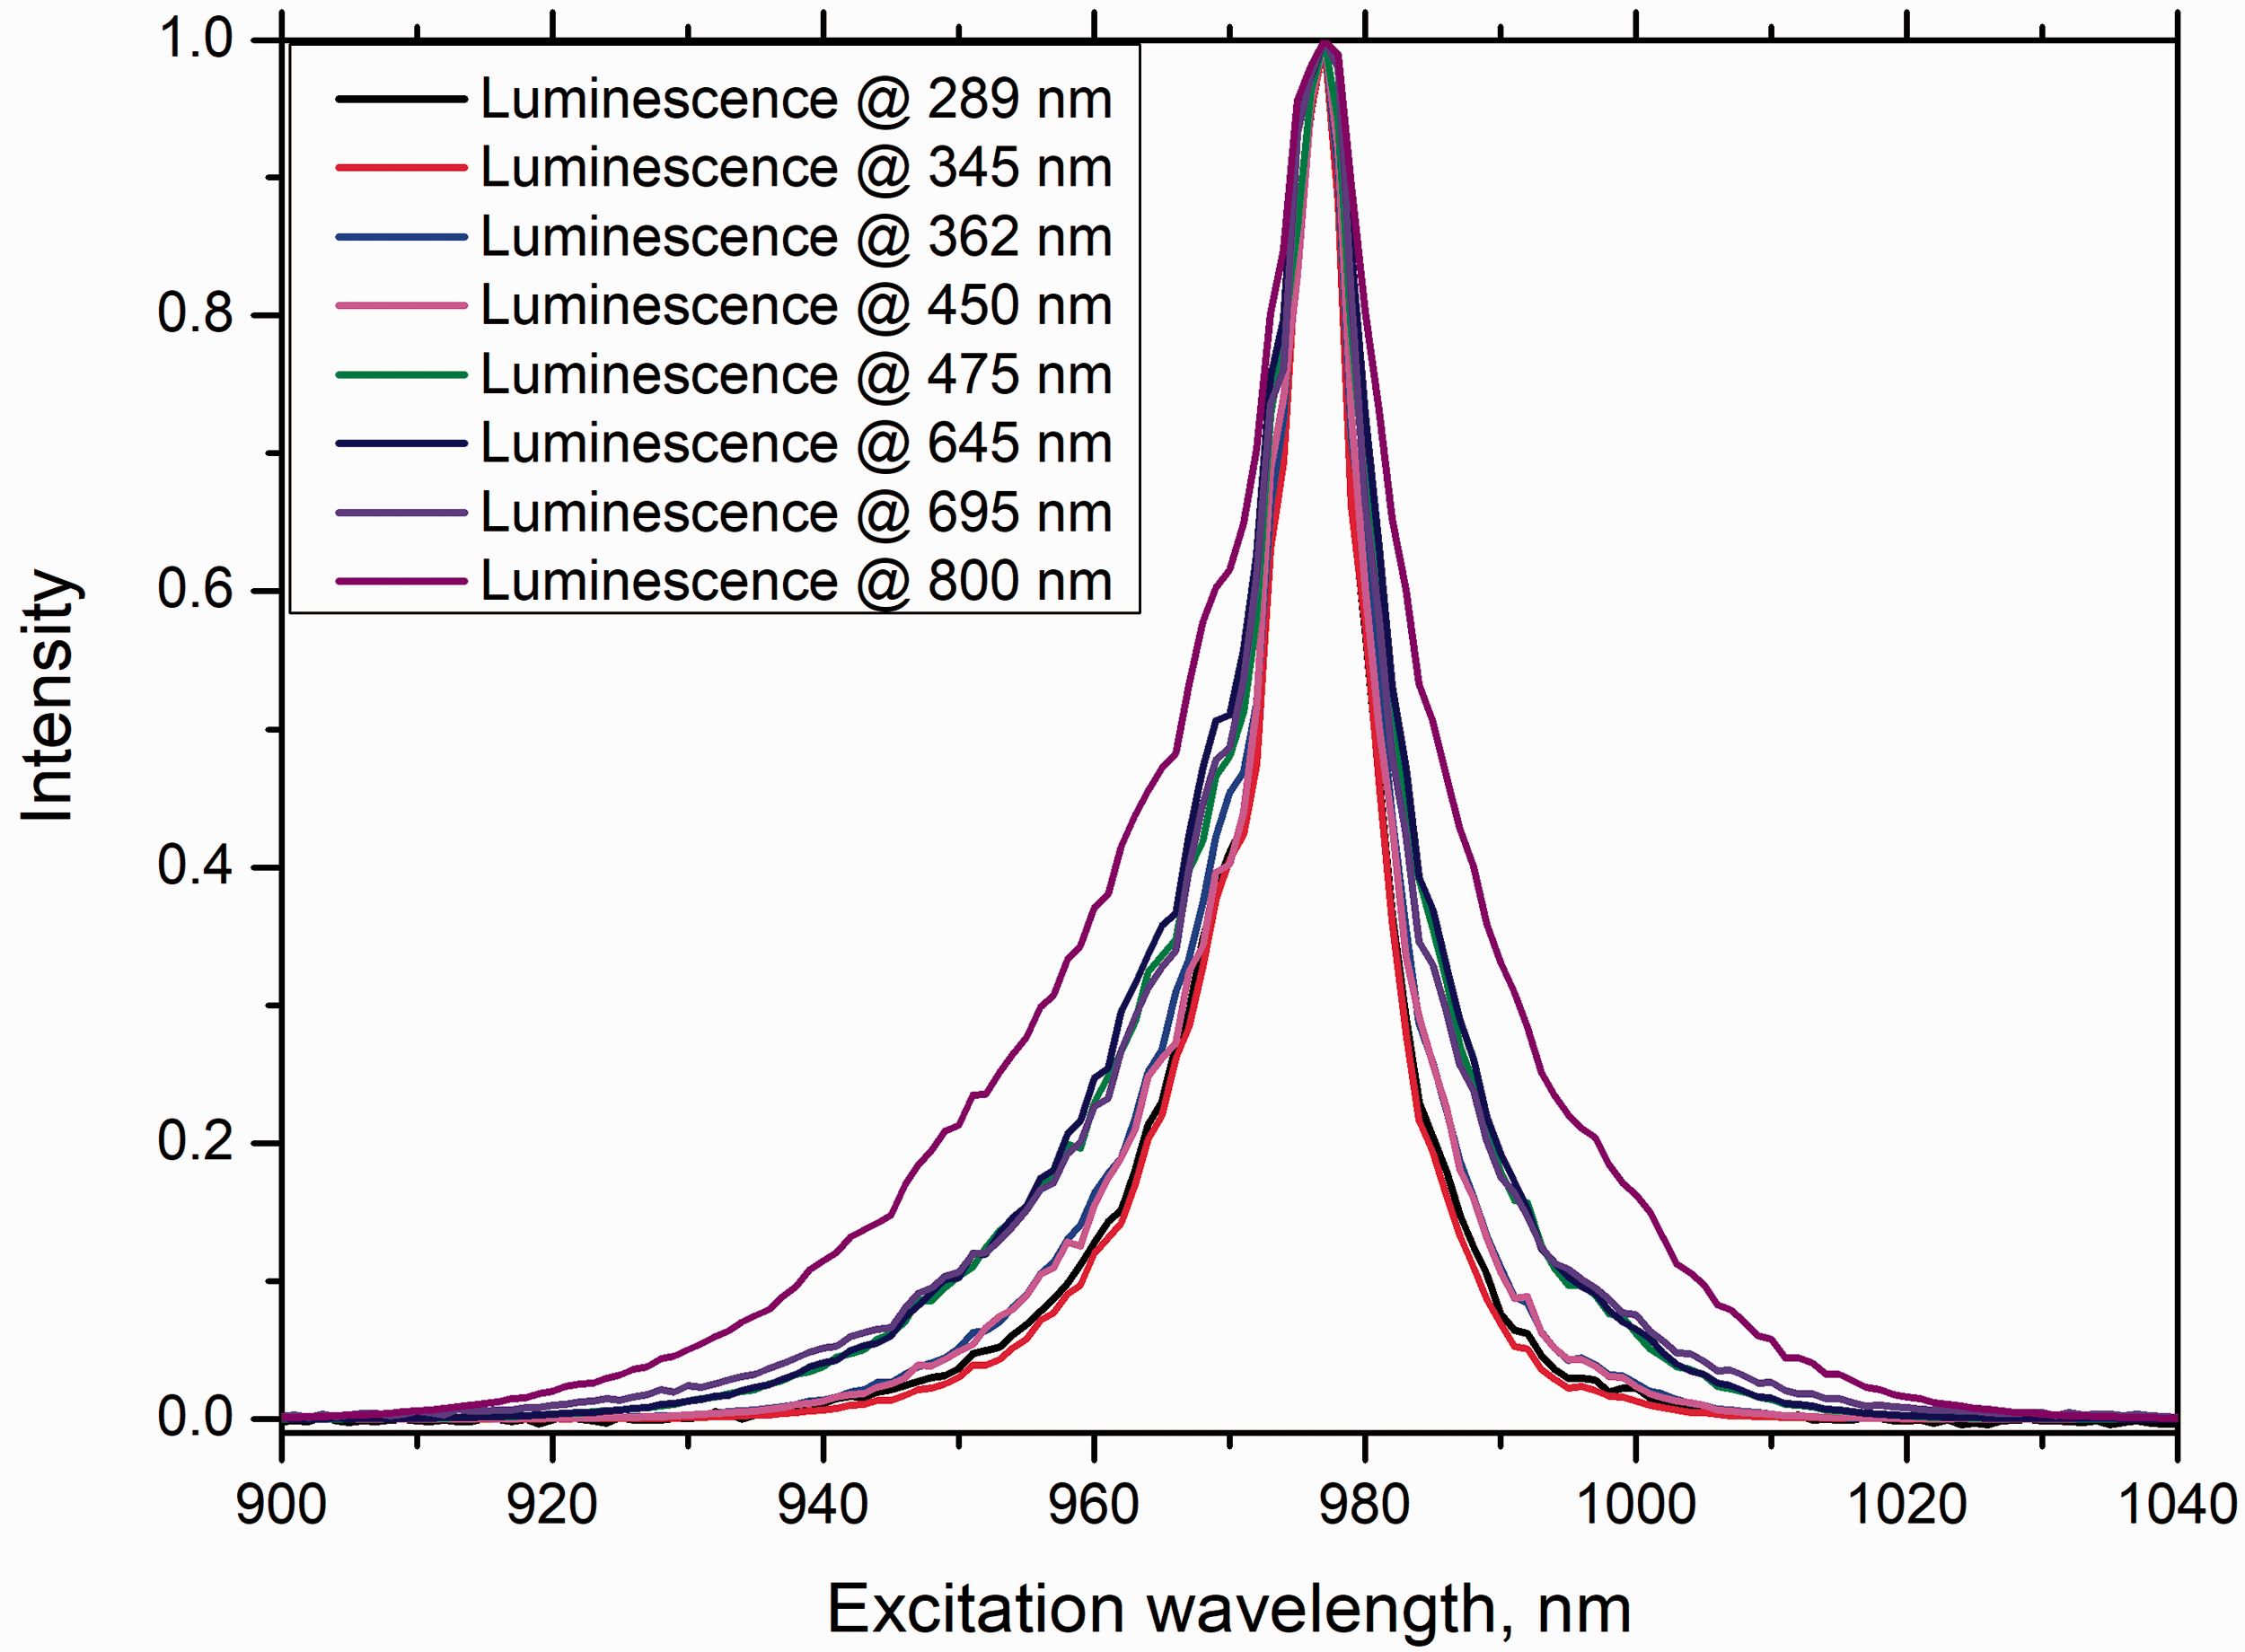
After an analysis of scientific literature devoted to possible up-conversion luminescence excitation mechanisms in materials doped with Tm3+ and Yb3+, three main Tm3+ excitation mechanisms are highlighted in this manuscript,5–9,16,17 and all of them are shown in Fig. S3 (Supplemental Material). The first one is related to the subsequent energy transfer steps from Yb3+ to Tm3+ until Tm3+ is excited to the 3 P0 state (Fig. S3, Supplemental Material). The second up-conversion luminescence excitation mechanism also involves subsequent energy transfer from Yb3+ to Tm3+ until Tm3+ is excited to 1 G4 or 3H4 state. Afterwards, mutual interaction between the two excited Tm3+ occurs and, as a result, one of them is excited to the 3 P0 or 1 D2 state (Fig. S3b, Supplemental Material). The third up-conversion luminescence excitation mechanism is more complex and involves simultaneous energy transfer to Tm3+ from two excited Yb3+-cooperative sensitization (Fig. S3c, Supplemental Material). Usually, cooperative sensitization occurs in Yb3+ highly doped materials because both excited Yb3+ need to be spaced close together to increase probability of cooperative sensitization.
Non-exponential nature of luminescence decay kinetics from 1 G4 and 3H4 states at high Tm3+ concentration already indicate that these energy states are involved in Tm3+ mutual interaction. But only negligible small intensity of up-conversion luminescence could be observed from 3 P0, 1 D2, and 1 G4 states after Tm3+ excitation to 1 G4 (470 nm) or 3H4 (800 nm) states for the NaLaF4 doped with 2 mol% Tm3+ only (the highest Tm3+ concentration in sample set). The sample was chosen intentionally without Yb3+ to avoid possible energy transfer from Tm3+ to Yb3+ and back to Tm3+. Energy transfer mechanisms between two excited Tm3+ shown in Fig. S3b are less probable to populate the 3 P0 and 1 D2 states. Energy transfer from excited Yb3+ to Tm3+ to excite the 3 P0 and 1 D2 states, from which ultraviolet up-conversion luminescence is observed, are preferable.
It is complicated to distinguish whether subsequent energy transfer (Fig. S3a) occurs or cooperative sensitization (Fig. S3c). As cooperative sensitization requires high density of excited Yb3+, a more probable up-conversion luminescence excitation mechanism is subsequent energy transfer from Yb3+ to Tm3+ as shown in Fig. S3a.
Very often up-conversion luminescence intensity (I) power (P) dependence I∼Pn is used to describe up-conversion excitation mechanisms and determine the number of absorbed and involved photons (n) in up-conversion excitation mechanism. This approximation is valid only for small up-conversion influence on energy state depopulation. 14 Besides the discussed up-conversion luminescence excitation mechanisms shown in Fig. S3, radiative transitions between excited Tm3+ states (Fig. 1, Fig. S2) also need to be considered (which is not considered in I∼Pn case), to fully understand Tm3+ up-conversion luminescence excitation mechanisms.
The step-by-step energy transfer process has a negative side product–phonon generation because the energy transferred from Yb3+ is greater than the energy required to bring the gap between two Tm3+ energy states. The excess energy is transformed into phonons, meaning that sample temperature increases.
Effect of Temperature on NaLaF4:Tm3+, Yb3+ Up-Conversion Luminescence
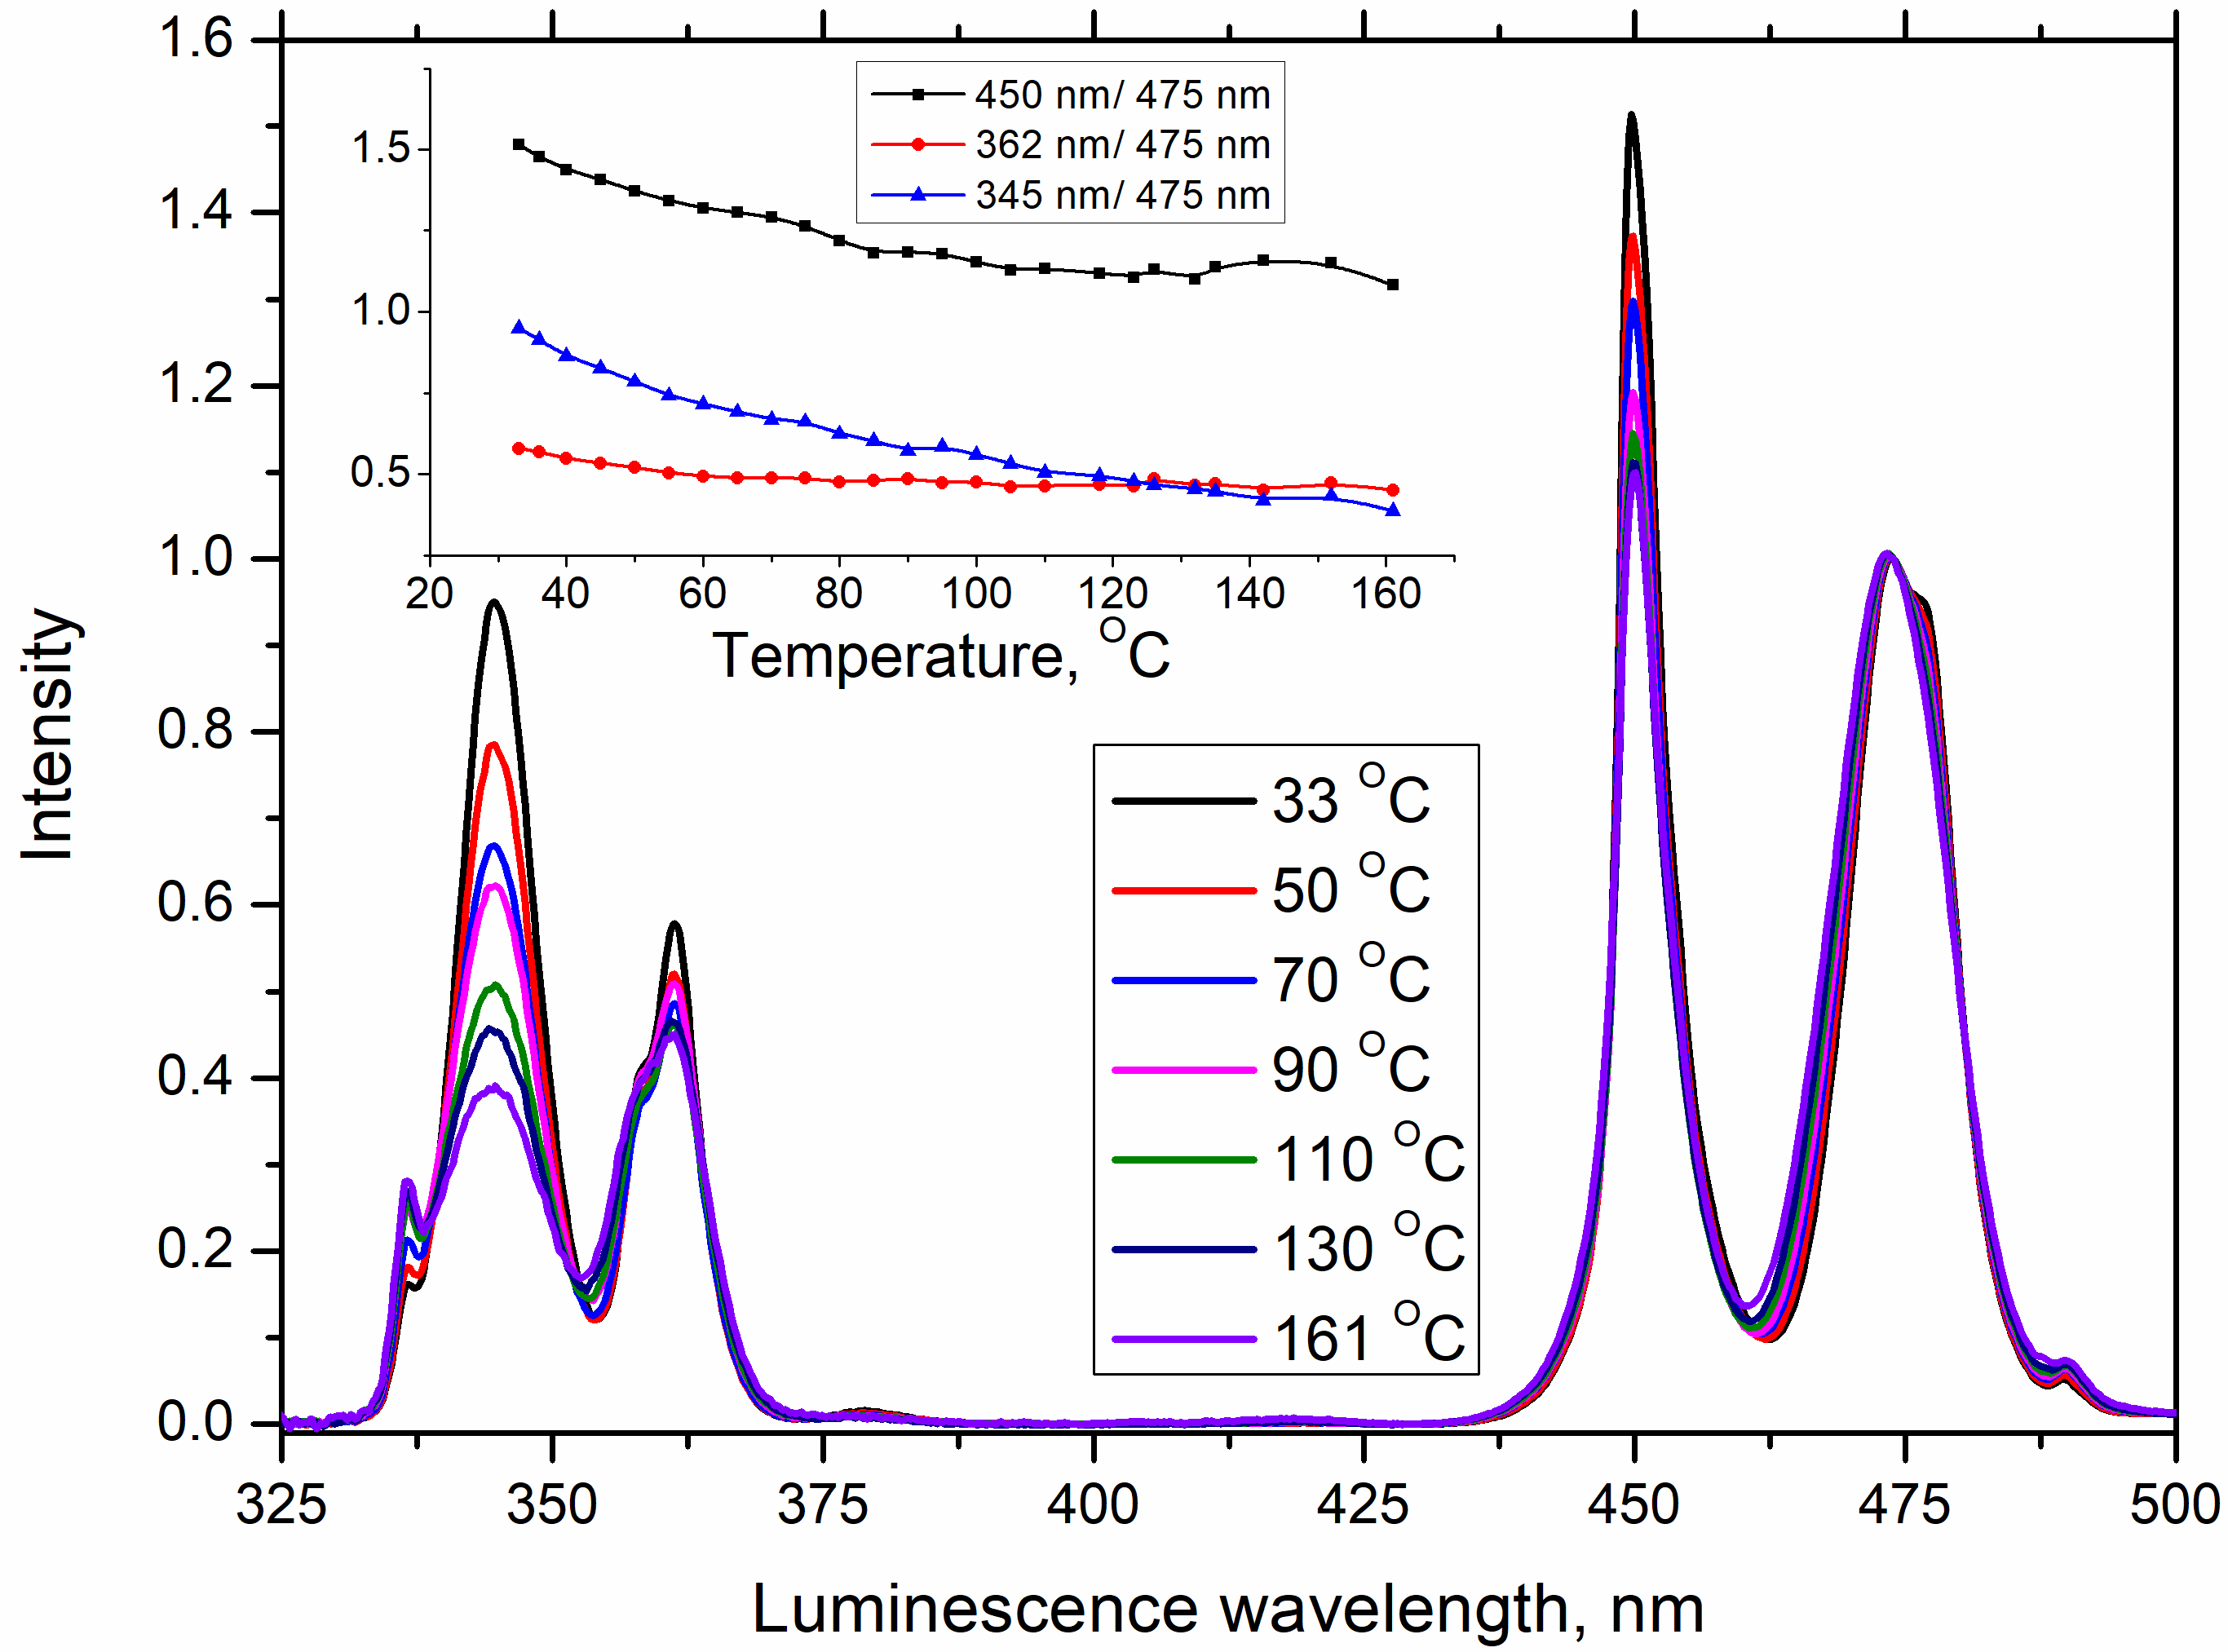
When the up-conversion luminescence spectra of pressed powder NaLaF4 doped with Tm3+ and Yb3+ had been acquired under the excitation of 976 nm laser diode, variations in luminescence band intensities were noticed. After laser diode had been switched on, decrease of up-conversion luminescence intensity was observed; in addition, for various luminescence bands the decrease of intensities was different. For the 345 nm, 362 nm, and 450 nm up-conversion luminescence bands related to the
3
P0 and
1
D2 states, intensities decrease faster than for the 475 nm luminescence band related to the
1
G4 state. Decrease of the luminescence band intensities could be attributed to increased sample temperature, which is induced by generation of phonons (mentioned in the previous Up-Conversion Luminescence of NaLaF4:Tm3+ (0.1 mol%), Yb3+ (2 mol%) section) and to high excitation radiation density (0.23 W/mm
2
). Temperature effects on up-conversion luminescence have been observed in various materials (e.g., polycrystalline powder, glass ceramics, nanoparticles) doped with thulium ions.18–22 Up-conversion luminescence spectra measurements at higher temperatures were performed to verify whether sample temperature variation could significantly affect the intensity of up-conversion luminescence bands. For this experiment, the heater head was slightly covered with NaLaF4:Tm3+,Yb3+, almost invisible to the naked eye, but under 976 nm excitation the blue Tm3+ up-conversion luminescence could be observed with the naked eye. Only a small fraction of whole polycrystalline powder was used to avoid possible heating up from excitation radiation. In addition, applied polycrystalline grains are in good thermal contact with the heater head. Even when the heater was not turned on, changes in up-conversion luminescence spectra for the slightly covered heater head were noticeable immediately after switching on the laser diode. There was no change in the intensity of the up-conversion luminescence bands in the time after switching on IR excitation source. This contradicts the observed events for the pressed polycrystalline sample after the laser diode had been switched on and the intensity of up-conversion luminescence intensity decreased. In addition, changes in luminescence band intensity were observed when the luminescence of the slightly covered heater head was compared with the pressed polycrystalline sample. Concerning the up-conversion luminescence band from the
1
G4 state (475 nm) for the sample that slightly covered the heater head, up-conversion luminescence bands originated from higher
3
P0 (345 nm and 450 nm) and
1
D2 (362 nm) states and became relatively more intensive (Fig. 4) compared to the pressed polycrystalline powder sample (Fig. 2). These two facts show that the configuration of the measured sample affects the shape of the up-conversion luminescence spectrum, and this could be attributed to laser-induced heating. When the heater was switched on, up-conversion luminescence spectra were measured in the temperature interval of 30 ℃–160 ℃ (Fig. 4). Within this experiment, the laser diode excitation power density was kept constant. Upon increase of the sample temperature, the relative intensity of the 343 nm, 362 nm, and 450 nm up-conversion luminescence bands from the
3
P0 and
1
D2 states decreased compared to the 475 nm up-conversion luminescence band from the
1
G4 state. Figure 4 (inset) shows the 345 nm, 362 nm, and 450 nm luminescence band intensities (from the
3
P0 and
1
D2 states) relative to the 475 nm luminescence band intensity (from
1
G4 state), which decreased as the sample temperature increased. These experimental results clearly indicate that up-conversion luminescence of Yb3+ and Tm3+-doped NaLaF4 strongly depends on sample temperature variation, resulting in a greater decrease of 343 nm, 362 nm, and 450 nm luminescence band intensities compared to 475 nm luminescence band intensity when sample temperature increases. Up-conversion luminescence spectra of NaLaF4:Tm3+ (0.1 mol%), Yb3+ (2 mol%) under laser diode 976 nm excitation at different temperatures. Inset shows 345 nm, 362 nm, and 450 nm luminescence band intensity (from
3
P0 and
1
D2 states) relative to the 475 nm luminescence band intensity (from
1
G4 state).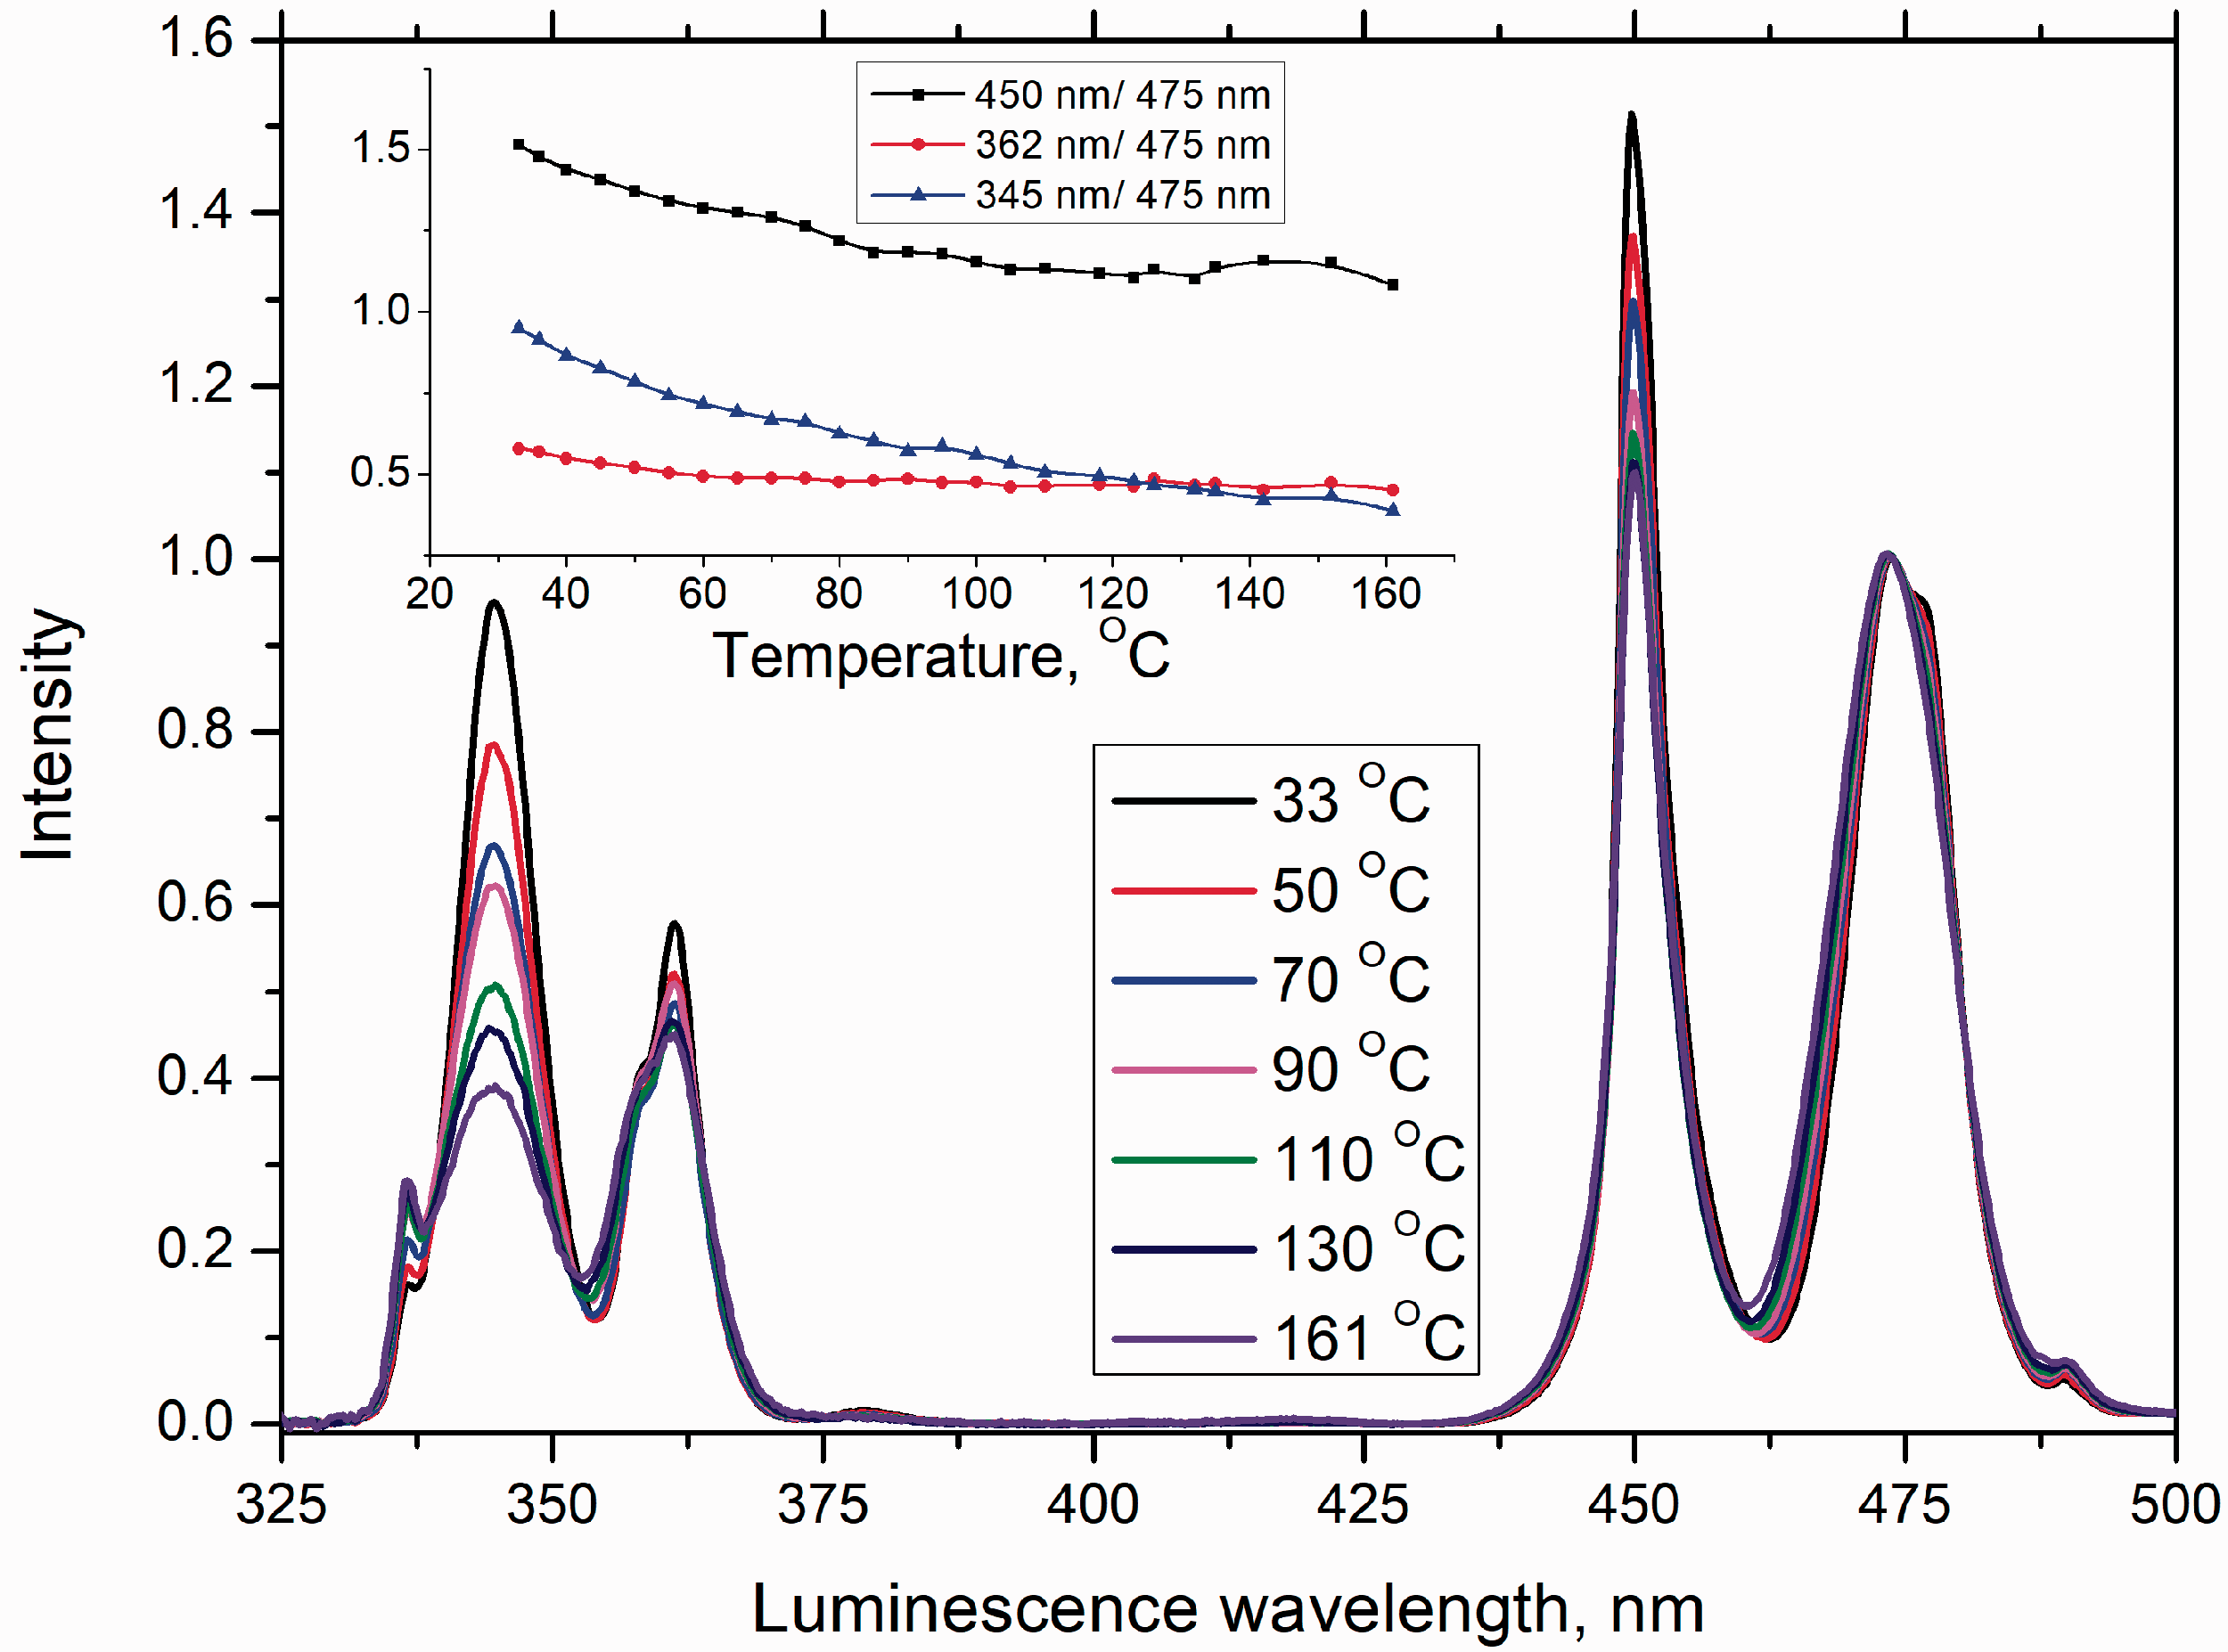
A decrease of luminescence band intensity upon an increase of sample temperature is usually attributed to the thermal quenching effect when a decrease of energy state population is caused by nonradiative transition to a lower state through phonon generation. No variations were observed for luminescence decay kinetics from the 3 P0, 1 D2, 1 G4, and 3H4 states under direct excitation at different temperatures. Probability of the nonradiative transitions increases as the sample temperature increases, but nonradiative transition probability also depends on the energy difference from excited state to the next lower-lying state.23,24 As a rule of thumb, the probability of nonradiative transition overcomes the probability of radiative transition if the number of required generated phonons is less than five. 24 The energy difference between 3 P0 and 1 D2 states is around 6500 cm−1 and between 1 D2 and 1 G4 at 6800 cm−1. The effective phonon energy of NaLaF4 is ∼290 cm−1. 10 This means that in order to overcome the energy gap between 3 P0 and 1 D2 states the generation of ∼22 phonons is required, while for the energy gap between 1 D2 and 1 G4 ∼23 phonons is required. These numbers are much more than five, therefore it is not a surprise that an increase in sample temperature (ranging from 30 ℃ to 160 ℃) does not affect the luminescence decay profile therefore also energy states transition probability.
Another approach to how temperature affects ultraviolet up-conversion luminescence spectra might be explained by looking at the up-conversion luminescence excitation spectra shown in Fig. 3. Up-conversion luminescence excitation spectra are a combination of transitions from the Yb3+ ground state 2 F7/2 Stark sublevels to excited state 2 F5/2 Stark sublevels followed by energy transfer steps from Yb3+ to Tm3+. The Yb3+ absorption spectrum is a result of radiative transition probability from ground state to excited state, and a number of involved ytterbium ions in the absorption process. Radiative transition probability in general terms does not depend on temperature, but a number of involved ytterbium ions in this absorption process depends on sample temperature when the excitation wavelength is kept constant. This is because the Yb3+ ground state 2 F7/2 Stark sublevels population are subjected to a Boltzmann distribution. Therefore, the number of Yb3+ at any of the ground state 2 F7/2 Stark sublevels varies within temperature. From the scientific literature, it is known that the strongest (the most intensive) Yb3+ absorption appears between the lowest Stark sublevels of the ground state 2 F7/2 to the lowest Stark sublevels of the excited state 2 F5/2. 25 For NaLaF4:Tm3+ (0.1 mol%), Yb3+ (2 mol%), this corresponds to an excitation wavelength at 976 nm. When the sample temperature is increased, the number of Yb3+ at the lowest Stark sublevel of the ground state 2 F7/2 decreases (Boltzmann distribution). As a result, with the same excitation wavelength a smaller number of Yb3+ could be excited to 2 F5/2 state. Therefore, excited Yb3+ are further from Tm3+, energy transfer from Yb3+ to Tm3+ occurs less frequently, and Tm3+ could not be excited to the 3 P0 and 1 D2 states.
This assumption is supported by up-conversion luminescence excitation spectrum measurements at different temperatures. Figure 5 shows up-conversion luminescence excitation spectra for 345 nm, 475 nm, and 800 nm luminescence bands obtained at different temperatures. All up-conversion luminescence excitation spectra are normalized to show changes in excitation spectrum form, not from overall intensity of the up-conversion luminescence excitation spectrum that also could be affected by other processes. Within the temperature increase of the relative intensity of up-conversion luminescence, the excitation spectra from 976 nm to a shorter wavelength did not change, while at the longer wavelength from 976 nm the intensity slightly increased. The 976 nm and shorter wavelength arose from the transition from the Yb3+ ground state
2
F7/2 lowest Stark sublevels to the excited state
2
F5/2 Stark sublevels, while the longer wavelength from 976 nm arose from the transition from the Yb3+ ground state
2
F7/2 higher Stark sublevels to excited state
2
F5/2 Stark sublevels. Increased intensity in this part of up-conversion luminescence excitation spectra compared to shorter wavelength could mean: (i) a larger number of Yb3+ are at ground state
2
F7/2 higher Stark sublevels, (ii) a smaller number of Yb3+ are at ground state
2
F7/2 lowest Stark sublevels, or (iii) both factors together. Therefore, using the excitation wavelength at the 976 nm smaller number of Yb3+ could be excited. Normalized up-conversion luminescence excitation spectra of NaLaF4:Tm3+ (0.1 mol%), Yb3+ (2 mol%) for 345 nm, 475 nm, and 800 nm up-conversion luminescence bands at different temperatures.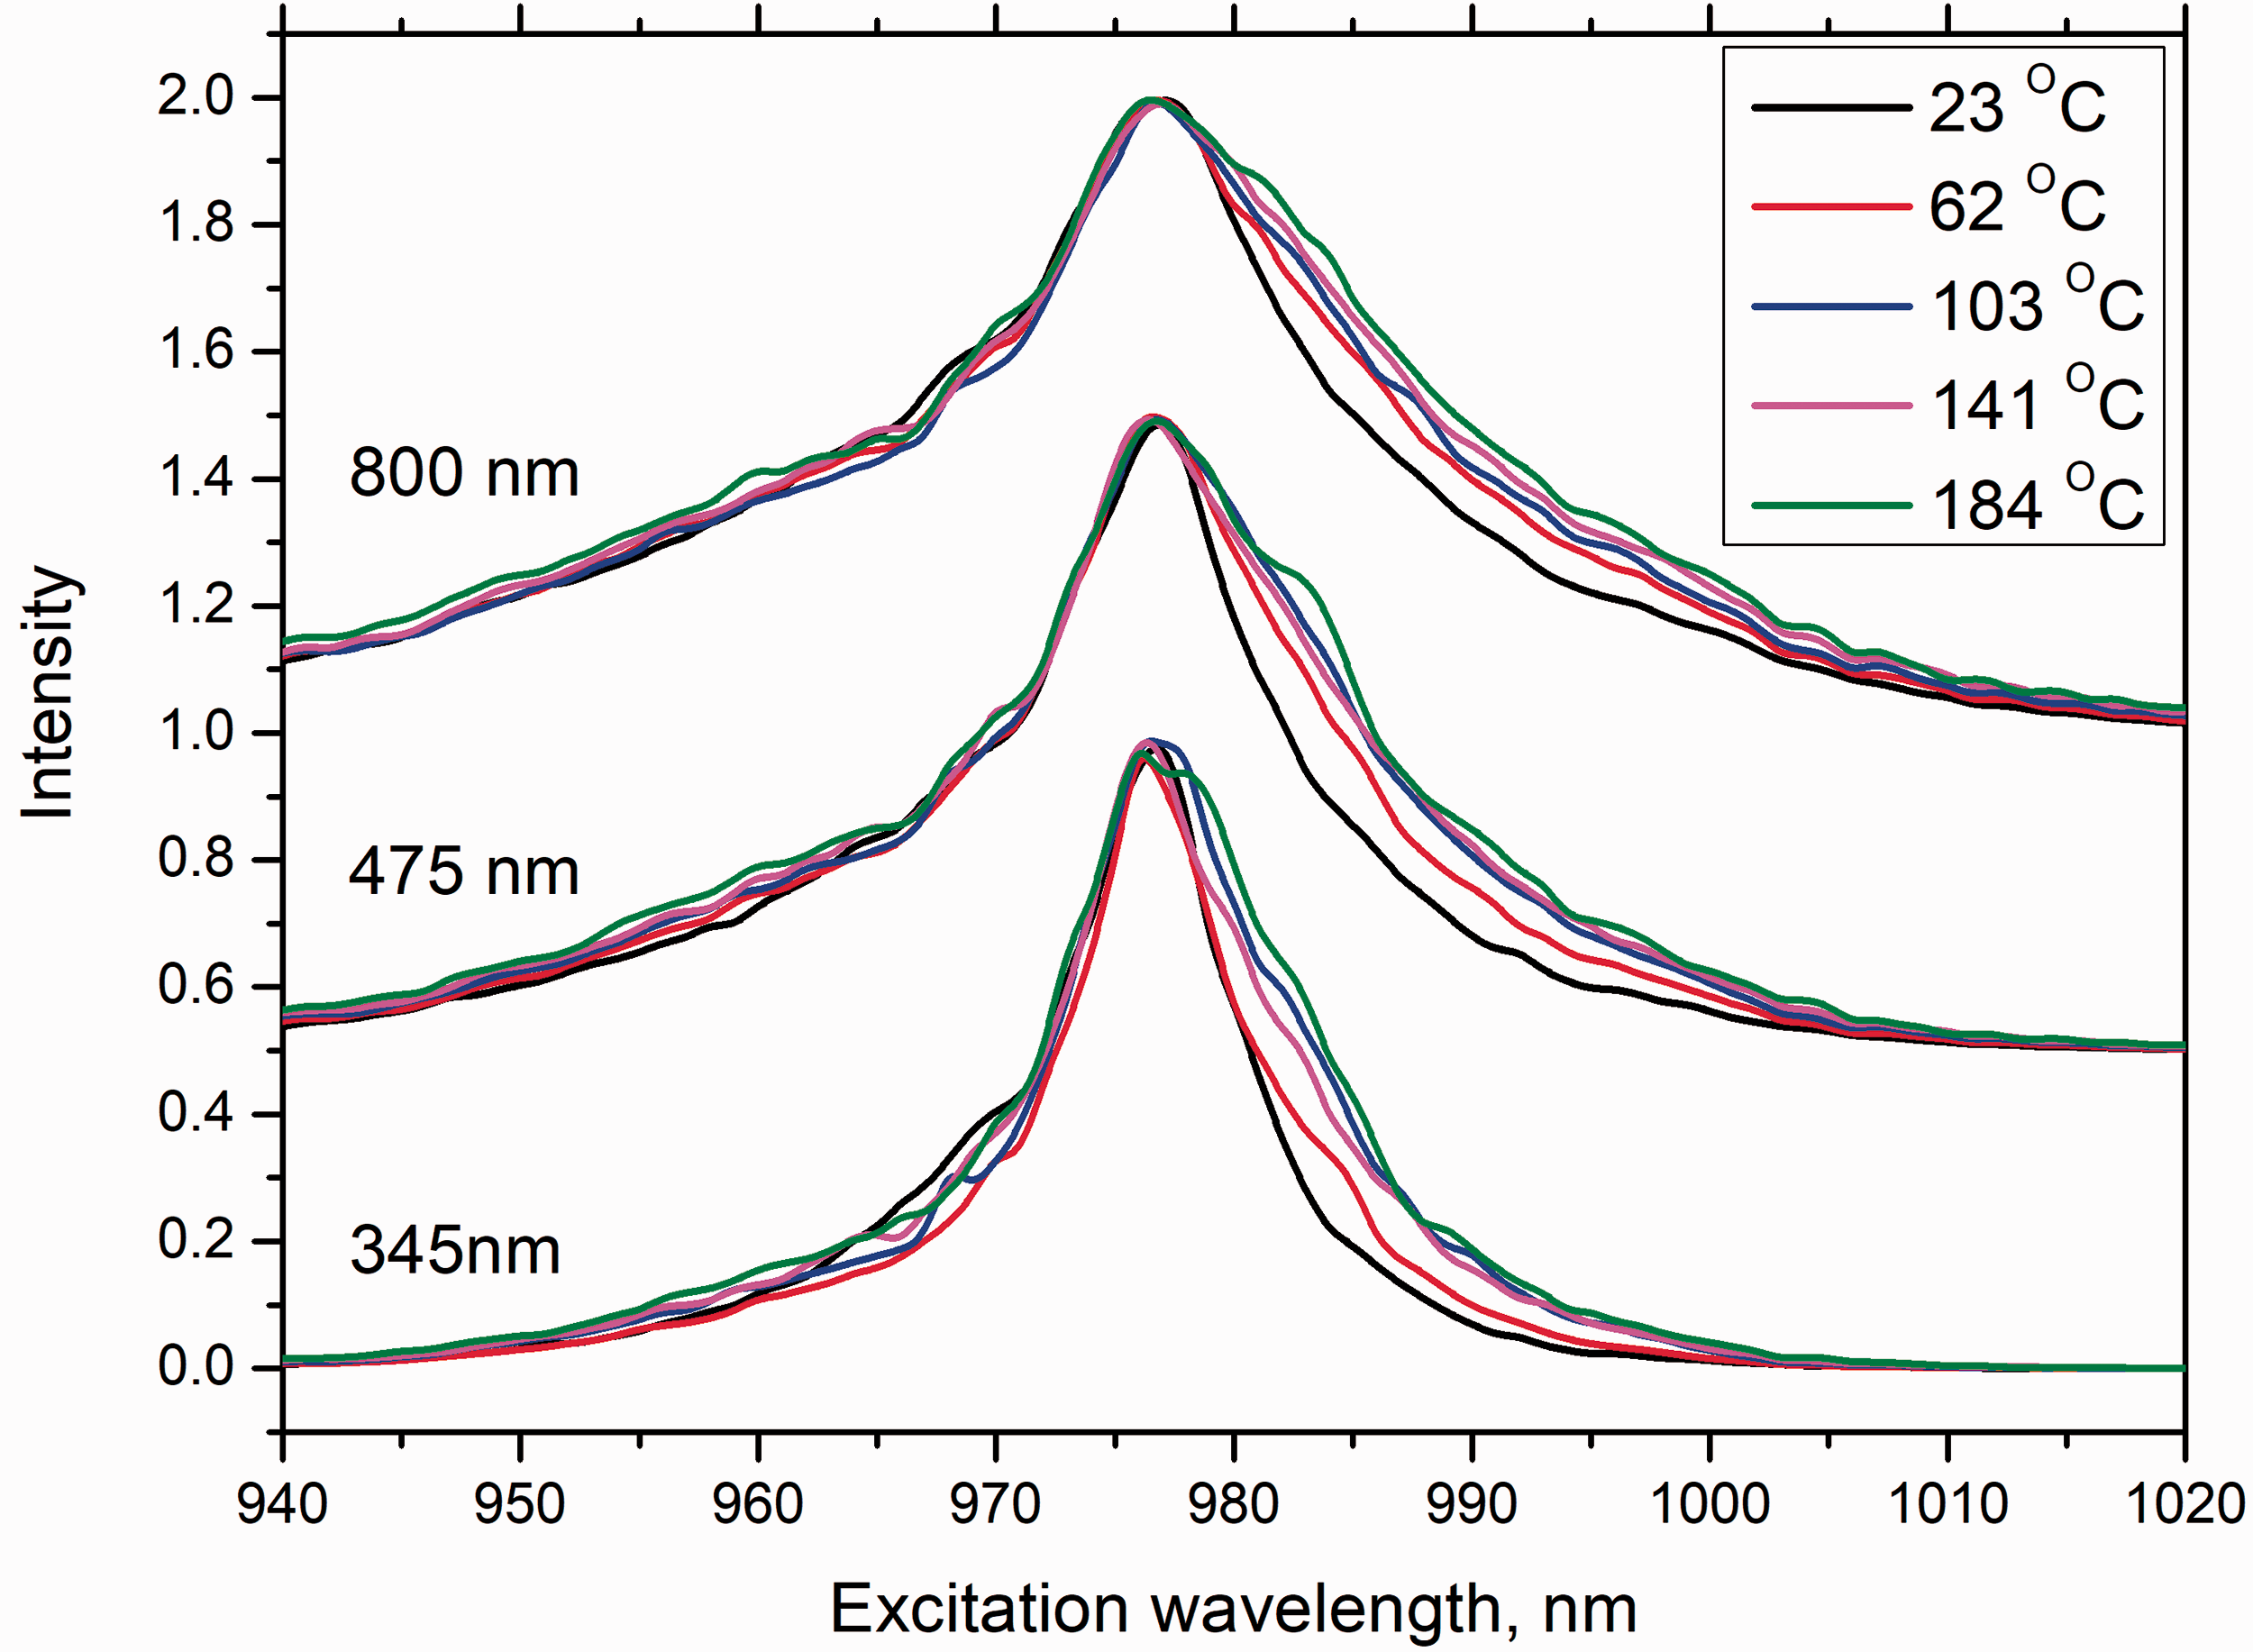
Up-conversion luminescence kinetics measurements for most intensive luminescence bands at different temperatures are shown in Fig. 6. All observable up-conversion luminescence kinetics become “faster” when the sample temperature is increased. Because of the transition probability of
3
P0,
1
D2,
1
G4, and 3H4 states is not affected by temperature, variation in up-conversion luminescence kinetics within temperature could be attributed to the temperature effects on the energy transfer process from Yb3+ to Tm3+. Up-conversion luminescence kinetics of NaLaF4:Tm3+ (0.1 mol%), Yb3+ (2 mol%) for 345 nm, 362 nm, 450 nm, and 475 nm luminescence bands under 976 nm excitation at different temperatures. Excitation spectra were acquired using tunable impulse laser.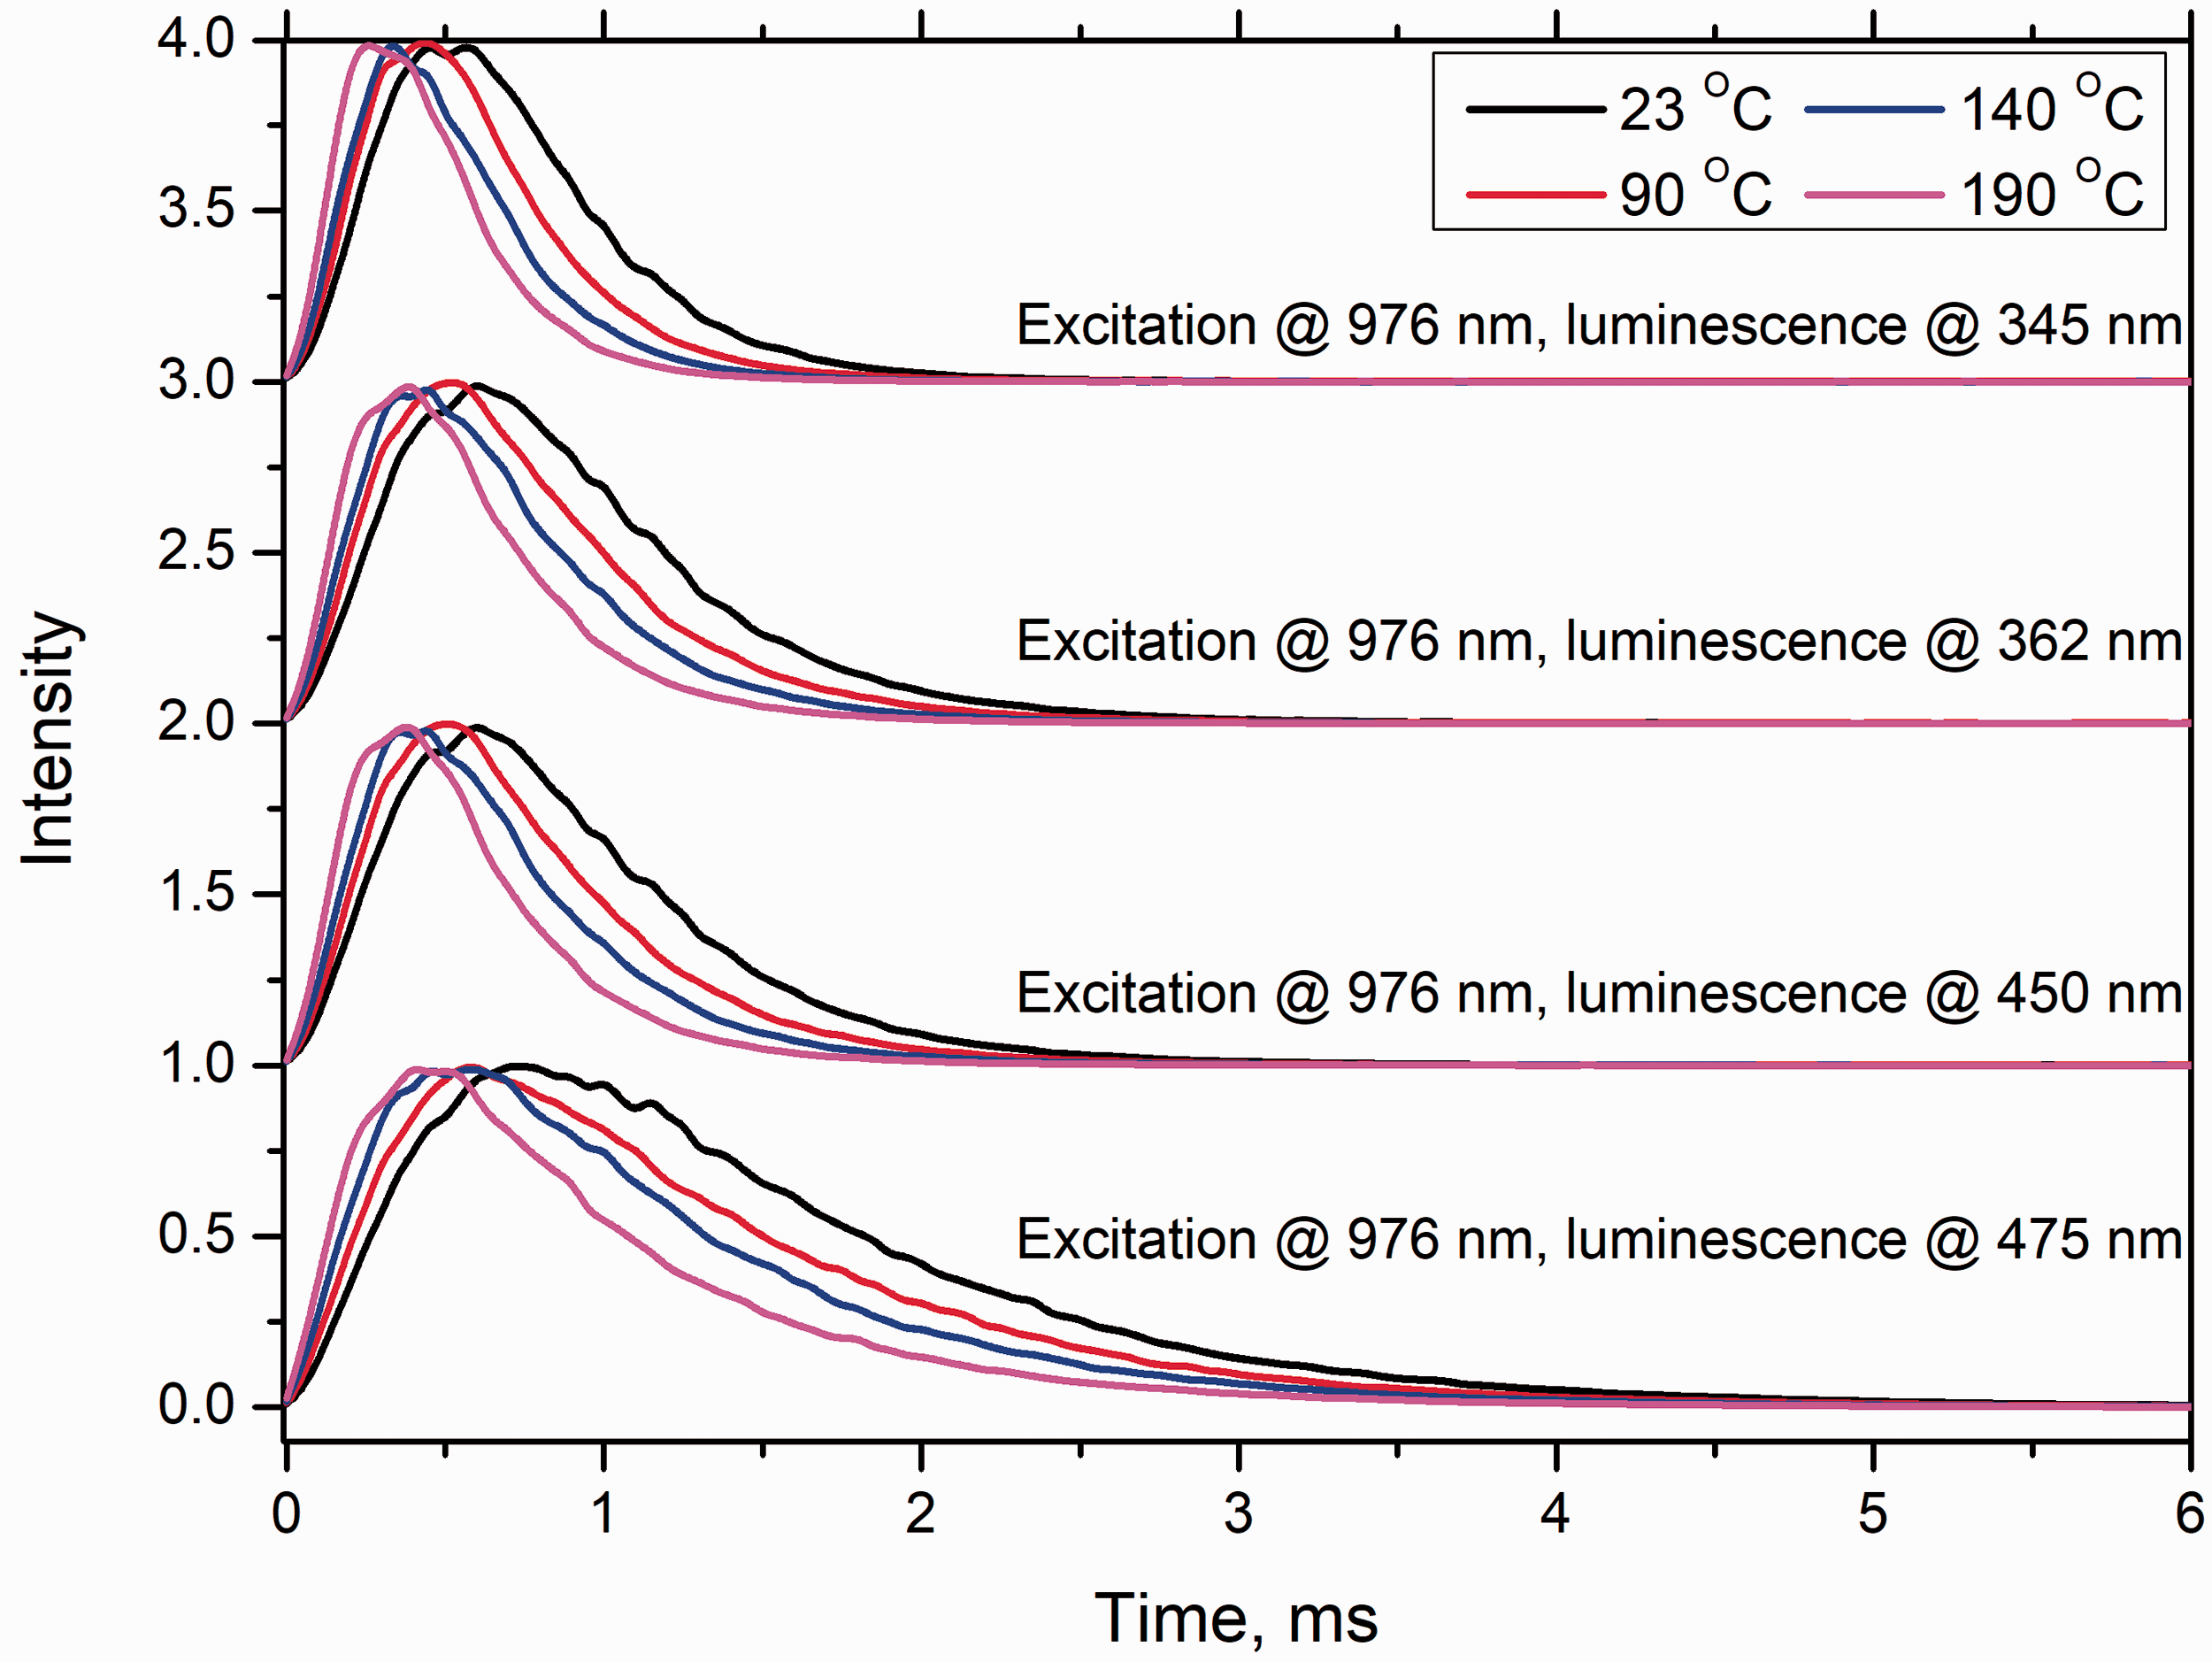
Experimental results in this section clearly show that up-conversion luminescence spectra for synthesized NaLaF4:Tm3+,Yb3+ depends on sample configuration for spectroscopic measurements (Figs. 2 and 4). The slightly covered heater head contains only a fraction of synthesized material. In addition, applied polycrystalline grains were in good thermal contact with the heater head, which act like a heat sink when the heater is not turned on. As a result, any generated heat due to infrared excitation radiation is removed. Therefore, intensive up-conversion luminescence bands from the 3 P0 and 1 D2 states were observed. When the heater is turned on, applied polycrystalline grains start to heat up and up-conversion luminescence spectra start to vary. With an increase of heater temperature, up-conversion luminescence spectra (Fig. 4) start to tend to resemble the pressed powder sample up-conversion luminescence spectra (Fig. 2). Because only temperature was varied (the excitation power density was kept constant), it allowed for the conclusion that the pressed powder sample exposed to heating due to high-excitation-power density reduced up-conversion luminescence intensity, particularly from the 3 P0 and 1 D2 states.
When analyzing up-conversion luminescence spectra in Tm3+- and Yb3+-doped samples, temperature effects need to be considered, which could be changed intentionally through the use of a heater or inadvertently through heating from excitation radiation. In some of the literature it is shown that samples in nanoparticle or thin film form have an intensive up-conversion luminescence from the 3 P0 and 1 D2 states, and the increase of intensities for these up-conversion luminescence bands is related to the nano form of the materials.26,27 Based on the results obtained from experiments described in this manuscript, the heating effect from excitation radiation needs to be considered. Temperature for samples in macro-powder form increases after intensive infrared excitation radiation absorption. One possible explanation might involve an insufficient heat sink. Compared to macro-powder nanoparticles, thin films have a smaller number of “active” particles and therefore a smaller part of infrared excitation radiation is absorbed that prevents the material from heating up. In addition, nanoparticles are usually dispersed in solutions, and thin films are applied onto some substrates. The solution for nanoparticles and substrates for thin films acts like a heat sink, therefore the heating effect is less pronounced.
Conclusion
Under direct excitation of NaLaF4:Tm3+, luminescence bands can be observed in wide spectral region, related to a radiative transition from excited 3 P0, 1 D2, 1 G4, and 3H4 states to lower states. When analyzing 450 nm and 740 nm luminescence bands, it needs to be taken into consideration that each of these two luminescence bands are related to two Tm3+ transitions: The luminescence band at 450 nm is related to 1 D2 → 3 F4 and 3 P0 → 3H5 transitions, and the luminescence band at 740 nm is related to 1 D2 → 3 F2 and 3 P0 → 1 G4 transitions. For the 3 P0 and 1 D2 states, Tm3+ concentration (0.01–2 mol%) effect is minimal, while for the 1 G4 and 3H4 states Tm3+ concentration effect is more pronounced.
Ultraviolet and blue up-conversion luminescence of NaLaF4 doped with Tm3+ (0.1 mol%) and Yb3+ (2 mol%) was observed under infrared excitation. It was concluded that the main up-conversion mechanism is subsequent energy transfer from Yb3+ to Tm3+, with 976 nm as the most appropriate excitation wavelength to efficiently excite all Tm3+ states. Long exposure of infrared excitation radiation leads to heating up of a sample and reducing up-conversion luminescence intensities, especially from 3 P0 and 1 D2 states.
Experimental results described in this manuscript show that up-conversion luminescence spectra depend on the prepared sample configuration for spectroscopic measurements. This information might be crucial when analyzing up-conversion luminescence processes and it is therefore necessary to include this information in the manuscript about sample condition for spectroscopic measurements. In the scientific literature, this kind of information often is not provided.
Supplemental Material
sj-pdf-1-asp-10.1177_00037028211045424 - Supplemental material for Up-Conversion Luminescence Processes in NaLaF4 Doped with Tm3+ and Yb3+ and Dependence on Tm3+ Concentration and Temperature
Supplemental material, sj-pdf-1-asp-10.1177_00037028211045424 for Up-Conversion Luminescence Processes in NaLaF4 Doped with Tm3+ and Yb3+ and Dependence on Tm3+ Concentration and Temperature by Jurgis Grube: on behalf of the ChiOTEAF Registry Investigators in Applied Spectroscopy
Footnotes
Declaration of Conflicting Interests
The author(s) declared no potential conflicts of interest with respect to the research, authorship, and/or publication of this article.
Funding
The author(s) disclosed receipt of the following financial support for the research, authorship, and/or publication of this article: This research is funded by the Latvian Council of Science, project “Up-Conversion Luminescence Photolithography in Organic Compounds Using Nanoparticles/Photoresist Composition”, project No. lzp-2019/1-0422. Institute of Solid State Physics, University of Latvia as the Center of Excellence has received funding from the European Union’s Horizon 2020 Framework Programme H2020-WIDESPREAD-01-2016-2017-TeamingPhase2 under Grant Agreement No. 739508, project CAMART 2 .
Supplemental Material
The supplemental material mentioned in the text, consisting of Figs. S1 to S3, is available in the online version of the journal.
References
Supplementary Material
Please find the following supplemental material available below.
For Open Access articles published under a Creative Commons License, all supplemental material carries the same license as the article it is associated with.
For non-Open Access articles published, all supplemental material carries a non-exclusive license, and permission requests for re-use of supplemental material or any part of supplemental material shall be sent directly to the copyright owner as specified in the copyright notice associated with the article.