
Abstract
The diagnosis of pulmonary fat embolism (PFE) is of great significance in the field of forensic medicine because it can be considered a major cause of death or a vital reaction. Conventional histological analysis of lung tissue specimens is a widely used method for PFE diagnosis. However, variable and labor-intensive tissue staining procedures impede the validity and informativeness of histological image analysis. To obtain complete information from tissues, a method based on infrared imaging of unlabeled tissue sections was developed to identify pulmonary fat emboli in the present study. We selected 15 PFE-positive lung samples and 15 PFE-negative samples from real cases. Oil red O (ORO) staining and infrared spectral imaging collection were both performed on all lung tissue samples. And the fatty tissue of the abdominal wall and the embolized lipid droplets in the lungs were taken for comparison. The results of the blind, evaluation by pathologists, showed good agreement between the infrared spectral imaging of the lung tissue and the standard histological stained images. Fourier transform infrared (FT-IR) spectroscopic imaging significantly simplifies the typical painstakingly laborious histological staining procedure. And we found a difference between lipid droplets embolized in abdominal wall fat and lung tissue.
Keywords
Introduction
Pulmonary fat embolism (PFE) is typically characterized by the occlusion of lung capillaries by fat globules released from the bone marrow and soft tissues. 1 In the forensic context, this condition mostly occurs approximately 24 h following the pelvis and long bone fractures, or soft tissue crushing caused by blunt trauma.1–4 However, burns, liposuction, sickle cell disease, extracorporeal circulation surgery, and parenteral fat infusion have also been reported to cause this condition.5–11 After a traumatic incident, fat droplets enter systematic circulation and reach pulmonary vessels or capillaries through the right heart. Respiratory dysfunction and serious neurological complications can be caused by the embolization of these fat droplets. 2 This may lead to fatal PFE immediately or very soon after with a few heartbeats. It is of great significance to detect PFE in the forensic context as it can be regarded as the main cause of death or as a contributing factor, collaborating with hypovolemic shock, burning, and right heart failure. Additionally, PFE may be used as a proof of vitality suggesting that a victim had active blood circulation at the time of an incident or at least shortly after the incident. 1
Fat emboli are hard to detect in an autopsy because there are few signs visible to the naked eye, and special staining techniques are necessary for histopathological confirmation of fat in lung tissue. Traditional histology relies heavily on expert interpretation of the staining patterns produced by chemical contrast agents. Tissue staining is an important part of modern clinical practice because it is extremely difficult to distinguish the structure and morphology of unstained tissues12,13 PFE diagnosis is often made by histopathological exam nation with conventional hematoxylin and eosin (H&E) staining and some special staining (e.g., Sudan III, Sudan IV, Sudan Black B, and ORO).14–17 However, there are several problems with these special staining methods: (i) the staining process is relatively laborious and time-consuming, and often generates a large amount of toxic waste; (ii) skilled laboratory technicians are required, and the results from different laboratory platforms can vary; (iii) histochemical diagnosis methods do not allow simultaneous staining of various markers and analysis of tissue sections. Therefore, there is an urgent need to develop an objective, environmentally friendly and repeatable approach for in-depth PFE diagnosis and research. 18
In the last decade, tremendous growth has occurred in research activities in the field of biomedical Fourier transform infrared (FT-IR) imaging.19–25 The FT-IR technique is based upon the absorption of infrared light through vibrational transitions in covalent bonds. This principle can be applied to the qualitative (location of peaks) and quantitative (intensity/area of peaks, relative intensity) analysis of samples. Since image contrast is based on the vibrational characteristics of tissue components, FT-IR does not require the use of labels, stains, or dyes. An FT-IR imaging system could directly produce pseudocolor maps from different spectral parameters. Another advantage of this technique is that these images can be compared with the results of standard histological staining schemes or can be interpreted by nonspectroscopists.26–28
Additionally, the conventional IR imaging system has limitations in that it is very time-consuming to collect individual spectra over large areas of tissue. Furthermore, the spatial resolution is limited due to the low throughput of small aperture infrared light. Focal plane array technology (FPA) addresses these issues. An FPA is made up of many small individual detectors arranged in a grid pattern, where each detector (pixel) in the array is capable of simultaneously collecting data from a specific sample area within the field of view Using an FT-IR spectrometer connected to a microscope and an FPA detector, thousands of spectra can be collected in a few minutes. Furthermore, since the microscope directly images the sample in plane on the detector array, the need for an optical aperture is eliminated. The spatial resolution is dramatically improved. This provides a powerful molecular imaging tool for pathology.20,29,30
Therefore, the authors here propose a new method based on the focal plane array (FPA) FT-IR microspectroscopic technique to detect and stain fat droplets in the small vessels and capillaries of the lung.
Materials and Methods
Ethical Issues
The relevant ethical approval was obtained from the ethics committee of the Institute of Forensic Sciences, Ministry of Justice, China. All cases selected for this work were subjected to forensic autopsies requested by the prosecutor. All tissue specimens were uniformly anonymized prior to analysis.
Sample Collection
For this study, 30 formalin-fixed human lung tissue and adipose tissue specimens were collected from 30 real cases in the Department of Forensic Pathology, Institute of Forensic Medicine, Ministry of Justice. There were 15 cases each in the PFE-positive and PFE-negative groups. To determine the sensitivity and specificity of FT-IR for detecting PFE, we selected a control group of 15 cases without PFE based on histological evaluation of lung specimens from autopsy as reported in the autopsy protocol. The diagnosis of the cause of death was confirmed by two professional forensic pathologists through forensic autopsy (including gross morphological, histological, and toxicological examination), circumstances of death, medical history, and exclusion of other possible causes of death.
Sample Preparation
For each lung tissue sample, one part was used for frozen sections, and the other was used for sections after paraffin embedding. Two 10 μm-thick sections of adjacent lung tissue were prepared using a frozen sectioning machine. Frozen sections were obtained at a temperature of −18 °C to −22 °C. One section was deposited on an infrared transparent calcium fluoride (CaF2) slide, and the other was mounted on a conventional glass slide for IR imaging and ORO histological staining for paraffin-embedded tissue blocks, 4 μm-thick sections were cut using a microtome and transferred onto conventional glass slides for hematoxylin/eosin (HE) histological staining. For each adipose tissue, a 10 μm-thick section was cut using a frozen sectioning machine and then placed on an infrared transparent CaF2 slide for IR spectral collection.
HE Staining
Regarding the HE staining procedure, sections were stained with the standard HE pathology procedure. In brief, sections were deparaffinated in xylene (2 × 10 min) and then washed in 90% and 70% ethanol for 1 min in turn before rehydration. The sections were then stained with hematoxylin (5 min), rinsed in distilled water (5 min), rinsed with 0.1% hydrochloric acid in 70% ethanol, rinsed in running tap water for 10 min, stained with eosin for 2 min, and then rinsed in running water. The slides were dehydrated with 70% and 90% ethanol in turn, followed by the application of xylene (2 × 5 min) and coverslips. 31
Oil Red O (ORO) Staining
Saturated ORO stock solution was added to distilled water at a ratio of 3:2, mixed and left to stand at room temperature for 10 min. This solution was used after filtering with filter paper. To perform the ORO staining, the slices were immersed in ORO solution for 5 min, washed in distilled water for 30 s, covered with Mayer’s hematoxylin for 1 min, and washed in running water for 30 s, and coverslips with glycerol were applied.
FPA FT-IR Imaging and Data Preprocessing
A Hyperion 3000 FT-IR imaging system (Bruker, Germany) was used for this experiment. The detector of the IR microscope was a liquid nitrogen-cooled 64 × 64 FPA detector. Each focal plane pixel represents to an area of 2.6 × 2.6 μm2. The software-controlled x,y stage allows precise stitching of FPA images. FT-IR spectra were obtained in transmissive mode with 64 co-additive scans and a spectral resolution of 4 cm−1. The FPA detector used in the Hyperion 3000 can simultaneously measure up to 16 384 spectra, covering a sample area of up to 340 × 340 μm. 2 A Happ–Genzel apodization function was applied in the Fourier transformation. Transmission infrared spectra were recorded between 4000 cm−1 and 800 cm−1 After every six images, a new background image was collected (128 co-additive scans) and averaged to compensate for small fluctuations in the environment. The spectra recorded in transmission mode were converted and displayed as absorbance using the in-house Bruker Optics Opus eight software (Bruker). Both the sections stained with oil red O and that imaged by FPA FT-IR were evaluated by pathologists. The spectra were first smoothed (nine smoothing points). Then baseline correction was performed, and vector normalization was performed to resolve sample thickness differences. The C-H stretching band (3000–2800 cm−1) and the C=O stretching band mode of the fatty acid ester (1745–1725 cm−1) were integrated to obtain the spectra and colored in the images according to the IR intensity.
We selected lipid regions, non-lipid regions, and abdominal wall adipose tissue in IR imaging to extract spectra, Three spectral data were extracted for each sample. Next, to enhance the visual recognition of the overlapping spectral bands and provide better classification discrimination, the spectral dataset was smoothed (nine smoothing points) then converted to second-order derivatives and finally normalized using extended multiplicative signal correction (EMSC). 32 This data will be used for principal component analysis (PCA).
Data Analysis
Principal component analysis (PCA) is a widely used unsupervised multivariate analysis algorithm. Its purpose is to reduce dimensionality of the dataset and transform the original variables so that several new variables become linear combinations of the original variables. At the same time, these variables should express as many data characteristics of the original variables as possible without losing information. The coefficients of the linear equations constituting the principal components (PCs) are described as loadings, which are usually used to explain the contributions of the variables. PCA transforms the data into a new coordinate system so that the largest variance of any data projection is at the first coordinate (PC-1), the second largest variance at the second coordinate (PC-2), and so on. The new variables obtained by the transformation are orthogonal and uncorrelated with each other, eliminating the overlap of a large amount of coexisting information. We selected lipid regions, non-lipid regions, and abdominal wall adipose tissue in IR imaging to extract spectra, three spots per sample were selected for PCA analysis. In this study, PCA analysis of smoothed, second derivatives and EMSC corrected spectra was performed using spectral ranges of 3000–2400 cm−1 and 2300–2900 cm−1. 32 The best PCA classification results were obtained using this preprocessing procedure. The classification outcome is visualized on a two-dimensional score plot along PC-1 versus PC-2, and the contribution of variables is represented by corresponding PC-loadings.
Software
Spectral data preprocessing and analyses were performed using Matlab R2016a (The MathWorks, Inc., USA) equipped with an MIA Toolbox 1.0 (Eigenvector Research, USA).
Results and Discussion
The results of the HE staining are given in Fig. 1. With HE staining, the microscopic examination of the lungs shows marginalization and optical vacuolization of red blood cells within capillaries and small arteries. The significant lumen dilation of pulmonary capillaries and vessels can be inferred to be the result of occlusion by fat globules due to dissolution by organic solvents. We then performed oil red O staining of the lung tissue. The staining results are shown in Fig 1. In the lung specimens, there is red free fatty material on the oil red O stain in the pulmonary vessels. In addition, the free fatty material has penetrated into the vessel wall. The microscopic morphology of the sample shows clear and intact structures. (a) Hematoxylin eosin staining (100×), (b) hematoxylin eosin staining (300×) showing small fat vacuoles in the blood vessels of lung tissue, (c) ORO and hematoxylin-stained sections from one representative sample (magnification 40×), and (d) ORO and hematoxylin-stained sections from one representative sample (magnification 100×).
The FT-IR results show large differences between the absorbances of the C=O stretching band of fatty acid esters (1745–1725 cm−1) around certain blood vessels of lung tissue and the C–H lipid-like region (3000–2800 cm−1), indicating a higher lipid component here. As shown in Fig. 2. The high wavenumber region is mainly dominated by lipid-associated vibrations. The significant increase in relative absorbance of the 3000–2800 cm−1 and 1745–1725 cm−1 spectral bands may be associated with higher lipid content. We obtained serial sections of lung tissue one stained with oil red O and one infrared imaged using FT-IR spectroscopy. The results are shown in Fig. 3. (a) FT-IR spectra measured in the region with high fat content. (b) FT-IR spectra measured in the region of normal fat content. (a and d) Micrographs of oil red O-stained tissues adjacent to FT-IR measurements. (b) Integral imaging of the C=O stretching band (in the range of 1745–1725 cm−1). (e) Integral imaging of the stretching vibration bands of CH2 and CH3 (in the range of 3000–2800 cm−1). (c) Comparison of the oil red O-stained region with the lipid band (1745–1725 cm−1) integral map at 50% optical opacity. (f) Comparison of the oil red O-stained region with the lipid band (3000–2800 cm−1) integral map at 50% optical opacity.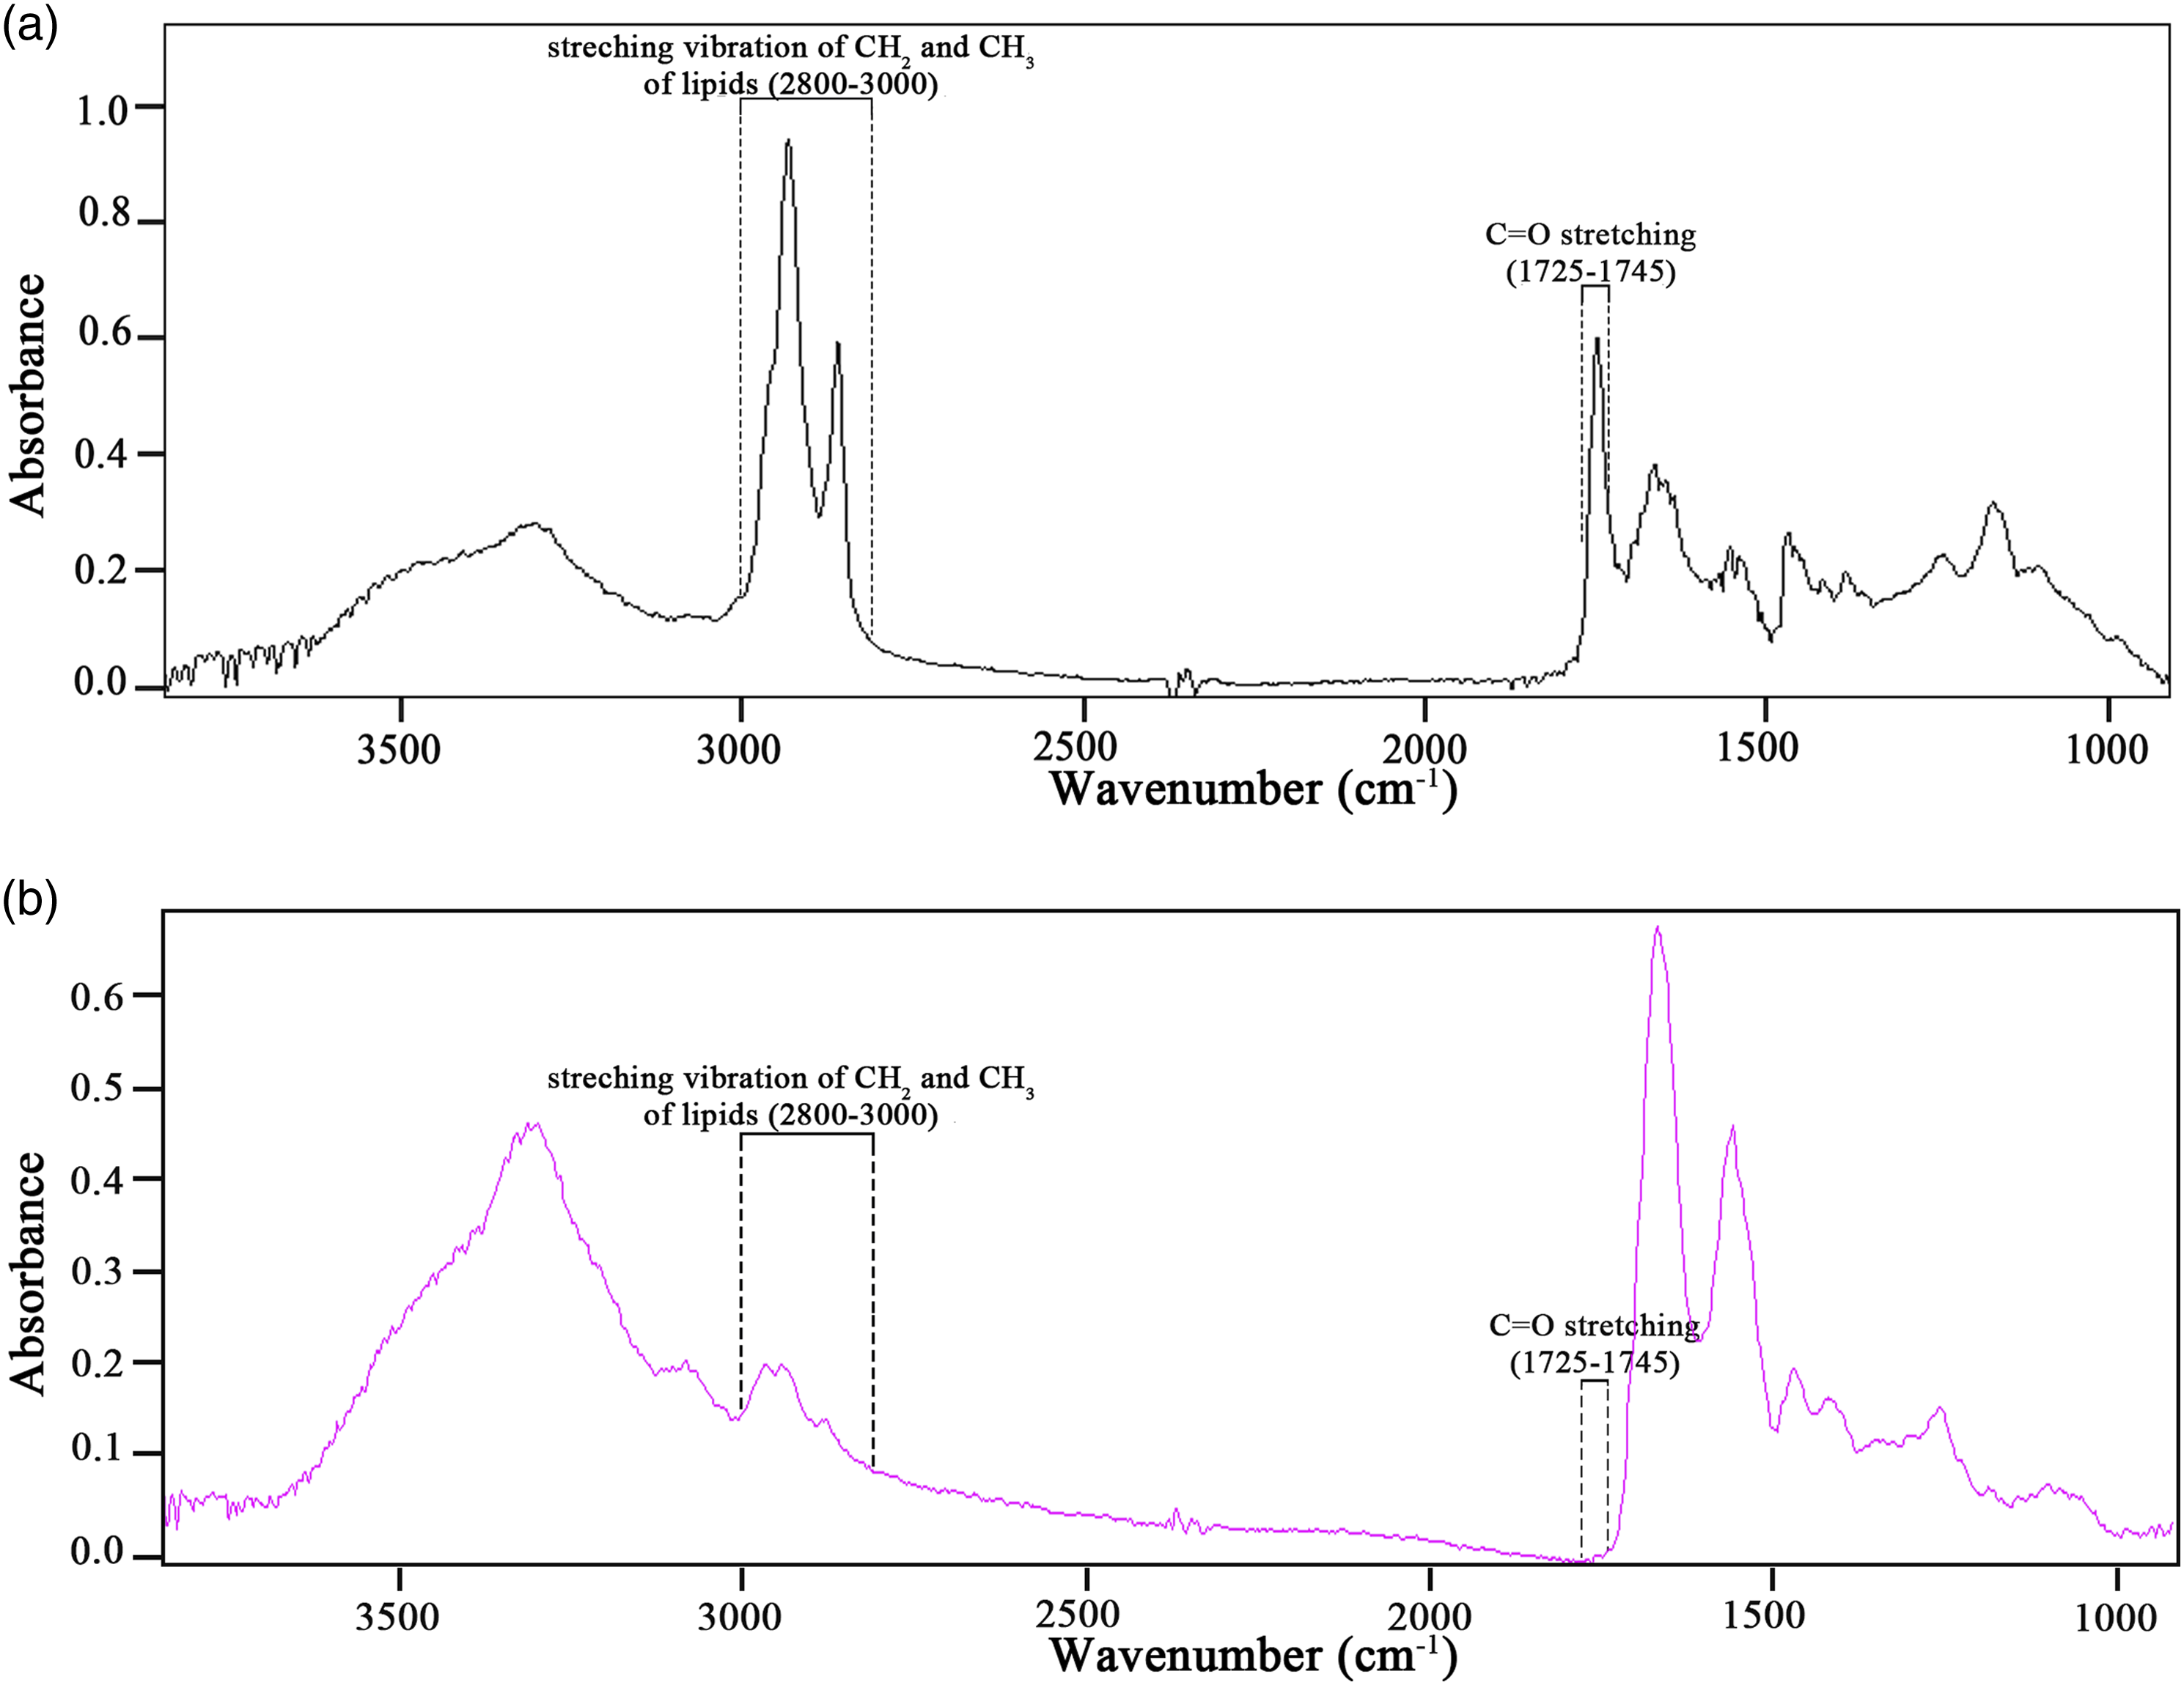

Infrared imaging and ORO staining of the tissues were achieved by serial sectioning. Integration imaging was performed with the IR spectra in the 3000–2800 cm−1and 1745–1725 cm−1 bands. A control group, PFE-negative lung tissue, was also analyzed. The infrared imaging results can be seen from the infrared imaging results and no fat component was found. The results are shown in Fig. 4. (a) Micrographs of oil red O-stained tissues adjacent to FT-IR measurements. (b) Integral imaging of the C=O stretching band (in the range of 1745–1725 cm−1). (c) Integral imaging of the stretching vibration bands of CH2 and CH3 (in the range of 3000–2800 cm−1).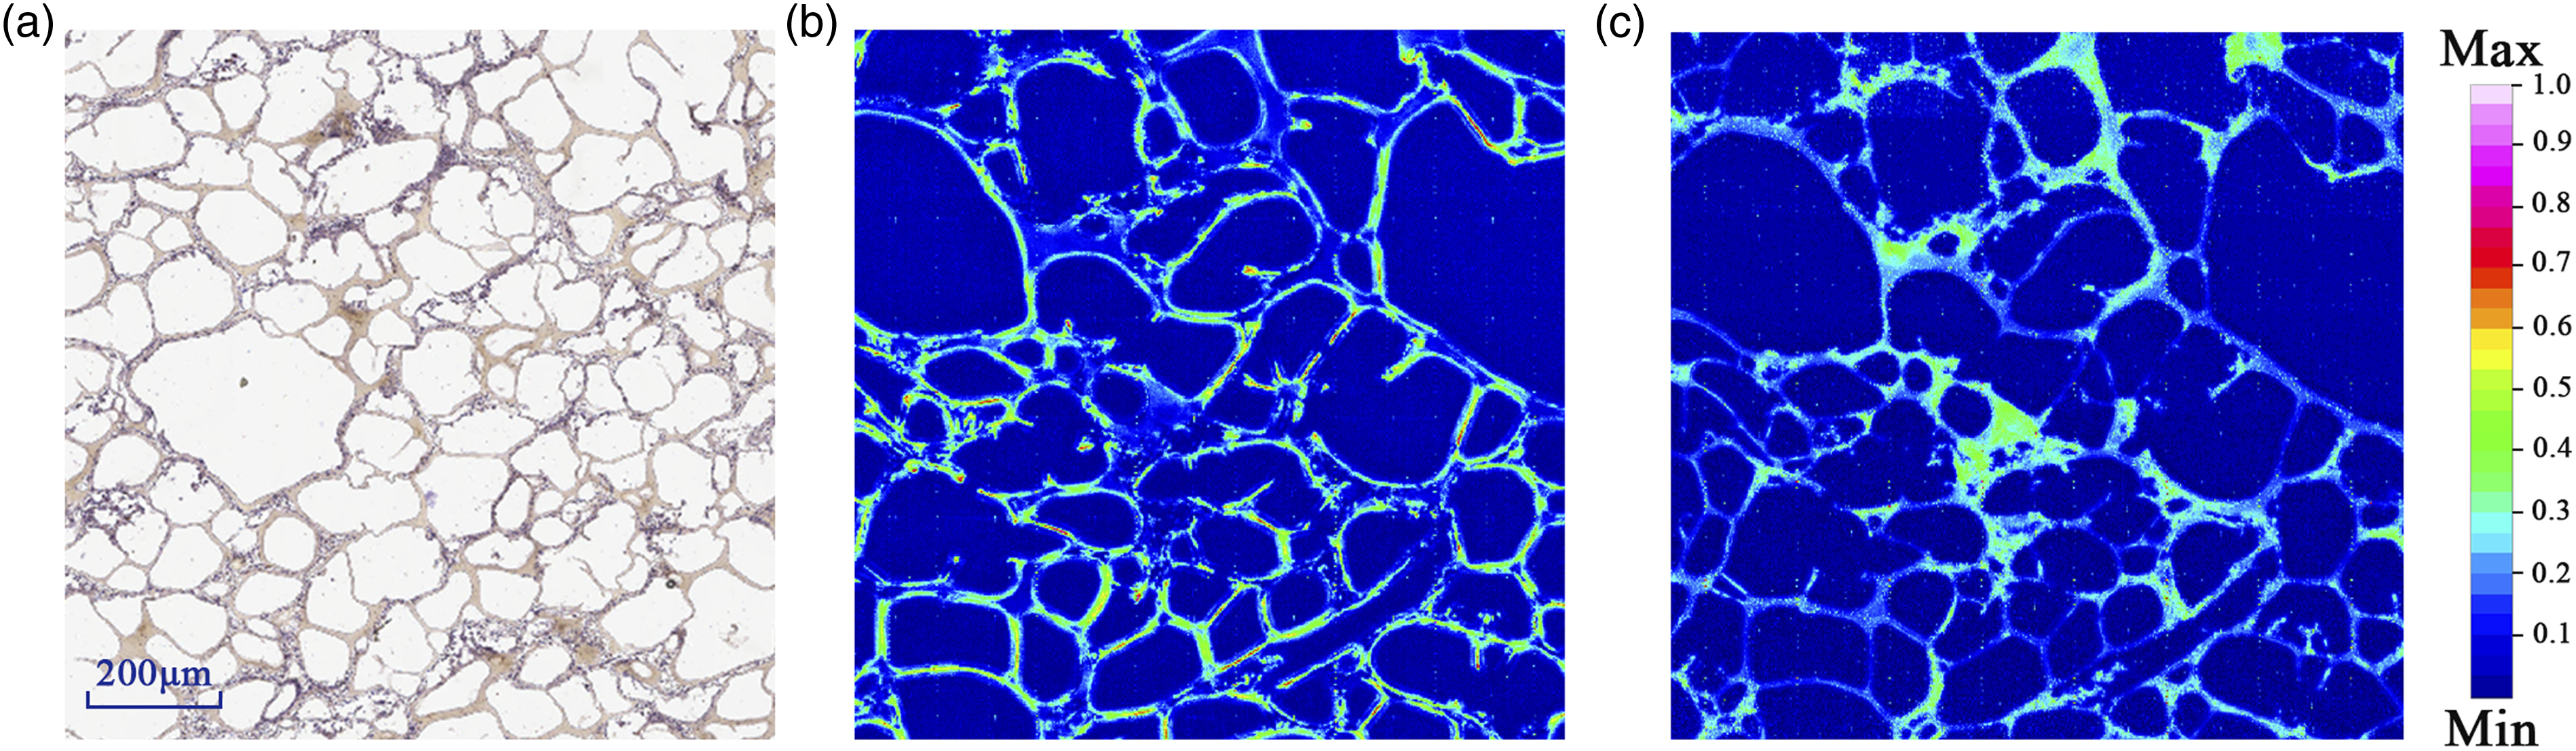
The chemical treatment of the tissue during the staining process may have the potential to cause some degree of distortion and tearing of tissue section. It can be observed that the positive area of oil rad O staining matched well with the high intensity areas integrated by the spectra of 1745–1725 cm−1 and 3000–2800 cm−1 regions.17,33–36 However, the 3000–2800 cm−1 band contains lipids, carbohydrates, nucleic acids, and other substances, So the image is slightly worse after integration in this band. The contribution of other substances at 1745–1725 cm−1 is smaller, so the imaging effect is better.17,30,34 This is also illustrated by the results of the negative control group. We can see that the integral imaging map in the 1745–1725 cm−1 band basically corresponds to the staining results of oil red O, while the 3000–2800 cm−1 band is slightly less effective than compared to the integral imaging of the 1745–1725 cm−1 band.17,33,34,37
In the next step, principal component analysis (PCA) was used to differentiate the biochemical characteristics of adipose tissue, PFE-positive lung samples and PFE-negative lung samples in the spectral range of 3000–2400 cm−1 and 2300–900 cm−1. The PCA results from the preprocessed spectra, presented in the form of scores and loading plots for PFE-positive samples, PFE-negative samples, and adipose tissue, are shown in Fig. 5a. A relatively satisfactory difference can be observed between the PFE-negative samples group and the other two groups in the PC-1 direction, which accounts for 83.47% of the total variation, and suggests that PC-1 identified from the spectral dataset is the main reason for the distinction. The lipid droplets are closer together in the PC-1 direction in adipose tissue and pulmonary fat embolism, which proves that the composition of the two is more similar. It is worth noting that the actual prestressed concrete loads are reversed positive and negative due to the use of second-order derivative spectra throughout the data analysis. According to the PCA score plot it can be found that both PFE-negative and PFE-positive samples are tightly aggregated, probably because the main component of both groups is the lipid component, which is more stable and similar in composition. However, differences exist between lipid droplets and adipose tissue in the vasculature when the fat globules enter the pulmonary vascular system, where they are broken down into free fatty acids, leading to an inflammatory response in the apparent microvasculature of acute lung injury.
3
Results of PCA applied to the preprocessed spectra of PFE-positive samples, PFE-negative samples, and adipose tissue, showing (a) a PC-1 versus PC-2 score plot and (b) a PC-1 loading plot.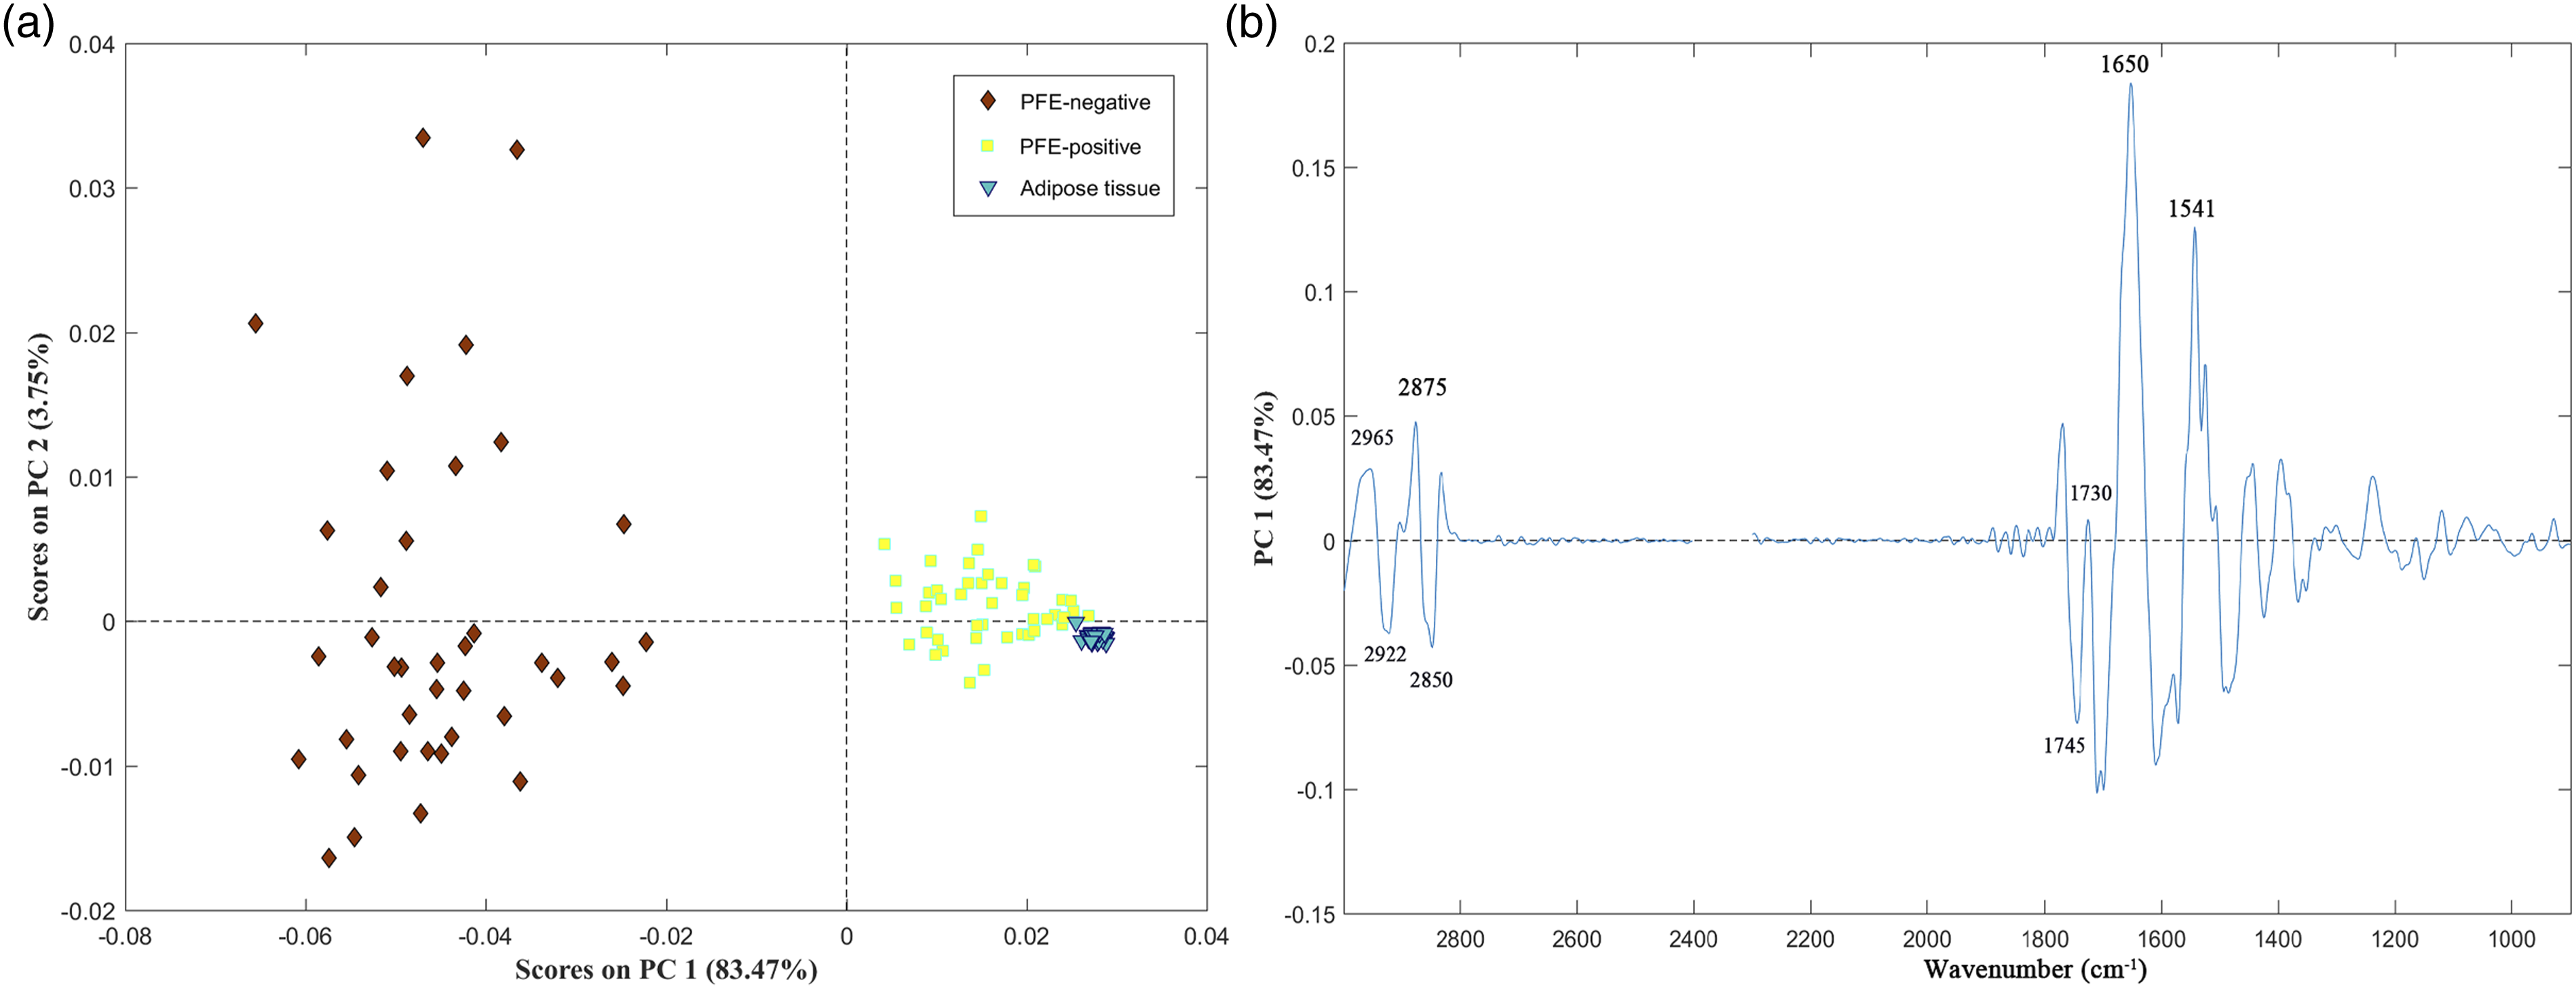
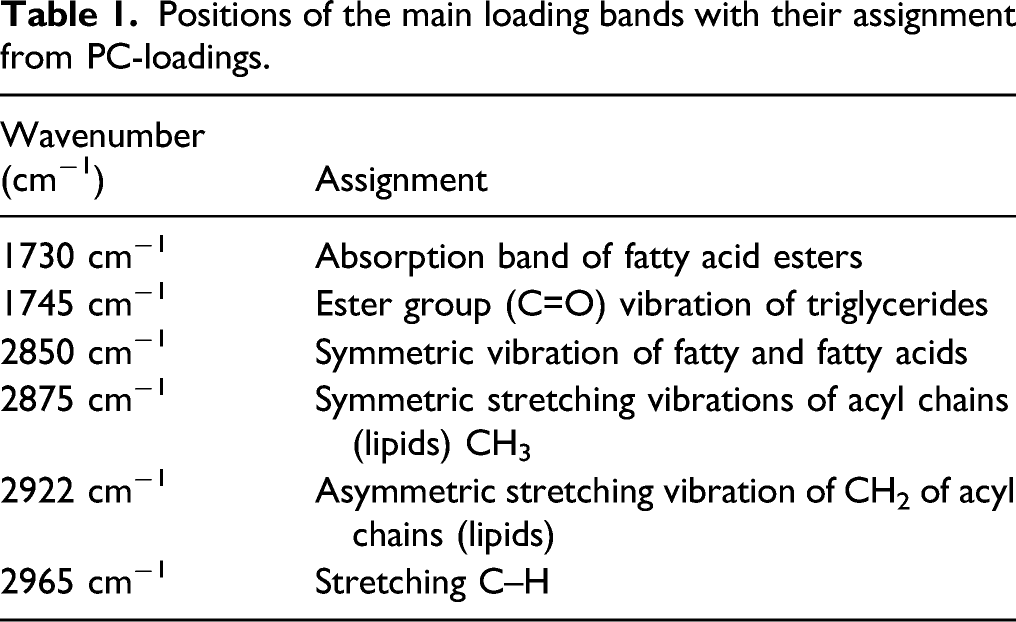
Positions of the main loading bands with their assignment from PC-loadings.
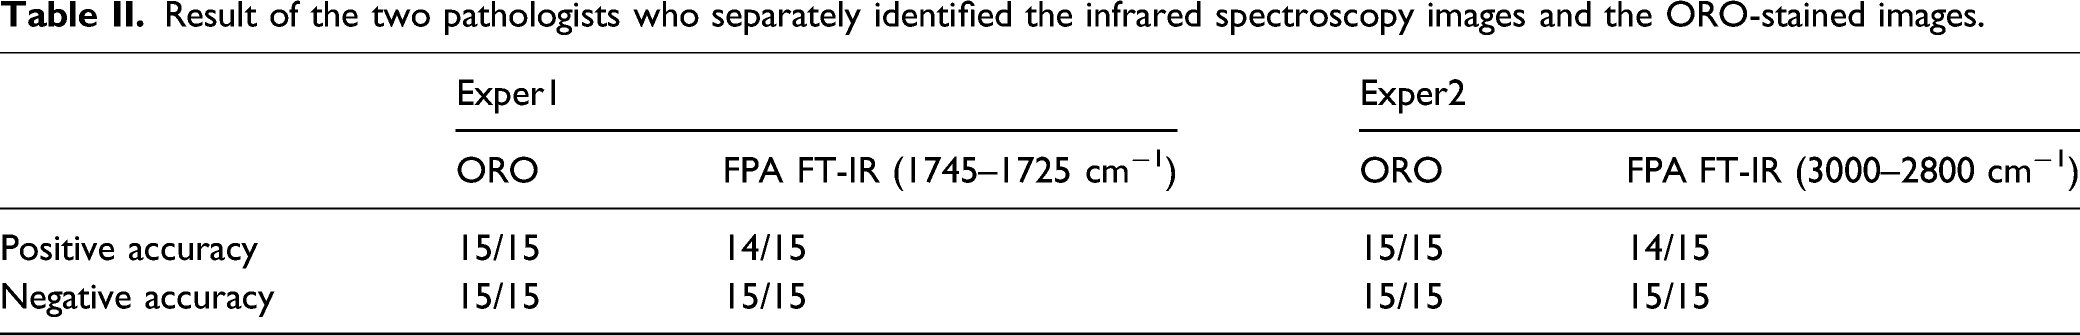
Result of the two pathologists who separately identified the infrared spectroscopy images and the ORO-stained images.
However, there are still many drawbacks to the current identification method for pulmonary fat embolism. First, some forensic pathologists exhibit some bias in reading and evaluating tissue sections. Second, traditional HE staining methods remove fat when processing tissue. Although pathologists can infer the presence of free lipid droplets by finding clear circular spaces within the lumen of the vessel, the detection rate is reduced due to the removal of fatty tissue. The use of fat stains (ORO, Sudan III, etc.) has improved the diagnostic rate. The detection rate was shown to increase from 79% to 93% with ORO staining. 38 However, the ORO staining method still has many shortcomings. The tissue staining process is time-consuming and laborious due to differences in staining procedures, and imaging equipment. Pathologists are highly subjective, and the quality of the images after tissue staining varies. During slide staining and washing, the lipid droplets tend to deflect or diffuse into nearby alveolar and interstitial tissues due to being loose bound to the surrounding lumen, leading to false-negative results. The staining process results in challenges for developing standard and rapid tissue image analysis systems.
Fourier transform infrared spectroscopy has many advantages. First, infrared spectroscopy is essentially an analytical method for determining the molecular structure of substances and identifying compounds based on information such as the relative vibrations between atoms within molecules and molecular rotation, with high specificity and sensitivity. Second, these images are easy to generate and, from a spectral point of view, easy to interpret. The obtained chemical images can be analyzed by non-pathologists. In addition, the chemical imaging obtained by this method can better show the free lipid droplets in the pulmonary vasculature with clear boundaries. In addition, the operational steps are simple, no complex processing of the tissue is required, and the imaged tissue can be used for other experiments; thus, this method is nondestructive.29,35,36
As FT-IR spectroscopy is increasingly used as part of forensic investigations, it is particularly important to determine the utility of this method. The present study demonstrates the high sensitivity and accuracy of FT-IR spectroscopy for the histological diagnosis of positive PFE. However, this study has some limitations. First, the results are based on a small sample, as samples are difficult to obtain; the present experiment used only 15 samples of pulmonary fat embolism. Second, the histopathological results used as a reference standard may be biased because the specimens were prepared after a long period of formalin fixation. Third, although there was a large proportion of lipids in the band of interest, other components accounted for a certain proportion and the specificity needs to be further improved. In future studies, it will be necessary to increase the experimental sample size. Additionally, because of the limitation of experimental conditions, the long bone marrow was not studied in this experiment. Nevertheless, to meet the need of practical forensic work, this method requires further investigation with respect to the possible effects of autolysis and putrefaction on the detection outcomes of FT-IR spectroscopy.
Conclusion
Focal plane array Fourier transform infrared microspectroscopy can be used to show fat emboli in fine pulmonary arteries in pulmonary fat embolism. Our findings highlight the use of the FPA FT-IR method as a diagnostic tool for identifying the distribution of adipose emboli in lung tissue. Combined with chemometric methods, the spectroscopic approach provides high precision and sensitivity for detecting fat emboli. In the future, the use of FPA FT-IR microspectroscopy-based imaging systems may become a routine method for diagnosing tissue sections, facilitating their application in forensic practice.
Footnotes
Acknowledgements
The authors appreciate helpful discussions with Dr Kai Zhang. Qi Cheng contributed equally to this work.
Declaration of Conflicting Interests
The author(s) declared no potential conflicts of interest with respect to the research, authorship, and/or publication of this article.
Funding
The author(s) disclosed receipt of the following financial support for the research, authorship, and/or publication of this article: This work was supported by grants from the National Natural Science Foundation of china (82072115, 81801873 and 81671869), the Ministry of Finance (No. GY2020G-2), the Science and Technology Committee of Shanghai Municipality (No. 17DZ2273200 and 19DZ2292700), and Open project of Key Laboratory of Forensic Expertise of the Ministry of Justice (KF202010).