
Abstract
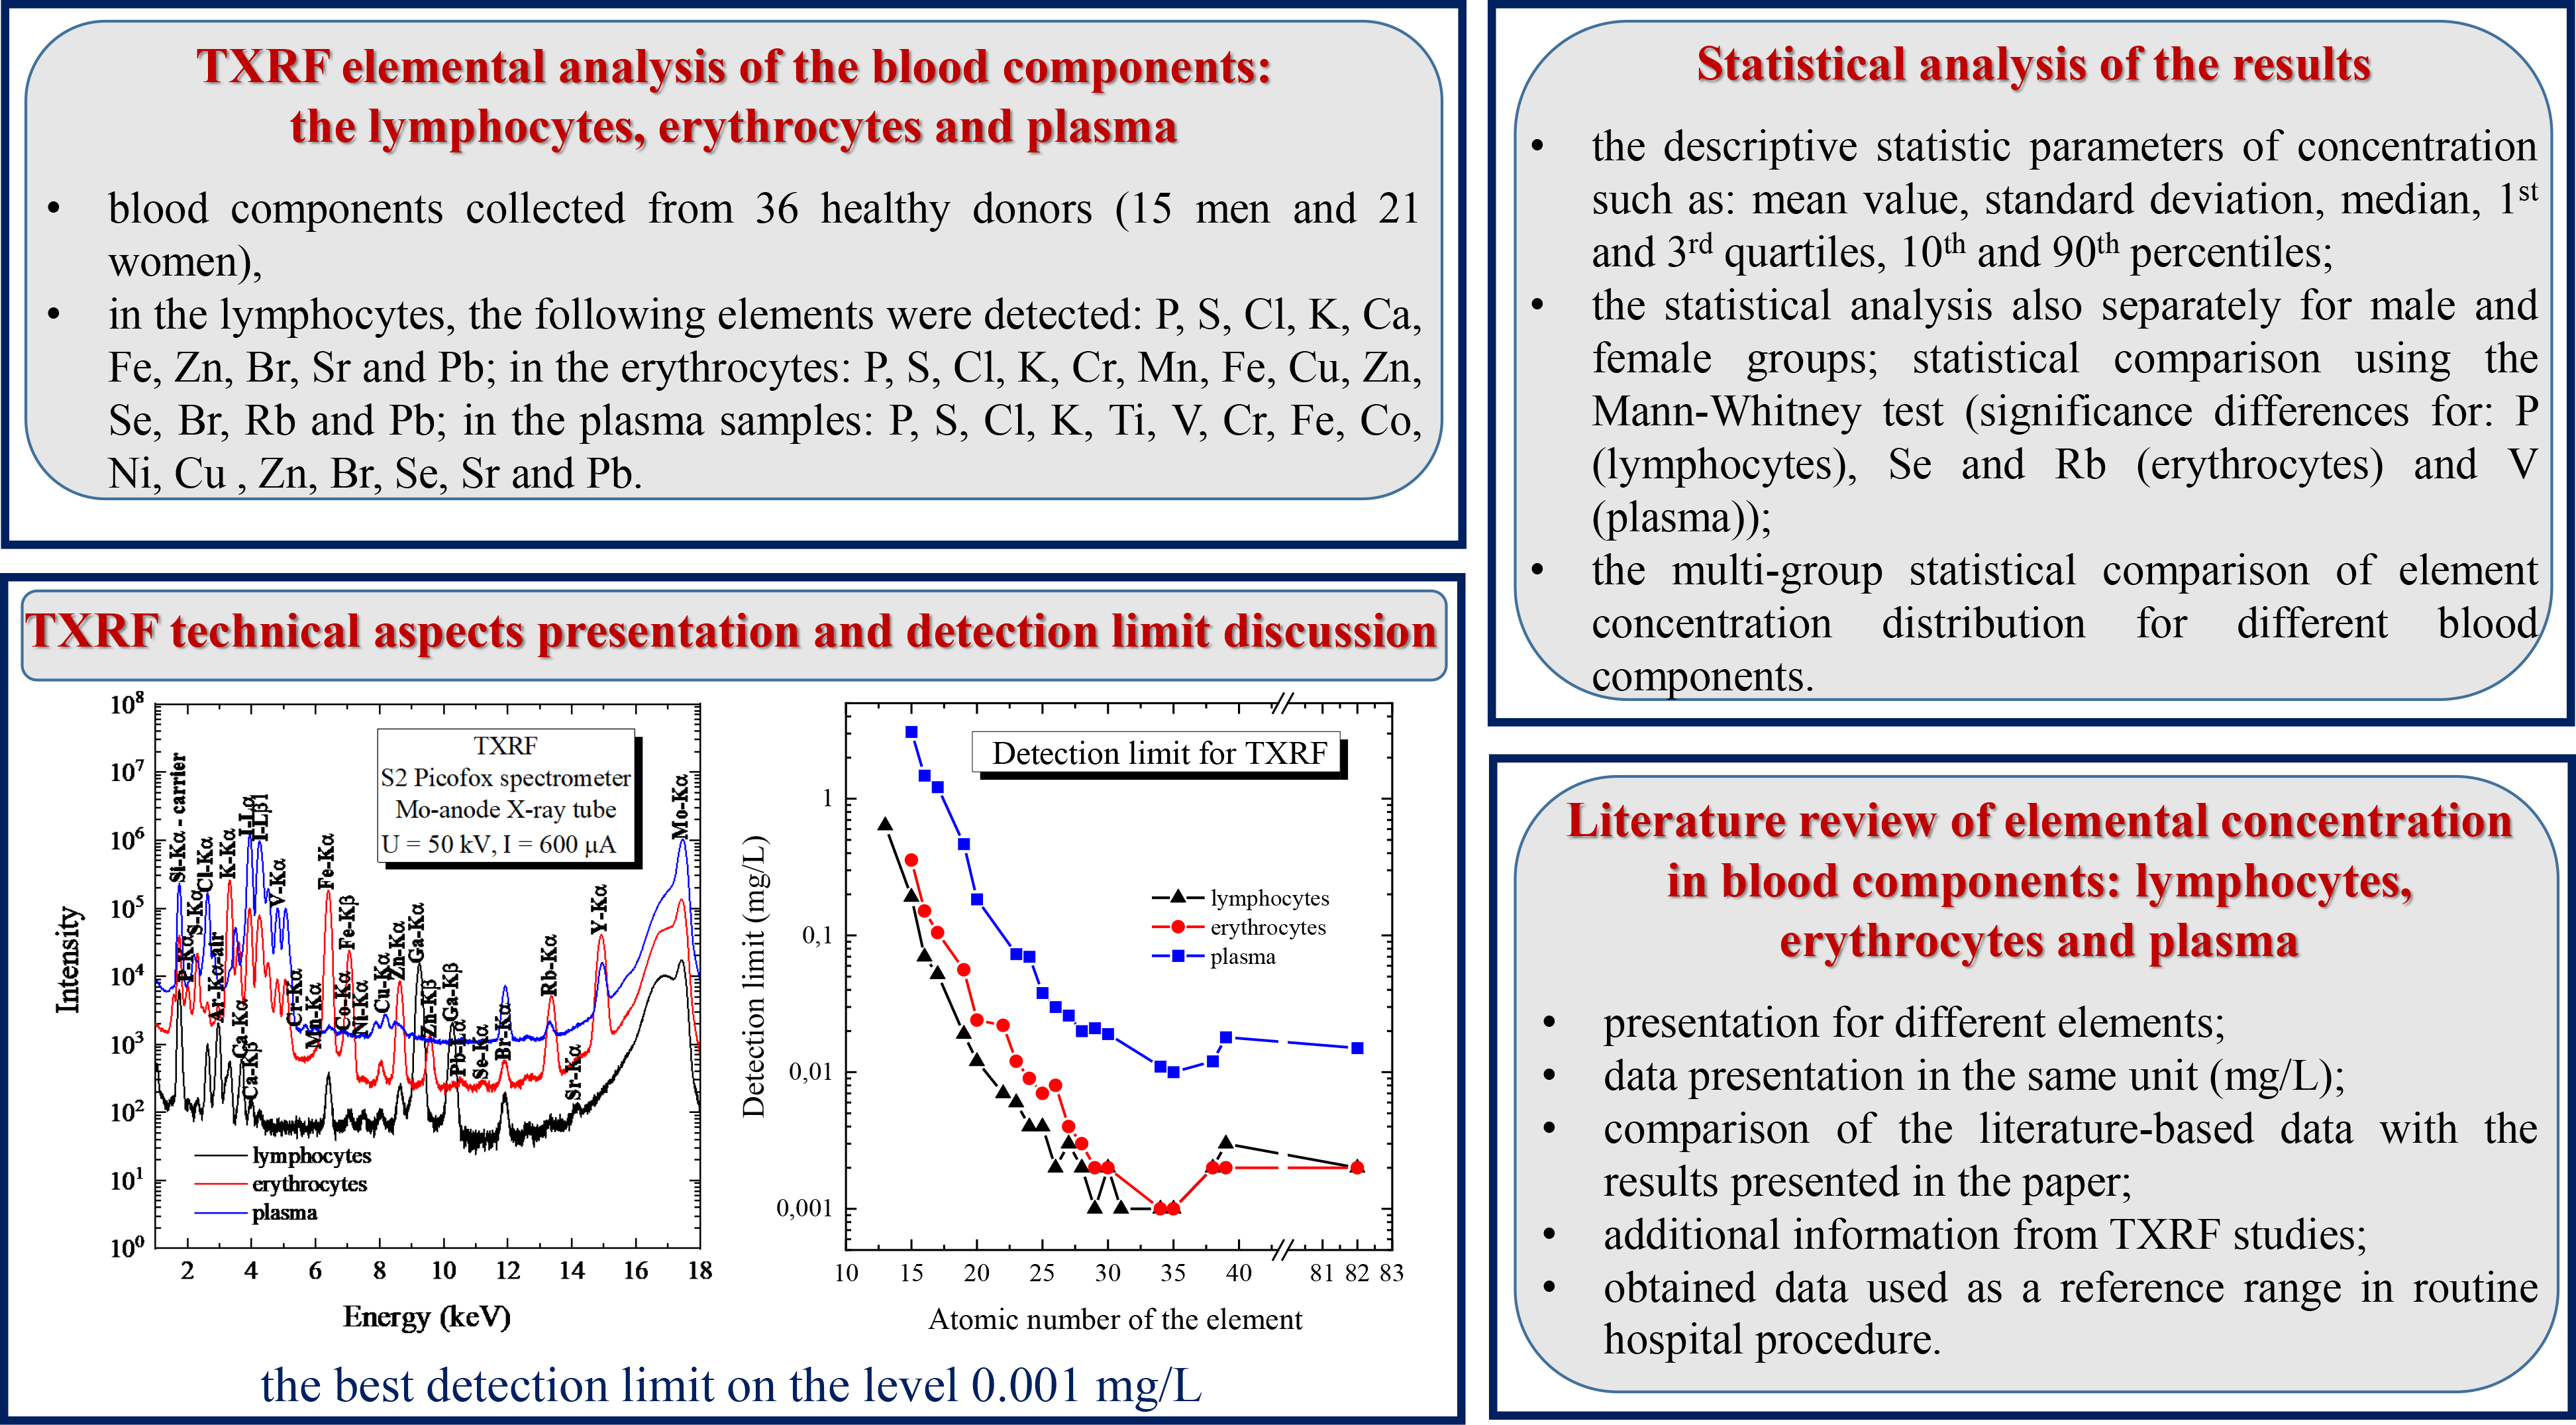
In this article, the total reflection X-ray fluorescence (TXRF) analysis was used for determination of element concentrations in three isolated peripheral blood components: lymphocytes, erythrocytes, and plasma, collected from 36 healthy donors (15 men and 21 women) from eastern Poland. The studied blood components were isolated from whole peripheral blood using Histopaque-1077 density gradient centrifugation. In the lymphocytes, the following elements were measured: P, S, Cl, K, Ca, Fe, Zn, Br, Sr, and Pb. In the erythrocytes: P, S, Cl, K, Cr, Mn, Fe, Cu, Zn, Se, Br, Rb, and Pb, while in the plasma samples: P, S, Cl, K, Ti, V, Cr, Fe, Co, Ni, Cu, Zn, Br, Se, Sr, and Pb. The descriptive statistics parameters of concentration such as: mean value, standard deviation, median, first and third quartiles, 10th and 90th percentiles were calculated for all samples of the studied blood components, as well as separately for male and female groups. The measured element concentrations and calculated parameters can be used as the reference values. Element concentration distributions for male and female groups were statistically compared using the non-parametric Mann–Whitney test and statistical significance differences (α = 0.05) were found for: P (in lymphocytes), Se and Rb (in erythrocytes), and V (in plasma). The multigroup statistical comparison of element concentration distribution for different blood components was also done (Mann–Whitney and Kruskal–Wallis tests). The statistical tests show that the concentration levels are usually different, except in the following cases: Zn, Fe (lymphocytes and plasma, Fe only for female group), Cr (erythrocytes and plasma). The obtained concentration ranges were compared with literature-based data available for element concentration in lymphocytes, erythrocytes, and plasma. In this work, the application of the TXRF method allowed additionally for the simultaneous determination of the concentrations of such elements as: P, S, Cl, Br, Sr and Pb in lymphocytes, S, Cl and Br in erythrocytes, and P, S, Cl, K, Ti, Br and Pb in plasma. From an analytical point of view, the article describes in detail the measurement procedure including the isolation of blood components and samples preparation for TXRF measurements, and later the detection limit of the method is discussed.
Keywords
Introduction
Proper functioning of the human body is determined by the levels of macroelements and trace elements, which are involved in various enzymatic processes at the molecular cellular level. 1 A significant decrease or increase in both macroelements and trace elements suggests abnormalities in the functioning of internal organs or the existence of a pathogenic process. 2 Element concentrations are usually measured in peripheral blood serum, 3 and one of the reasons for this fact is the simplicity of obtaining research material by collecting a fluid that is clearly separated from the blood clot at a certain time (30–60 min) after taking blood from the donor. 4 Serum elemental analysis is performed routinely by our group in different applications.5–8 In these analyses, the total reflection X-ray fluorescence technique (TXRF) 9 is successfully applied.
In cases where there is strong time pressure to measure the concentrations of elements, peripheral blood plasma is used. The easiest method of obtaining it from the blood is to use the process of centrifuging whole blood, i.e., at 3500 × g for 5 min. 3 However, both plasma and serum measurements give an overall picture of the body condition, being in certain manner restricted, revealing changes only when the disturbances of the body activity were significant 10 and focusing attention on element concentrations occurring outside cellular components of the peripheral blood, including white and red blood cells as well as platelets. In addition, lymphocytes, monocytes, neutrophils, eosinophils, and basophils could be distinguished among white blood cells called leukocytes. 11 The concept of determining element concentrations in cellular components of blood appeared in the literature as early as the 1960s (with Geven et al. 12 ); these data indicate an initial disruption to the functioning of the body, 1 thus enabling action to be taken to prevent further deterioration in human health. Since then, research centers have conducted tests on the concentrations of elements, mainly in lymphocytes1,13–18 and erythrocytes,1,10,12–17,19–39 although granulocyte 1 and platelets1,25,40 data have also been obtained.
When testing peripheral blood cell components, it is necessary to implement a procedure to isolate each component from the blood. These procedures are very labor-intensive and time-consuming methods when compared to obtaining serum or blood plasma. However, this disadvantage is outweighed by the fact that the information obtained on the concentrations of elements allows for a much more accurate determination of the body condition,3,10,41,42 since the concentrations of elements in blood cellular components are not subject to temporary fluctuations in the same manner as in plasma. 25 Comparisons of element concentrations in peripheral blood cell components between different groups of people are possible when information on the concentrations of elements for healthy people is collected, and next used as the reference group. Reference data are indicative ranges of the element levels that are considered to correspond to the standard. Each laboratory needs its own reference data, due to the use of different methods for sample preparation, measurement, and analysis. 43 Reference data are important for a better understanding of data from clinical practice and effective control of various toxic exposures, and to broaden knowledge on the role of elements in health-related behaviors.17,43
The aim of the presented research was to measure the elemental concentration in the lymphocytes, erythrocytes, and plasma of 36 healthy human donors (15 men and 21 women) from the eastern part of Poland using total reflection X-ray fluorescence (TXRF) technique 9 and to determine reference values of element concentration in the discussed blood components. The TXRF technique 9 is known as a useful technique to analyze the human biological material samples5–9,44,45 and for simultaneously determining the content of many elements with a relatively low level of detection limit. In this method, X-ray radiation, usually coming from an X-ray tube, is used to irradiate the analyzed sample and induce the X-ray characteristic radiation of chemical elements present in the sample. Sample irradiation is performed under primary X-ray total reflection conditions, a unique geometry of the TXRF technique, 9 leading to detection limit at the level of 10–9 g/g. 9 Excited radiation is registered by the detection system and presented in the form of an X-ray spectrum. Spectrum analysis concentrates on the interpretation of the characteristic radiation energy (qualitative analysis), as this energy gives information about element in the sample from which the radiation was emitted, as well as on the radiation intensity, being proportional to the element concentration (quantitative analysis).
In the first part of the paper, the details of the experiment are presented, namely: blood sample collection, isolating individual blood components, sample preparation for TXRF measurements, and total reflection X-ray fluorescence method characteristics (detection limit values, measurement accuracy, measurement conditions, experimental uncertainty). In section of the experimental results and discussion, descriptive statistics of element concentration for the studied blood components are presented, including separate discussion for male and female groups. Statistical multigroup comparisons of element concentration distribution between different blood components are also discussed. A practical aspect of the presented paper is a systematic review of literature-based data in the context of concentration of elements in the lymphocytes, erythrocytes, and plasma samples.
Materials and Methods
Blood Sample Collection
Human blood was taken by qualified medical personnel at the Holy Cross Cancer Center, Kielce, Poland, using S-Monovette syringe for metal analysis (Lithium Heparin) 7.5 ml (no. 01.1604.400, Sarstedt) with the 21 G safety needle for metal analysis (no. 85.1162.400, Sarstedt). This set is dedicated to the collection of blood due to contamination level specified by the manufacturer at a maximum level equal to 70 ng/set for the following elements: Tl, Cd, Ni, Cr, Pb, Fe, Cu, Zn, Mn, Al, Se and Hg. Peripheral blood was collected from healthy donors (15 men and 21 women), based on the consent from the Bioethics Committee no. 12/2010 issued by the Świętokrzyska Chamber of Medicine, Kielce, Poland. The volunteers signed informed consent to carry out scientific research on the collected biological material.
After collection, the heparin sample tube with blood was transported to Jan Kochanowski University, Kielce, Poland, for separation of individual blood components.
Isolation of Individual Blood Components
The procedure for isolating individual blood components was taken from Prohaska et al.,14,15 Gallacher et al., 17 and Matsuda et al. 46 with some modifications. The first step after collecting blood in the heparin sample tube was gentle mixing of the blood by inverting the tube; 7 ml of blood collected was then divided into volumes of 1 ml and poured into polypropylene tubes that were free of metal (15 ml, no. 525-0460, VWR International). Then, 1 ml of saline (9 g/l NaCl) was added to each 1 ml of blood and they were mixed by shaking. The next step was to prepare 3 ml of Histopaque-1077 (no. 10771-500ML, Sigma-Aldrich, part of Merck Group) in new polypropylene sample tubes. Following this, 1 ml of blood was layered on the Histopaque in 500 µl aliquots. Tubes were closed and spun at 500 × g (relative centrifugal force or G-force) for 20 min. In this manner, the blood was stratified into three layers. The first layer (i.e., plasma) was removed and transferred to another sample tube using a Pasteur pipette. The second layer contained mononuclear cells, which were removed and transferred to another sample tube. This layer included lymphocytes, monocytes, and platelets. In turn, the third layer was Histopaque-1077, which was removed. Finally, the last layer contained red cells, consisting of erythrocytes and granulocytes. For the purpose of isolating lymphocytes from the mononuclear cells, 4 ml of NaCl was added to the mononuclear cells and centrifuged at 400 × g for 10 min. The supernatant was then removed, and this procedure was repeated three times. Subsequently, the contents were gently mixed in each tube and the contents of the seven tubes were drained into one. The sample was then centrifuged at 400 × g for 10 min, with the supernatant being removed and 1 ml of NaCl was added and mixed. The last step was to count the cells by taking 200 µl of this solution and adding 200 µl of trypan blue (no. T10282, Invitrogen). After mixing, 10 µl of the solution with trypan blue was taken and transferred to measuring slides (Countess Cell Counting Chamber Slides (no. C10312, Invitrogen) to use the Automated Cell Counter (no. C10227, Invitrogen).
Next, 5 ml saline was added to the red cells in order to isolate erythrocytes from the red cells, and the solution was centrifuged at 1200 × g for 10 min. This process was repeated three times. Erythrocytes were then counted using the same methodology as described above for the lymphocytes.
All three blood components, i.e., lymphocytes, erythrocytes, and plasma, were frozen at –20℃ for further preparation.
All materials used were washed three times in 0.9 mol/l nitric acid, washed three times in deionized water and dried. 47
Sample Preparation for TXRF Measurements
The TXRF technique requires a homogeneous sample in a liquid form. In the case of plasma, 5 ml of plasma was mixed in the preparation procedure with 0.3 ml of Y at a concentration level of 100 mg/L. Yttrium was added as internal standard, necessary in the TXRF technique to obtain qualitative results.
The preparation of lymphocytes and erythrocytes required microwave digestion in order to break down their structures. This process was carried out using the pressure vessel DAP-100, made of high-quality TFM (a chemically modified PTFE), and the standardized digestion procedure for handling biological material such as blood and its components recommended by the manufacturer of used microwave digestion system (Speedwave Entry).
In the first step of the preparation procedure, sample tubes with lymphocytes and erythrocytes were thawed and homogenized using a shaker. Next, 1 ml of the lymphocytes or erythrocytes was transferred to the pressure vessel. Next, 1 ml of physiological saline, 5 ml of 65% nitric acid (Suprapure, Merck), and 0.3 ml of an internal standard such as Ga or Y were added to the pressure vessel. The same proportions of compounds were added to individual containers, i.e., 1 ml of saline plus 5 ml of 65% nitric acid plus 0.3 ml of internal standard or 5 ml of 65% nitric acid plus 0.3 ml of internal standard or 5 ml of Histopaque-1077 plus 0.3 ml of internal standard. The aim was to check, using the same sample preparation procedure, elemental composition of physiological saline, internal standard, and Histopaque-1077, being potential source of elemental contaminants in the analysis of element concentration in lymphocytes and erythrocytes. After shaking and waiting for 20 min, the containers were next closed and inserted into the microwave digestion device. The microwave digestion procedure was then carried out for 5 min at 160℃ followed by 10 min at 190℃. Finally, the containers were removed from the microwave digestion device and allowed to cool for 30 min.
In order to determine elemental composition of the studied samples, the 2 µl solution of each sample of plasma, lymphocytes, and erythrocytes (after the microwave digestion process) was deposited onto three quartz glass sample carriers (siliconized using silicone solution SERVA in isopropanol for siliconizing glass and metal). Due to a very high sensitivity of the TXRF method, an important issue is cleanliness of the analytical sample carriers, which were washed twice in 10% nitric acid, rinsed twice in deionized water, and dried by rotation. Before sample deposition, the purity of cleaned quartz glass carriers was checked using TXRF method. The sample carrier was classified as clean when fluorescence line intensities related to the elements detected on the carrier surface were less than 150 counts in 500 s.
After depositing the sample on the clean carrier, the sample was dried in infrared light for 30 min. The drying sample process was slow, which ensured a homogeneous distribution of the elements in the dry residue.
Total Reflection X-ray Fluorescence Analysis
In the presented studies, a commercially available TXRF spectrometer S2 Picofox (Bruker) was used. In this spectrometer, the primary X-ray beam is emitted by a 30 W X-ray tube with a molybdenum anode, operating at 50 kV and a current of 600 µA. The X-ray beam is next directed on the quartz glass sample carrier, on which the sample was deposited, at an angle θ < θC (where the critical angle θC is about 0.1° for molybdenum Kα line energy). Fluorescence X-rays from the samples are detected with the Peltier-cooled XFlash silicon drift detector having energy resolution about 160 eV for Mn–Kα line. For the qualitative and quantitative analysis of the registered spectra of characteristic radiation, the Spectra 7 program, supplied with the spectrometer, was used. This software allows identification of characteristic radiation lines of appropriate elements in the full radiation spectrum and determination of the intensity of these peaks. In order to obtain quantitative results, the Picofox spectrometer must be earlier calibrated. This calibration is based on measurement of various elements concentration and their normalization to the known value of the internal standard concentration in the solution. The internal standard is a very rare element not present in the sample. As a result, an internal standard has to be added to each measured sample.
Each dry sample residuum was measured for 1 h. This measurement time was chosen because the concentrations of some elements were at the level of the TXRF detection limit and longer measurement time improves the limits of detection. Measurements were performed in air. Elemental composition of solutions used in the sample preparation procedure, i.e., saline, nitric acid 65%, internal standard, and Histopaque-1077 was also analyzed using TXRF technique with the same as for blood component samples, measurement conditions.
The Picofox spectrometer software calculates the experimental concentration uncertainty. This parameter is estimated from the standard deviation of the fluorescence peak area and converted, using calibration curve, to the concentration. Experimental uncertainty value depends on the element concentration value. For concentration higher than about 1 mg/L, the uncertainty is at the level of 1–5%, while for lower concentrations it is about 10%.
Results and Discussion
Analytical Performance of TXRF Measurements
Figure 1 presents examples of the characteristic X-ray spectra emitted by the lymphocytes, erythrocytes, and plasma samples, registered using TXRF technique. The spectra cover the photon energy range from about 2 keV to 18 keV, allowing the detection of characteristic radiation of many elements. The Y–Kα and Ga–Kα lines come from internal standards (Y for erythrocytes and plasma, while Ga for lymphocytes). The Si–Kα is due to sample carrier material and Ar–Kα comes from air. The Mo–Kα is primary radiation from the Mo-anode X-ray tube. The I–L series lines come from Histopaque-1077. The source of the remaining lines are the elements contained in the analyzed samples. It can be observed that level of the background is different for the samples. The highest one is for the plasma, making it difficult to detect elements with low concentration (for example Mn, Se, Sr, Pb), as the background level determines the detection limit.
Examples of the X-ray spectra emitted by the lymphocytes, erythrocytes, and plasma samples, registered using TXRF technique (1 h measurement time).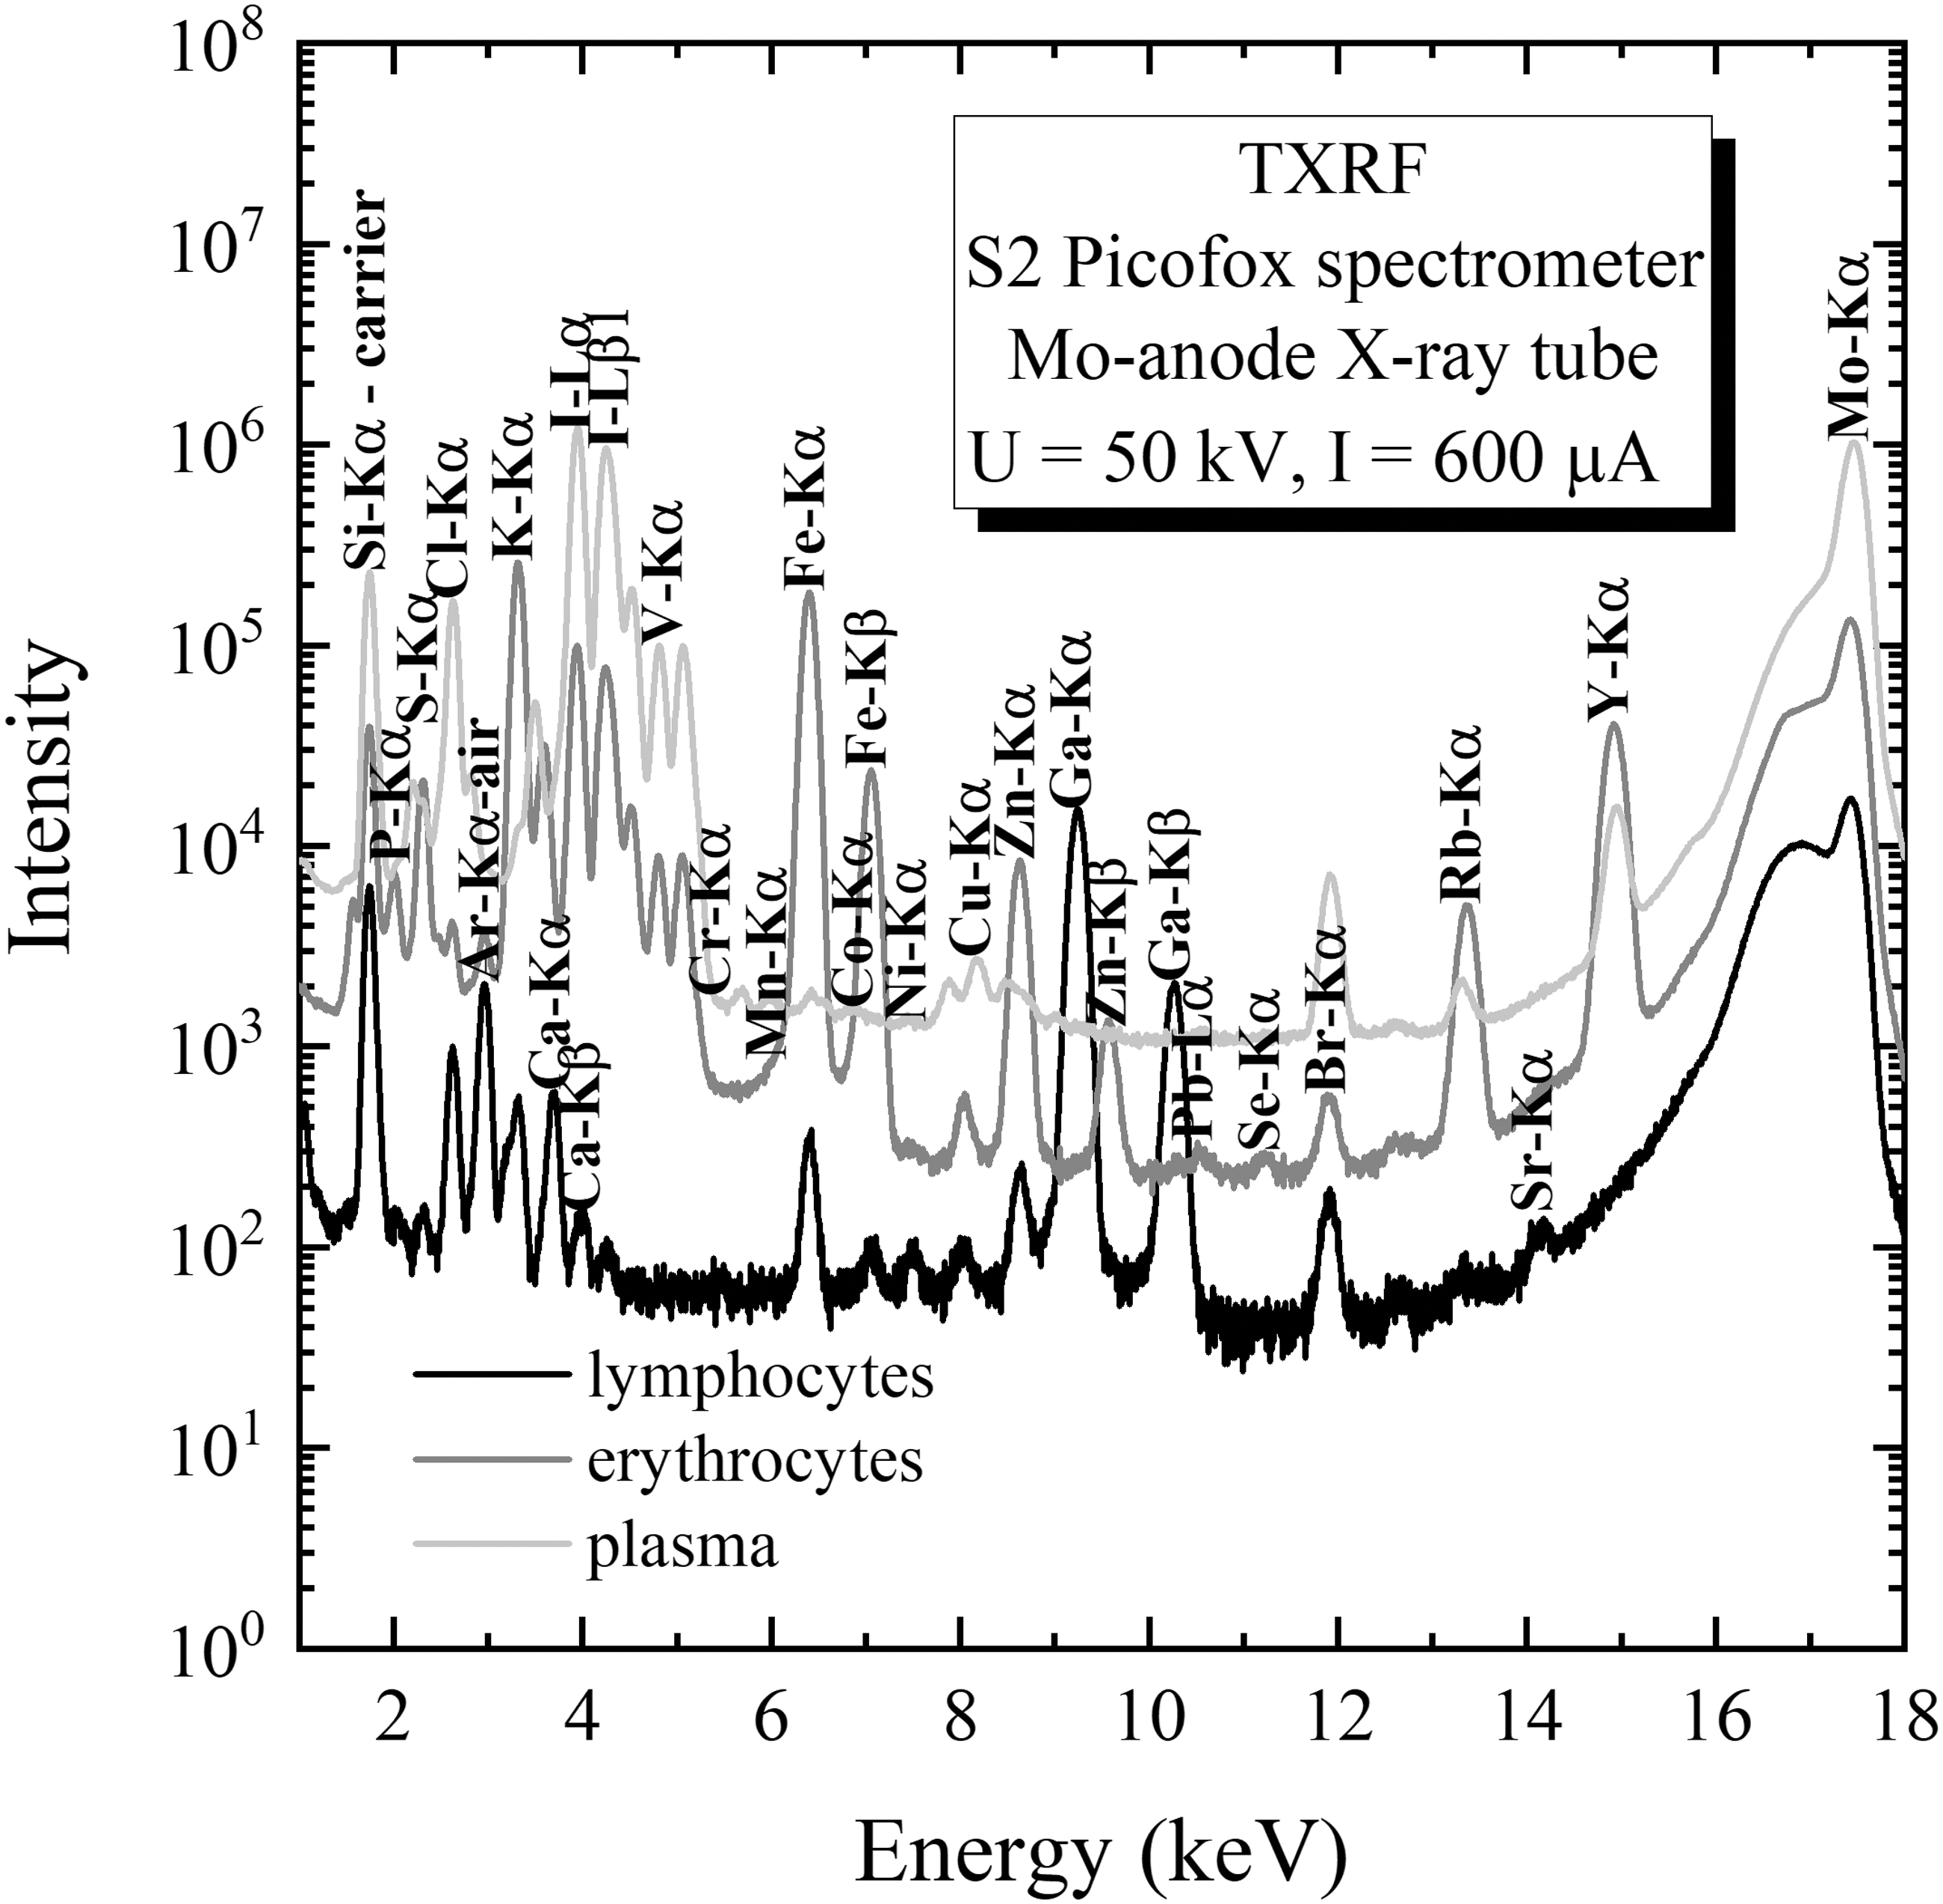
Detection limit (DL) value for the TXRF method, as for typical spectroscopic analytical techniques, is determined by means of signal to background ratio. In the case of the TXRF technique, the detection limit cDL is defined usually using Eq. I:9
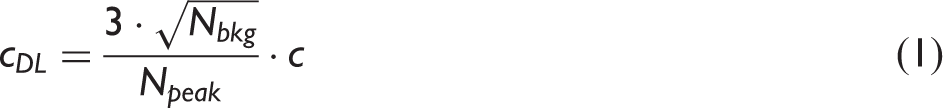
The detection limit values for different elements are calculated automatically by the Picofox spectrometer software and reported together with the obtained in the sample element concentrations. Figure 2 presents typical dependence of the detection limit values on the atomic number of the element for different blood components: lymphocytes, erythrocytes, and plasma, analyzed with the TXRF method within presented studies. First, it is observed that detection limit for lymphocytes and erythrocytes is lower (about 10 times) than for plasma. For the lightest element P (atomic number Z = 15), the detection limit for lymphocytes and erythrocytes is at the level of 0.2–0.3 mg/L, while for plasma it is about 3 mg/L. In turn, the best detection limit (Se (Z = 34), Br (Z = 35)) is 0.001 mg/L and 0.01 mg/L for lymphocytes, erythrocytes and plasma, respectively. The reason for the lower values of detection limit for lymphocytes as well as erythrocytes is the microwave digestion process applied in the preparation procedure. During microwave digestion process, light organic matter is decomposed, light elements are removed from the sample, which results in reduced X-ray scattering in the sample, being the main source of the background level, and leading to the improvement of the detection limit. On the other hand, it should be noted that too sophisticated sample preparation procedure can lead to input to the sample the elemental impurities.
Dependence of the detection limit values on the atomic number of the element for different blood components: lymphocytes, erythrocytes, and plasma, analyzed using the TXRF method.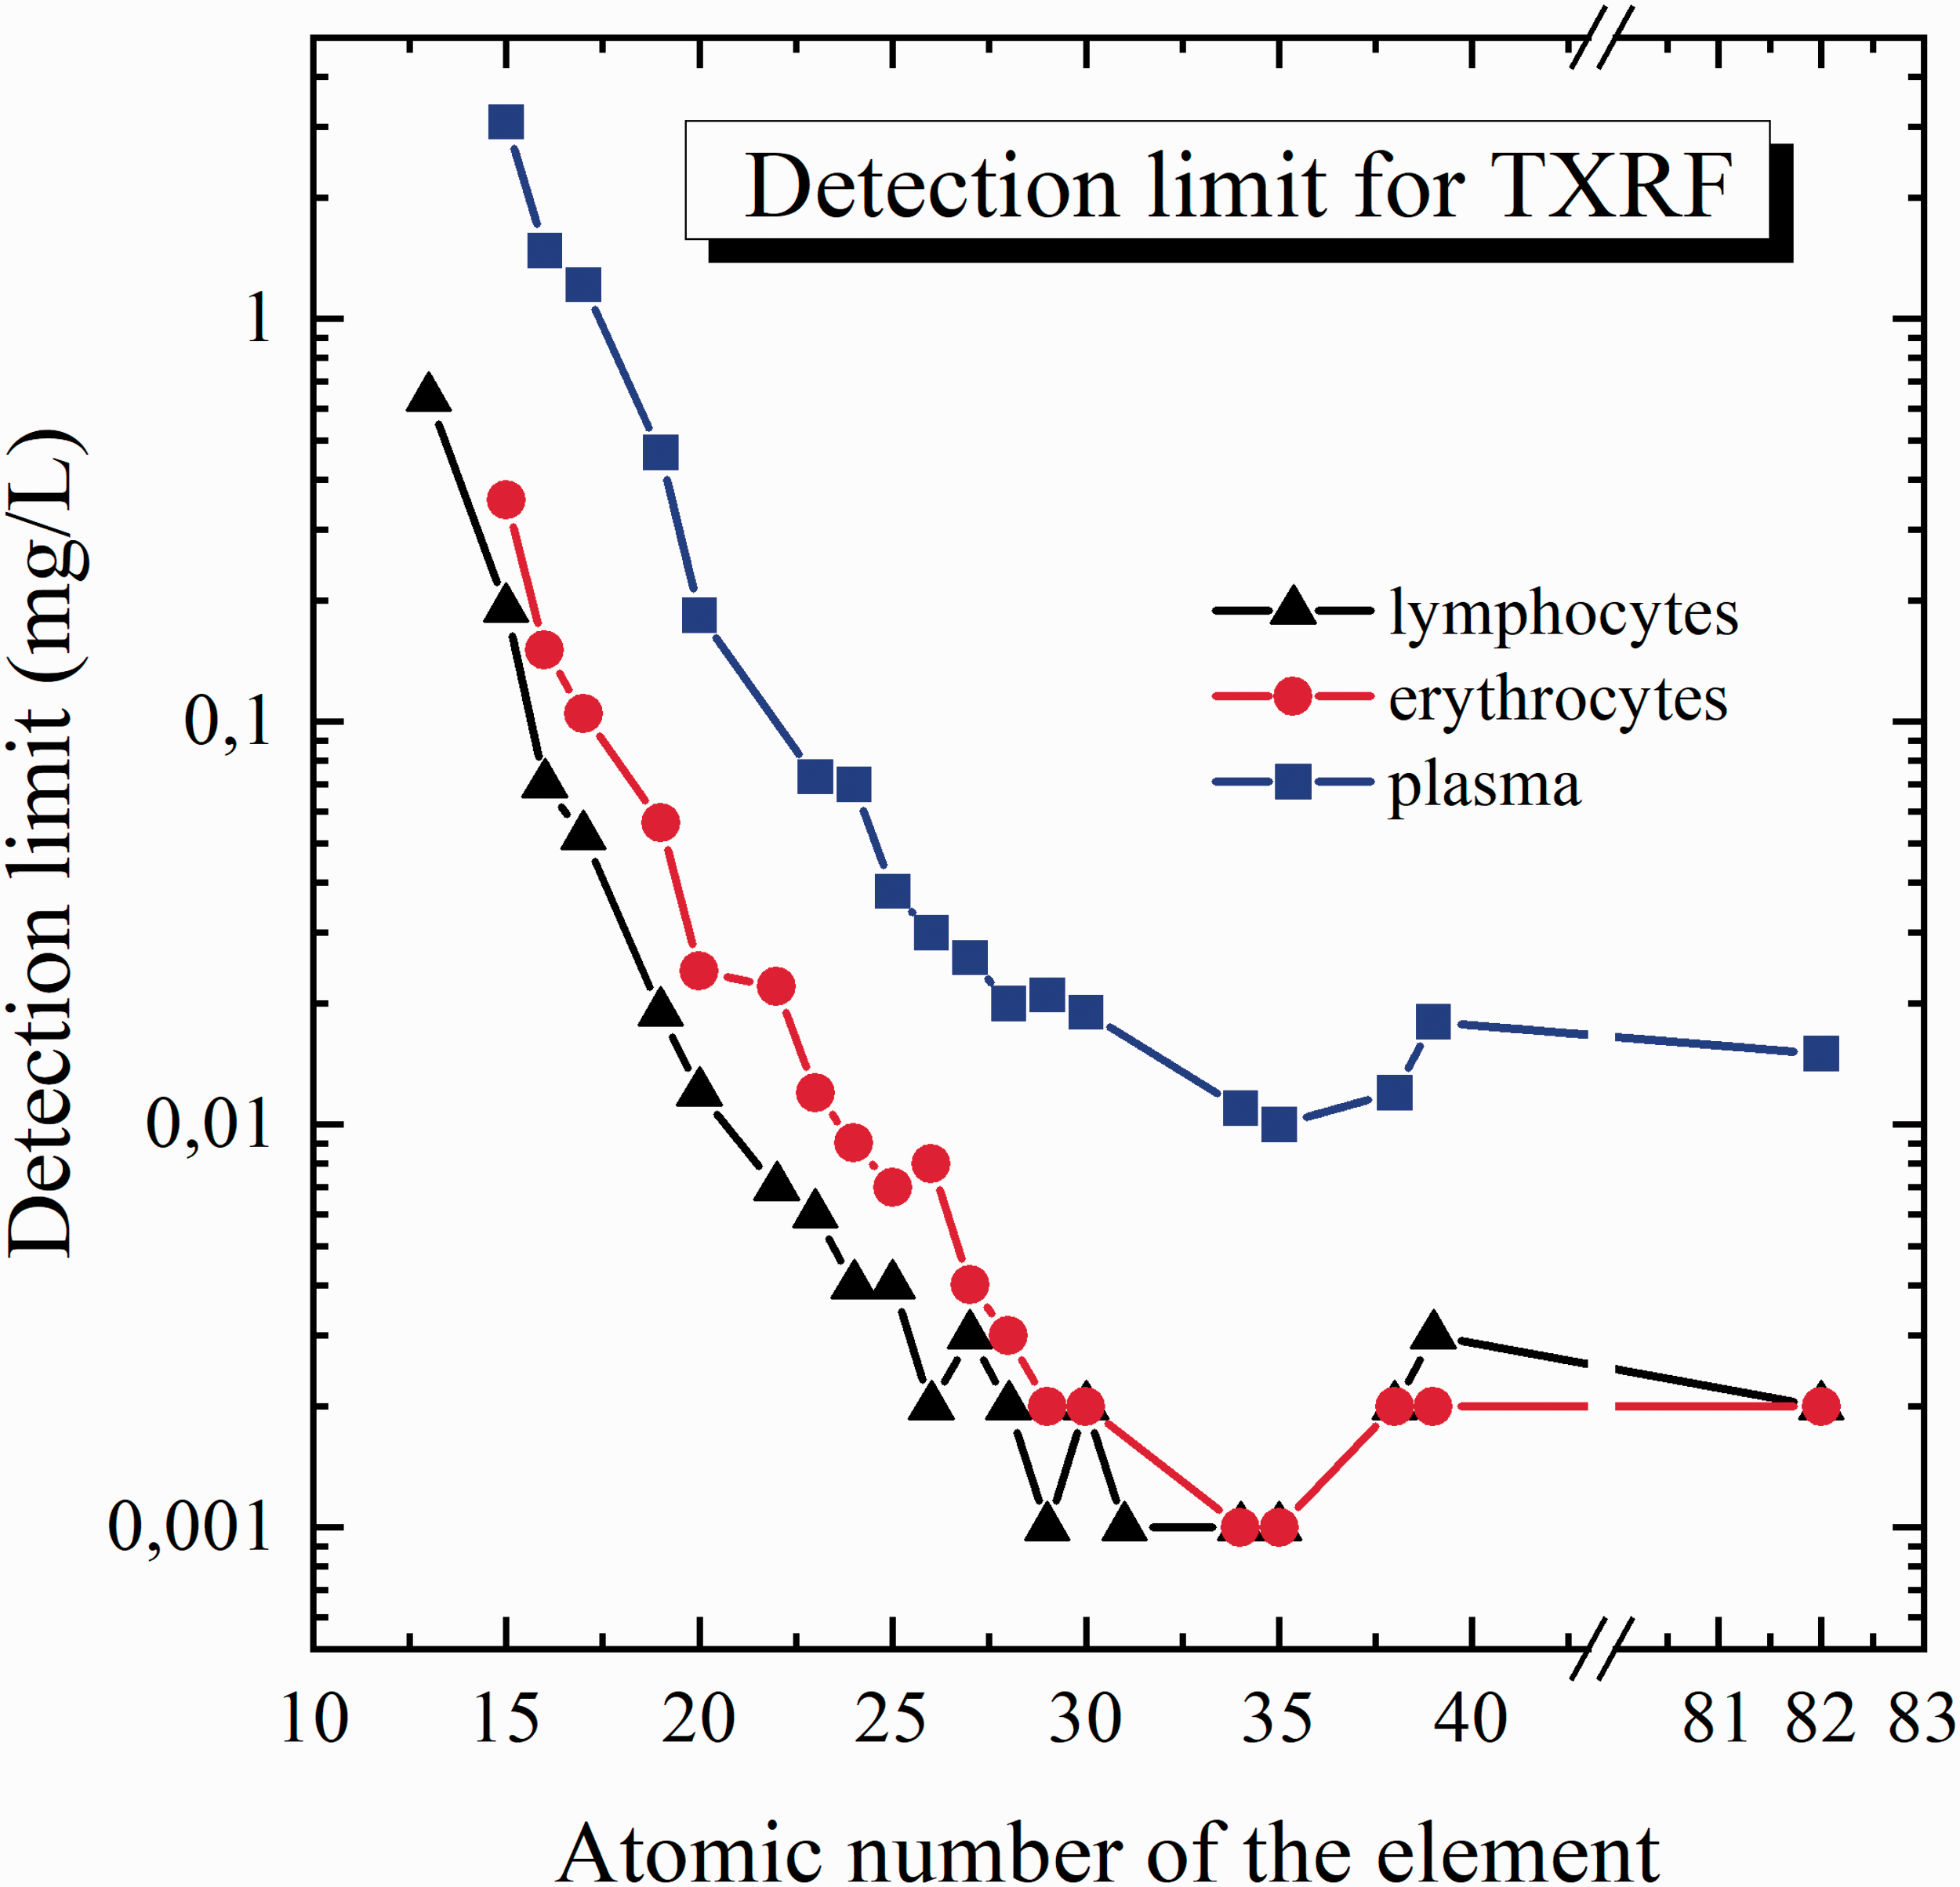
In Fig. 2, the value of detection limit for lead (Z = 82) is also presented. For lymphocytes and erythrocytes, it is 0.002 mg/L, while for plasma 0.015 mg/L.
Accuracy of the TXRF method for elemental analysis of blood components was checked on an example of certified reference material of human serum which matrix is similar to the studied blood components, and was discussed in details in our previous research. 5 Accuracy is defined by the relative ratio of the difference between the measured concentration and nominal concentration levels. Expected discrepancy is up to 20%. The presented results confirmed good accuracy of the method used, which depends on the atomic number of elements and detection limit value. 5 The best accuracy, up to 5%, is observed for the middle atomic number, for which the detection limit value is the lowest.
The precision of the method was also checked in two different manners, both using repeatability of measurements and by inter-laboratory reproducibility. 5 The results presented good inter-laboratory reproducibility (up to 7%) and repeatability (up to 5%) of the analytical method used. 5
Element Concentrations in Human Lymphocytes, Erythrocytes, and Plasma
The element concentrations obtained in the blood component solution, by analyzing the three subsamples (sample deposited on three sample carriers), were next averaged. The precision of the measurements, defined as a coefficient of variation (in percent), for three replicates varies in dependence on element concentration and is in the range of 2–10% for concentration typically analyzed by TXRF technique, and in the range of 15–20% for the concentration close to the TXRF detection limit.
The concentrations obtained in the blood component solutions were converted to the weight of analyzed component: lymphocytes, erythrocytes, and plasma, respectively, taking into account the concentrations of possible contaminations in nitric acid, internal standards, saline, and Histopaque-1077. In the nitric acid, the following elements were determined: P (1.50 mg/L), Cl (0.004 mg/L), Ca (0.041 mg/L), Fe (0.005 mg/L), Ni (0.002 mg/L), Zn (0.001 mg/L), Pb (0.001 mg/L). In yttrium standard, the following element were found: P (50.8 mg/L), Cl (0.099 mg/l), Ca (1.28 mg/L), Fe (0.079 mg/L), Ni (0.002 mg/L), Cu (0.049 mg/L), Zn (0.023 mg/L), Br (0.001 mg/L) and Pb (0.015 mg/L), while in gallium standard: Cl (10.1 mg/l), Ca (2.13 mg/L), Fe (0.476 mg/L), Cu (0.627 mg/L), Zn (0.523 mg/L), Br (0.054 mg/L) and Pb (0.077 mg/L). Saline solution is characterized with the following elements: P (1.41 mg/L), Cl (0.467 mg/L), K (0.198 mg/L), Ca (0.380 mg/L), Ti (0.008 mg/L), Cr (0.002 mg/L), Fe (0.037 mg/L), Ni (0.006 mg/L), Cu (0.042 mg/L), Zn (0.018 mg/L), Br (0.007 mg/L), Sr (0.005 mg/L), and Pb (0.002 mg/L). It can be seen that concentration of most of the elements are close to the detection limit of the TXRF method for the analyzed blood fractions. For Histopaque-1077, higher element concentrations were obtained, namely: P (156 mg/L), Cl (96.8 mg/L), K (13.4 mg/L), Cr (1.05 mg/L), Fe (0.269 mg/L), Ni (0.207 mg/L), Cu (3.48 mg/L), Zn (0.793 mg/L), Br (7.80 mg/L), and Pb (0.190 mg/L). In the conversion of element concentration obtained in the blood component solutions to the weight of analyzed sample, the mass fraction of a given component (nitric acid, internal standards, saline and Histopaque-1077) used in the preparation of the blood component solutions, was considered.
Concentration of elements in human lymphocytes, erythrocytes, and plasma (for all, male and female samples) obtained with the TXRF method.
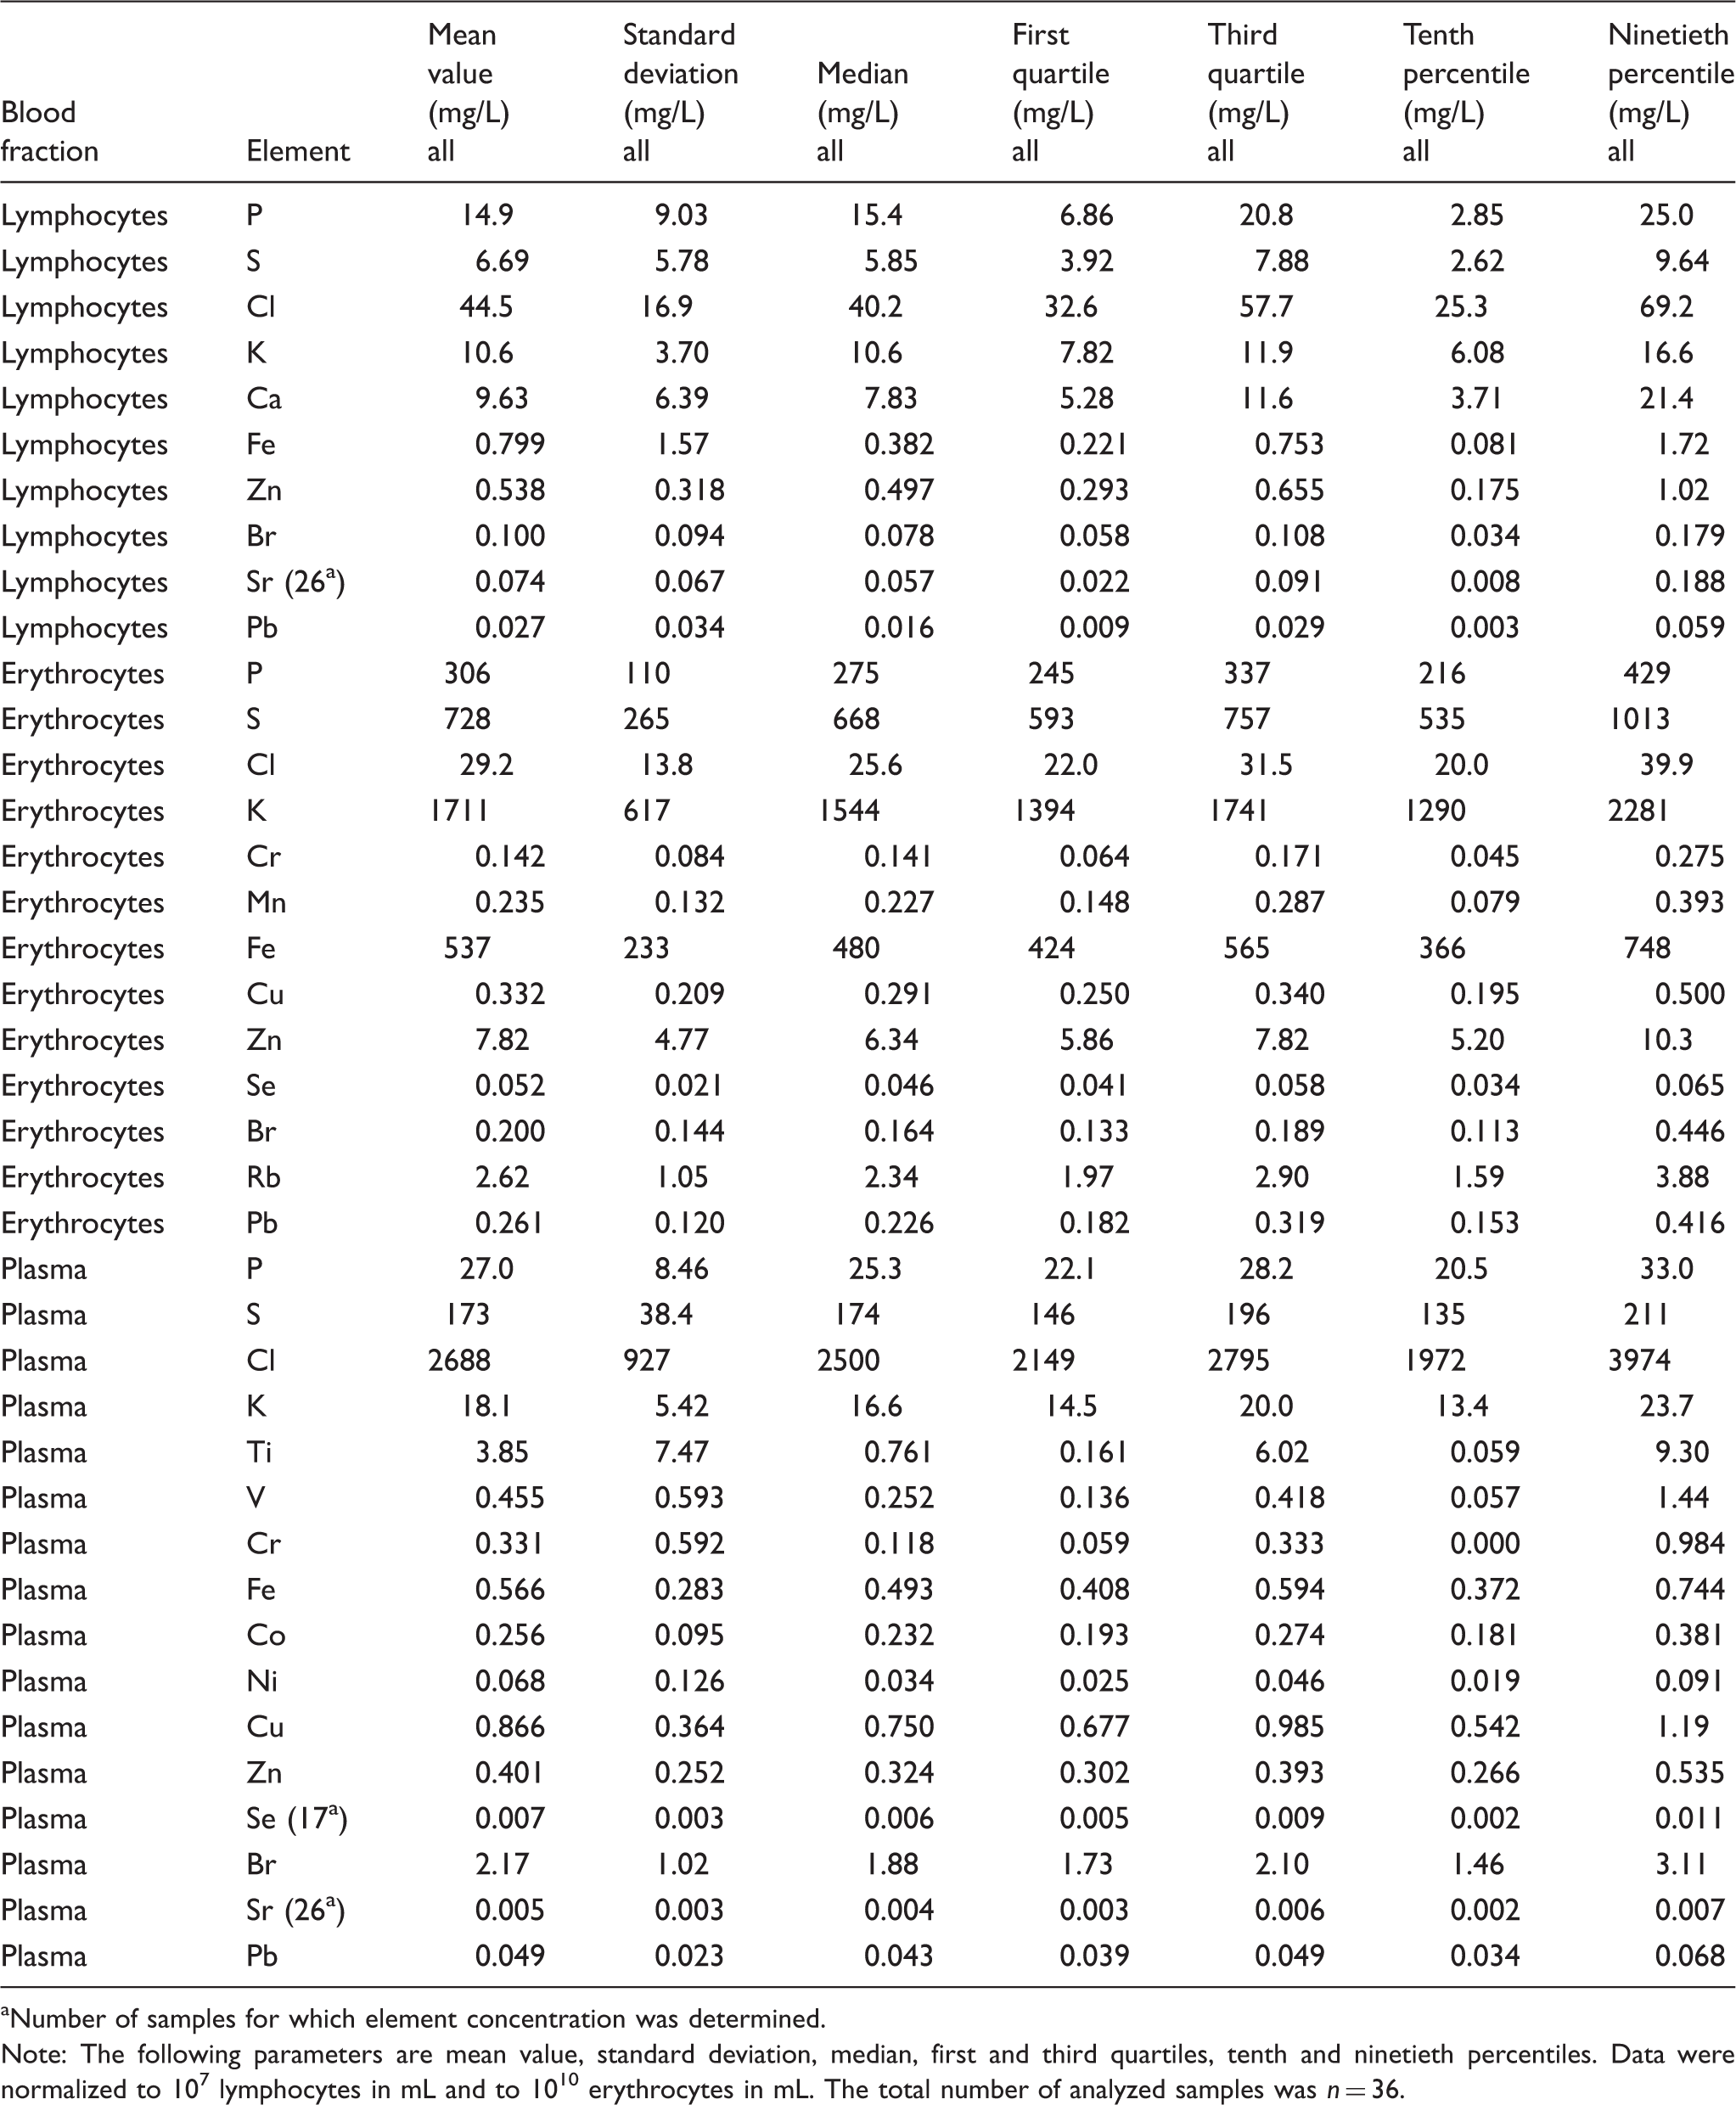
Number of samples for which element concentration was determined.
Note: The following parameters are mean value, standard deviation, median, first and third quartiles, tenth and ninetieth percentiles. Data were normalized to 107 lymphocytes in mL and to 1010 erythrocytes in mL. The total number of analyzed samples was n = 36.
In the lymphocytes group, the lowest obtained mean value of concentration is for Pb, 0.027 mg/L, and the highest for Cl, 44.5 mg/L. For erythrocytes, it is 0.052 mg/L for Se and 1711 mg/L for K. Finally, in the plasma samples, Sr has the lowest concentration 0.005 mg/L, while Cl the highest one, i.e., 2688 mg/L.
While analyzing Table I, it can be observed that element concentration range, defined by the difference between the tenth and ninetieth percentiles, varies for different elements and blood components. Usually, the ratio of these quantities is at levels 2–6, resulting in relatively high value of standard deviation in comparison with mean value. Such property, relatively high value of standard deviation, was also observed by us for element concentration distribution in other human biological samples. 45 In some cases, for example for Fe and Pb in lymphocytes, for Ti, V, Cr, and Ni in the plasma group, the value of standard deviation is even higher than the mean value.
For presented results, the concentration median is usually close to the mean value. However, for cases with a high value of relative standard deviation, it is smaller than the mean value. Generally, for asymmetric element concentration distribution, the median is a better parameter to describe random variable, due to the fact that it is not sensitive on the extremely high or low concentration values.
In Table I, also the values of the first and third quartiles are given. The numeric range specified by these quartiles can be used as the reference value range for given element and blood compound.
The first and third quartiles range, determined for studied blood components, can be compared with the values for serum samples obtained in our previous studies. 5 The concentrations of S (from 723 mg/L to 858 mg/L) and Se (from 0.052 mg/L to 0.070 mg/L) in serum are at a comparable level as in the case of erythrocytes. Concentration levels of Cr (from 0.122 mg/L to 0.166 mg/L), Br (from 1.85 mg/L to 2.47 mg/L), Pb (from 0.023 mg/L to 0.037 mg/L) in the serum are similar to erythrocytes and plasma. Finally, Cl (from 3425 mg/L to 3750 mg/L) and Cu (from 1.01 mg/L to 1.28 mg/L) serum concentration are comparable with concentration of these elements in plasma.
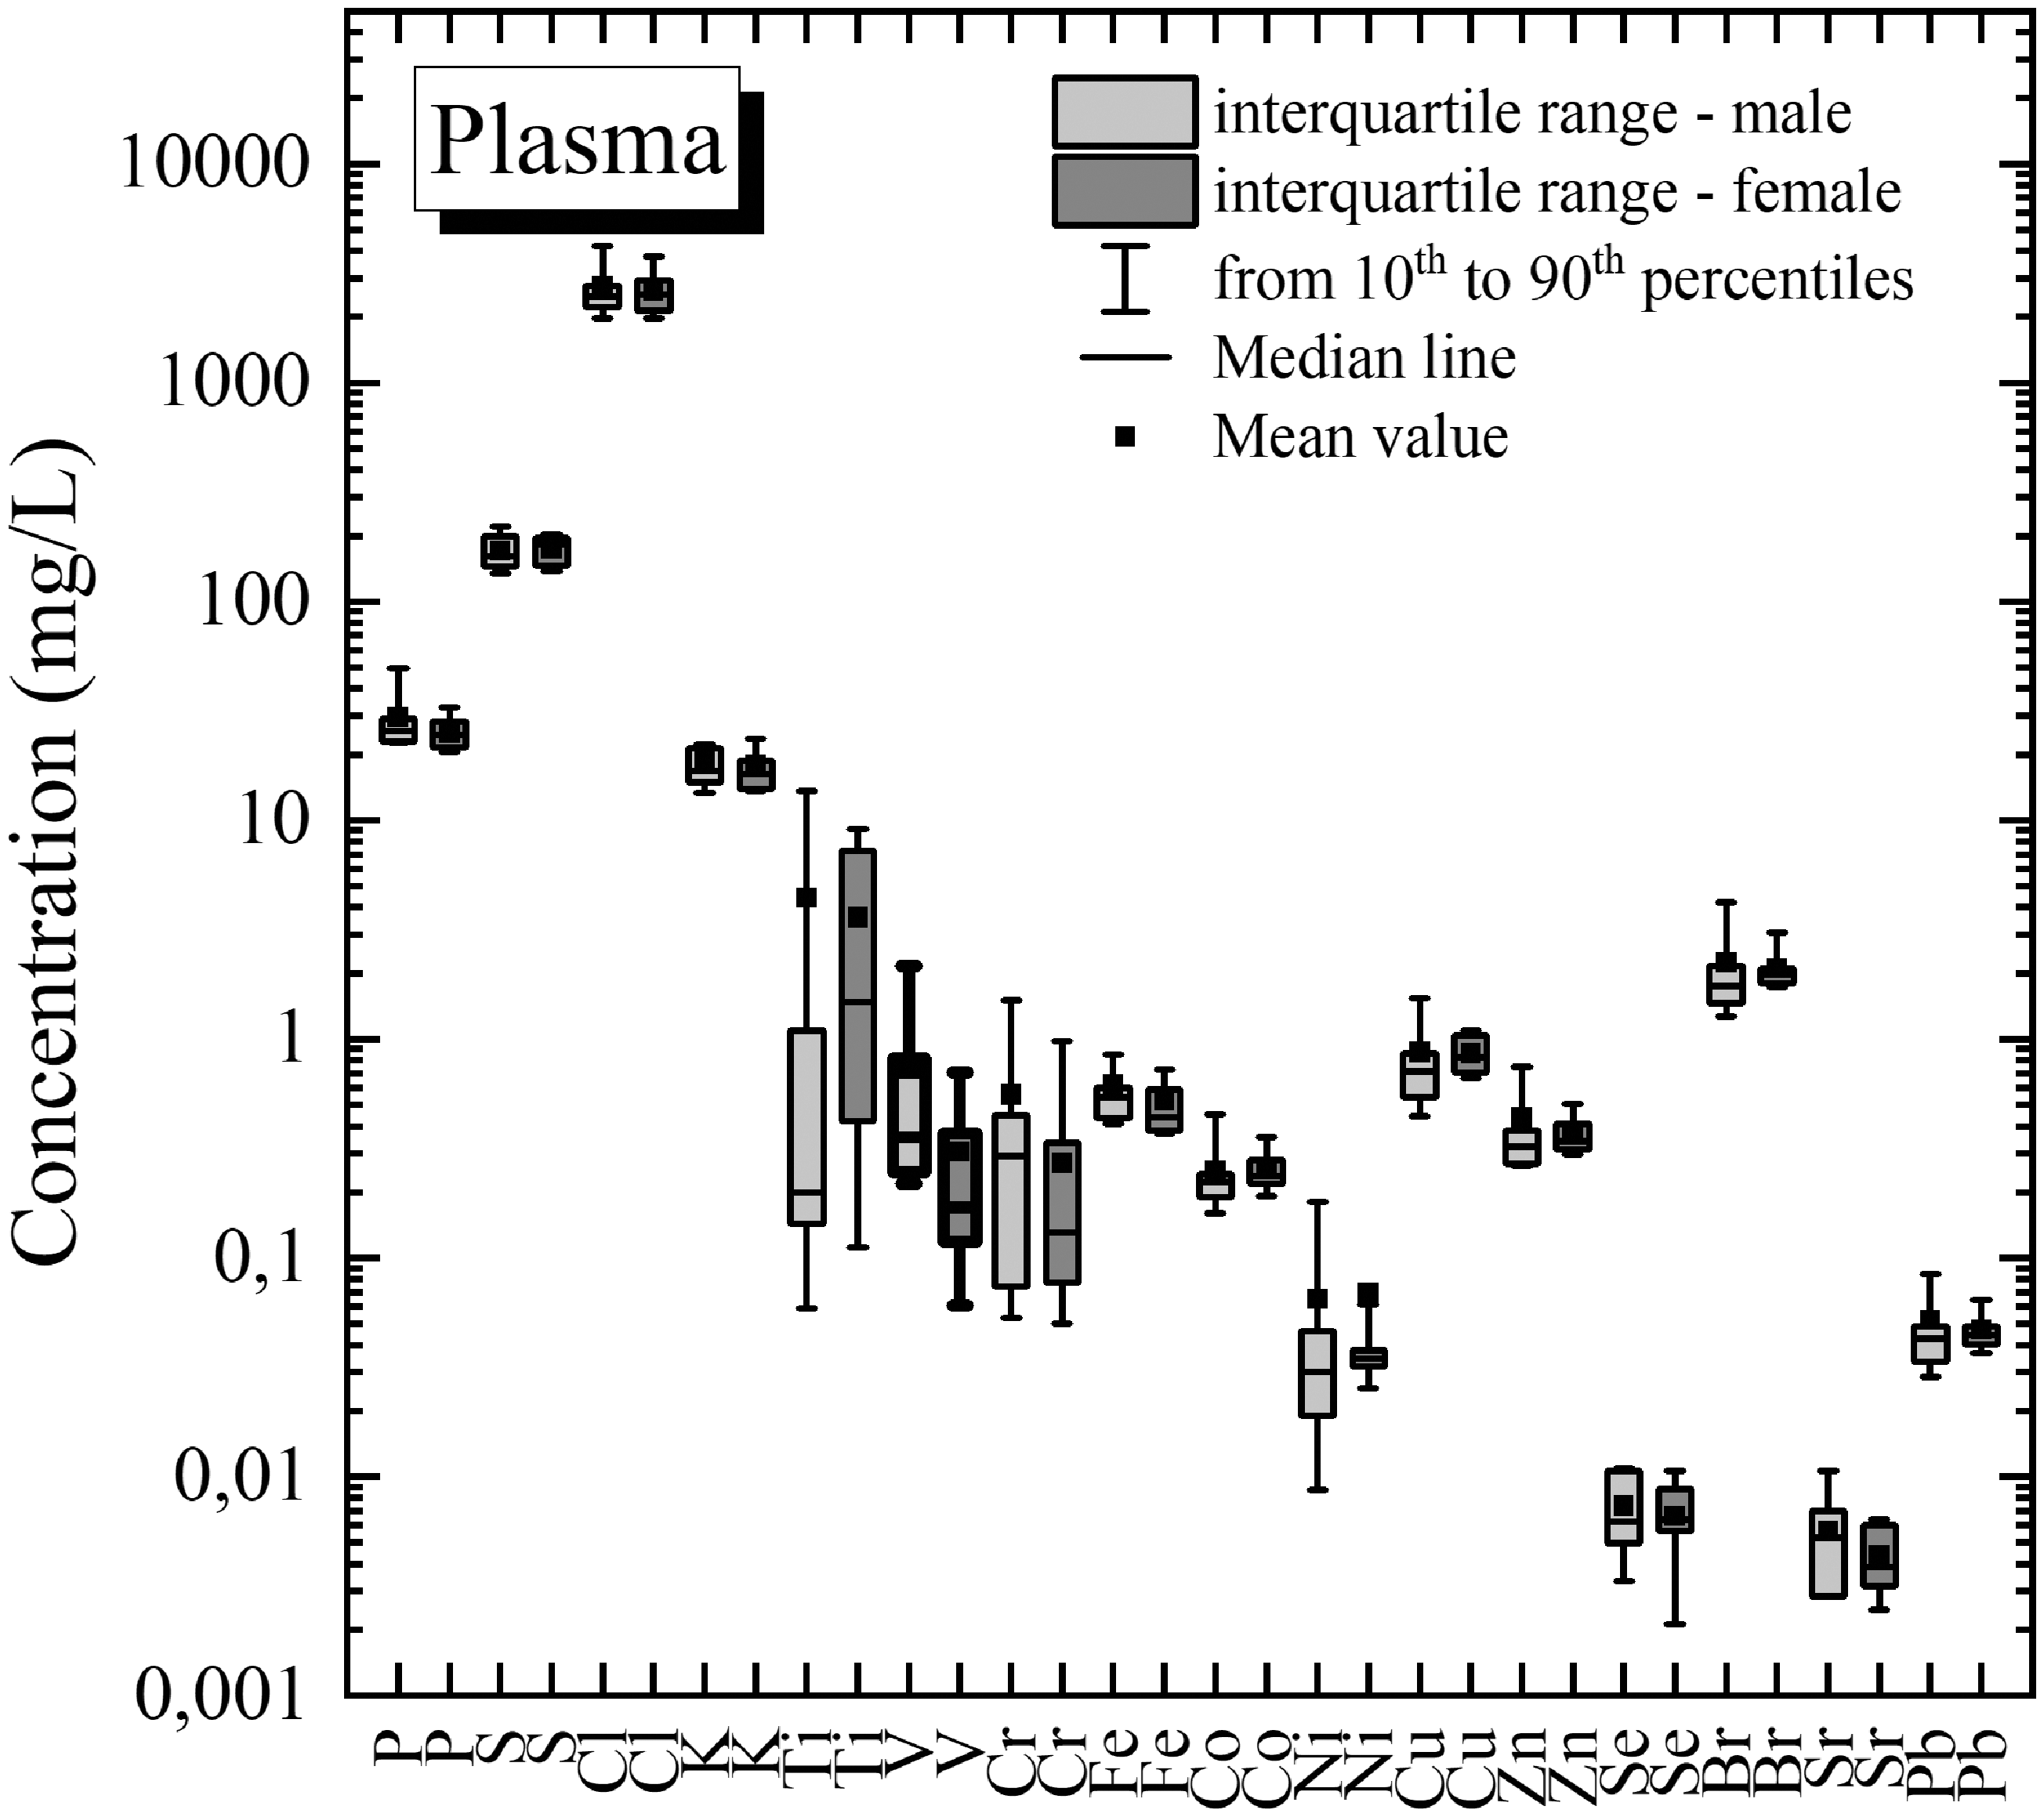
Concentration of elements in human lymphocytes, erythrocytes, and plasma for male and female groups, obtained with the TXRF method.
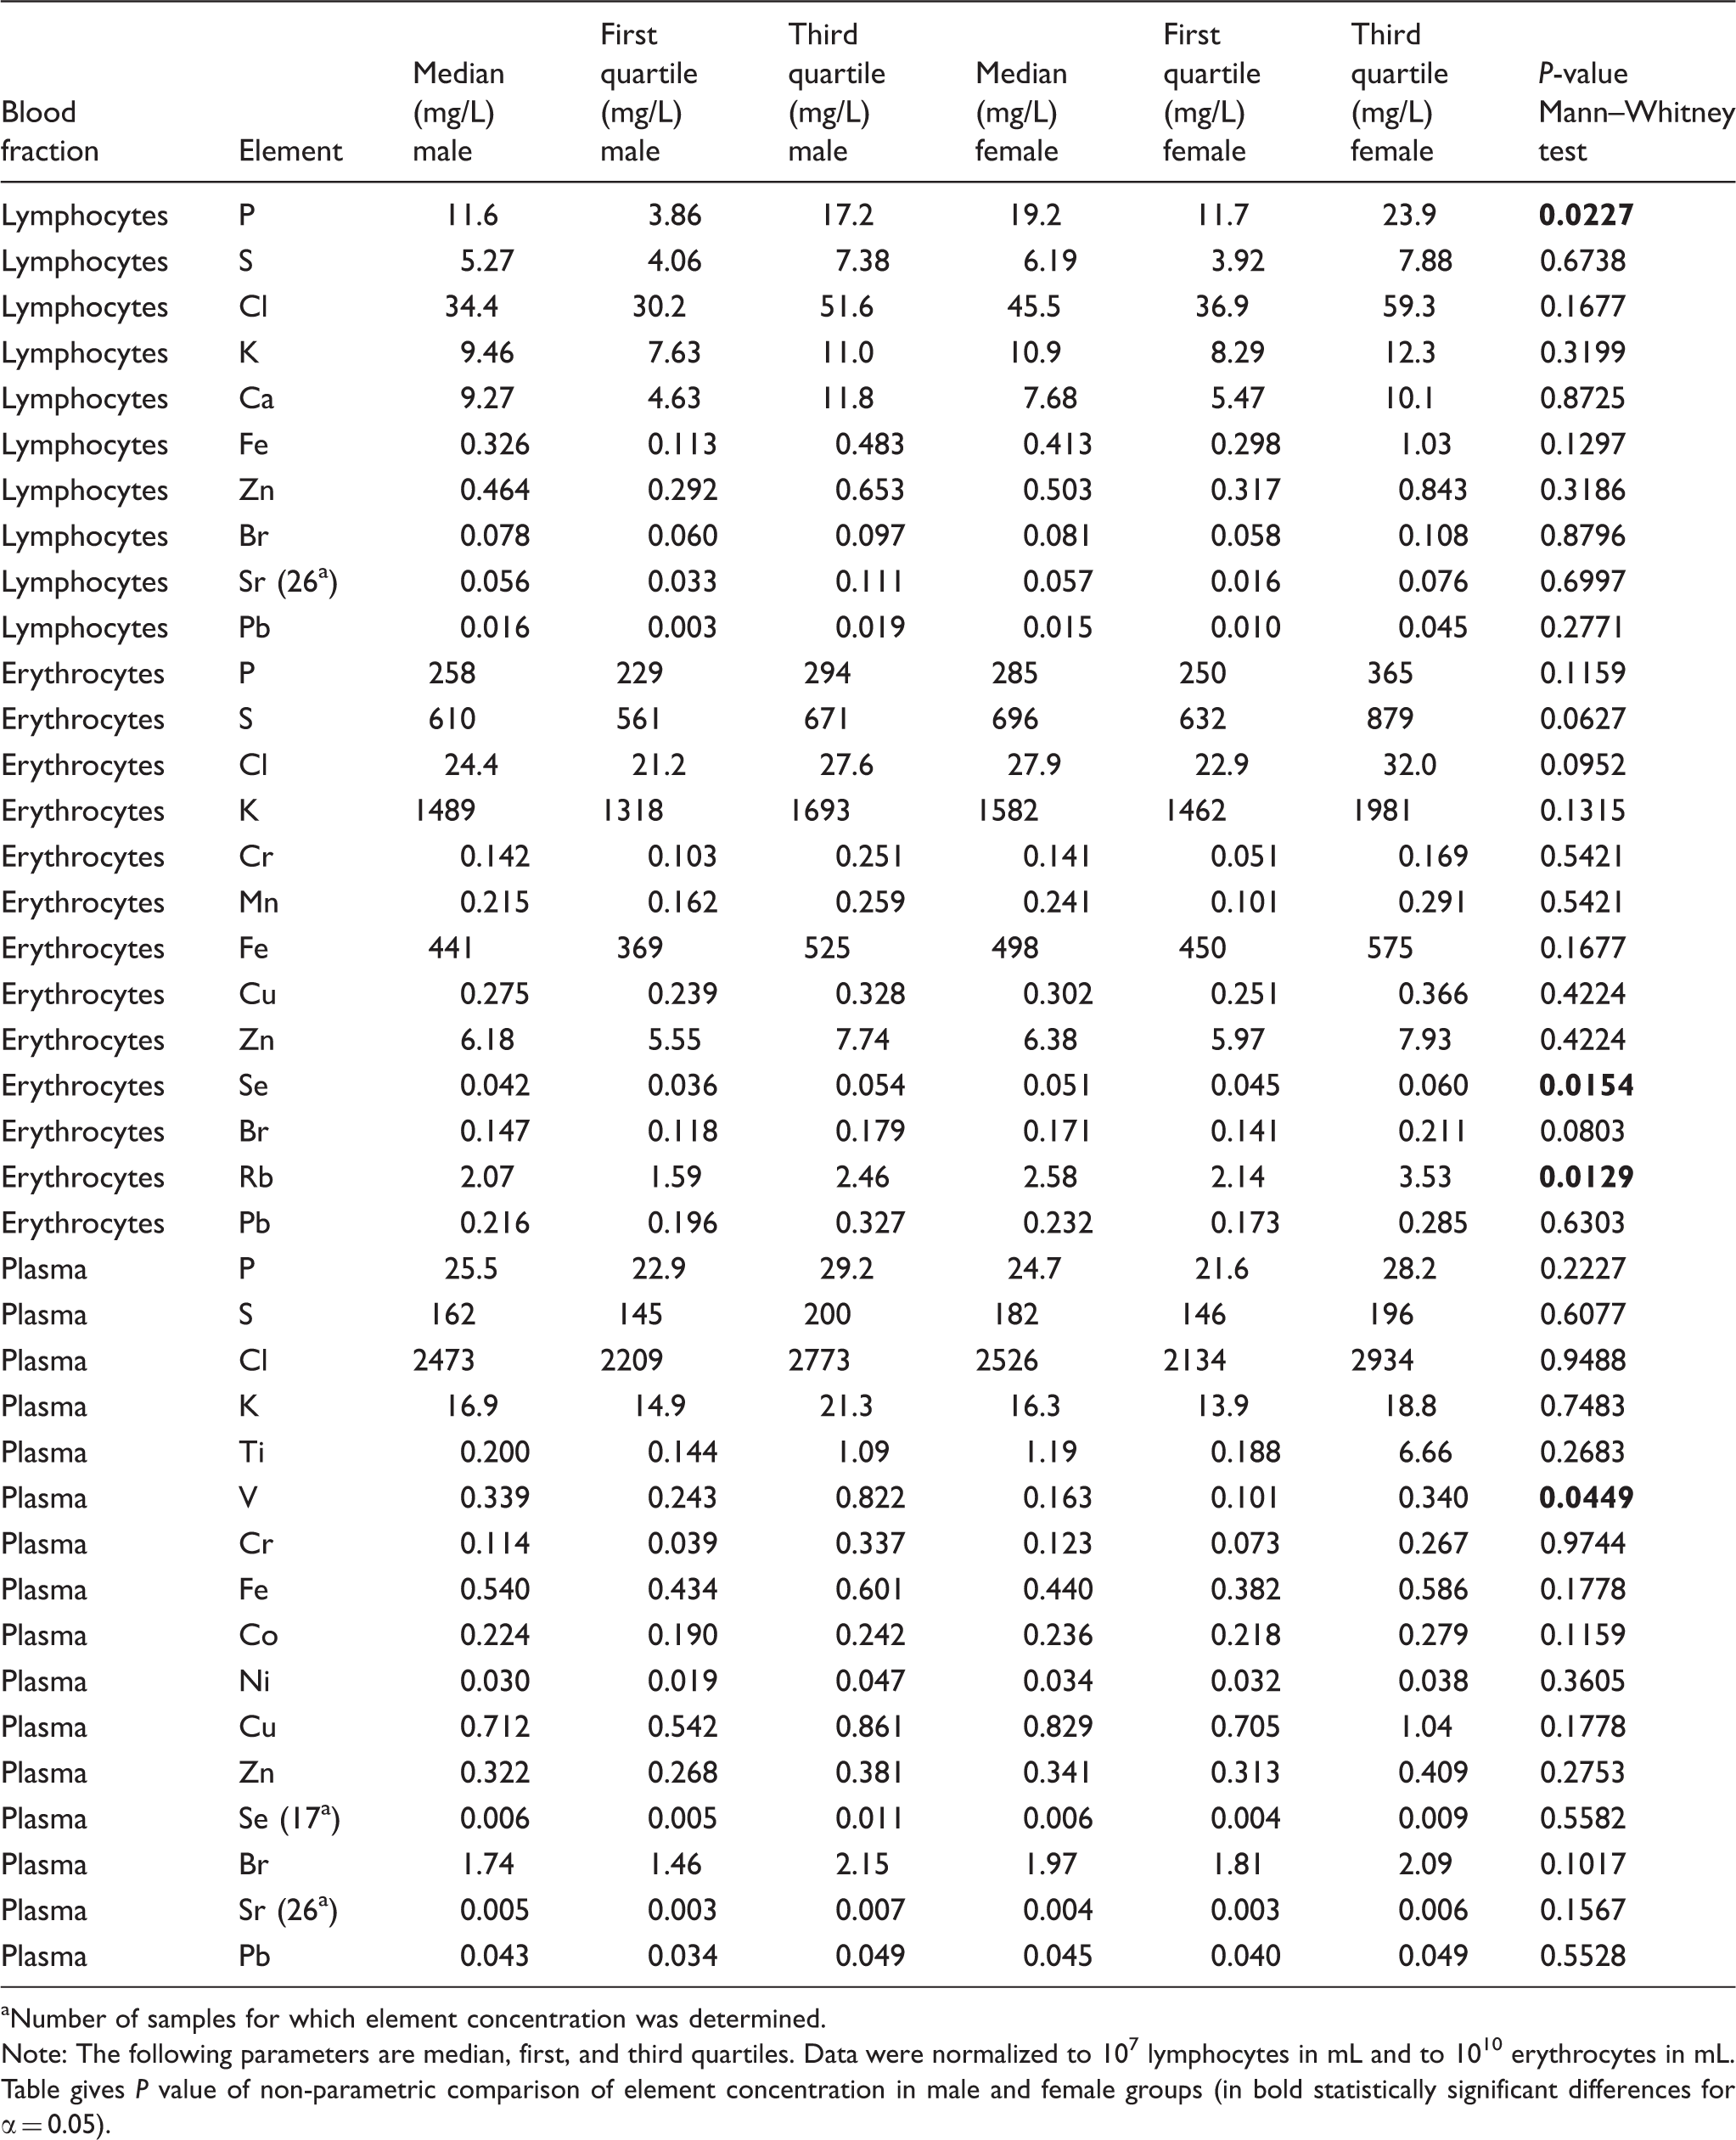
Number of samples for which element concentration was determined.
Note: The following parameters are median, first, and third quartiles. Data were normalized to 107 lymphocytes in mL and to 1010 erythrocytes in mL. Table gives P value of non-parametric comparison of element concentration in male and female groups (in bold statistically significant differences for α = 0.05).
In the lymphocytes group, statistical differences were obtained for P, in the erythrocytes for Se and Rb, while in the plasma for V. No statistical differences were observed for the remaining elements.
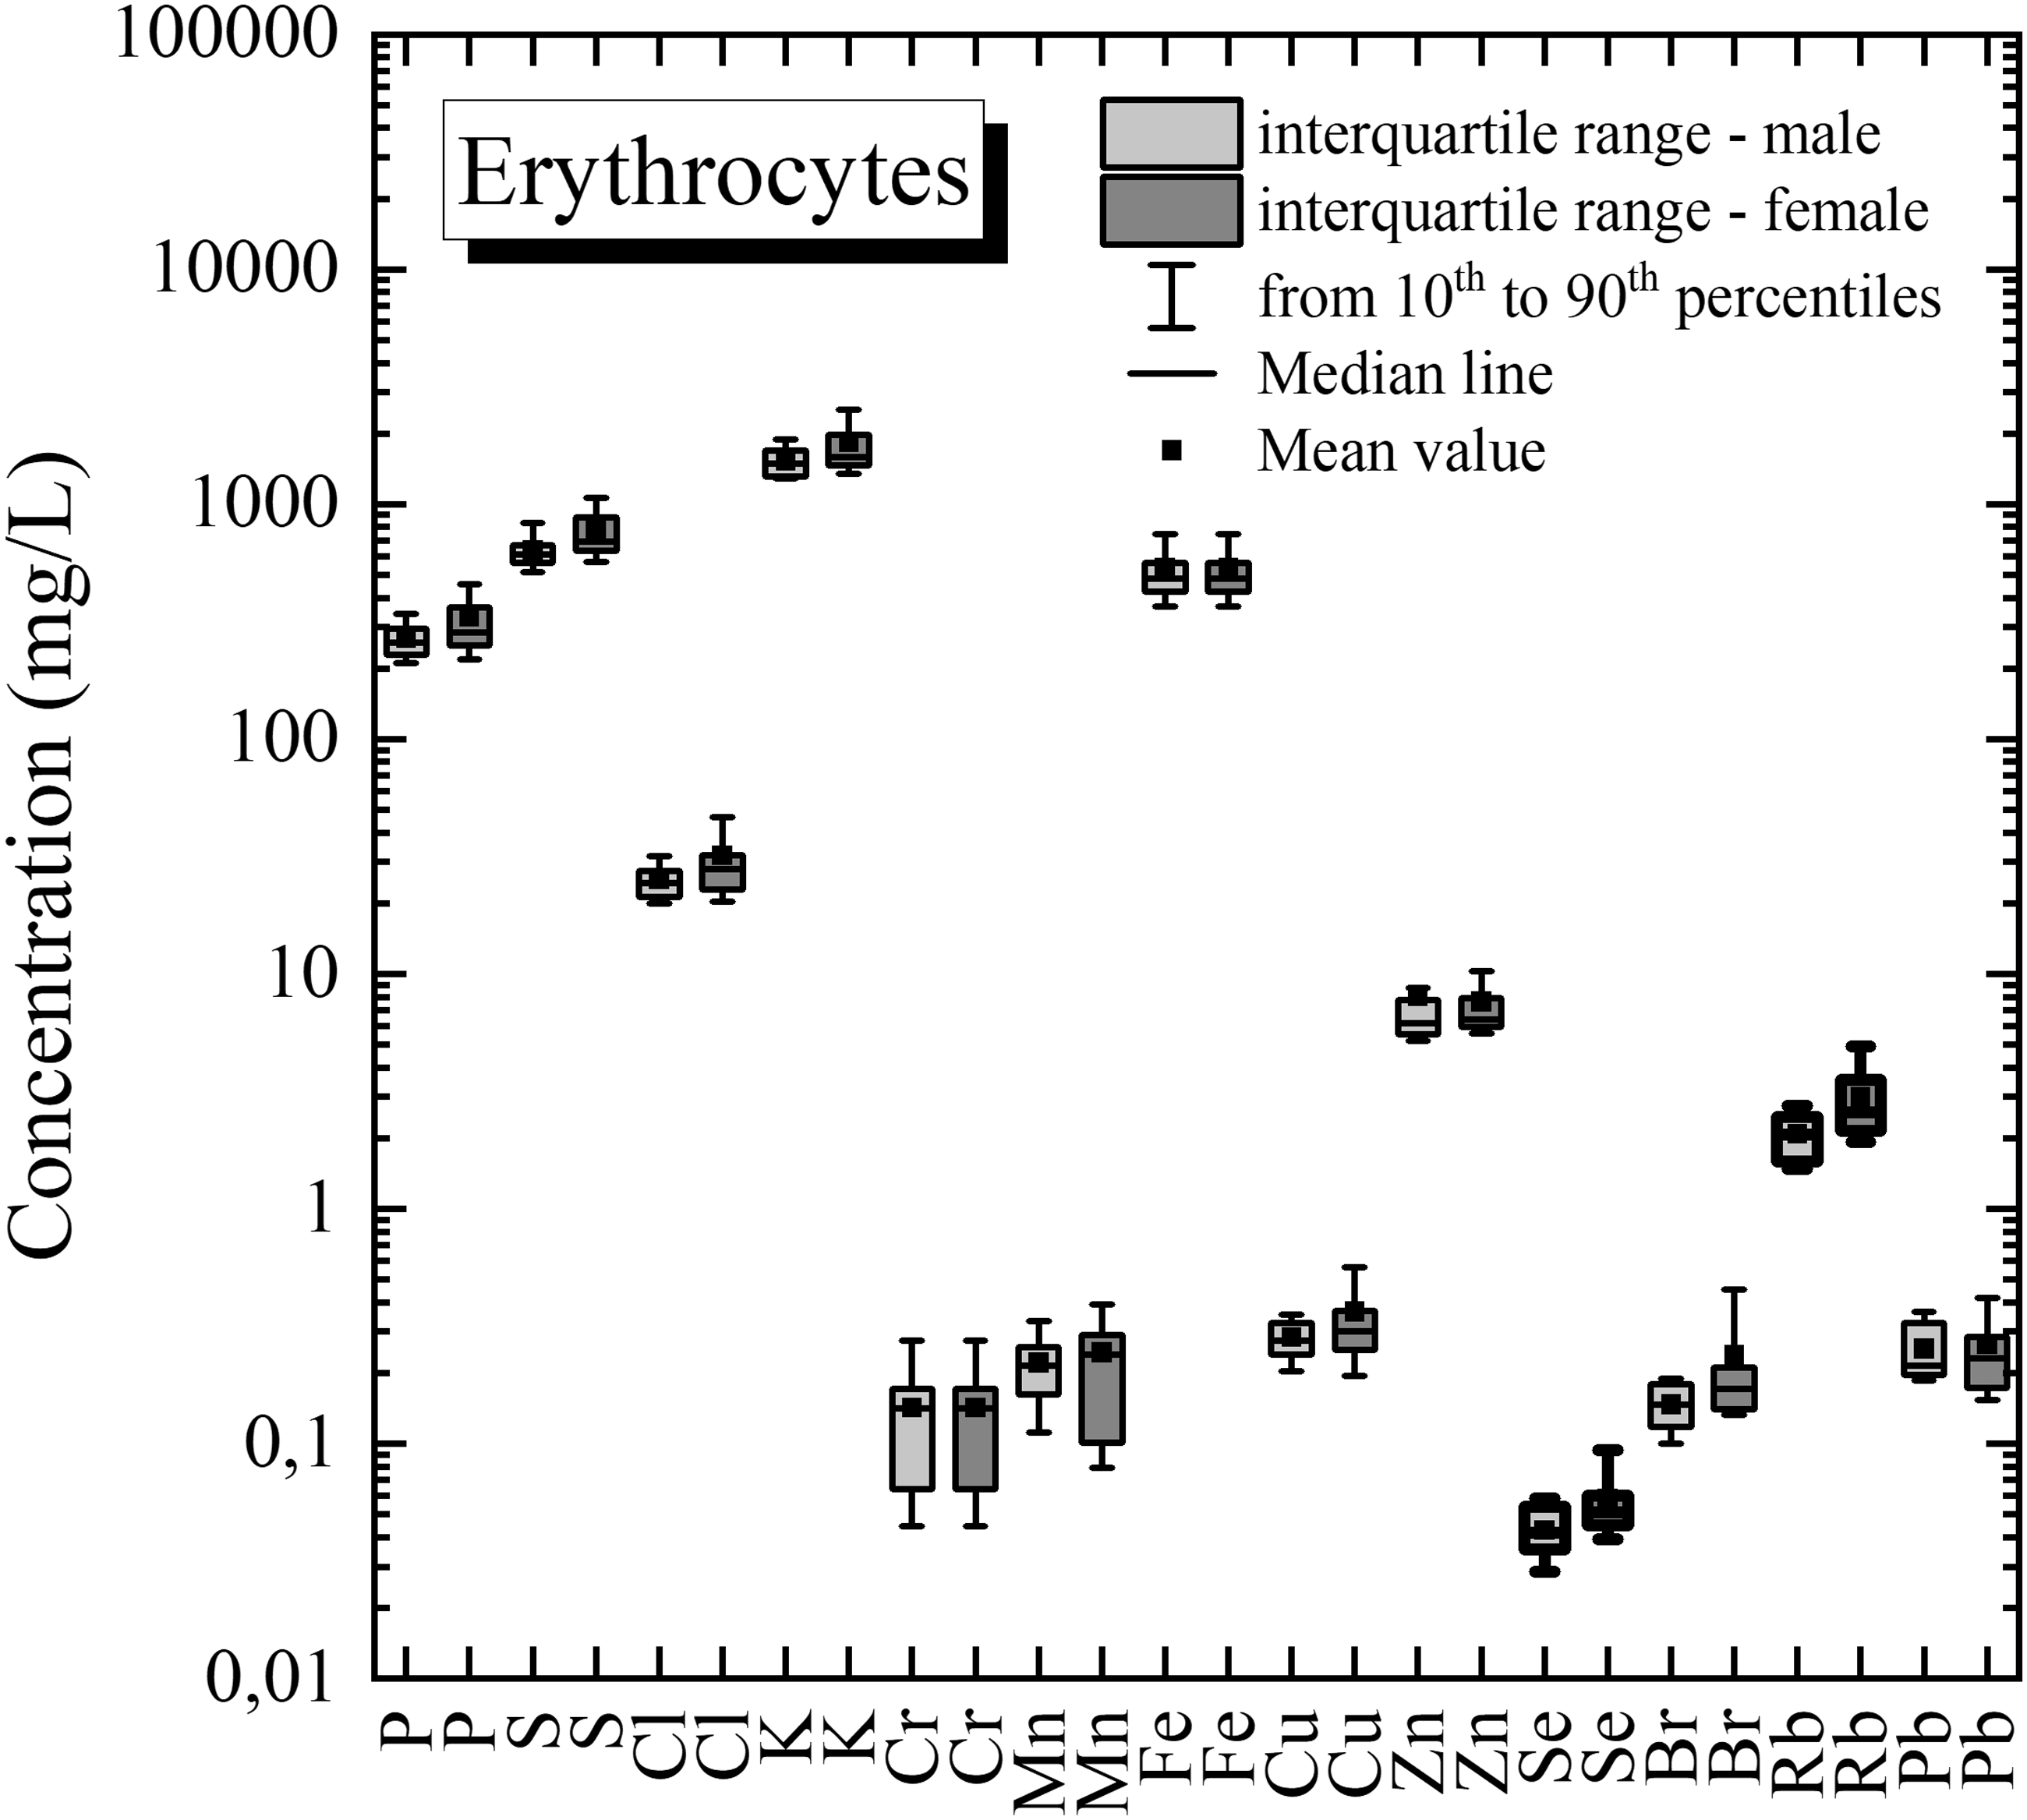
The comparison of the element contents between the group of male and female is presented graphically in Fig. 3 for the lymphocytes, in Fig. 4 for the erythrocytes, and in Fig. 5 for plasma samples. The box border is in bold for element concentrations different in male and female groups (significance level α = 0.05).
Concentration of elements in human lymphocytes for male and female groups. Data were normalized to 107 lymphocytes in mL. The box border is in bold for element (P) concentration different in male and female groups (significance level α = 0.05). Concentration of elements in human erythrocytes for male and female groups. Data were normalized to 1010 lymphocytes in mL. The box border is in bold for element (Se, Rb) concentration different in male and female groups (significance level α = 0.05). Concentration of elements in human plasma for male and female groups. The box border is in bold for element (V) concentration different in male and female groups (significance level α = 0.05).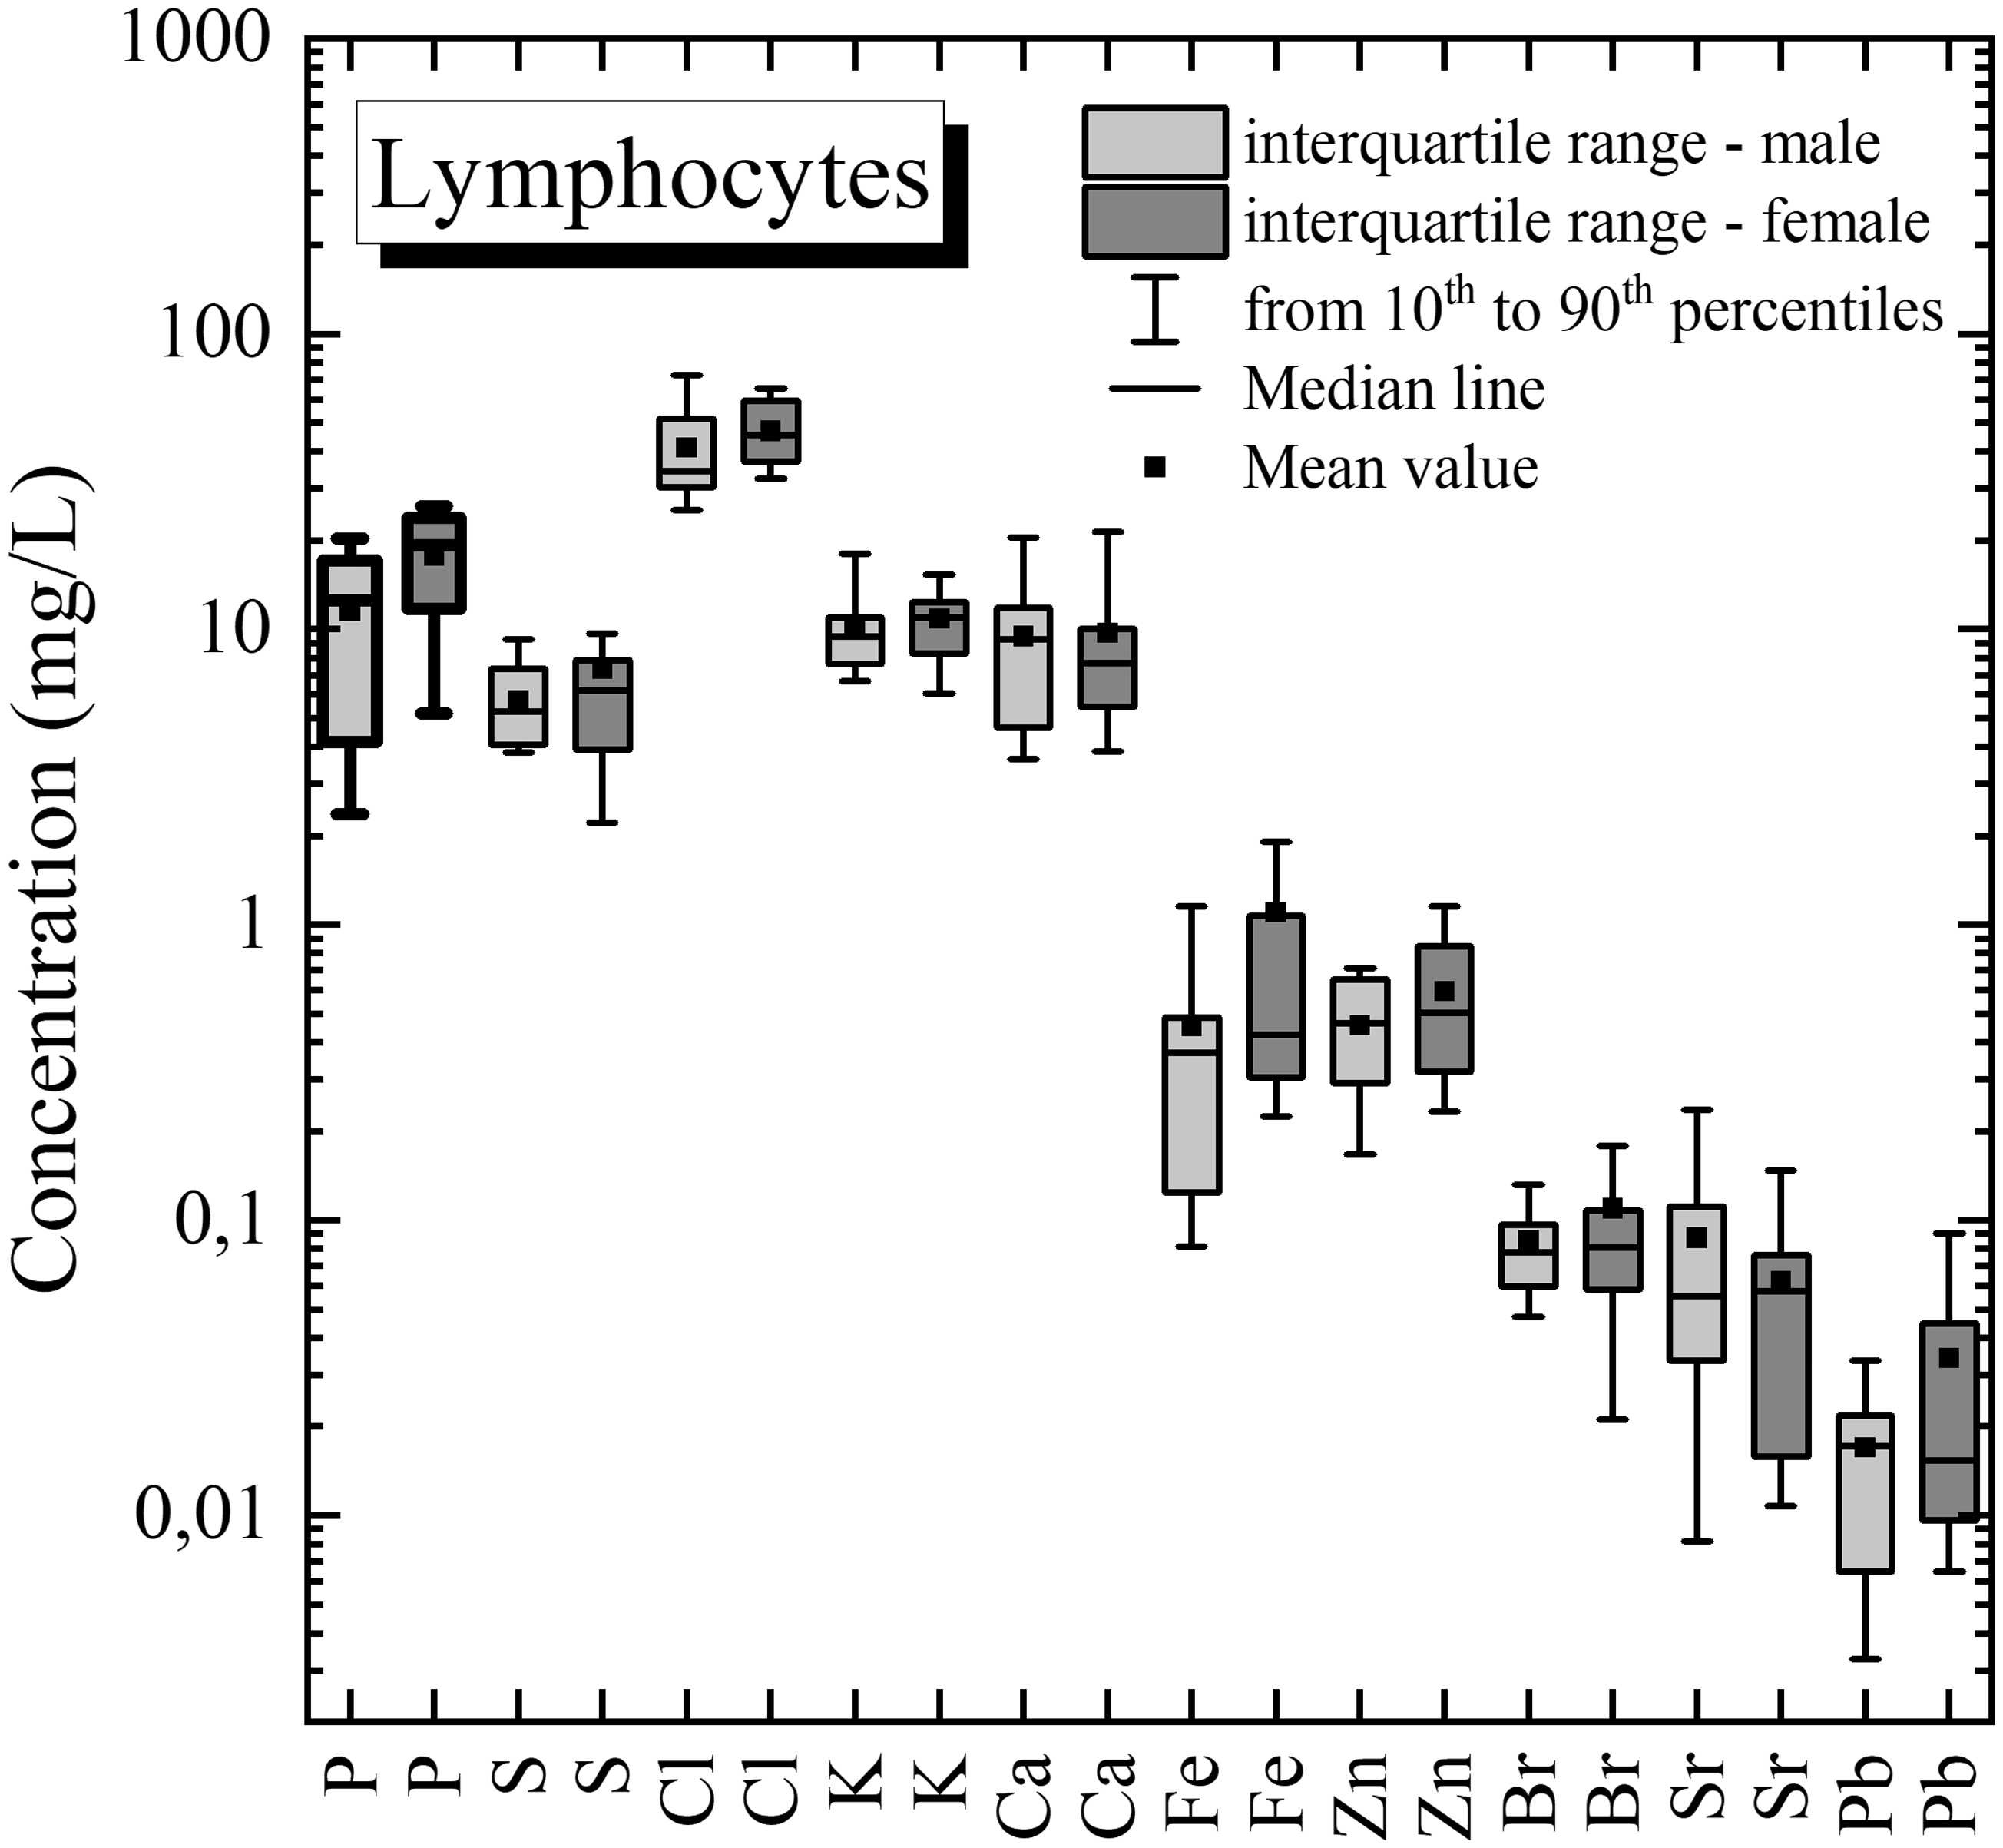
Statistical Analysis Between Groups
Element concentration in the studied blood components was statistically compared using the non-parametric Mann–Whitney test (for two groups comparison) and Kruskal–Wallis test (for three groups comparison). In multigroup comparison, in a null hypothesis H0, it was assumed that concentration distributions for given element for lymphocytes, erythrocytes, and plasma groups were the same (an alternative hypothesis H1: concentration distributions were different). In a two-group comparison, concentration distributions were compared between different pairs of blood components (lymphocytes and erythrocytes, lymphocytes, and plasma, erythrocytes, and plasma) with analogous hypotheses H0 and H1. Tests were performed both for all samples and separately for male and female groups.
Results of the multigroup and two-group statistical comparison of element concentration in different blood components (non-parametric Mann–Whitney test and Kruskal–Wallis test, significance level α = 0.05).
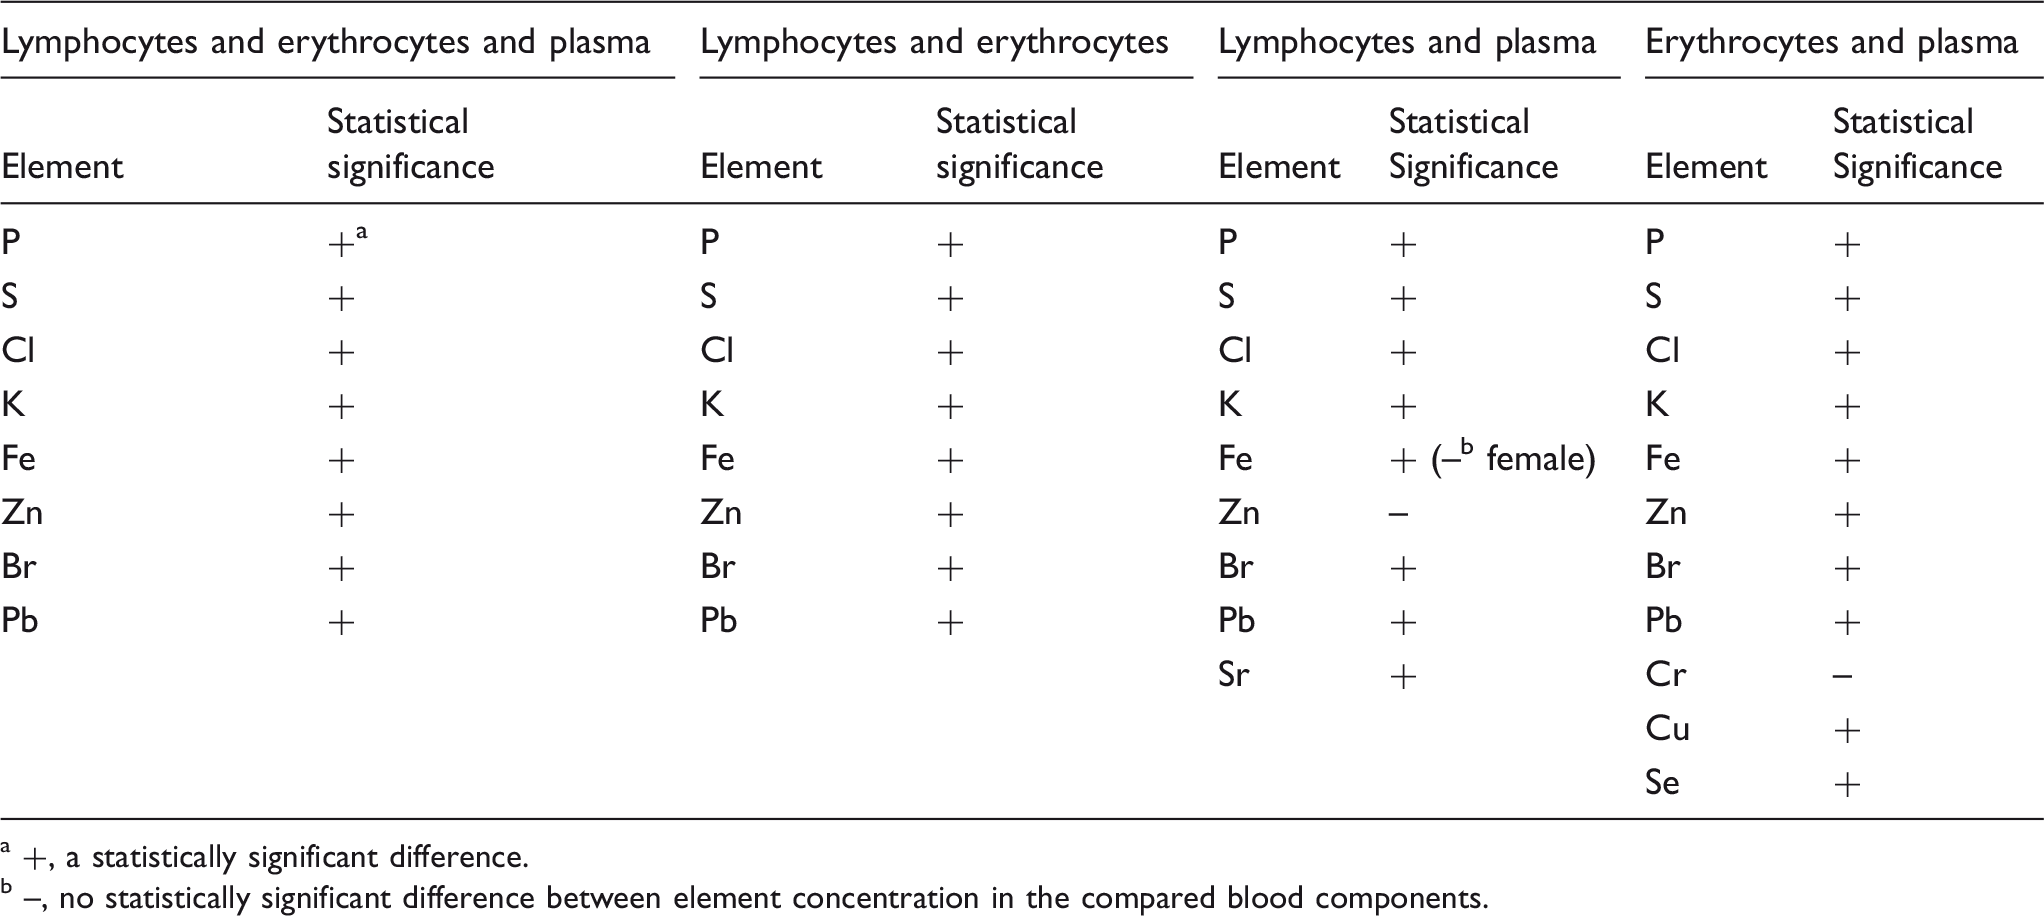
+, a statistically significant difference.
–, no statistically significant difference between element concentration in the compared blood components.
In lymphocytes and plasma, no statistically significant difference was observed in zinc (Zn) concentration distribution (all samples, male group, female group) and in iron concentration distribution (only for female group). In erythrocytes and plasma, no statistically significant differences were found for Cr (all samples, male group, female group).
Review of Literature-Based Data
As part of the presented research, a review of the literature-based data on elemental content in lymphocytes, erythrocytes, and plasma was also conducted.
Lymphocytes have been tested using several methods for determining the element concentrations, such as AAS,13,16,18 ETAAS,10,14,15 and ICP-OES. 10 In the studies, for example, it was found out that in the case of diseases such as type II diabetes, 10 insulin-dependent diabetes mellitus, 1 and tachyarrhythmia, 48 the concentrations of V, Fe, 10 Cu, Zn, 1 and K 48 increased, while the concentrations of Mn and Se 10 decreased, respectively in comparison to healthy donors.
Element concentration measurements in peripheral blood erythrocytes were performed using such methods as, NAA (reviews in Pleban et al. 19 and Baruthio et al. 20 ), PZAA (review in Pleban et al. 19 ), energy dispersive X-ray fluorescence, 30 AAS,12,13,16,17,22 ETAAS,10,14 ICP-OES,10,15 and X-ray fluorescence (with Vitoux et al. 25 ). The data were obtained for healthy donors and patients. Levels of concentrations were found for Cr, Co, and Ni for people suffering from psoriasis vulgaris, 23 Ca, Cr, Cu, Mn, and Mg in premenstrual syndrome, 32 Zn in hypothyroidism,37,42 Mn in gestational trophoblastic disease. 31 In this research, also the Zn in premenopausal women with breast cancer, 36 Zn in children with atopic dermatitis, 49 and Se in goitrous children 50 were discussed. The studied topics covered: Se in insulin-dependent diabetes, 1 Zn and Na for premenstrual syndrome patients, 32 Cu and Se in gestational trophoblastic disease, 31 Zn in nondialyzed chronic kidney disease, 51 Cu and Zn in Down's syndrome as well as cystic fibrosis, 42 Zn and Mg in leukemia and hypertension, 42 Zn in insulin-dependent diabetes, 1 and Mg, Al together with Cr in chronic renal failure, 26 Cu, Fe, Se, Zn, Ca, and Mg in essential hyperhidrosis 27 (which concentrations were higher than for healthy donors).
In the field of plasma research, various methods were used to determine the concentrations of elements, including: neutron activation analysis (NAA),19,20 electrothermal atomic absorption spectrometry (EAAS), 20 polarized Zeeman effect flame atomic absorption spectrometry (PZAA), 19 atomic absorption spectrometry (AAS),13,20–22,51–55 emission spectrography (ES), 52 spectrophotometry (S), 52 electrothermal atomic absorption spectrometry (ETAAS), 14 inductively coupled plasma–optical emission spectrometry (ICP-OES),10,15 proton-induced X-ray emission (PIXE), 56 and TXRF. 57 Data on the concentrations of elements in the plasma were differentiated by sex23,24,25 and age, 58 and were discussed as the reference values 59 or in the aspects of the following diseases affecting the donors: goiter, 50 proteinuria, 60 Down's syndrome and cystic fibrosis, 58 diabetes mellitus, 1 chronic renal failure, 26 and essential hyperhidrosis. 27
Due to the use of very different research methods, element concentrations were given using various units, such as µmol/l, µg/l, µg/100 ml, µg/ml, ng/ml, µg/dl, ng/ml, mg/l, nmol/l, µg/kg, mmol/l, mg/ml, and ppm, which hindered data comparison.
Tables IV to VI present literature-based data of element concentration in lymphocytes, erythrocytes, and plasma, respectively. Data were recalculated to mg/L (after normalization to 107 lymphocytes in mL and 1010 erythrocytes in mL). Data comparable with the results of presented studies were marked in bold. Taking into account the physiological dispersion of element concentration in human biological materials, the literature-based data were interpreted as comparable with presented results when the literature values were in the range between the minimum and maximum values of the element concentration obtained in presented studies (usually comparable value was also in the range between the 10th and 90th percentile of concentration).
Literature-based data of element concentration (mg/L) in lymphocytes.
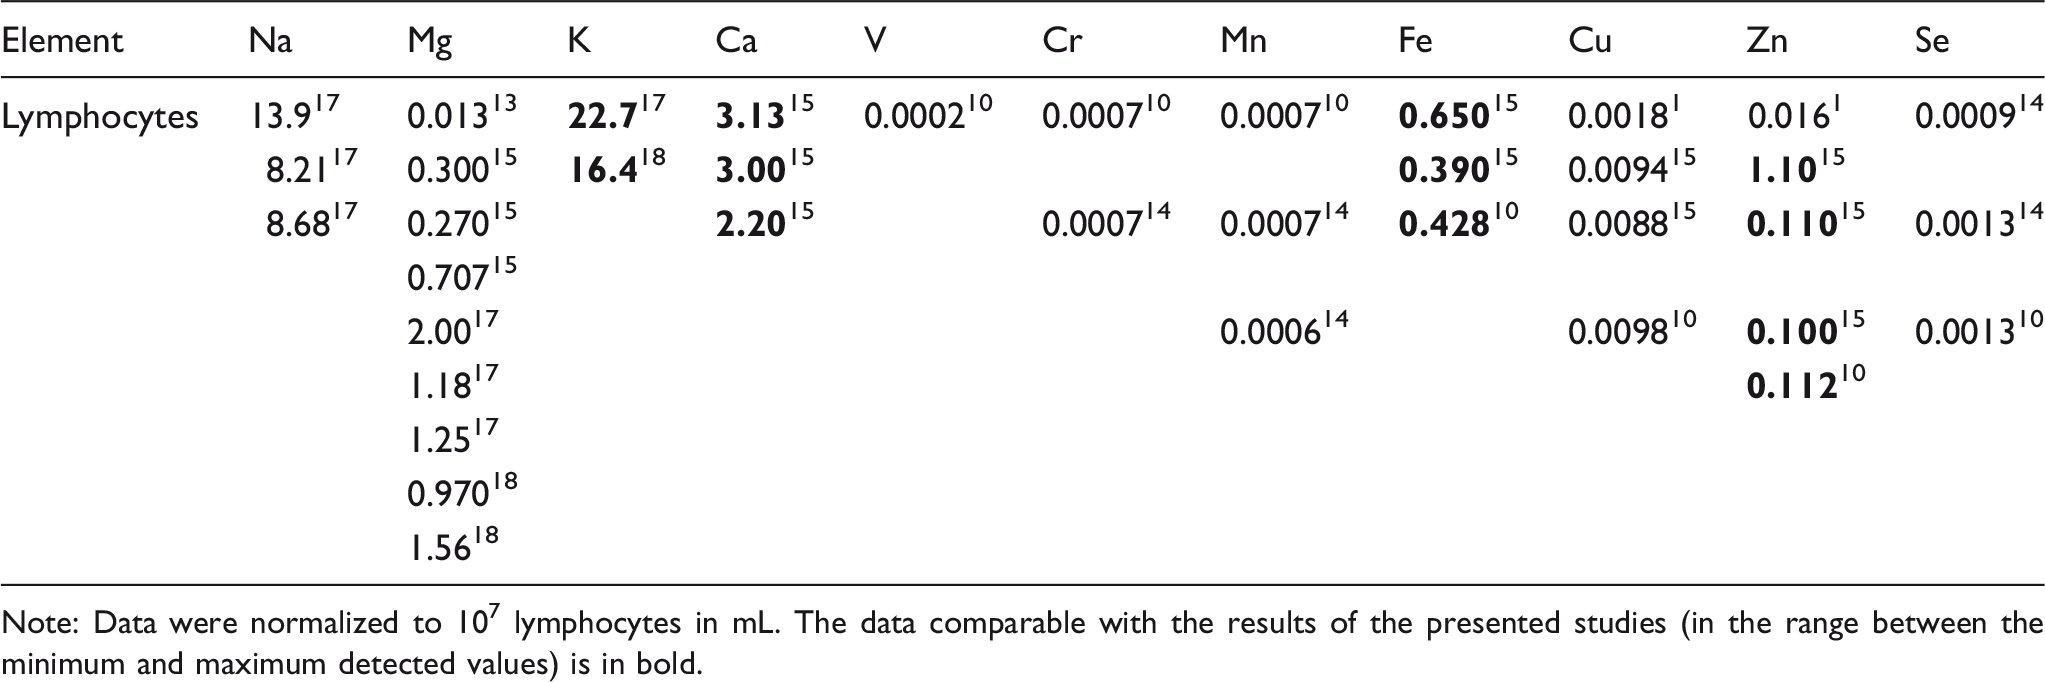
Note: Data were normalized to 107 lymphocytes in mL. The data comparable with the results of the presented studies (in the range between the minimum and maximum detected values) is in bold.
Literature-based data of element concentration (mg/L) in erythrocytes.
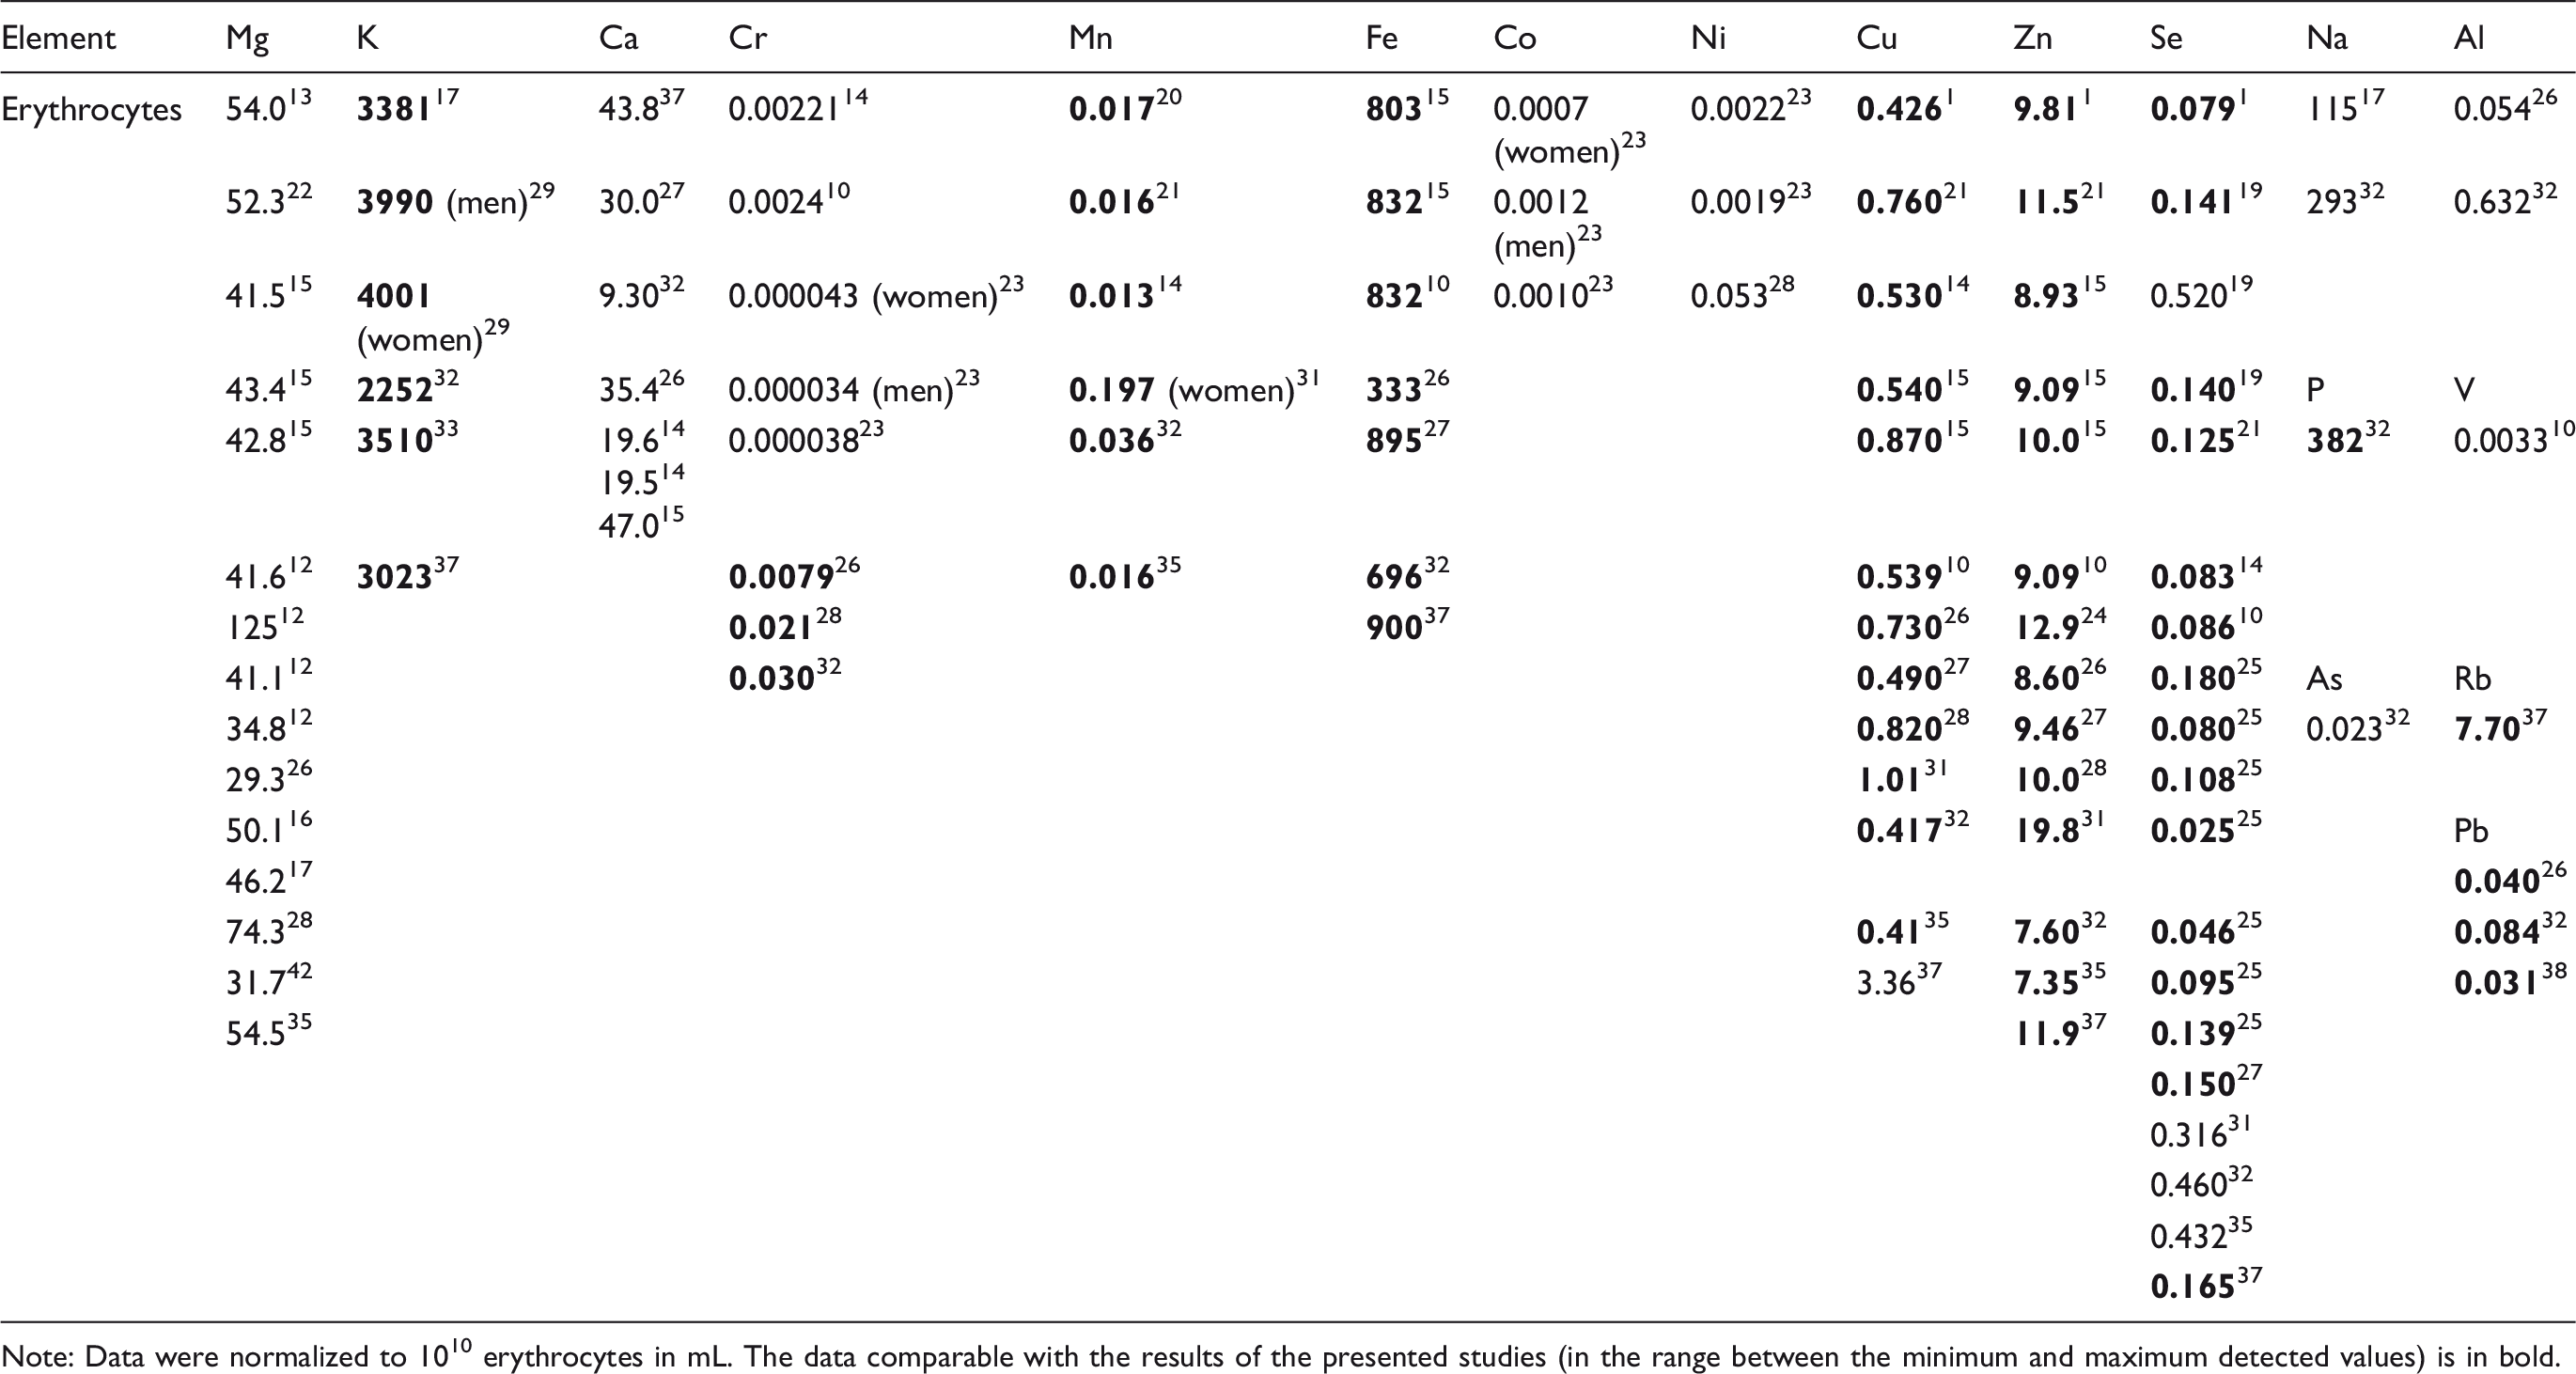
Note: Data were normalized to 1010 erythrocytes in mL. The data comparable with the results of the presented studies (in the range between the minimum and maximum detected values) is in bold.
Literature-based data of element concentration (mg/L) in plasma.
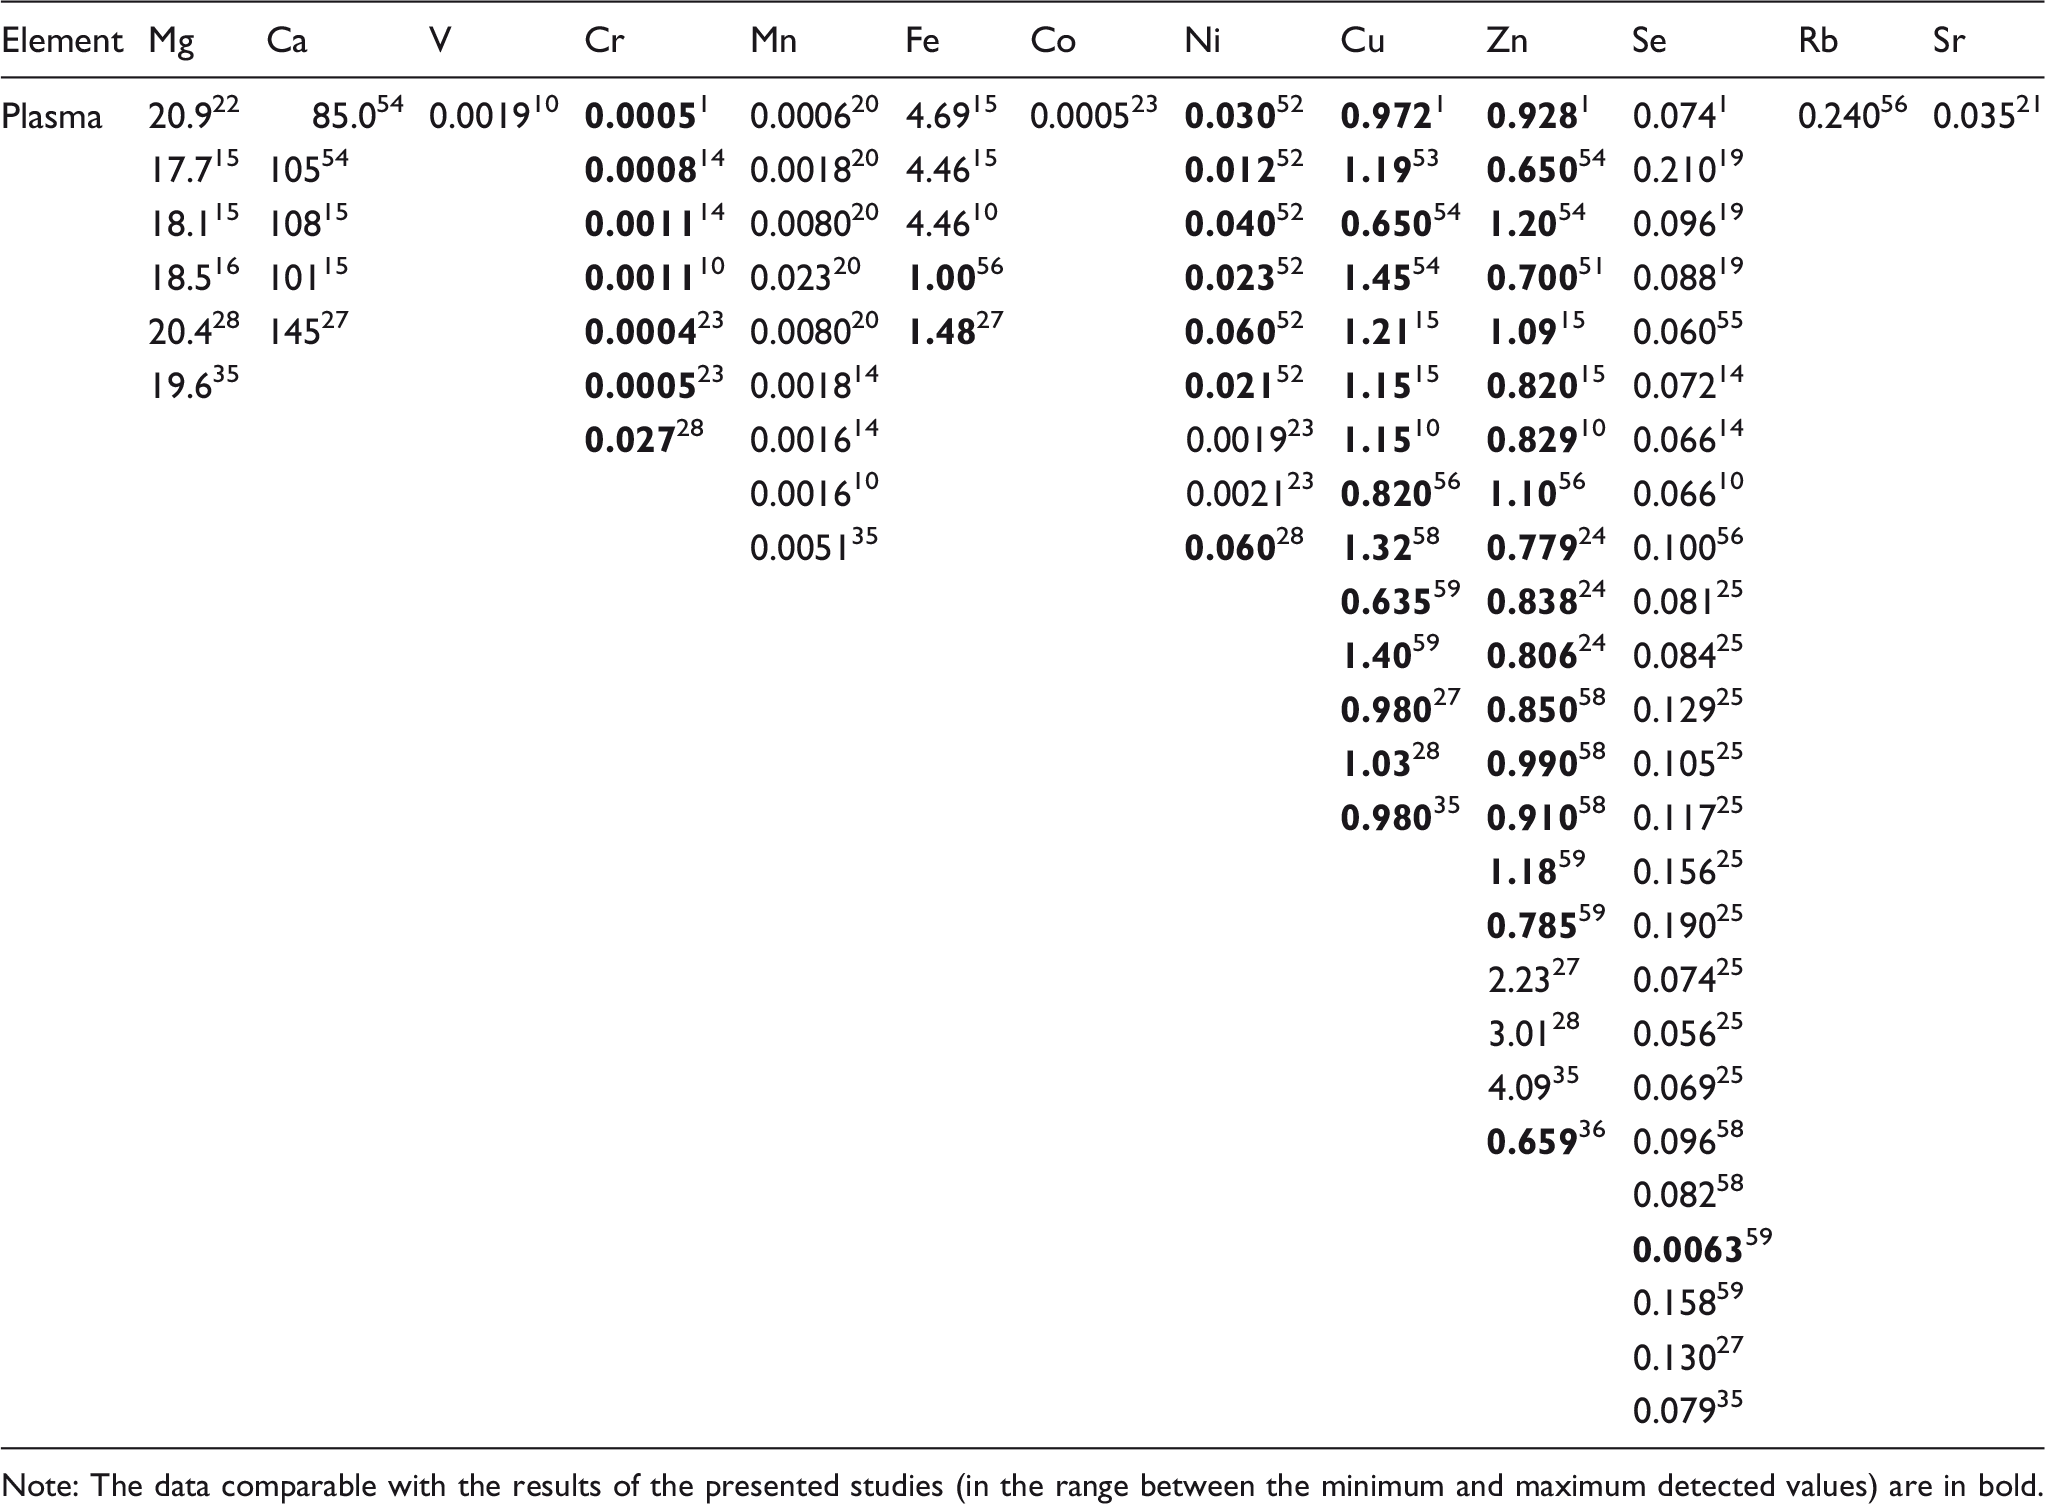
Note: The data comparable with the results of the presented studies (in the range between the minimum and maximum detected values) are in bold.
In this work, the application of the TXRF method allowed additionally for the simultaneous determination of the concentrations of such elements as: P, S, Cl, Br, Sr, and Pb in lymphocytes, S, Cl, and Br in erythrocytes, and P, S, Cl, K, Ti, Br, and Pb in plasma.
Conclusion
The TXRF method was used to determine element concentrations in isolated components of peripheral blood for 36 healthy donors, including 15 men and 21 women, with detection limit on the level 0.001 mg/L. Technical details of the TXRF method in the context of lymphocytes, erythrocytes, and plasma analysis were presented. Using the TXRF method, the following elements were identified: P, S, Cl, K, Ca, Fe, Zn, Br, Sr, and Pb for lymphocytes; P, S, Cl, K, Cr, Mn, Fe, Cu, Zn, Se, Br, Rb, and Pb for erythrocytes; and P, S, Cl, K, Ti, V, Cr, Fe, Co, Ni, Cu, Zn, Se, Br, Sr, and Pb for plasma. Statistical analysis of element concentration was performed both for all samples and separately for male and female groups. The obtained data can be used as reference values for lymphocytes, erythrocytes, and plasma samples.
The non-parametric Mann–Whitney test was applied to compare concentration in male and female groups. Statistically significant differences were found for: P (lymphocytes), Se and Rb (erythrocytes), and V (plasma). For the remainder of the elements, no statistically significant differences were found. The element concentration comparison (non-parametric Mann–Whitney and Kruskal–Wallis tests) between different blood compounds indicated statistically significant differences almost for all elements except for Zn and Fe (female group) in lymphocytes and plasma, and Cr in erythrocytes and plasma groups.
As part of the presented research, a review of the literature-based data on elemental content in lymphocytes, erythrocytes, and plasma was also carried out. Element concentrations in lymphocytes, such as K, Ca, Fe, and Zn were comparable with data reported by other authors. Data for erythrocyte concentrations of elements such as P, K, Cr, Mn, Fe, Cu, Zn, Se, Rb, and Pb were consistent with prior studies. In the case of plasma, the data obtained in this work were comparable with the concentrations of elements reported in prior works for Cr, Fe, Ni, Cu, Zn, and Se.
Footnotes
Acknowledgment
The authors would like to acknowledge the contribution of the COST ACTION CA18130.
Declaration of Conflicting Interests
The author(s) declared no potential conflicts of interest with respect to the research, authorship, and/or publication of this article.
Funding
This work was supported by a statutory research grant [grant number 612 424] at Jan Kochanowski University, Kielce, Poland. The equipment was purchased thanks to the financial support of the European Regional Development Fund in the framework of the Development of the Eastern Poland Program (contract no. POPW.01.01.00-26-013/09-04).