
Abstract
In optical noninvasive glucose detection, how to detect the glucose-caused signals from the constant human variations and disturbed probing conditions is always the biggest challenge. Developing effective measurement strategies is essential to realize the detection. A near-infrared (NIR) spectroscopy-based strategy is studied to effectively solve the in vivo measurement issues, obtaining clean blood glucose-caused signals. Two solutions composing our strategy are applied to the NIR spectroscopy-based measurement system to acquire clean raw signals in the data collection, which are a customized high signal-to-noise ratio multi-ring InGaAs detector to reduce the influence of human variations, and a fixing and aiming method to reproduce a consistent measurement condition. Seventeen cases of glucose tolerance test (GTT) on healthy and diabetic volunteers were conducted to validate the strategy. The human experiment results clearly show that the expected blood glucose changes have been detected at 1550 nm. The average correlation coefficient of the 17 cases of GTT between light signal and glucose reference reaches 0.84. The proposed measurement strategy is verified feasible for the glucose detecting in vivo. The strategy provides references to further studies and product developments for the NIR spectroscopy-based glucose measurement and references to other optical measurements in vivo.
Introduction
More than 464 million diabetic patients worldwide endure fingertip blood sampling every day. 1 Noninvasive blood glucose measurement (NBGM) has always been a dream for this group of patients. Once available, diabetes treatment will be greatly improved. Quasi-continuous glucose monitoring data will benefit critical patients and provide support for basic research related to diabetes and health management.
Researchers have attempted to optically detect blood glucose, such as polarization and rotation of light,2–4 infrared spectroscopy,5,6 optical coherence tomography (OCT), 7 Raman spectroscopy, 8 and photoacoustic spectroscopy,9–12 as early as the 1980s. The principles of these optical methods are clear and proved feasible in in vitro or phantoms experiments. There are rich research achievements about the optical properties of tissues and their changes with glucose.6,7,13–15 And mathematical methods such as multivariate analysis and artificial intelligence algorithms also provide powerful mathematical tools.14,16 Meanwhile, new detection equipment such as quantum cascade laser and high signal-to-noise ratio (SNR) detectors also offer strong hardware support.17,18
With the development of new technologies, good in vivo test results under strict experimental conditions have been obtained using mid-infrared absorption spectroscopy, 19 photoacoustic spectroscopy,9–12 near-infrared (NIR) spectroscopy, 20 Raman spectroscopy, 8 etc., which have verified the feasibility of in vivo situation with these methods. For glucose measurement, each method has advantages and encounters challenges, for example, (i) Raman spectroscopy has good spectral specificity but needs high-power excitation light to irradiate skin; (ii) the glucose absorption at the mid-infrared band is strong, but the light can only propagate in a shallow depth due to the strong absorption of water in skin; (iii) photoacoustic spectroscopy, needs high-power excitation light to generate the acoustic signal; and (iv) the detection depth of NIR light (about several millimeters for 1000–1600 nm) is deeper than mid-infrared light and the influence of scattering caused by glucose becomes stronger.
Over the past decades, optical detection theories have been well developed and hardware platforms have become powerful enough. So far, unfortunately, all of the noninvasive glucose measurements based on optical methods do not meet the clinical requirements, not even close. Among many reasons, the following two common issues might be blamed for the long-delayed success regardless of the intrinsic shortages of various methods mentioned above. The first issue is an incomplete understanding about how to eliminate the influence of uncontrollable human variations in measurement; the second issue is a lack of effective and reliable approaches to control the measurement conditions for reducing the probing disturbances in daily routine tests. The so-called probing disturbances can be the changes on the probe–skin interface, for example, a change of test position, contact temperature, and contact pressure and angle. The human variations include muscle jitters or sweating, etc. In order to reduce the influence of probing disturbances/human variations, it is necessary to develop simple, effective, and easy to use measurement strategies. However, the related research is insufficient so far. Since NIR spectroscopy-based glucose measurement is widely studied and there are rich theoretical results and devices suitable for making products, this paper takes NIR spectroscopy-based glucose measurement as an example and proposes our strategy. The strategy can effectively reduce the influence of probing disturbances/human variations, to therefore obtain clean blood glucose-caused signals. Furthermore, our strategy can be extended to the similar measurements of other optical principles since most of the optical measurements in vivo need stabilize measurement conditions.
In the NIR spectroscopy field, researchers have attempted some approaches to reduce the influence of probing disturbances and human variations. In terms of reducing the influence of probing disturbances, for example, the first thing is to fix the test position and pressure.21,22 In addition, subjects are usually required to remain completely stationary during the measurement process to achieve good measurement stability, which is not conducive to clinical use. In terms of eliminating the influence of human variations, the signal differential method has been commonly used to suppress the common-mode human variations.16,23,24 The differential method can be performed on the two collected data at two source-detector separations (SDSs), or two wavelengths or two moments. Besides, in order to achieve a satisfactory signal-to-noise ratio (SNR) of the differential signal, improving the SNR for each original signal is necessary. For example, the multiple optical fibers arranged in a ring at the same SDS can be used to enhance light collection efficiency and meanwhile average the random fluctuations in the diffuse light,25,26 or the InGaAs detector with a proper photosensitive area is set on the skin surface to heighten light receiving. 27 The differential processing and improved light collection have greatly improved the SNR level for an in vivo signal. However, after these attempts, the residual influence of probing disturbances and human variations are still too great to meet expectations. In recent years, there are several reports on monitoring glucose by single wavelengths.18,28 Uwadaira et al. identified the optimal wavelengths among all used wavelengths according to their performance in human tests. 28 But the optimal wavelengths vary for different subjects in their tests. It is still difficult to understand the true sensitivity of a wavelength to glucose and acquire a stable glucose signal at a given single wavelength. Inevitably, researchers turn to another way by using multivariable or artificial intelligence algorithms to further eliminate the residual influences and extract true glucose information. Unfortunately, due to the complexity and diversity of the in vivo test variables this work may exceed the ability of current mathematics methods, and their results may be involved with chance correlation.
It is risky to rely too much on the mathematical methods to solve the in vivo measurement issues. Instead, we believe there is a more reasonable and reliable way that the clean glucose-caused signal can be directly acquired in the signal acquisition stage by effectively suppressing the probing disturbances and the human variations, and the multivariable or artificial intelligence algorithms adopted in the computing stage only deal with the multicomponent modeling. In this paper, we propose such a strategy which consists of two specific solutions. Seventeen cases of glucose tolerance tests (GTTs) and one case of two consecutive GTTs were conducted to validate the feasibility of this strategy and the corresponding solutions.
In Vivo Measurement Strategy
This strategy was aimed at making the unwanted variations/disturbances go below the detection resolution level and consists of two solutions: Solution 1 to reduce the influence of uncontrollable human variations, and Solution 2 to control the probe–skin interface to stabilize the measurement conditions.
Solution 1: The vector signal was reduced to a scalar signal by means of a multi-ring detector in the signal collection stage so that scalar human variations could be differentially cancelled.
This solution was applied to reduce the influence of human variations, which refer to perturbations occurring inside the human body that directly or indirectly alter the microstructure of tissue and the refractive index of substances that cause jittering in diffuse light and random measurement errors. These types of perturbations are normally invisible, uncontrollable, and unmeasurable. Typical examples include (i) random muscle twitching, which alters the light propagation direction internally and affects the optical signals picked up by the detector, and (ii) human sweating, which causes variations in the optical coupling efficiency at the probe–skin boundary and some additional absorption along the optical path.
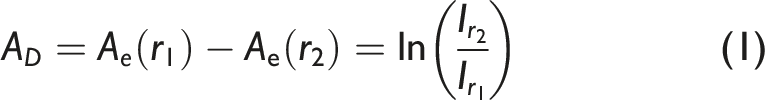
Due to the nature of human variations, the signals associated with in vivo detection normally occur anisotropically. We propose that the anisotropic optical vector signal must be reduced to a scalar signal in the signal collection stage by a specially designed ring detector placed around the light incident point so that the signal is independent of θ (Figure 1a). As a result, the anisotropic human variations are averaged angularly, and the signals become more stable. Then, differential cancellation is carried out by a pair of ring detectors on our customized multi-ring InGaAs detector (MRID), shown in Figures 1b–1c. The common-mode portion, such as the remaining human variations and system drift, can be cancelled by subtracting the outputs (or logarithm of the outputs) of the ring detectors with two SDSs. The differential absorbance AD under two SDSs (r1 and r2) can be calculated as Solution 1. (a) Diagrammatic sketch of the ring detector concept. (b) Differential measurement concept by two ring detectors. (c) Details of the MRID designed and used in Solution 1. (d–e) Comparison of human test results of disturbance cancellation of using traditional discrete round-shaped detectors (d) and our customized ring detectors (e). (Note: The absorbance 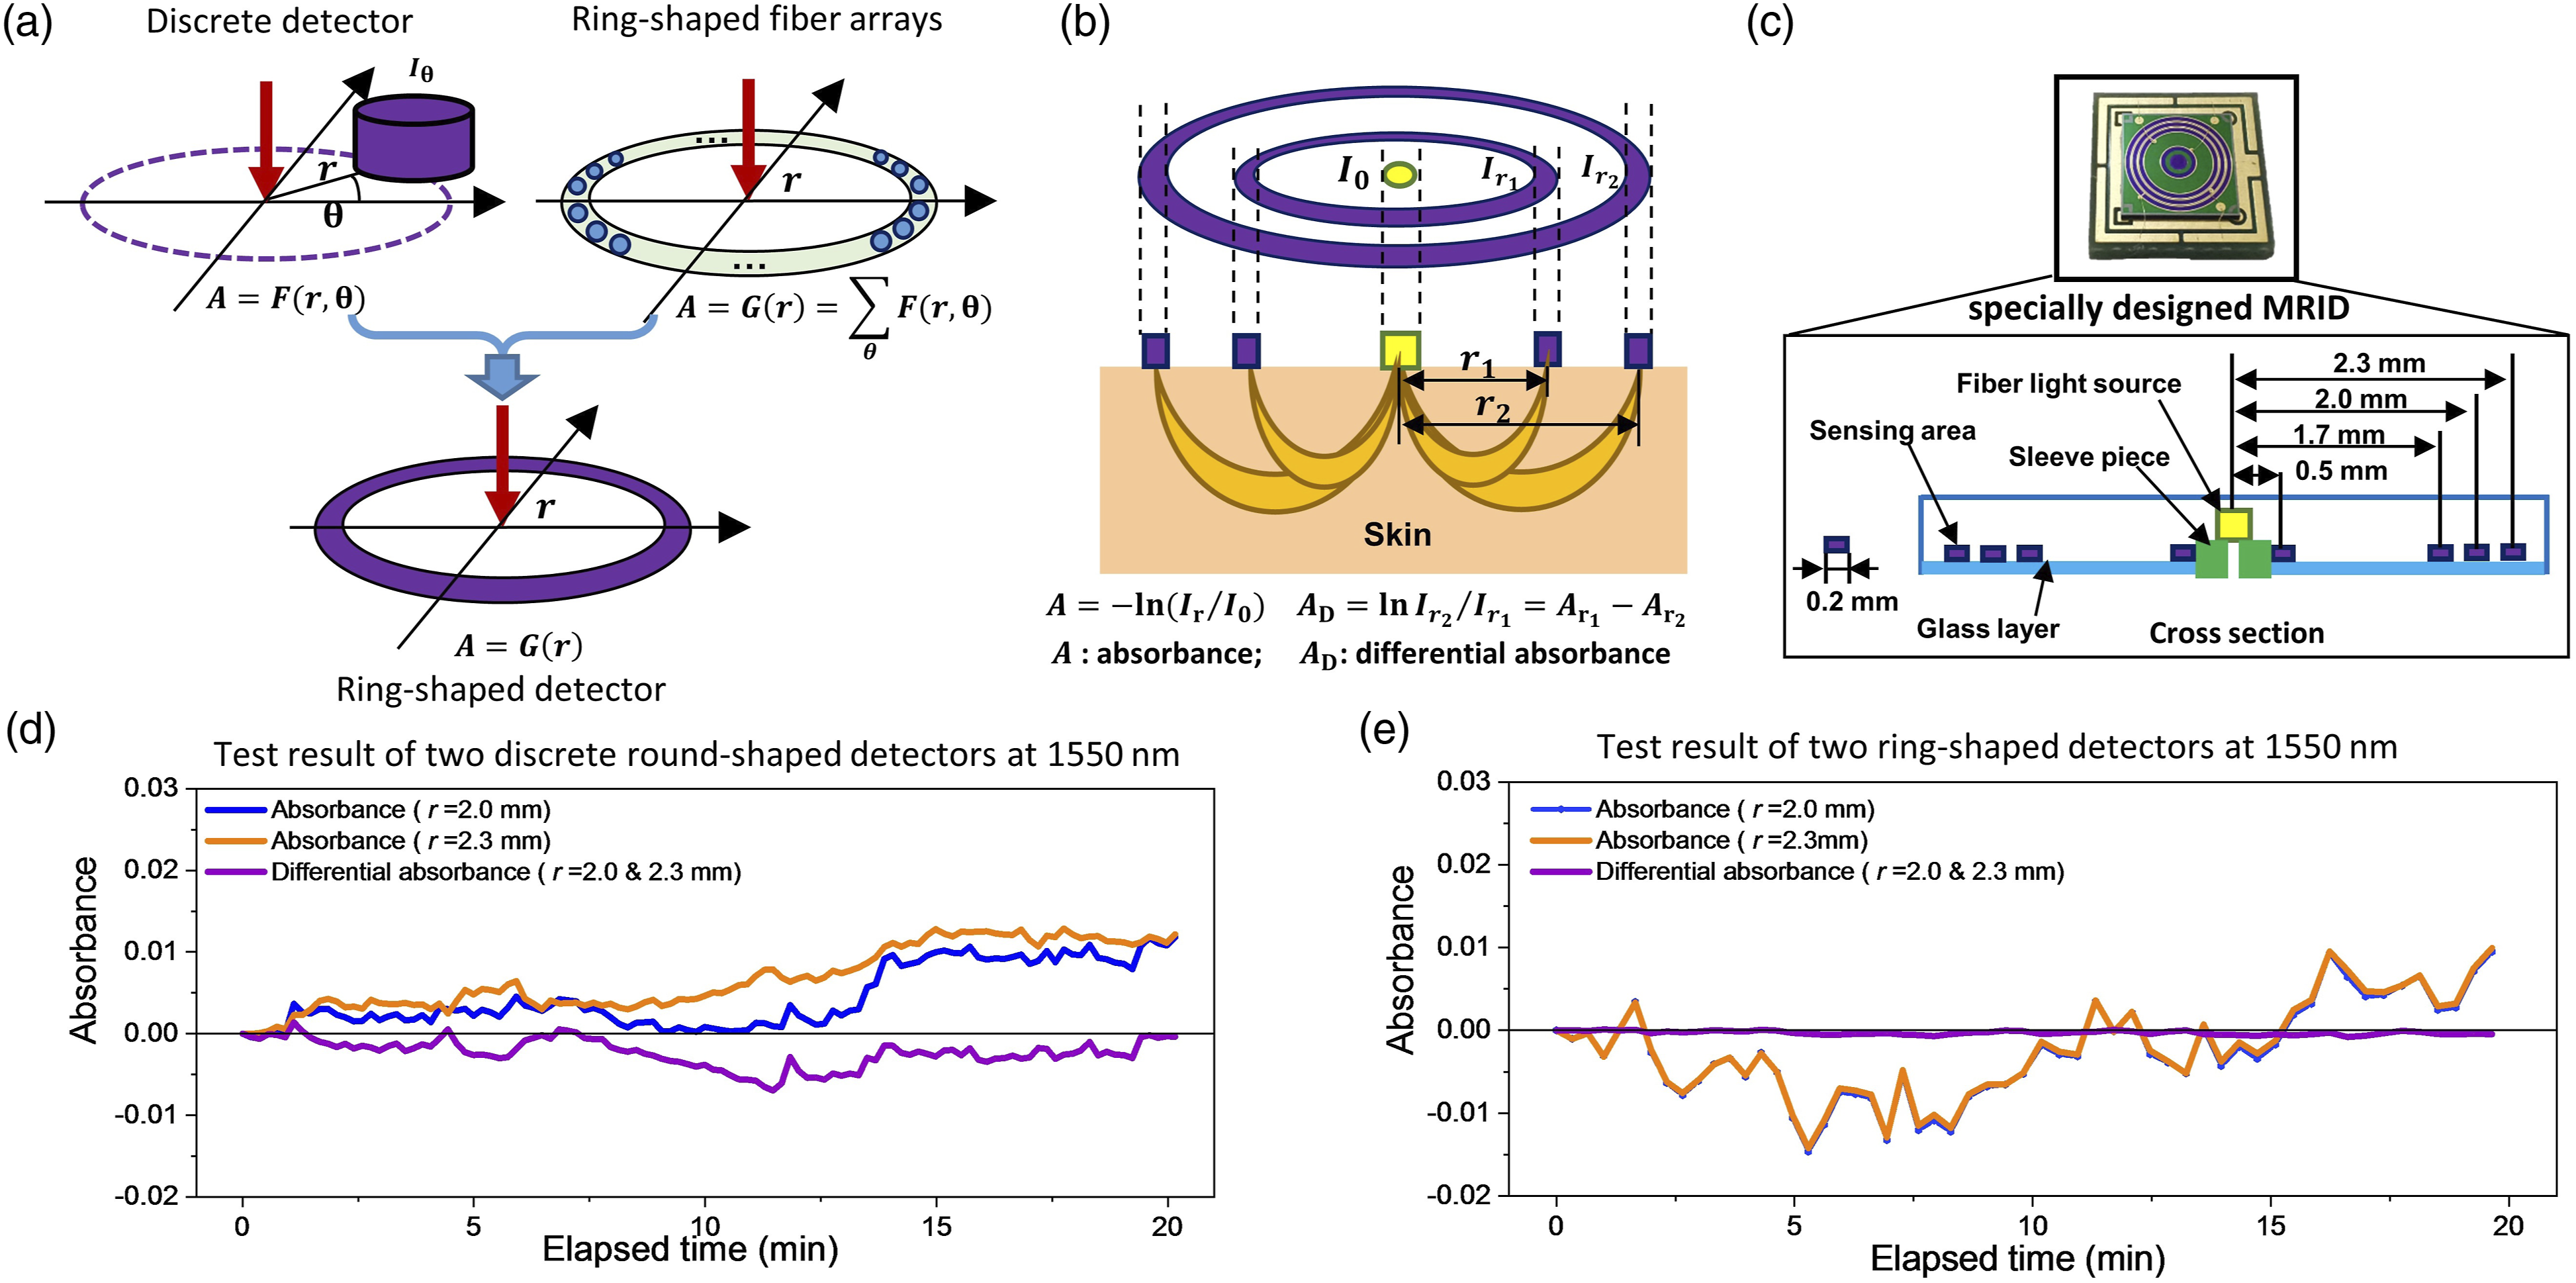
The MRID, as expected, played a key role in this solution. In existing methods, a differential device fed by two discrete detectors, or two ring-shaped fiber arrays, is normally chosen, such as in the setups shown in Figure 1a. These types of detector pairs do not work as expected in live human detection. To demonstrate the performance of MRID in disturbance cancellation, we designed a set of experiments. The experimental target is a pair of the ring detectors in MRID with the radius of 2.0 mm and 2.3 mm. The reference is a pair of discrete round-shaped ordinary detectors, with 1 mm radius of the sensing area. The two discrete detectors are placed 180° symmetrically along the center light source, with the SDS of 2.0 mm and 2.3 mm, respectively. The sensing area of the discrete detector is 3.14 mm2, which is approximately the same as the sensing area of the ring detector. Two tests were taken on the same probing position and same person over 20 min with the ring detector pair and the discrete detector pair. Figure 1d shows the curve measured by the discrete round-shaped single detectors. The signals picked up by the detectors are in the form of vectors, resulting in poor timing synchronization and instability. The differential absorption variation is as large as 0.006 arbitrary units (a.u.). Figure 1e shows the curve measured with the ring-shaped detectors. It is clear that the timing synchronization is greatly improved. With a signal dynamic range like that of the discrete detector, the differential absorption variation is reduced to 0.0005 a.u.
Solution 2: The internal and external measurement conditions were stabilized by means of a posture-aiming method and a probe-fixing method, respectively.
This method was applied to reduce the influence of probing disturbances, which refer to the relative geometrical position changes between the detection probe and the human body, or changes in other macro conditions. These types of conditions are normally visible, controllable, and measurable. Typical examples include (i) body posture changes causing muscle twisting tension variations, (ii) pressure disturbances around the detection area, and (iii) detection probe alignment error, laterally and angularly, relative to a predefined test point on the human body. These disturbances alter light propagation, causing the detection to stray from the baseline of the initial measurement condition that is dominated by the equivalent light pathlength and causes a systematic deviation.
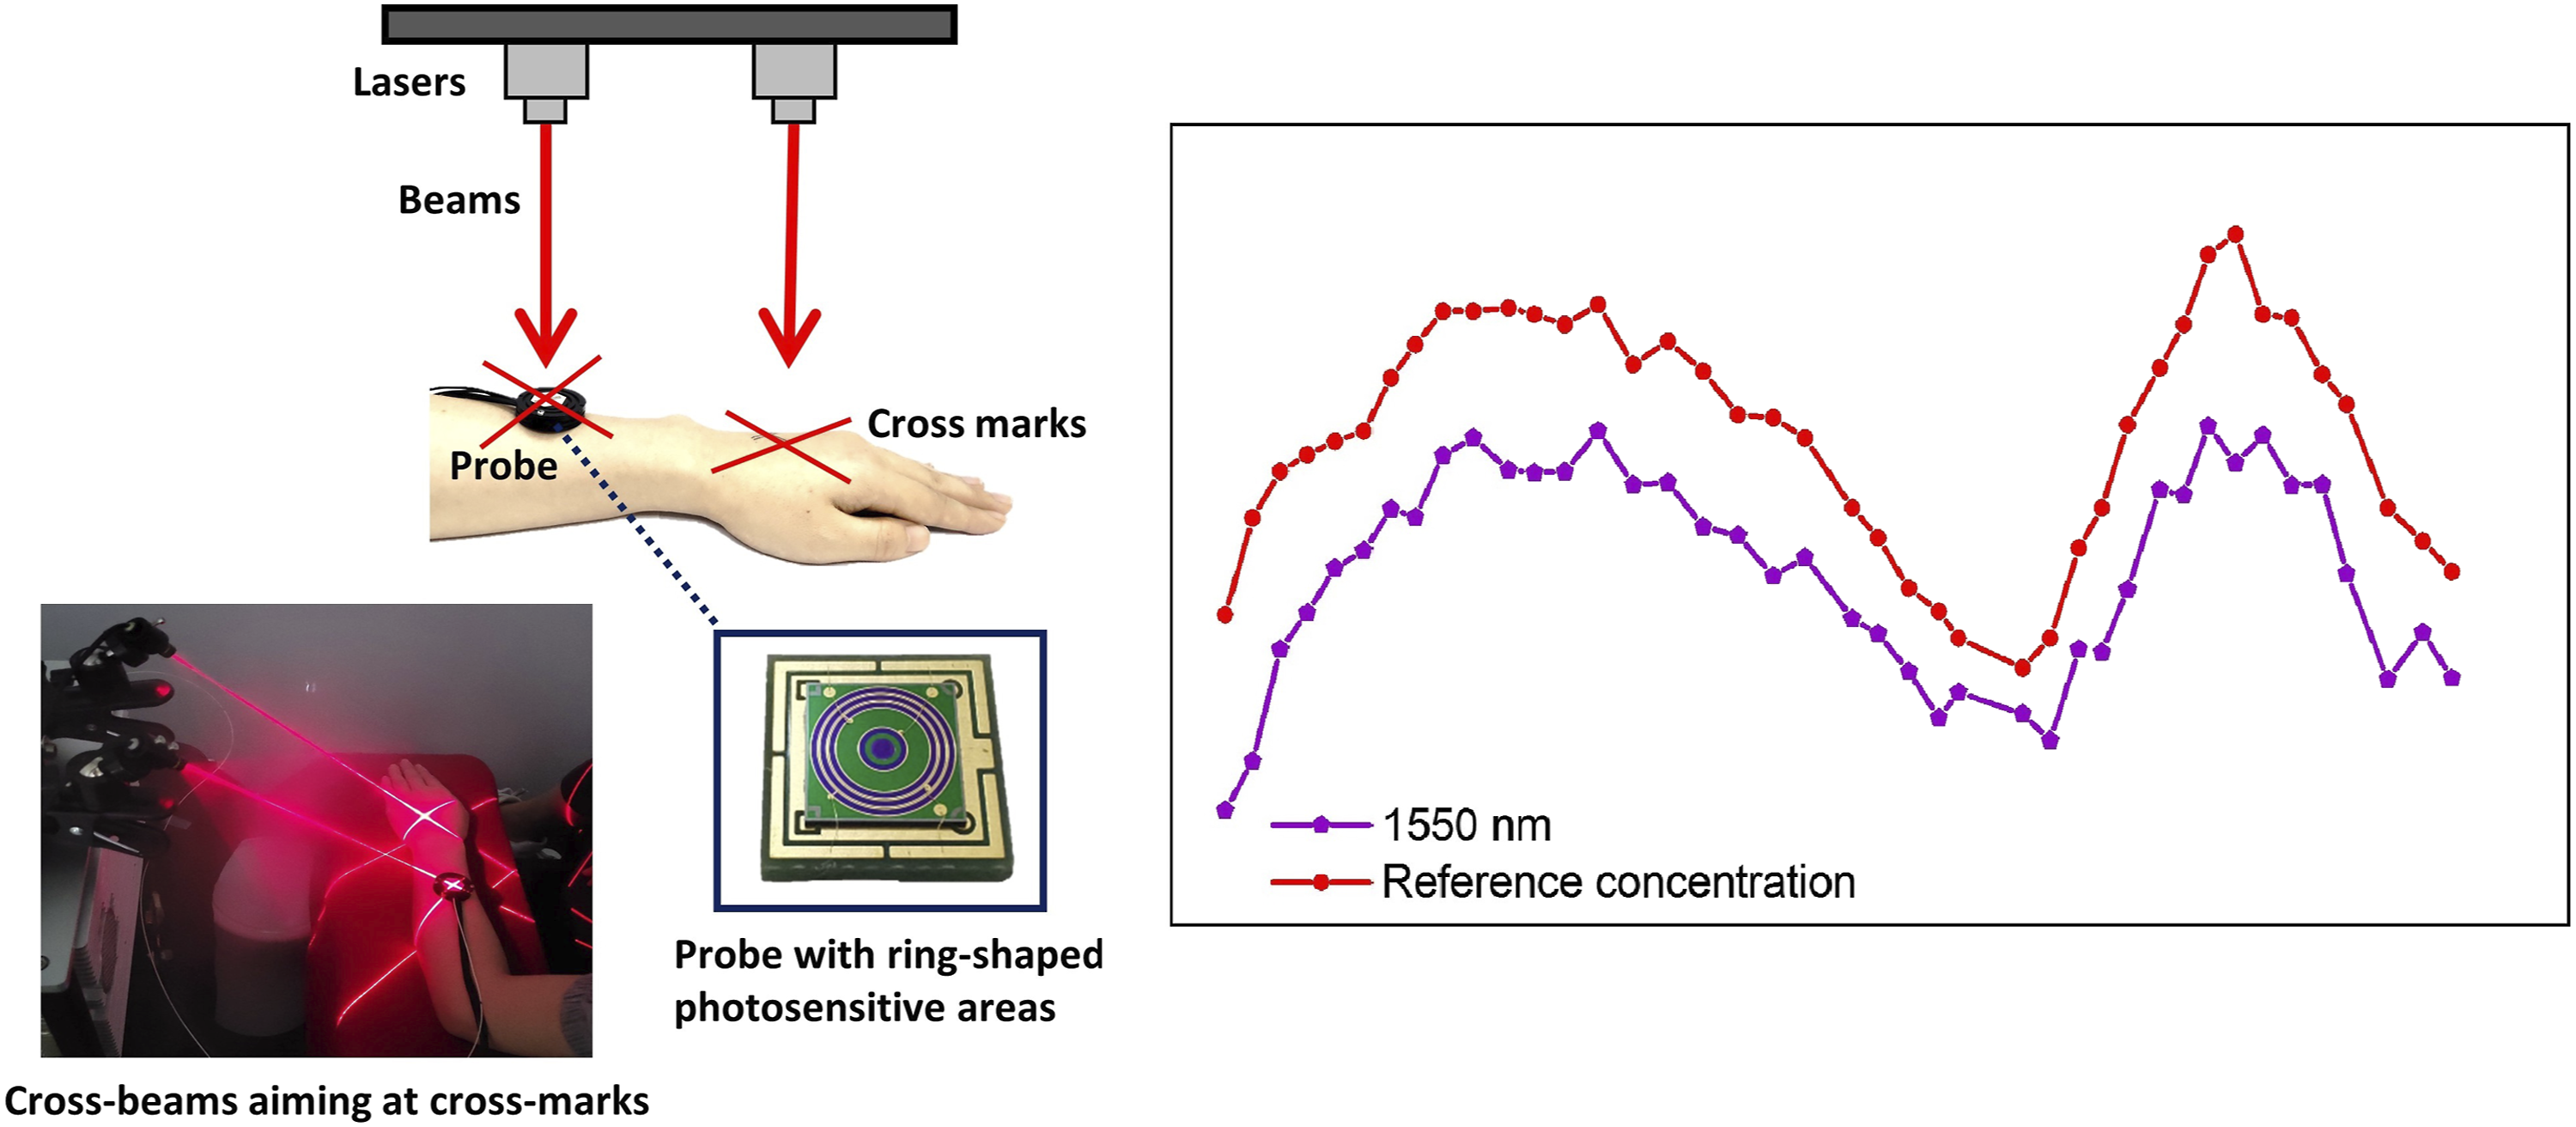
It should be emphasized that the developed detection probe is small and can be worn easily on the human body, so it is suitable for developing methods to maintain stable skin–probe contact. The probe-fixing method is simple but reliable, which can effectively stabilize the external measurement conditions. Figure 2a shows how the detection probe is affixed on the human body, that is, on the arm, for instance. The posture-aiming method is simple, feasible, and effective, which can effectively stabilize internal measurement conditions. Figure 2b demonstrates the aiming operation in which a pair of crosshairs are inked on the skin at the beam spots of two laser crosshairs projected by laser pointers to record the initial spatial orientation of the arm. Before each sampling, the forearm posture is readjusted to ensure that the two laser crosshairs coincide with the ink marks on the forearm. This momentary initial condition alignment is proven to be convenient and effective for maintaining a stable baseline and good repeatability. Figure 2c shows the record of the measurement processing. After each aiming operation, the differential absorbance dropped from 0.001 to 0.0005 a.u., meaning that the probing disturbances are greatly suppressed as the external and internal measurement conditions are stabilized by the fixing way and the aiming method, respectively. Solution 2. (a) The probe-fixing ways. (b) The aiming operation. (c) Test results after implementing fixing and aiming methods. (Note: The formulas below the figures (a–c) are used to indicate the absorbance AD and its influencing factors. With the implementation along with the fixing, aiming and differential methods, the absorbance changes from the AD affected by multiple factors to AD only changing with the glucose. The differential absorbance AD in the curve of figure (c) is deducted by the initial values at the beginning of the test.)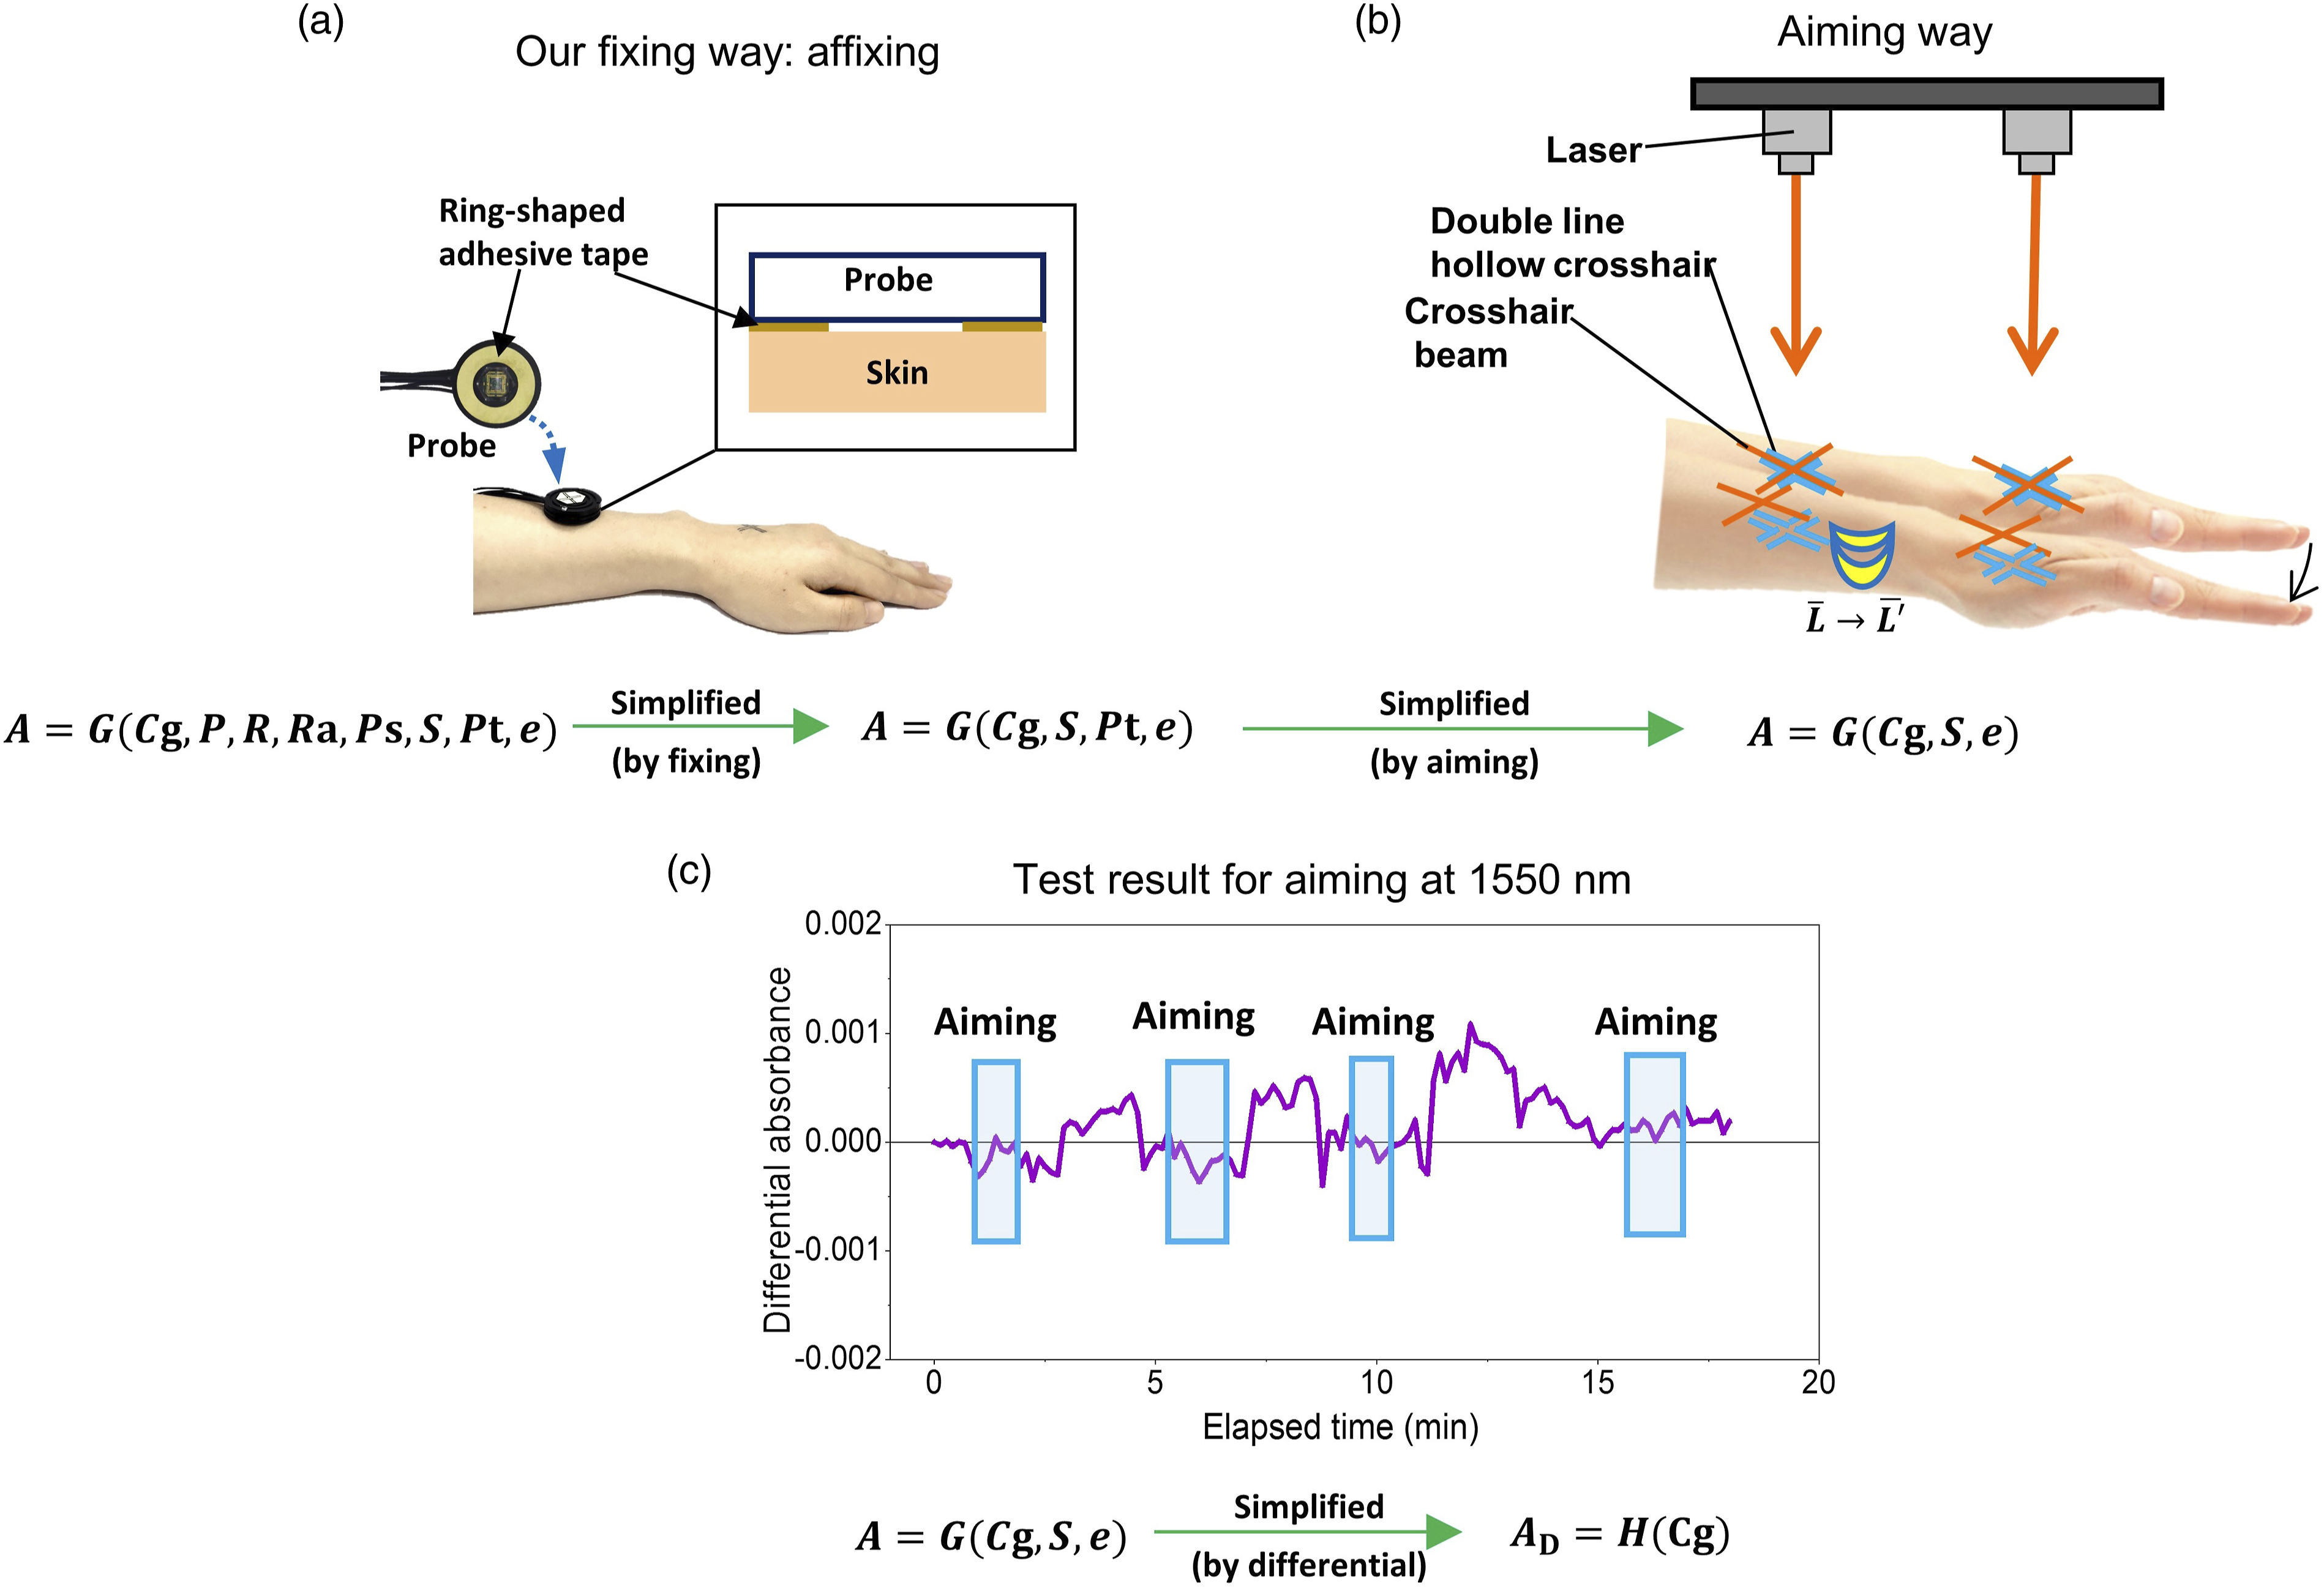
Although the two simple setups explained above worked perfectly in our test, they serve as concept demonstrations only. There is more room for improvement in terms of clinical practice. The two solutions were applied in the experiment system, as shown in Figure 3. Block diagram of the experiment system.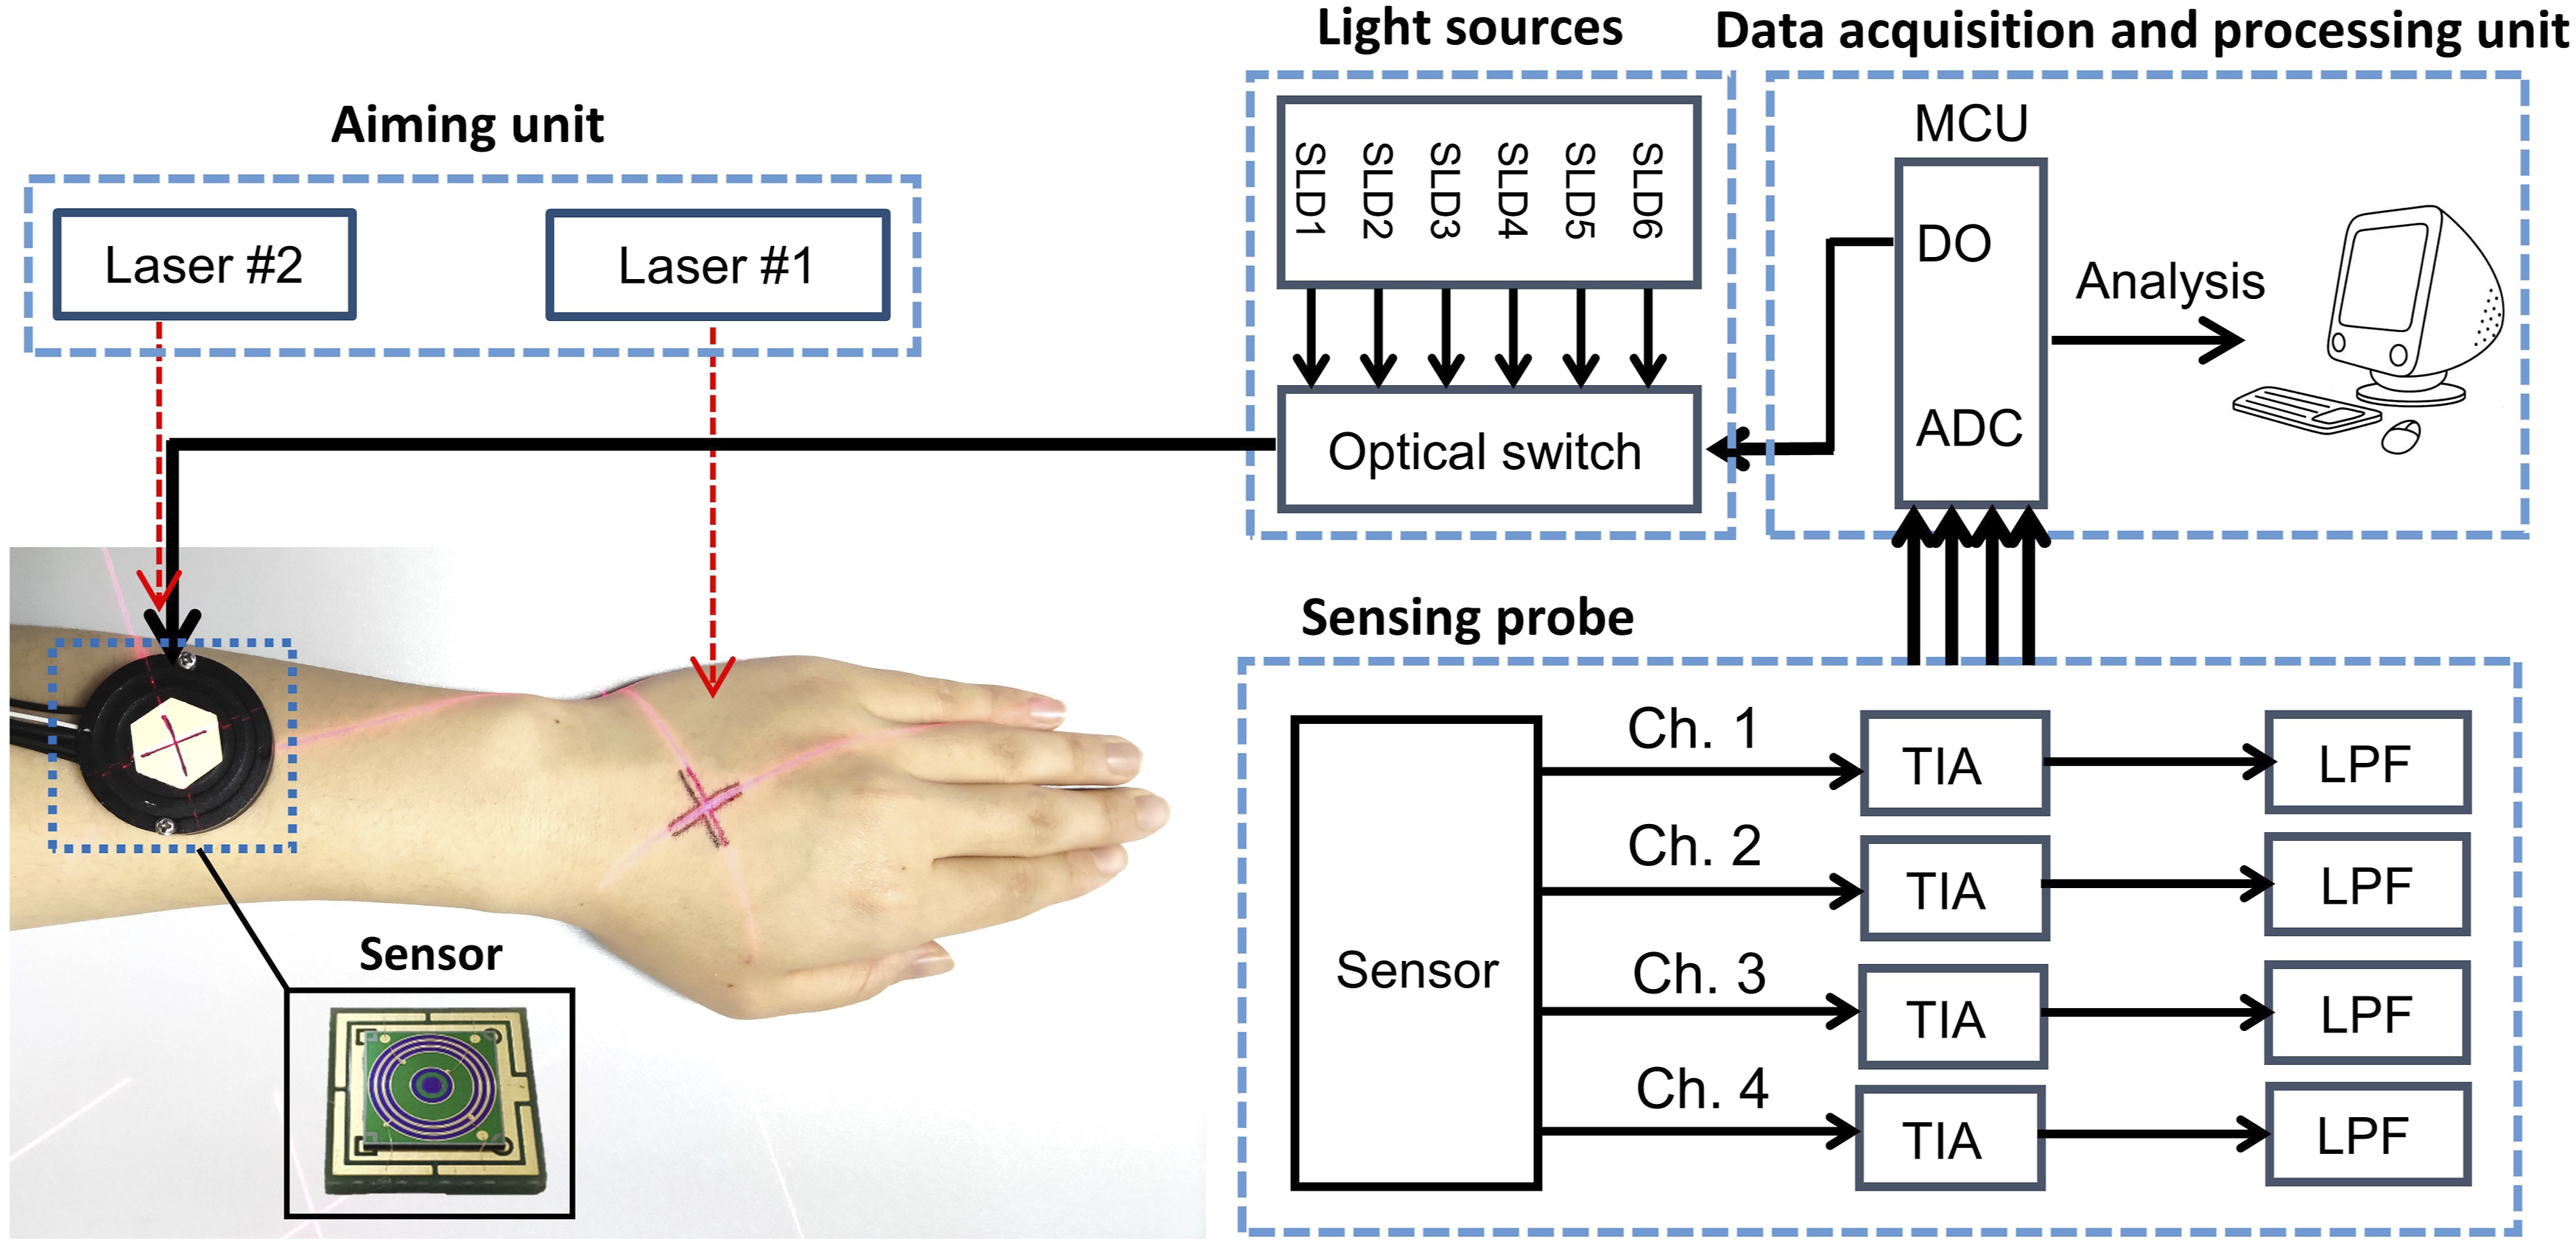
Experimental
Materials and Methods
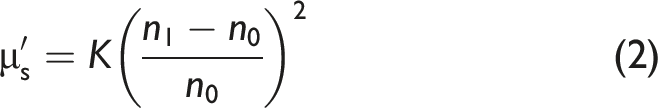
Glucose Measurement Principle. Near-infrared spectroscopy usually measures glucose by detecting the reflected diffuse light. Glucose changes diffuse light by affecting the optical properties of the region of interest, including the absorption coefficient and the scattering coefficient. When blood glucose concentration increases by 1 mmol·L−1, the absorption coefficient (Napierian, natural logarithmic) will increase by about 1–2*10−3 cm−1 in 1400–1600 nm.13,29 Meanwhile, the scattering coefficient will decrease due to the increase in the background refractive index, which affects the optical pathlength. The scattering coefficient change induced by 1 mmol·L−1 glucose might be far bigger than the change of absorption coefficient, being approximately −0.1 ∼ −0.3 cm−1 in 1000–1600 nm for in vivo cases.7,30–34 According to Maier’s theory, the reduced scattering coefficient can be expressed as
30
According to previous research, the change of scattering coefficient caused by glucose in living tissue is obviously greater than that in phantom solutions or in vitro tissues. 34 The change rate of scattering coefficient of human tissue measured by diffuse reflectance spectroscopy is about −0.1 ∼ −0.2% (mmol·L−1)−1.31–32 The results of OCT on living tissue also show that the response of coherent signal in living tissue can be dozens or hundreds of times of that in intralipid solutions or milk, due to the change of scattering coefficient.7,33–35 Larin et al. deduced that the change rate of scattering coefficient of human tissue reached −0.22% (mmol·L−1)−1 using Mie scattering theory. 7
Monte Carlo Simulation of Glucose Signal
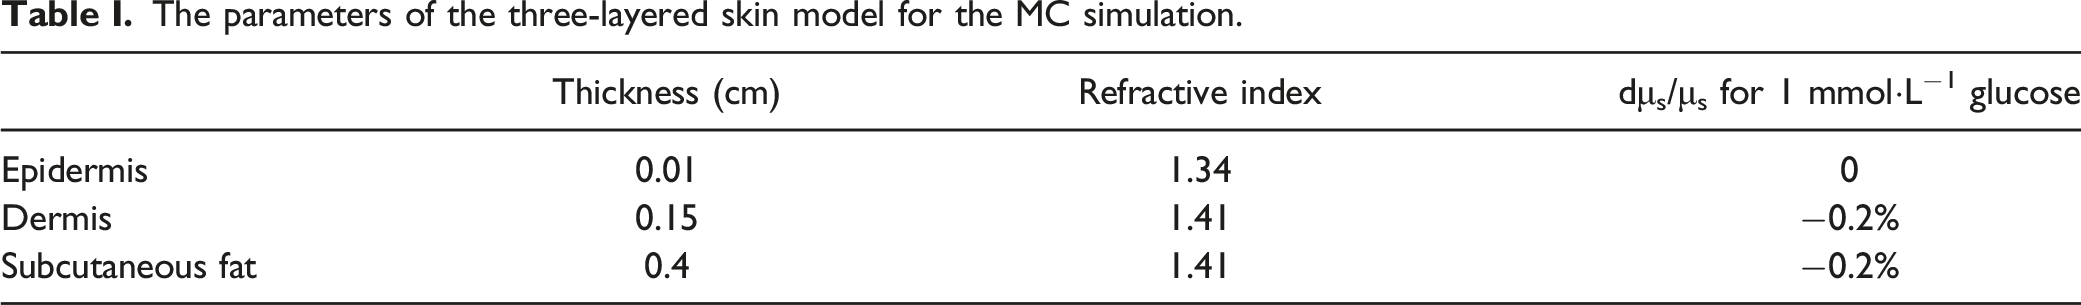
The parameters of the three-layered skin model for the MC simulation.
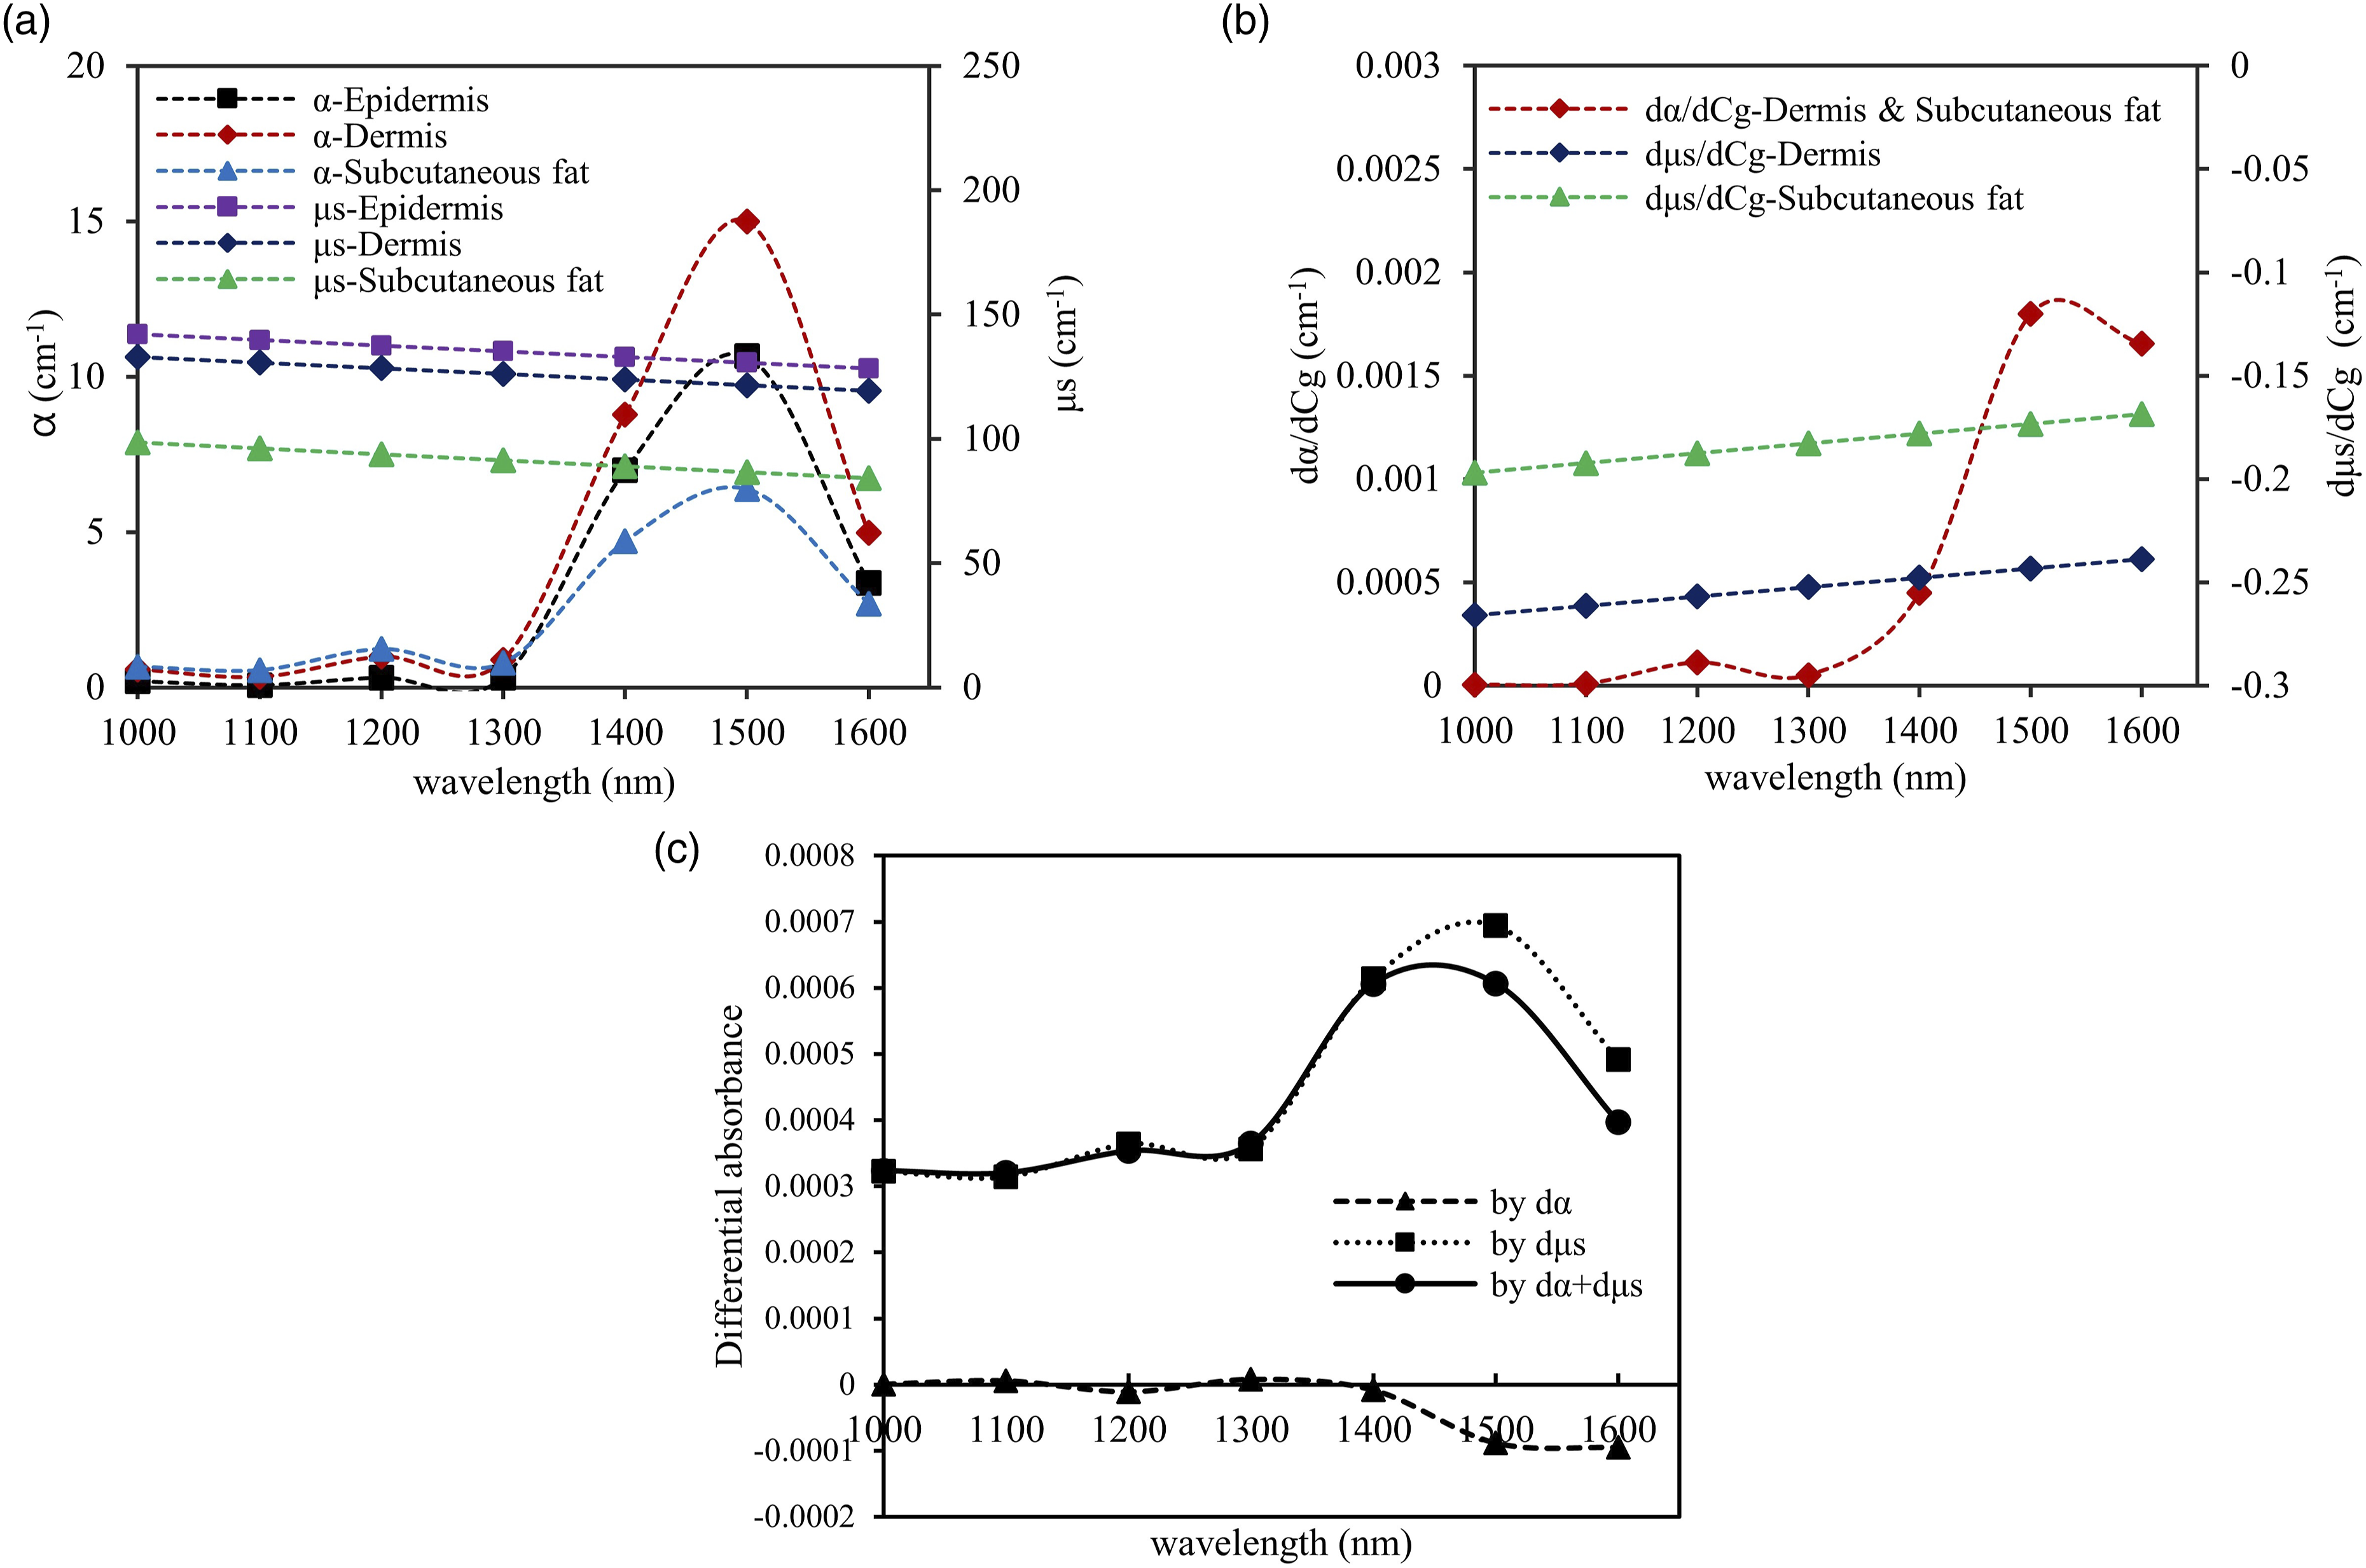
The parameters and the results of MC simulations. (a) Absorption coefficients and scattering coefficients of the three-layered skin model; (b) the coefficients change caused by 1 (mmol·L−1) glucose; and (c) simulation results of differential absorbance change caused by 1 (mmol·L−1) glucose, using SDSs of 2.0 (mm) and 2.3 (mm).
Differential Measurement Principle
We used a modified Beer–Lambert law
36
to simplify the measurement model and describe the principle of differential measurement. The relationship between diffuse reflectance and component concentration can be described as follows

In the human in vivo body measurements, the measured absorbance Ae can be affected by many factors such as the drifts caused by light source I0, and sweating causes additional absorption for G. For the absorbance at different but close SDSs, the drifts of I0 or the additional absorption caused by sweat can be considered as similar. Therefore, the differential method is used to reduce those disturbances,
24
and the differential absorbance AD under two SDSs (r1 and r2) can be calculated as
In addition, to illustrate the relationship between CD and Cg, further derivations are performed. As α and L in Eq. 4 change with glucose Cg approximately linearly with a very small linear change coefficient,7,13,29–33 the absorbance (product of α and L) will also vary approximately linearly with the glucose, that is, ΔAe ∝ ΔCg, where the absorbance change is a total differential caused by α and L together (ΔAe = Δα L + α ΔL). Similarly, the differential absorbance change can also be considered as linear with Cg, that is, ΔAD ∝ ΔCg.
Human Subject Experiments
System Configuration. The system is configured with a light source array, an optical switch, a sensing probe, and a data acquisition and processing unit. The light source array is assembled with six superluminescent diodes (Inphenix, U.S.A.), with an average power of 5 mW each and center wavelengths of 1050 nm, 1219 nm, 1314 nm, 1409 nm, 1550 nm, and 1609 nm. The incident light is guided by an optical fiber, with core diameter is 105 μm and silicon material. The photosensitive area of MRID is made up of InGaAs photodiodes (U-Science Co. Ltd., Japan). The width of the ring-shaped detectors is 0.2 mm, and the gap between two neighbored detectors is very small, only 0.1 mm. The detectors are independent to each other. Each wavelength data sampling takes approximately 3 s. The ambient temperature was stabilized to within 25–26 °C. The measurement temperature was set to be higher than the natural body temperature in order to conceal the non-uniformity and fluctuation in skin temperature. The skin was heated by the probe and the surface temperature of skin reached about 38 °C, which may vary slightly in different experiments, but it was stable and varied little in a single test with a deviation of about ± 0.2 °C.
Human Subjects. A total of nine healthy volunteers and six patients with diabetes (Type 2 diabetes mellitus) participated in the experiment, including seven males and eight females. The age distribution of the volunteers was two subjects aged 20–30 years, six subjects aged 30–50 years, and seven subjects aged 50–72 years. The six patients with diabetes were all aged 40–72 years.
Experimental Design. Human experiments with the glucose tolerance test were conducted to verify whether the glucose-caused signals detected with the strategy proposed above matched the glucose reference. For this purpose, two groups of in vivo experiments were conducted. The first group of verification experiments was designed to test whether the expected glucose-caused signals were detected in different individuals. We conducted 17 cases of single GTT on 15 individuals. The second group of verification experiments was designed to test whether the expected glucose-caused signals occurred in two consecutive GTTs. The main purpose of using two GTTs was to further prove that the measured signal is indeed caused by blood glucose change, thereby enhancing the credibility of the results of single GTT. Also, we can preliminarily investigate the feasibility of building an individual calibration model and the error level in predicting the glucose level at another time. We conducted one case with two GTTs.
Experimental Procedures. The subjects were in a fasting state before the experiment. An indwelling needle was embedded on the back of the right hand to retrieve blood. The lasers in the aiming unit were adjusted to illuminate the appropriate area of the probe and the back of the hand. Since the temperatures of the probe and the skin surface were always different, the probe had to be worn before each test to warm it up. It took 0.5–1 h to reach thermal equilibrium. Each GTT experiment was performed in approximately 2 h. The blood glucose value and diffuse light intensity were recorded under fasting conditions at the beginning of the GTT. Then, the subject took some food within 5–15 min. The subject took carbohydrates (about 60 g) and 50 mL of water during the meal. The carbohydrate intake in the GTT was roasted sweet potato, which has a high glycemic index. After that, the reference glucose and diffuse light intensity values were measured simultaneously at an interval of approximately 10 min. Before data sampling, the subject needed to readjust to the initial posture with the help of the aiming setups. Two portable glucose meters (GT-1820, Arkray, Japan) were used to invasively measure blood glucose as a reference, whose measurement error is ≤ 15 mg·dL−1 (0.83 mmol·L−1) for BG ≥ 100 mg·dL−1 (5.55 mmol·L−1) and ≤ 15% for BG ≤ 100 mg·dL−1 (5.55 mmol·L−1). The experiment with two consecutive GTTs required the subject to continue the experiment after the first GTT was completed and to eat again after the blood glucose had fallen to a low level. The experiment lasted approximately 5 h.
Results and Discussion
Pre-Evaluation Results
Guided by our strategy, the measurement system is constructed and evaluated (Figure 5). The variations within 1 h in the differential absorbance test for the diffuse reflectance standard and for a volunteer with a stable glucose concentration are approximately 0.0002 and 0.0007 a.u., respectively. These numbers correspond to the system noise level or the highest achievable glucose measurement resolution. It can be seen that the absorbance with a single SDS can be influenced obviously by in vivo disturbances such as pulse or blood flow, and by the system drifts, but the differential absorbance acquired from two SDSs can reach less than 0.0007 a.u. in the 1 h human test, meaning that the influence of in vivo disturbances and system drifts can be well reduced by differential measurement. Evaluation of the measurement system. (a) The experimental scene. (b) The result for 1 h measurement with a standard reflector (40% reflectance). (c) The 1 h measurement result from a human body at a stable blood glucose level. (d) The average light intensity of a human skin. (e) SNR for 1 min collected data. (Note: The absorbance A and differential absorbance AD in the results are deducted by the initial values at the beginning of the test.)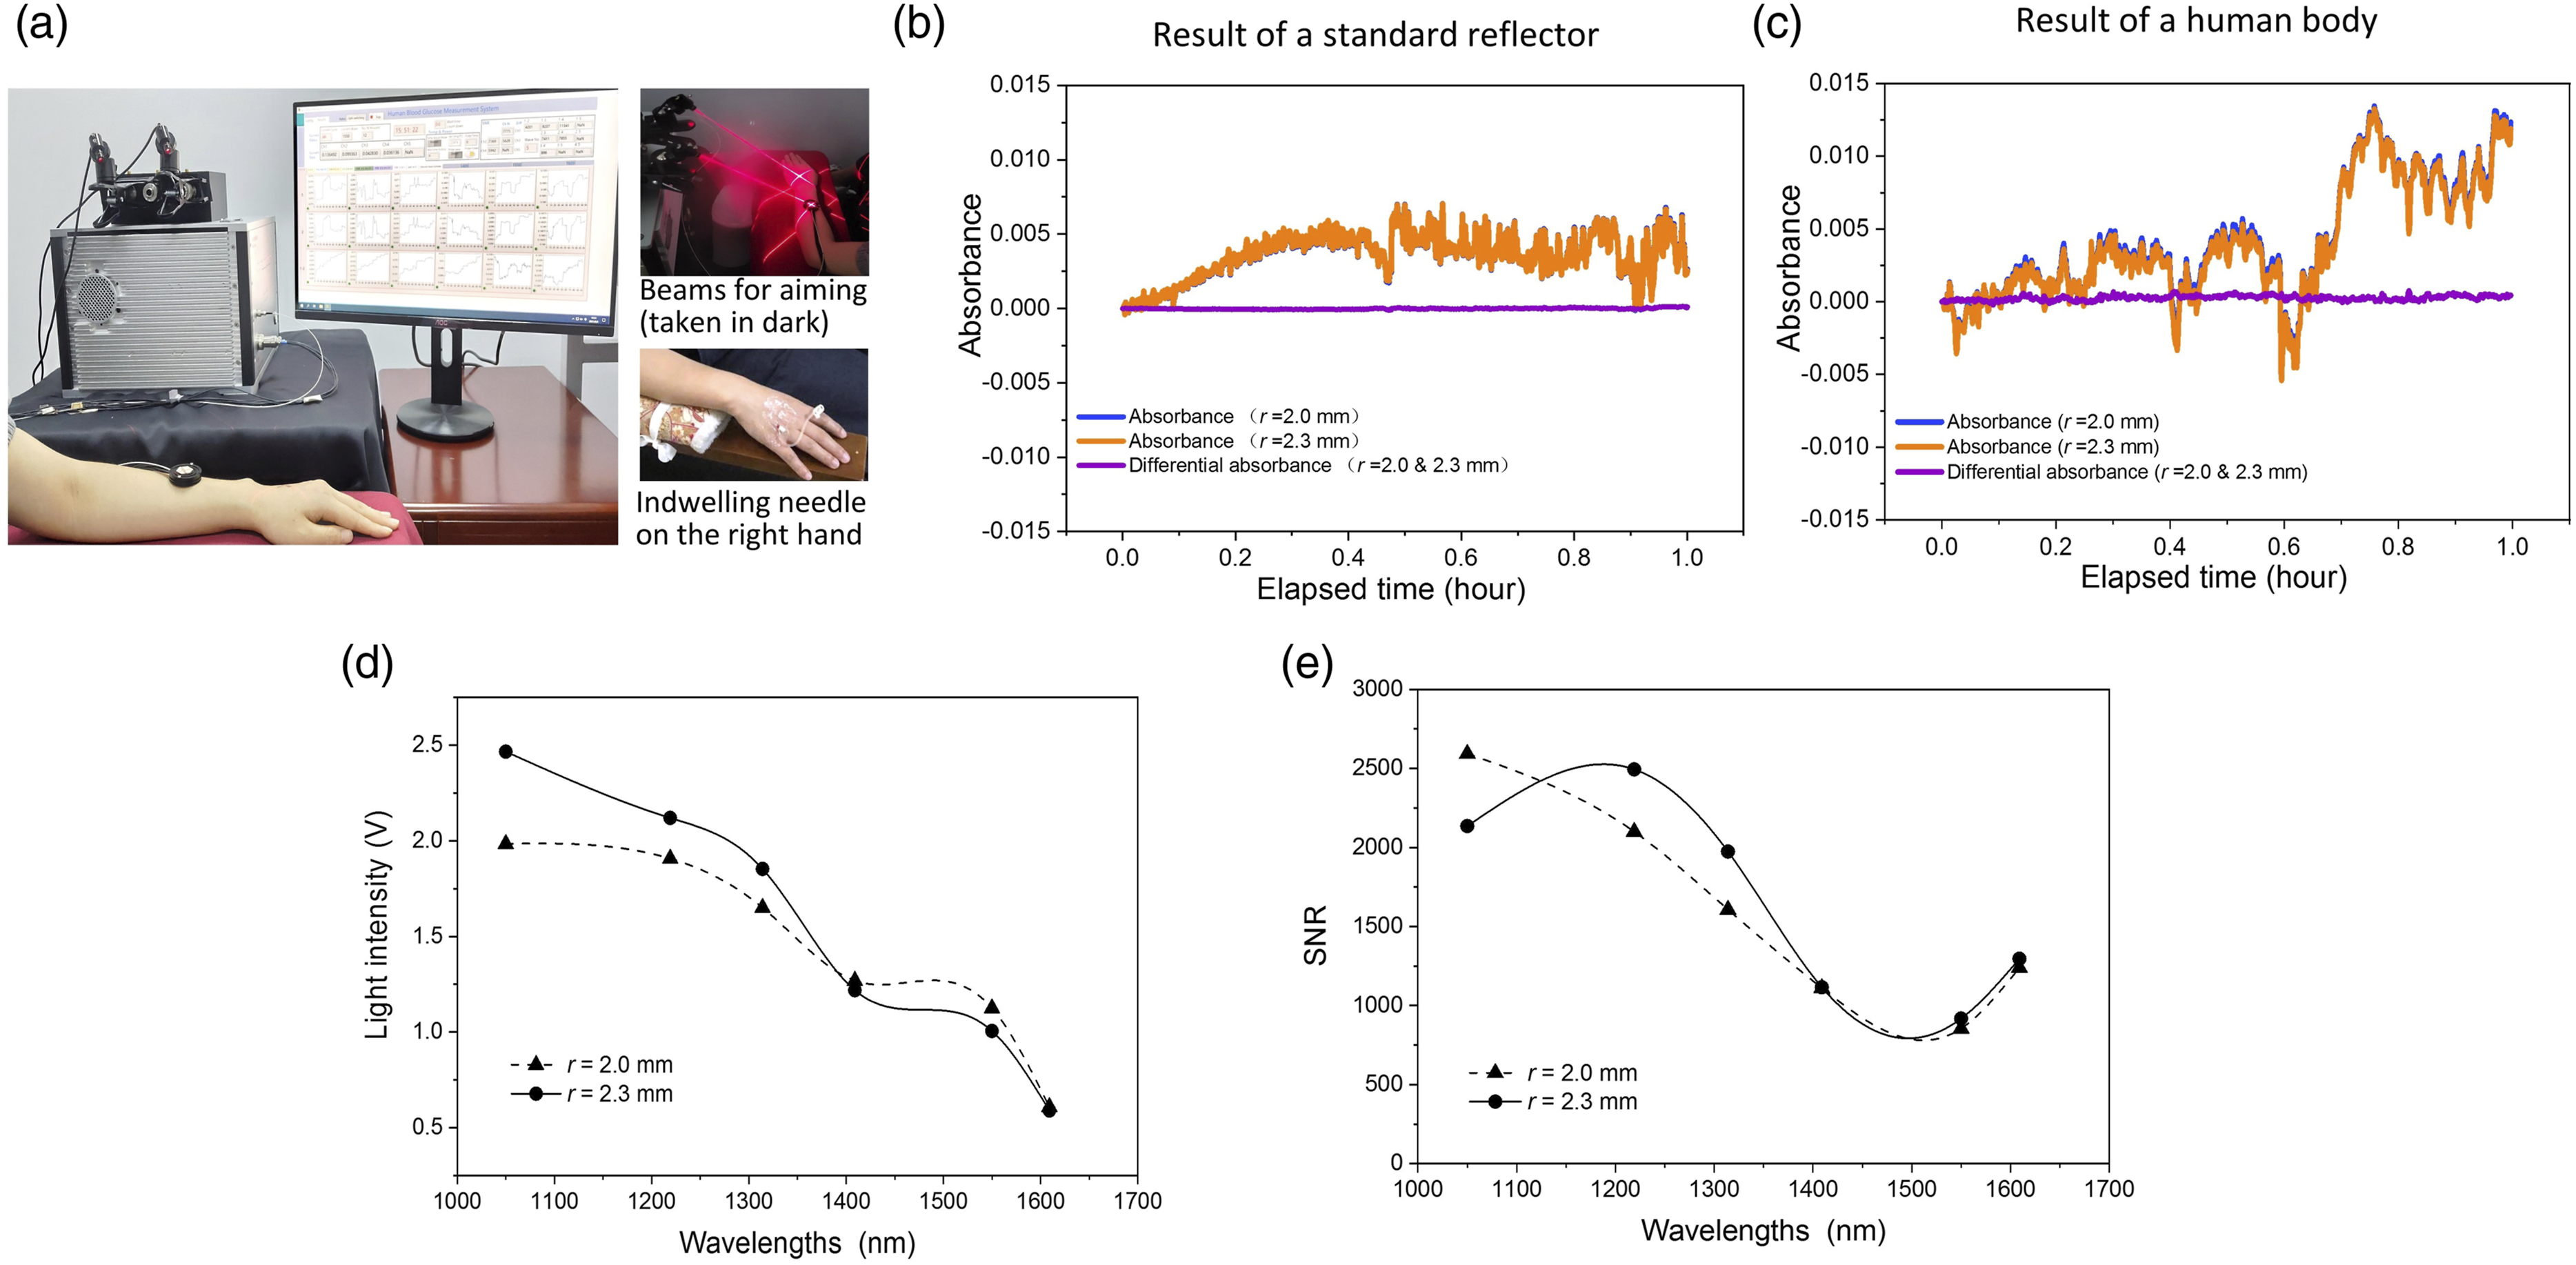
Glucose Tolerance Test Results
Figure 6 shows the human experiment results of single GTT. Figures 6a–6f show two typical results. The results of 17 single GTTs exhibited a satisfactory correlation between the differential absorbance and glucose level at a wavelength of 1550 nm. A mean correlation coefficient of 0.84 (maximum 0.95) was achieved. The correlation coefficient was greater than 0.9 for five cases, in the range of 0.8–0.9 for seven cases, and in the range of 0.7–0.8 for five cases (Figure 6g). Table II shows the measurement sensitivities of tested subjects. The detection sensitivity (Figure 6h), that is, the rate of change in differential absorbance caused by a 1 mmol·L−1 change in glucose, reached 0.0013 a.u.·(mmol·L−1)−1 on average for detection at 1550 nm, with a standard deviation of 0.0007 a.u.·(mmol·L−1)−1. This was due to the difference in the detection sensitivity among the 17 cases of single GTT, which was caused by the diversity in pathlength of different individuals or probing positions. Compared to the system noise level of ∼0.0007 a.u., a system resolution of 0.54 mmol·L−1 can be estimated. The root mean square error (RMSE) of the single GTT for the 17 cases was 0.83 mmol·L−1. It can be seen that the blood glucose measurement RMSE of the 17 cases fall into the range of the estimated system measurement resolution. Results of human experiments with single GTT. (a–c) The results for a healthy subject. (a) Shows the differential absorbance (AD) of the six wavelengths and the glucose reference value (Cg); (b) only presents the AD at 1550 (nm) and Cg; (c) shows the fitted line of AD and Cg, with the correlation coefficient R between them and root mean square error (RMSE). (d–f) The results for a diabetic subject as (a–c). (g) The distribution of the correlation coefficient between AD of 1550 (nm) and Cg. (h) The average sensitivity of AD to glucose. (Note: The results of differential absorbance AD were reduced by their initial values at the beginning of GTT.) The details of the fitted lines of AD and Cg all 17 GTTs.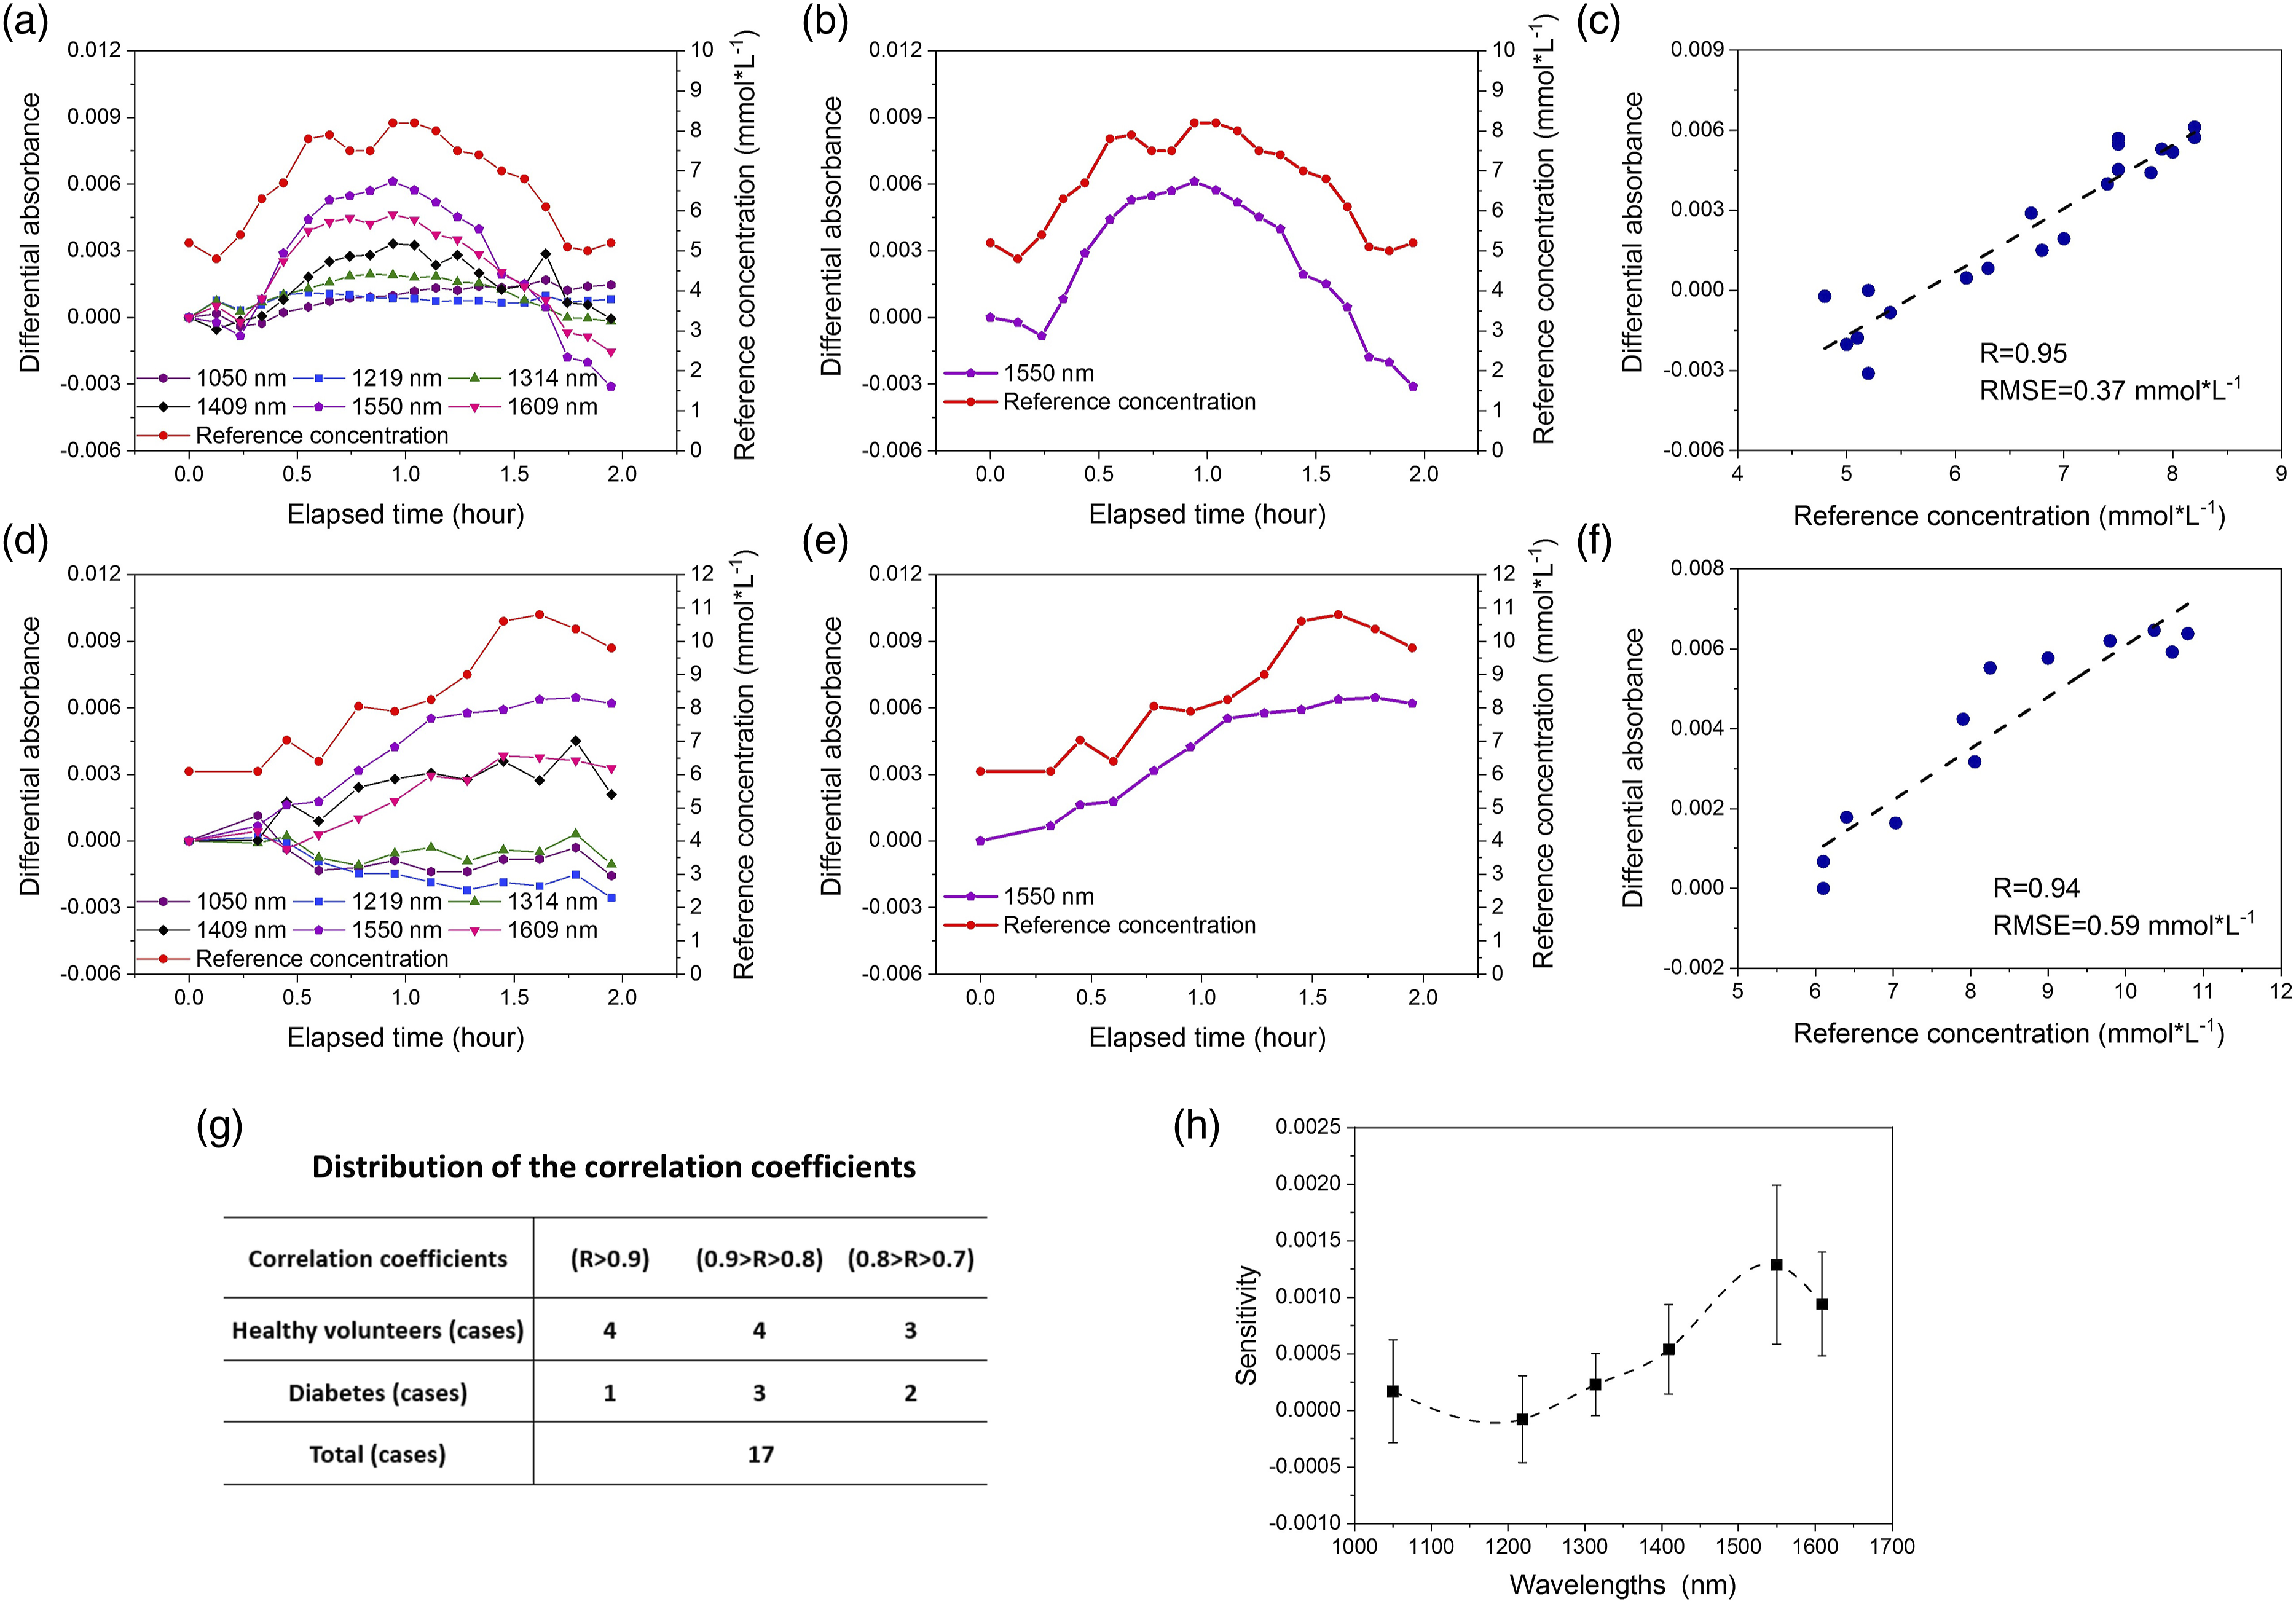
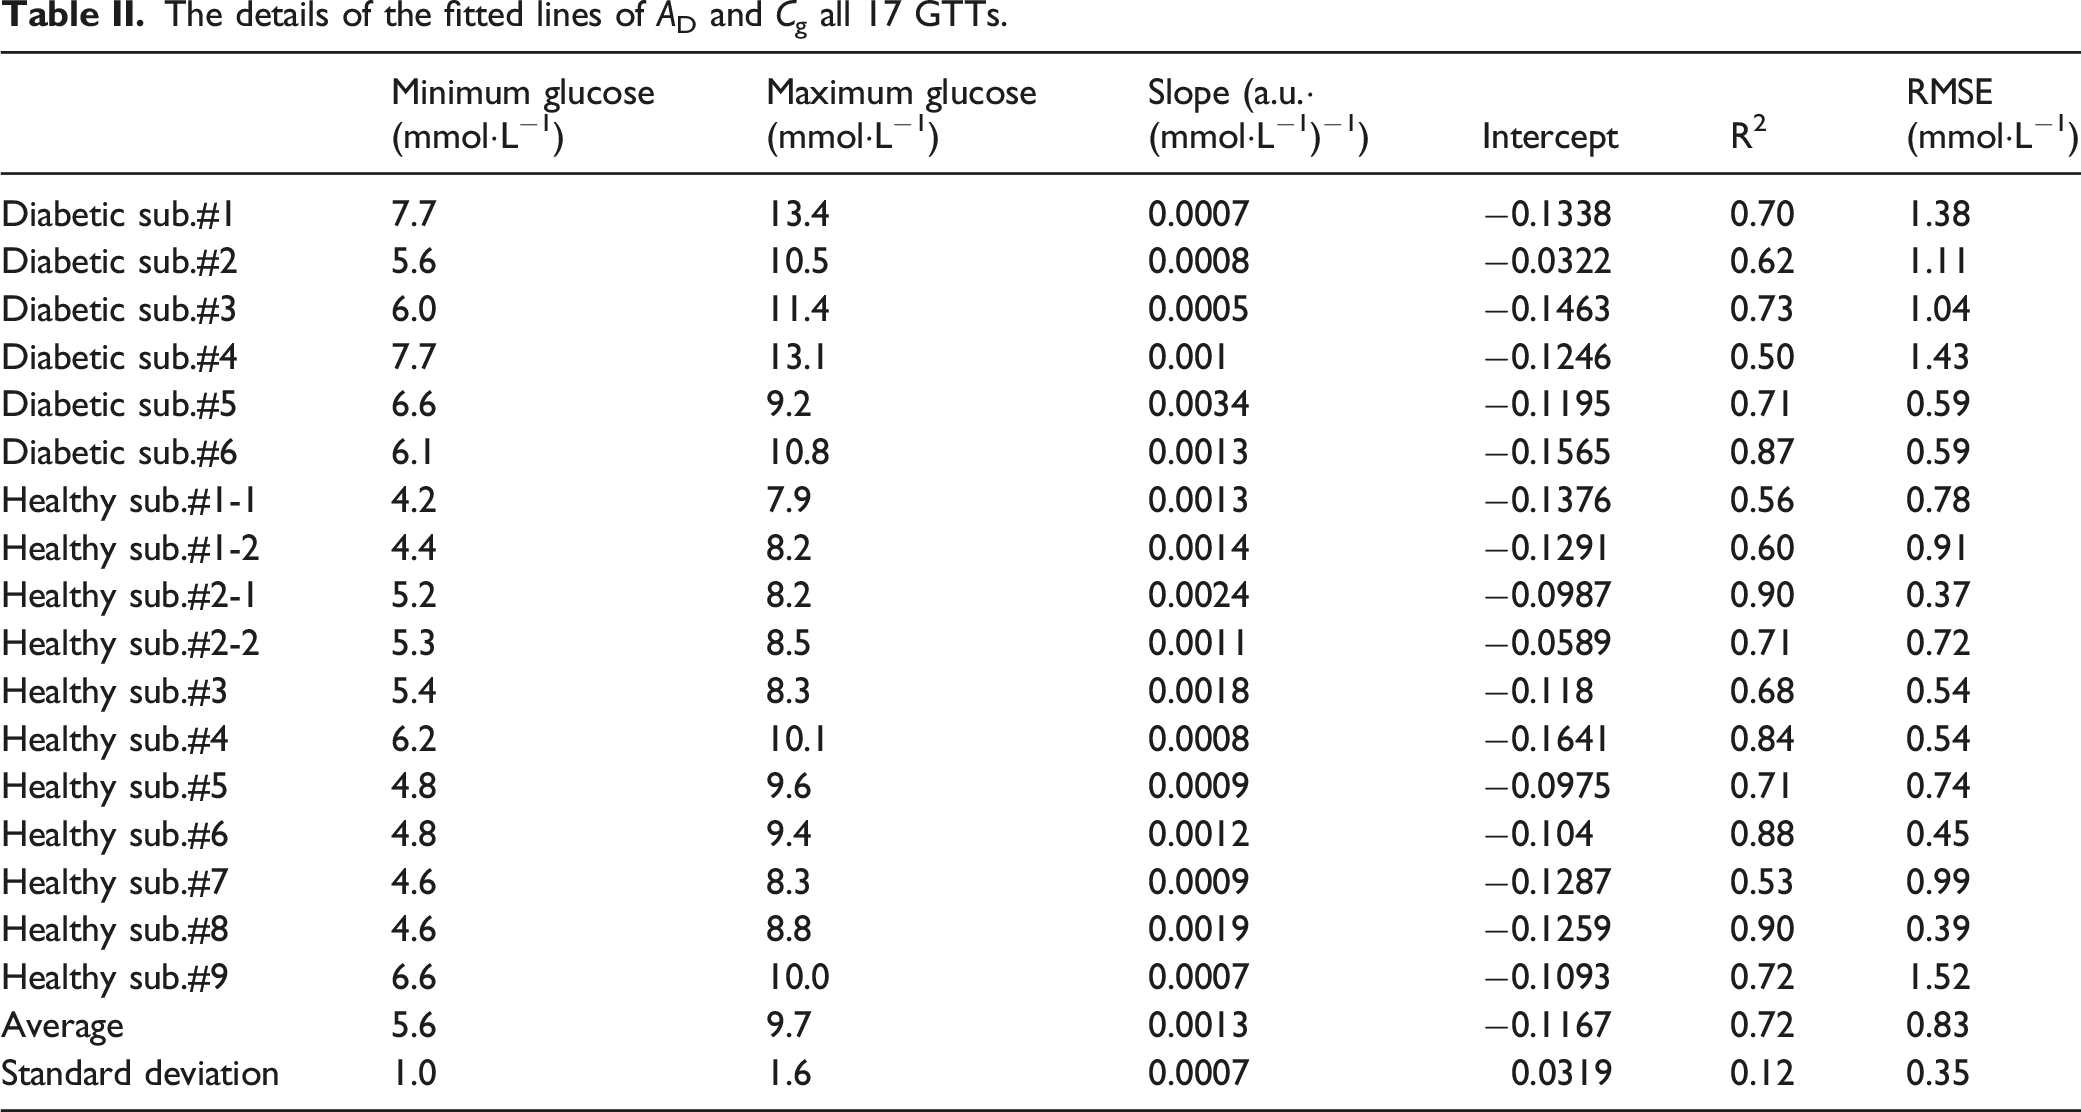
Figure 7 shows the results of two consecutive GTTs. The correlation coefficient between the differential absorbance and glucose reaches 0.94 in the 5 h continuous test. The correlation coefficients for the two consecutive GTTs are 0.94 and 0.96. The fitted line established by the first test can be used to predict the glucose concentration in the second test with an RMSE of 0.68 mmol·L−1 and a correlation coefficient of 0.96. Results of the experiment with two consecutive GTTs on a healthy subject. (a) The AD of six wavelengths and Cg. (b) The AD at 1550 (nm) and Cg. (c) The predicted glucose results of the second GTT using the (AD–Cg) calibration model established in the first GTT, with the correlation coefficient R between them and root mean square error (RMSE). (Note: The results of differential absorbance AD were reduced by their initial values at the beginning of GTT.)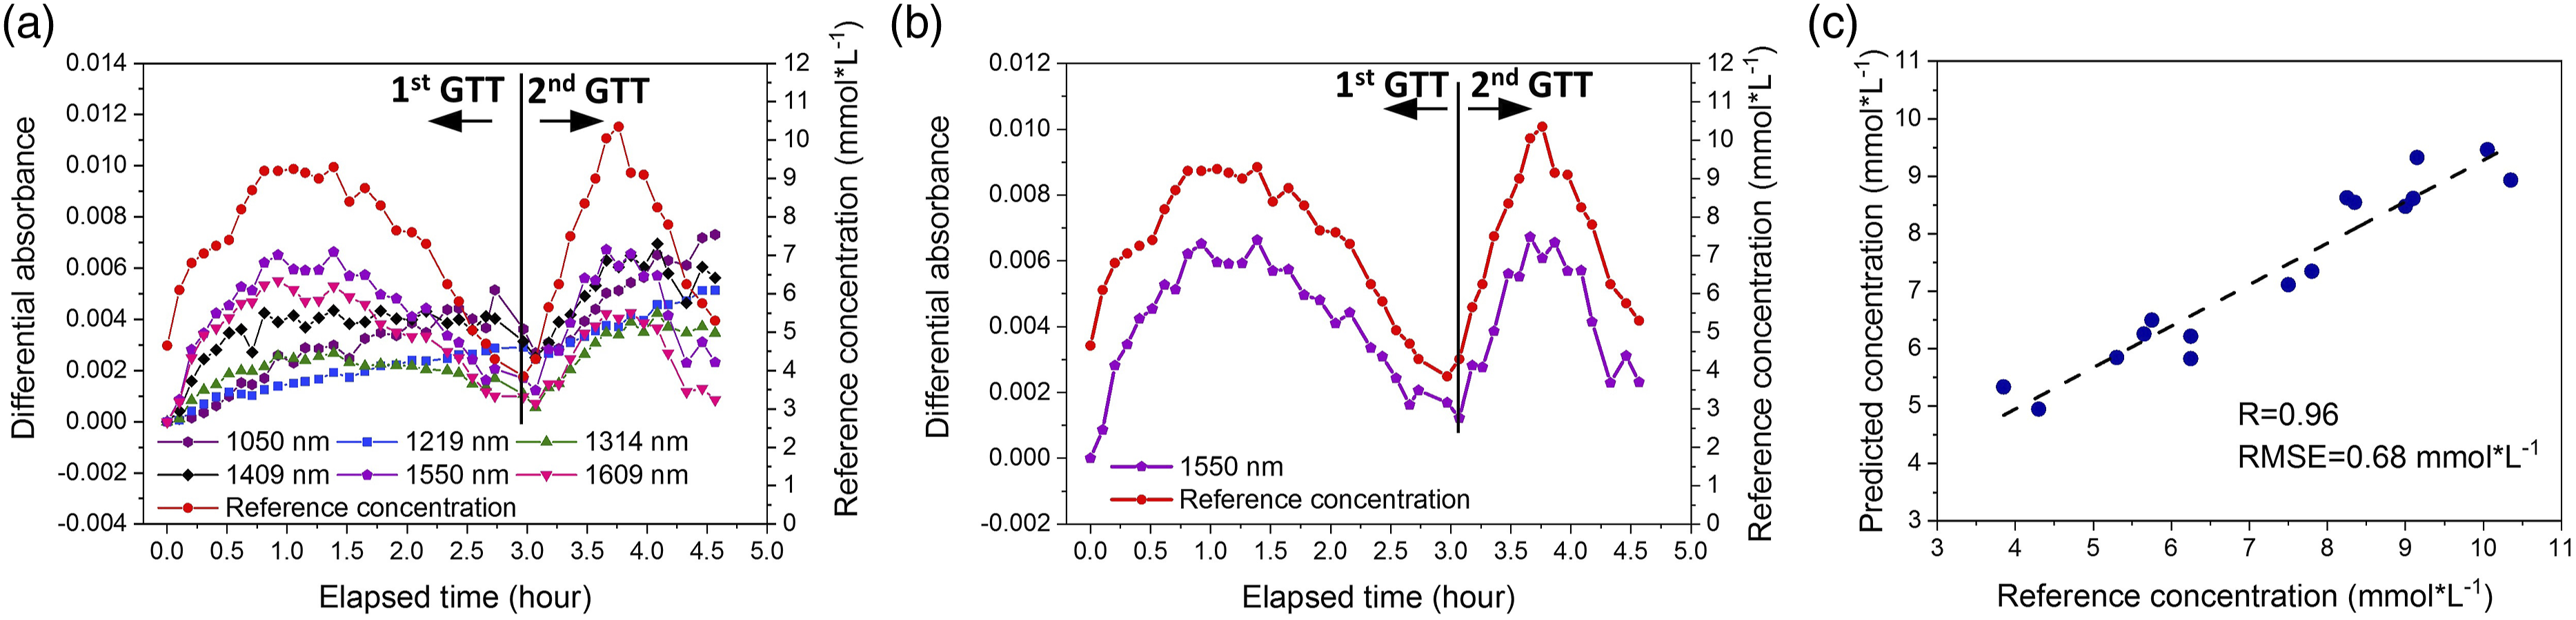
This paper discusses the strategy of in vivo measurement. The human experiments demonstrated its feasibility on suppressing the influence of probing disturbances and human variations. As a result of performing this strategy, the subjects’ skin spectra were relatively stable during the tests, with the signal caused by glucose being detected directly at 1550 nm. The results of the 17 cases of single GTT show a high correlation (
The differences in the correlation coefficients in different experiments reflect the influences of how well the measurement conditions were controlled. A better correlation coefficient was obtained in the experiment on subjects who could maintain a consistent arm posture-aiming during each test, with the experiment consisting of two consecutive GTTs being a good example that the volunteer who maintained a steady position for 5–6 h using the posture-aiming method obtained a great result with a correlation coefficient of as high as 0.94 in particular. Also, the result of the two consecutive GTTs on a volunteer preliminarily demonstrated the possibility that a simple linear model built solely based on the signal at 1550 nm can directly predict the glucose concentration for one person under the same measurement condition.
The detection sensitivity is 0.0013 ± 0.0007 a.u.·(mmol·L−1)−1 for the 17 cases. The difference in sensitivity may be due to the skin diversity, such as water content, epidermis thickness, and dermis thickness. Therefore, it should be a simple and reliable way by establishing their own model for each user. Also, the detection sensitivity is closely dependent on the measurement conditions. Therefore, for a given user, the calibration parameters still cannot be interchangeable in cases of tests taking place with different measurement conditions, for example, when the user’s probe is taken off and worn again. The experiment with two consecutive GTTs belongs to a same measurement condition with a same skin, so their prediction models can be used for each other. But for other GTTs from a same subject, the detection sensitivity appears greatly different (Table II). We are going to work on the procedures of calibration.
It can be seen in Figures 4c and 6h that the in vivo measurement results are similar to those of Monte Carlo (MC) simulation, that is, both exhibit a higher sensitivity at longer wavelengths than the shorter. Numerically, the human results are slightly larger than the results of MC simulation, that is, the average sensitivity of differential absorbance at 1550 nm reaches to 0.0013 a.u.·(mmol·L−1)−1 for the 17 cases of human test, while only 0.00054 a.u.·(mmol·L−1)−1 for the MC simulation. The reason for the difference might be the optical property difference between those used in MC simulation and their real values. The optical property changes caused by blood glucose in MC simulation are also different from the in vivo situations due to the complexity of real skin structure and water content. 38 The quantitative analysis of the optical property changes caused by the glucose in vivo needs to be further studied. For example, more sophisticated skin models and various effects of glucose on different skin layers should be considered. The human measurement results in this paper provide a reference for such kind of research.
In our measurement strategy, the developed detection probe plays a key role for the two solutions. In Solution 1, the MRID assembled in the probe greatly improves the light receiving efficiency. It receives omnidirectional light and naturally averages random body variations as the vector signal with low SNR is converted into a scalar signal with high SNR. Meanwhile, the differential processing on the two ring detectors further reduces the influence from human variations and thus obtains a satisfactory SNR level for human body. In Solution 2, this probe is small, compact, light, and easily worn to ensure a stable skin–probe contact condition can be realized by the fixing and the aiming methods. The two solutions work together to ensure an ideal implementation effect of the strategy. The solutions are expected to promote the clinical application for the glucose measurement based on NIR spectroscopy and provide a reference to more optical measurements in vivo.
It is important to emphasize that this proposed strategy shows promising application potential. First, the experiments on glucose measurement using a single wavelength demonstrate a possibility of single-wavelength device development for special uses. For example, a single-wavelength setup can be applied in the oral glucose tolerance test) that is often used in the glucose metabolism assessment on patients or in some studies. Second, the signal detection using single wavelength can also be a powerful tool to investigate the nature of other variables in vivo other than glucose so that a more reasonable calibration can be performed to improve the accuracy of blood glucose measurement. Third, the multi-wavelength approach may be necessary in the case of long-term blood glucose measurement, and the strategy proposed in this paper will provide help to obtain the reliable signals for each wavelength. Then, the multivariate analysis can be well applied to accurately predict glucose concentration without additional processing on suppressing the impacts of probing disturbances or human variations to make the prediction model simple, robust, and accurate. Actually, for practical long-term glucose monitoring there are two problems to be resolved at least. The first problem is an engineering problem, which is how to reproduce consistent measurement conditions for wearing the probe on the body repeatedly. The second problem is about the multivariable modeling with the possible variables in skin considered, such as water and hemoglobin. This can be solved by the well-developed multivariable analysis methods. There seem to be no insurmountable obstacles to solve the above two problems.
This paper focuses on proposing and validating a strategy for detecting weak glucose-caused signals in vivo. In the next step of developing practical methods or products for NBGM, we still need to consider the influence of more factors on actual measurement, such as fluctuations of individual or testing site differences, changes of other body compositions, and ease of use. In the case of glucose measurement complicated by tissue component variations because most tissue components linearly change tissue absorbance, for example, as glucose, it is straightforward to extend the single-wavelength strategy proposed here to the multi-wavelength approach to predict glucose levels by multivariate calibration. A multi-wavelength setup adds additional capability to resolve the influence of other components in skin.
Conclusion
For decades, the in vivo measurement issue has perplexed researchers. Using the strategies and solutions proposed in this paper, the glucose-caused signal has been detected at 1550 nm. The sensitivity level obtained in the human body verification can be used as a designated reference in future development. The proposed solutions are verified as simple and feasible. This strategy is expected to improve the accuracy of noninvasive glucose measurement, both in the short-term and long-term measurement. The success, if there is any, should be attributed to the proposed ring detector and the aiming procedure. The developed detection probe equipped with MRID is small, compact, light, and wearable, which is suitable for daily use in the meantime with a high SNR level of light-receiving ability. The aiming method is performed only in the measurement period, so it is an easy way for users to accept. The live human body results are not perfect, and the detection system used for the experiments is far from a clinical instrument. However, there are no barriers to further improvement with the guidance of this strategy. The success of the effective strategy applied in blood glucose detection suggests the possibility that the same success can also be extended to other in vivo measurement areas.
Footnotes
Declaration of Conflicting Interests
The author(s) declared no potential conflicts of interest with respect to the research, authorship, and/or publication of this article.
Finding
The author(s) disclosed receipt of the following financial support for the research, authorship, and/or publication of this article: The research leading to these results was funded by the National Natural Science Foundation of China (81971657, 81871396, and 81471698).