
Abstract
Carcinoembryonic antigen (CEA) is a cancer-related tumor marker, which is commonly used for preventive screening, auxiliary diagnosis, and recurrence monitoring. Therefore, it is of great significance to develop a new CEA detection method. In this paper, we developed an SERS aptasensor for CEA based on silver nanorod array chip, thiol aptamer, and 4-mercaptophenylboronic acid (4-MPBA). The silver nanorod array chip modified by CEA thiol aptamer (aptamer-SH) was used as SERS capture substrates. Ag@4-MPBA was used as a surface-enhanced Raman spectroscopy (SERS) tag. This proposed SERS aptasensor could detect CEA down to 0.447 pg·mL−1 with a wide linear range from 1 pg·mL−1 to 100 ng·mL−1 (R2 = 0.9907). The recovery of the standard addition test for CEA in serum was between 97.25% and 102.67%, and the RSD ≤ 2.52% (n = 3). The sensor has the advantages of good specificity, high sensitivity, and a wide linear range. It provides a new method for the detection of CEA in serum.
Keywords
Introduction
Carcinoembryonic antigen (CEA) is a type of glycoprotein, which usually exists in the gastrointestinal tissue of infants and the mucosal cells of adults. When cells become cancerous, CEA is abundantly expressed, such as in lung, breast, rectal, colon, and pancreatic cancers.1–5 Therefore, CEA is often used as a broad-spectrum tumor marker for preventive screening, auxiliary diagnosis, and recurrence monitoring. 5 The serum CEA of healthy adults should be less than 2.5 ng·mL−1, and less than 5.0 ng·mL−1 in adult smokers. There is a risk of cancer if CEA in serum exceeds 5.0 ng/·mL−1. 6 Therefore, it is of clinical significance to develop a sensitive detection method for CEA. At present, the main detection methods for CEA include enzyme-linked immunosorbent assay (ELISA), 7 electrochemical immunoassay,8,9 electrochemiluminescence immunoassay, 10 chemiluminescence immunoassay, 11 fluorescence immunoassay,12,13 and so on. Although these methods have high specificity and sensitivity due to antigen–antibody specific recognition and binding, the cost of antibodies prepared by animal or cell immunization is high, and the environment has a greater impact on the stability of antibodies.14–16
Aptamers are short oligonucleotides isolated in vitro from randomized libraries, including RNA and ssDNA. 17 Compared with antibodies, aptamers have the advantages of temperature and pH stability, low price, and easy synthesis and modification,18,19 Aptamers can specifically recognize and bind targets through intermolecular interactions, 20 forming stable secondary or tertiary structures. Therefore, aptamers are gradually replacing antibodies as biological recognition elements for constructing CEA biosensors,16,21–25 which mainly include electrochemical aptasensor and fluorescence aptasensor.
Surface-enhanced Raman spectroscopy (SERS) has been widely used in many fields26–31 due to its narrow band, high resolution, non-destructiveness, and high sensitivity. Recently, significant attention has been given to the detection of CEA using a SERS biosensor32–36 based on antibodies as biological recognition elements. However, there are fewer reports on SERS aptasensor for CEA.37,38 Song et al. 37 developed a stable and reproducible SERS-based readout method to detect CEA. Au butterfly wings with a natural three-dimensional (3D) hierarchical sub-micrometer structure modified with a CEA antibody were used. The enzyme-linked secondary antibody typically applied in conventional ELISA was replaced by rhodamine G tagger CEA aptamer. Although the sensor has good selectivity and sensitivity, CEA antibody as its capture substrate is used, and binding of the antibody to the capture substrate via amide bonds is time-consuming. Lu 38 reported a multimer-based SERS aptasensor for a specific CEA detection. Silver-coated gold nanoparticles (Au@AgNPs) were modified with two different thiol ssDNA strands, and the CEA aptamer hybridized with two different thiol ssDNA strands to form a self-assembled multimeric structure that had abundant hot-spots to provide a high SERS response with detection sensitivity down to the pg·mL−1 level. However, the fabrication of this sensor is complicated, involving DNA modification of Au@AgNPs, hybridization between DNA and aptamer, and formation of self-assembled multimeric structure.
The preparation of SERS substrates with high activity and uniformity is the key to SERS detection technology. Due to the ordered structure and reproducible shape of the array, the silver nanorod arrays have better signal uniformity and reproducibility, and the nanorod interstices can generate high-density SERS “hot-spots”, which is beneficial to improve the sensitivity. 39
Boronic acid groups can form cyclic boronate ester with the cis-diols in glycoproteins, so it is used to isolate glycoproteins;40–42 4-MPBA contains phenylboronic acid groups and sulfhydryl groups and has a Raman signal. The signal is significantly enhanced after being modified with AgNPs, 43 so it is often designed as SERS tags for the detection of glycoproteins.44–46
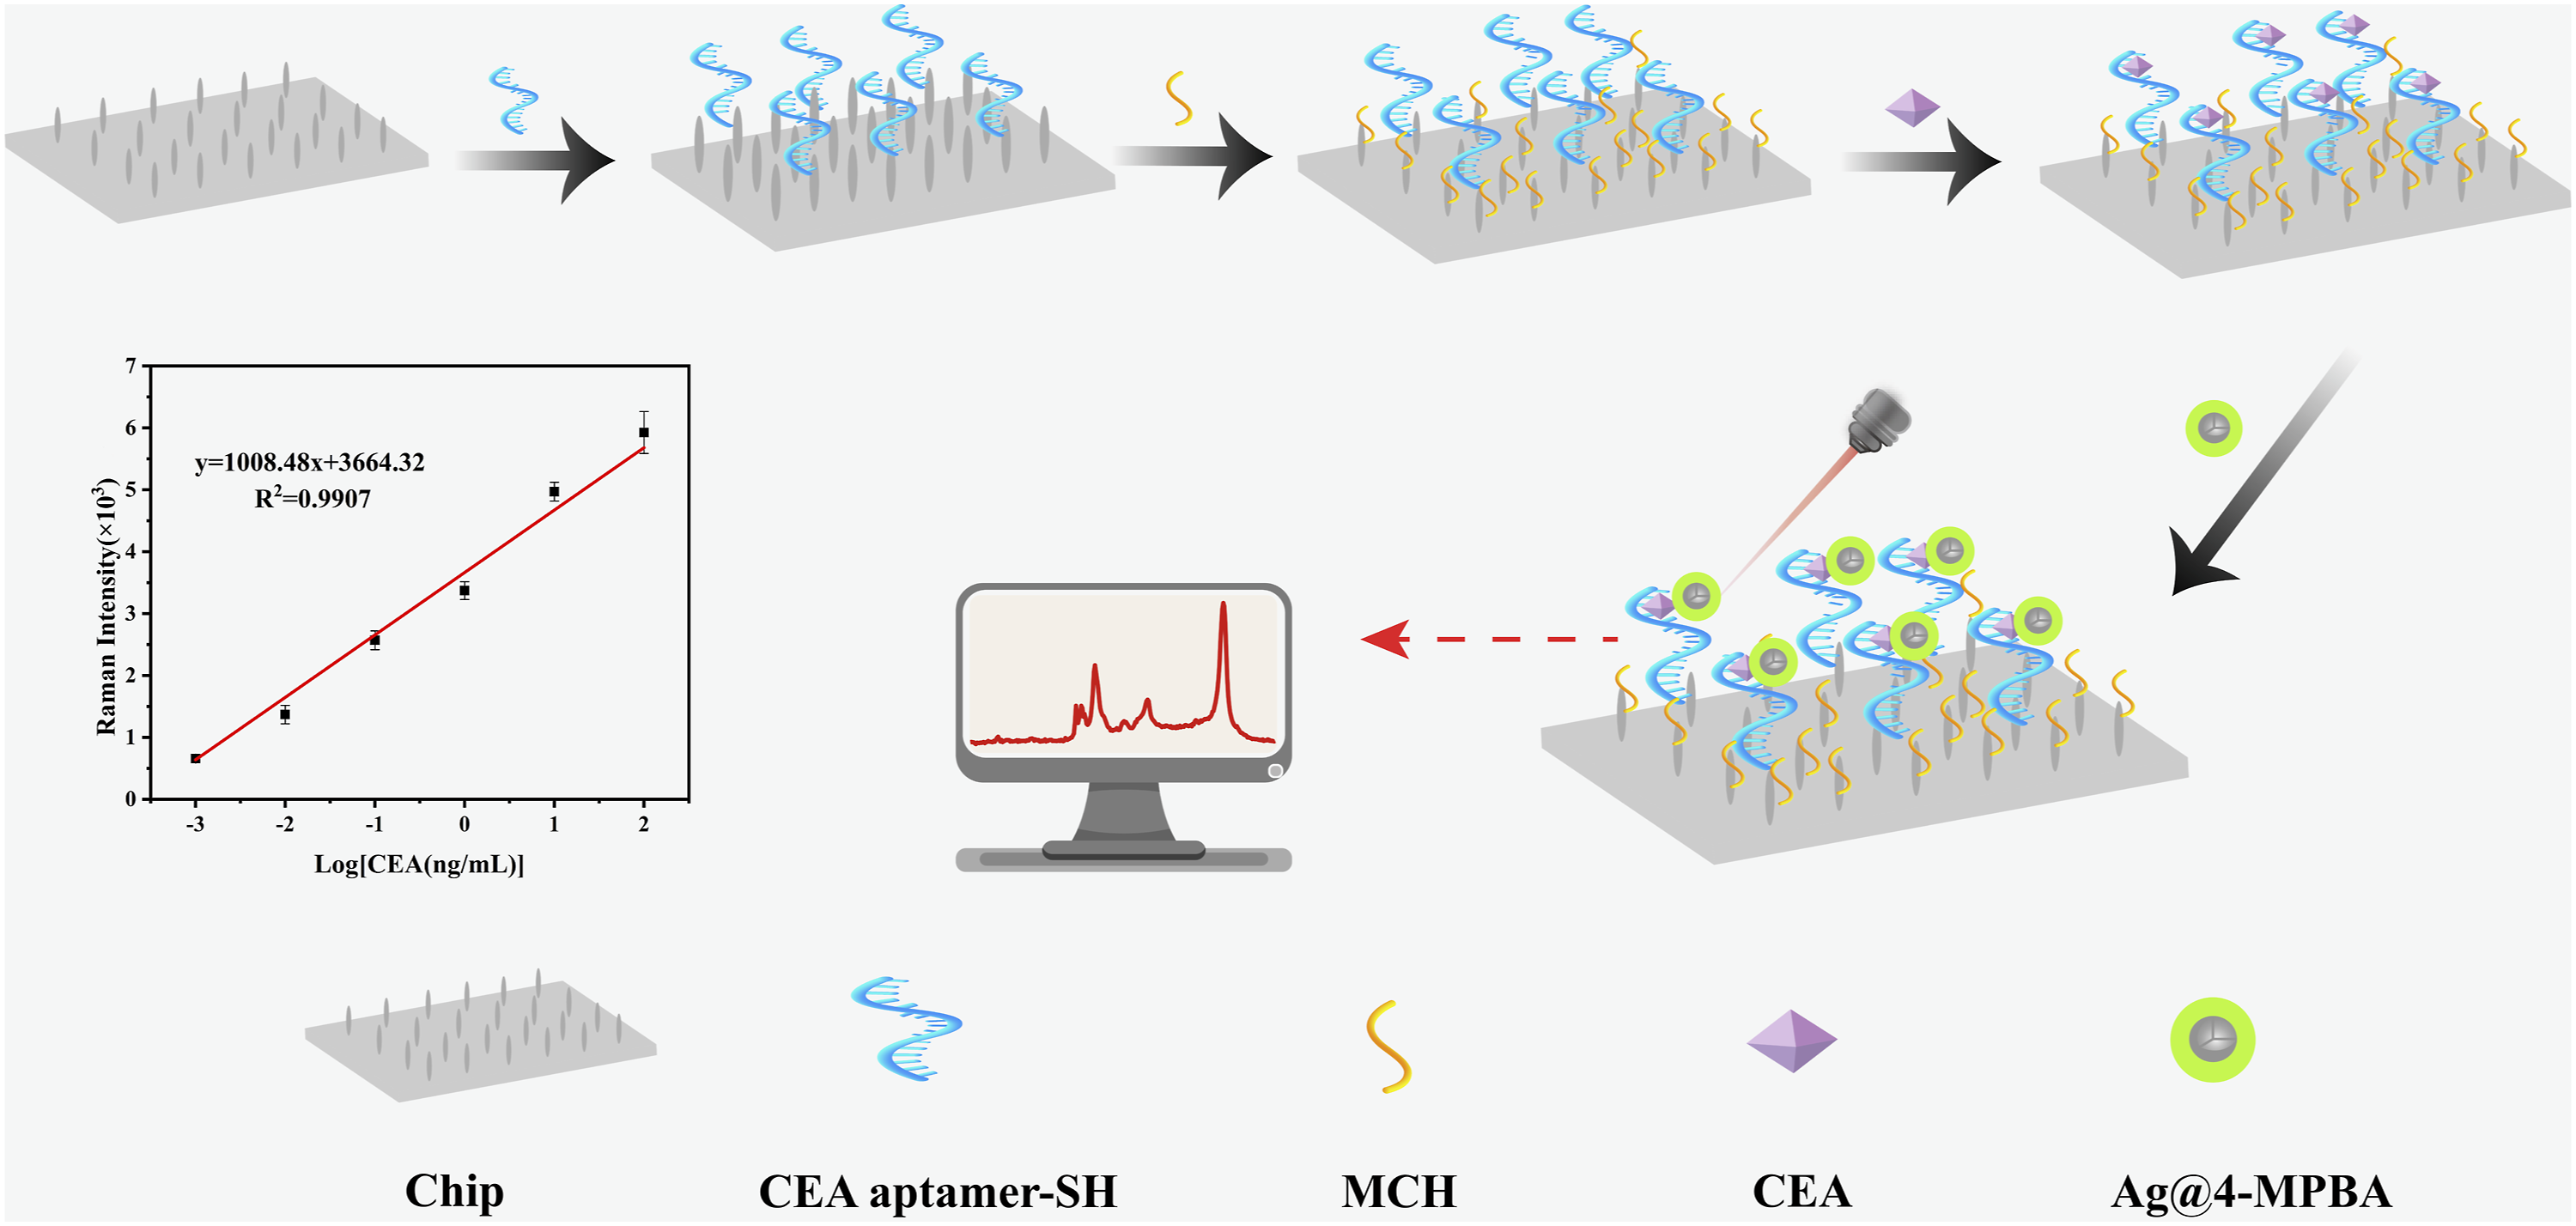
In this paper, we designed a CEA SERS aptamer sensor based on silver nanorod array chips, thiol aptamers, and 4-MPBA. The silver nanorod array modified with CEA thiol aptamer was used as the SERS capture substrate (Chip@Apt), and Ag@4-MPBA was used as the SERS tag. When a sample containing CEA is dropped onto the SERS capture substrate, Chip@Apt recognizes and captures CEA, forming the Chip@Apt@CEA complex. Other unbound components in the samples were removed by washing with PBS. Subsequently, the SERS tag (Ag@4-MPBA) was added dropwise and combined with the captured CEA on the substrate to form the Chip@Apt@CEA@Ag@4-MPBA complex. In the complex, the Raman signal of 4-MPBA was synergistically enhanced by the silver nanorod array and silver nanoparticles. The logarithm of the CEA concentration showed a good linear relationship with the SERS intensity. Compared with the previous CEA sensor, the sensor has the advantages of good specificity, high sensitivity, and wide linear range. It provides a new method for the detection of CEA in serum.
Experimental
Materials and Methods
The aptamer was synthesized and purified by Sangon Biotech Co., Ltd., CEA antigen was obtained from Shanghai Linc-Bio Science Co., Ltd., the Ag nanorod array chip was purchased from Guangxi Sanhuan High-Tech Raman Chip Co., Ltd., the 6-mercapto-1-hexanol (MCH) was purchased from Shanghai Macklin Biochemical Co., Ltd., the ethanol was purchased from Chengdu Kelong Chemical Co., Ltd., the silver nitrate (AgNO3) was obtained from Sinopharm Chemical Reagent Co., Ltd., the sodium citrate was purchased from Xilong Scientific Co., Ltd., the 4-mercaptophenylboronic acid (4-MPBA) was from Nine-Dinn Chemistry Co., Ltd., and the phosphate-buffered saline (PBS) dilution was purchased from Guangdong Huankai Microbial Sci. and Tech. Co., Ltd. The healthy human serum used in this work was purchased from Shanghai Jingkang Bioengineering Co., Ltd. Another antigen in the experiments has been listed in Table S1 (Supplemental Material).
The Raman spectrum information of this work was measured using an XploRA Plus Raman Microscope (Horiba, Japan). The transmission electron microscope (TEM) JEM 2100 (JEOL, Japan) was used for morphological observation, the scanning electron microscopy, or SEM (S4800, Japan) was used for elemental d analysis, and an X-ray diffractometer (XRD) from Bruker D8A A25 X (Germany) was applied as the qualitative characterization of materials. UV–visible (UV–Vis) absorption spectra of Ag NPs and Ag@4-MPBA were obtained using a UV–Vis spectrometer (UV-2102PC, Precision Instrument, China).
Preparation of SERS Tag Ag@4-MPBA
Ag NPs were prepared by using trisodium citrate and AgNO3 as described previously. 47 The prepared silver colloid was respectively washed three times with deionized water and absolute ethanol at 8000 rpm for 10 min. Then, the Ag was redissolved in ethanol; 1 mL of 4-MPBA (10 mM) was added to 1 mL of silver colloid (10 mM) and sonicated for 1 h. After centrifugation at 8000 rpm for 10 min, the prepared Ag@4-MPBA were washed three times with deionized water and absolute ethanol, respectively. Finally, the Ag@4-MPBA was redissolved in 1 mL of PBS for later use.
Preparation of SERS Capture Substrates
Aptamer-SH solution (10 μL of 10 μM) was added to the surface of the chip and reacted at room temperature for 1.5 h and then washed three times with PBS to remove unbound aptamer-SH; 1 mM MCH was added to the Chip@Apt for 0.5 h at room temperature to block the unbound sites on the chip surface and help the aptamer stand up better. 48 The chip was then rinsed three times with PBS to remove unreacted MCH and stored at 4 °C for later use.
Detection Method and Steps
Figure 1 shows the detection process of CEA. First, 10 μL of the test solution was dropped onto the SERS capture substrate Chip@Aptamer-SH, incubated for 1 h, and washed three times with PBS. Next, 10 μL of SERS tag colloid was added dropwise, reacted at room temperature for 1 h, and then washed three times with PBS. Finally, after natural drying, the SERS signals of three sites were detected, respectively. The instrument parameters were a wavelength of 638 nm, 10% power, an integration time of 10 s, and an average number of one time. Schematic diagram of the detection principle of SERS aptasensor for CEA.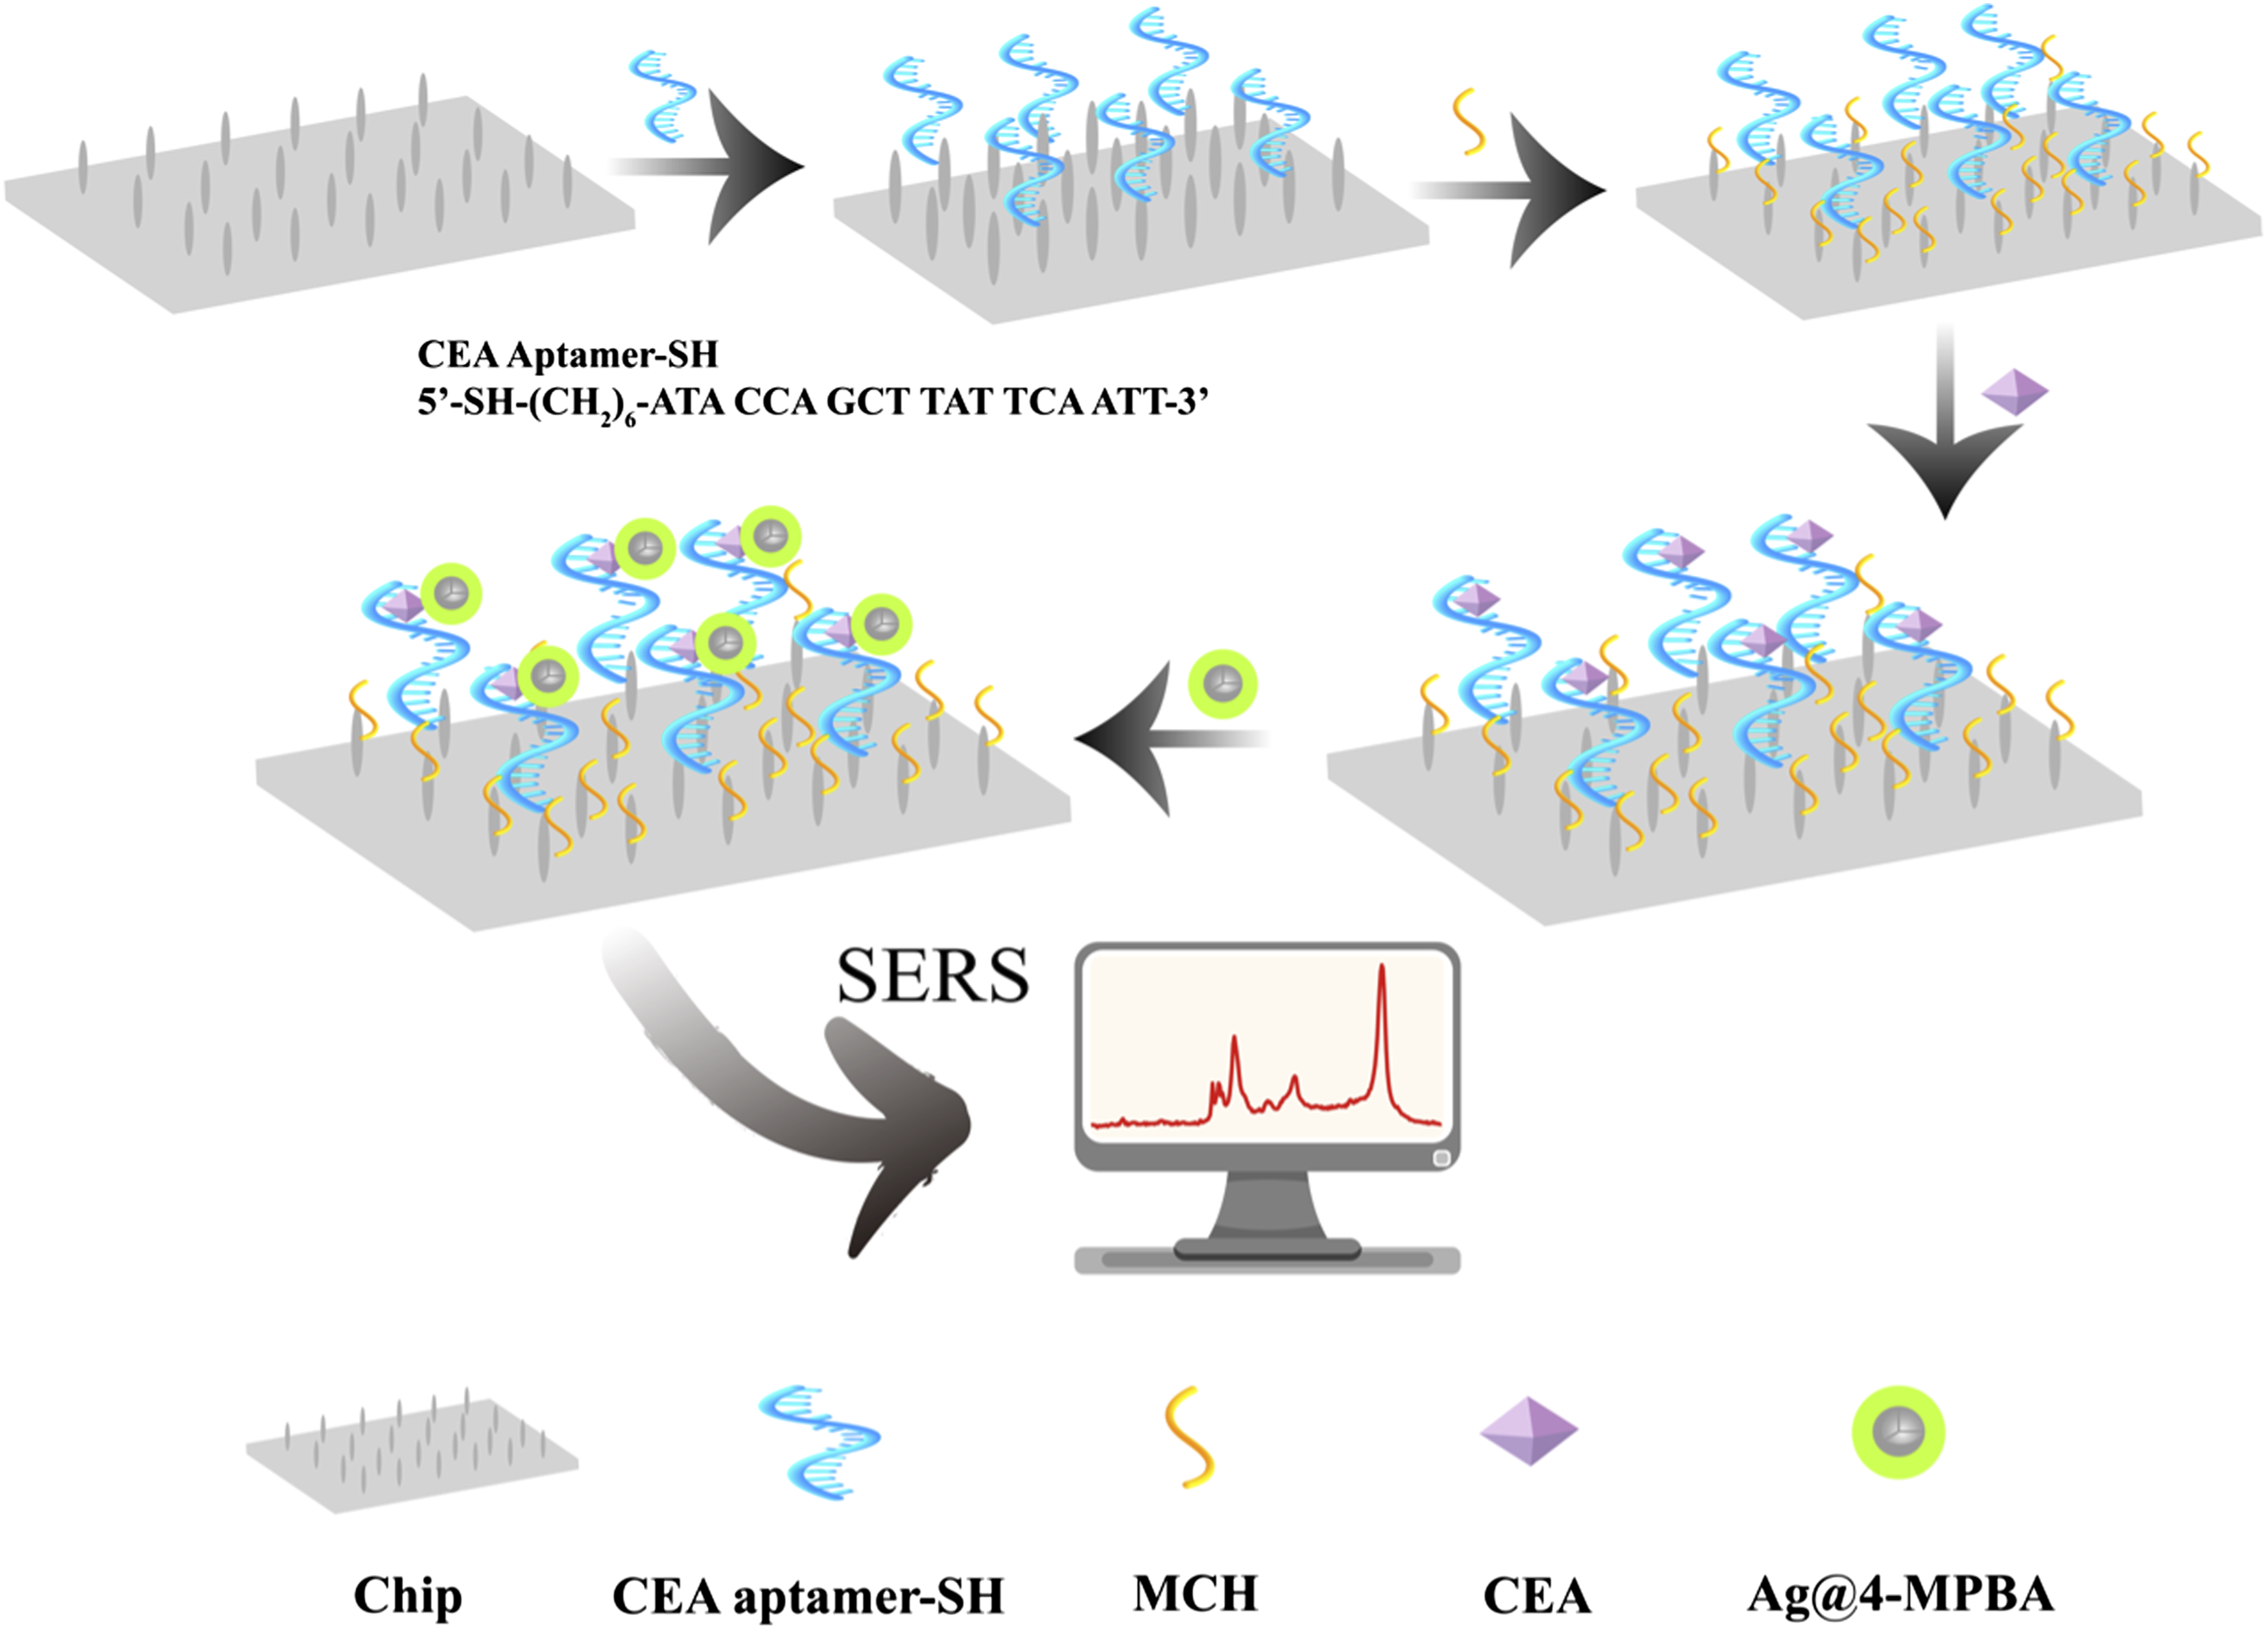
Results and Discussion
Characterization of Chips and SERS Capture Substrates
The SEM image (Fig. S1a, Supplemental Material) demonstrates the surface of the chip presents a uniformly distributed dense silver nanorod array with a rough surface and high specific surface area, which can provide a large number of attachment sites for aptamer-SH. The distribution of red Ag elements is very uniform (Fig. S1b), which is beneficial to the uniformity of the SERS signal. Since the chip was formed by the deposition of silver atomic vapor on the glass sheet, Ag and Si can be detected (Fig. S1c). After the surface of the chip was modified with the aptamer-SH, the C, N, O, and P elements were detected (Fig. S1d), which proved that aptamer-SH was successfully attached to the chip. However, the detection result of S element is microscale because SEM only detects elements with a surface depth of 10 nm, and the chip surface is covered by aptamers through Ag–S bonds, so it is difficult to detect S element.
In order to explore the optimal modification amount of aptamer-SH, the effects of different concentrations of aptamer-SH solutions (1 μM, 5 μM, 10 μM, 50 μM, and 100 μM) on the SERS intensity (reaction time 1.5 h) were examined. It can be seen from Figure S2a that the optimal concentration is 10 μM. This is because the aptamer-SH concentration is small, the amount of aptamer-SH modified to the chip surface through S–Ag bond is small, the amount of CEA that can be captured is small, and the amount of bound SERS tags is correspondingly reduced. Therefore, the SERS intensity of the sensor is weak; conversely, if the aptamer-SH concentration is too high, the amount of aptamer-SH modified to the chip surface is too much, and the steric hindrance increases, which is not conducive to the capture of CEA, resulting in the reduction of SERS intensity. We also examined the effect of reaction time on the SERS intensity. It can be seen from Figure S2b that the optimal reaction time is 1.5h. When the reaction time exceeds 1.5 h, the modified aptamer-SH is too much and the steric hindrance increases, which is not conducive to the capture of CEA.
Characterization of SERS Tag Ag@4-MPBA
The Ag NPs with a diameter of about 60 nm were seen using the TEM (Fig. S3a), and the Ag NPs were gray-black with uniform particle size and good dispersion by SEM (Fig. S3b). The element distribution of Ag@4-MPBA detected by TEM was shown in Fig. S3c, in which the green element was Ag and the red element was S. The existence of the S element indicated that the surface of Ag NPs was modified with 4-MPBA and Ag@4-MPBA was successfully prepared.
The UV absorption peak of the Ag NPs modified with 4-MPBA was redshifted from 417 nm to 422 nm (Fig. S3d). Therefore, it can be speculated that 4-MPBA was successfully modified on the surface of Ag NPs.
As shown in Fig. 2, due to the enhancement effect of Ag NPs on 4-MPBA, the Raman characteristic peak of 4-MPBA at 1085 cm−1 was significantly enhanced, which further proved that the SERS tag (Ag@4-MPBA) was successfully prepared. The SERS spectra of Ag NPs, 4-MPBA, and Ag@4-MPBA.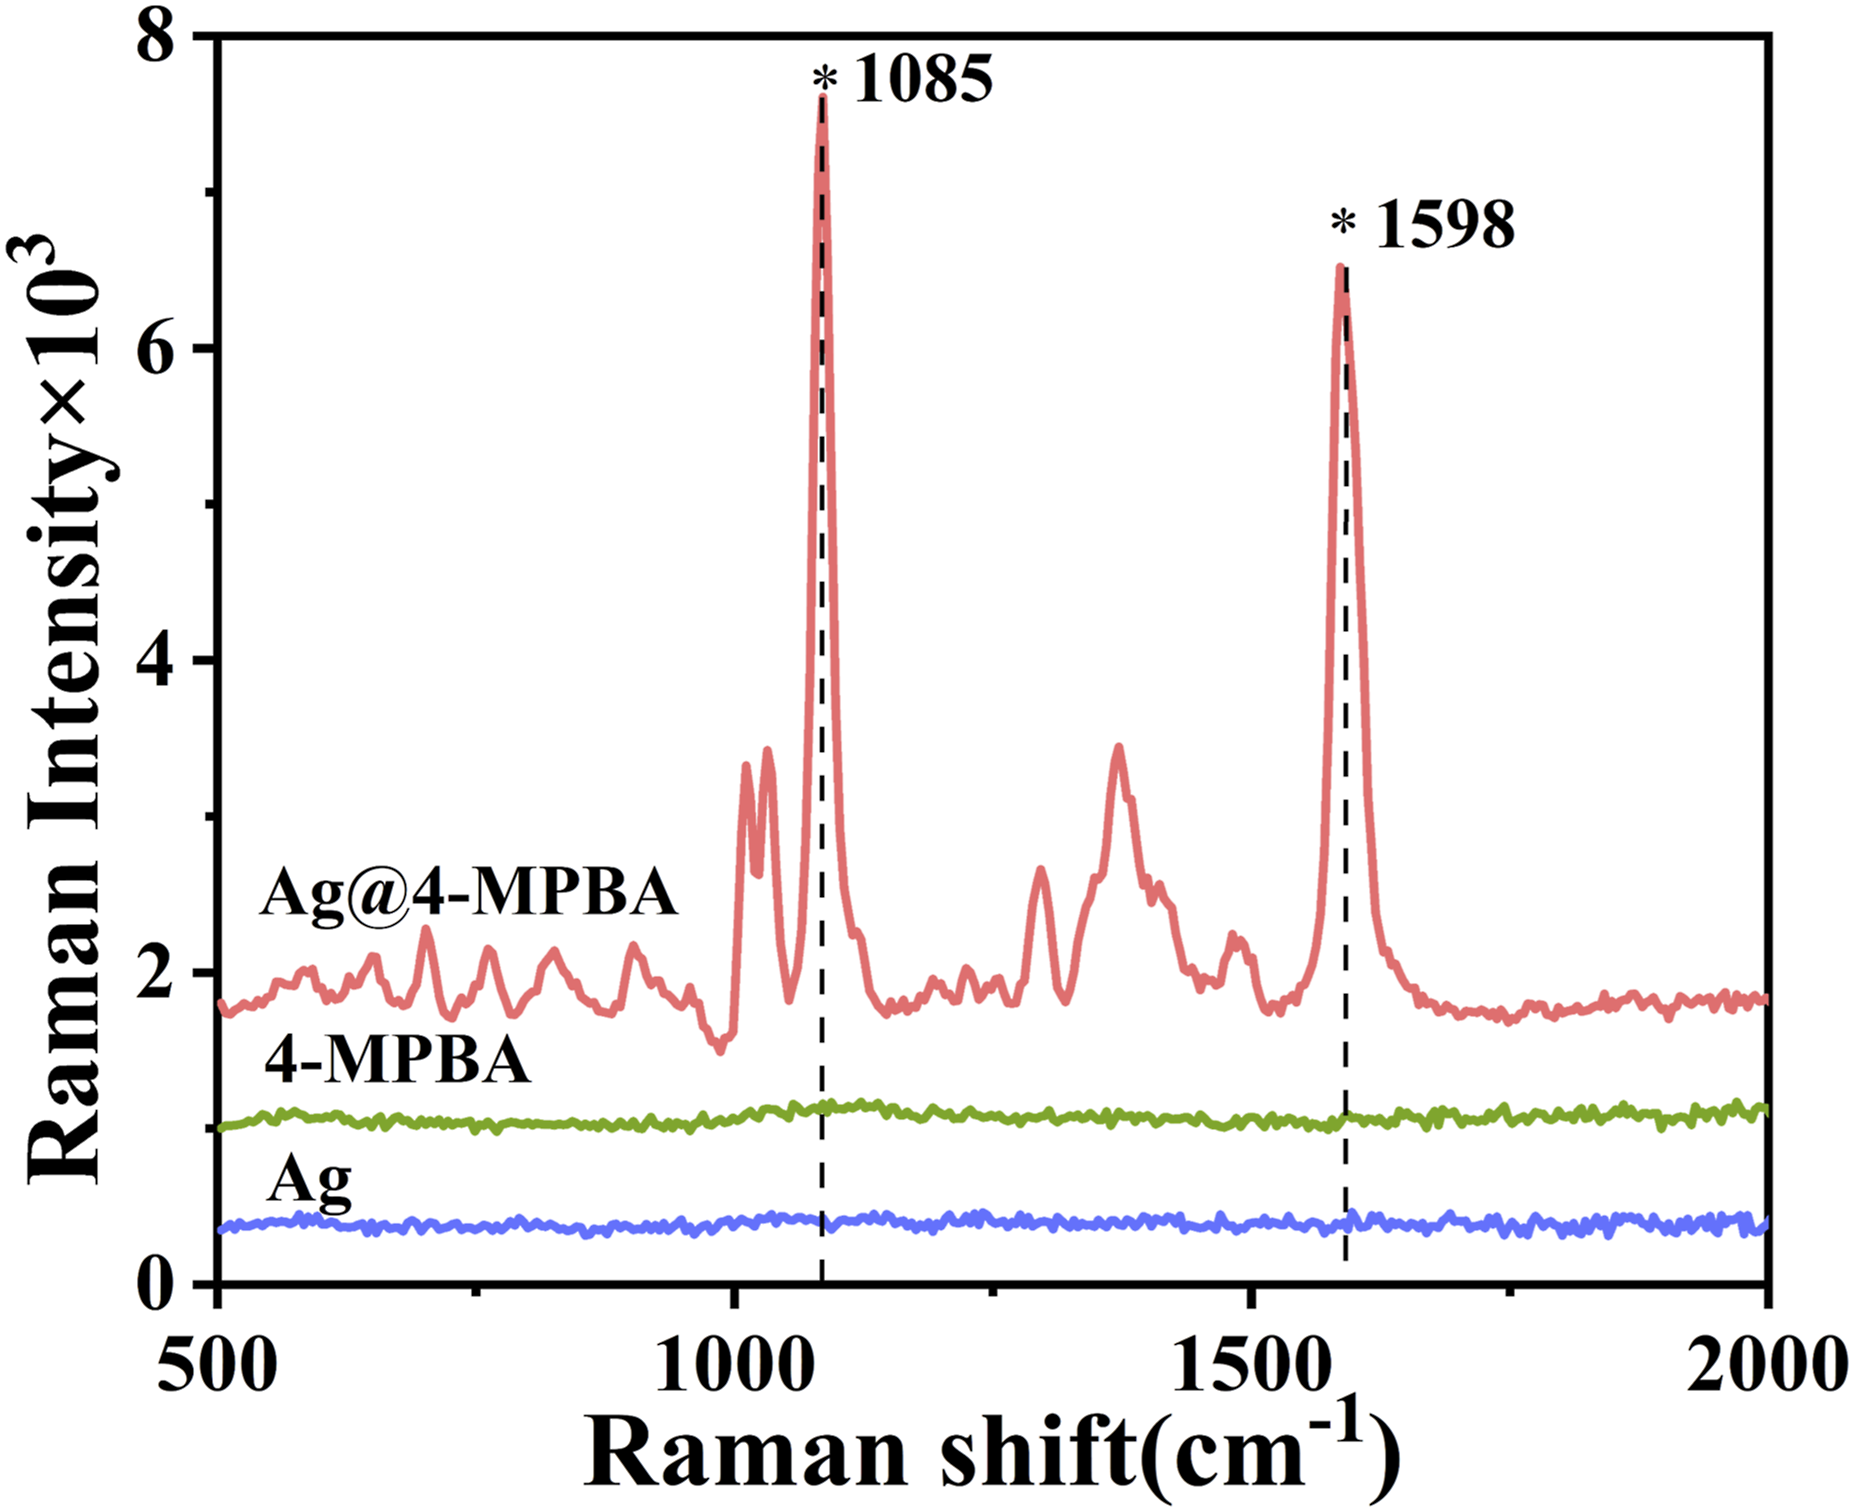
In order to explore the optimal modification amount of 4-MPBA on Ag NPs, the effect of the amount of 4-MPBA solution with a concentration of 10 mM on the SERS signal intensity was investigated (Fig. S3e). When the amount of 4-MPBA solution increased from 600 μL to 1000 μL, the SERS signal gradually increased; when the amount of 4-MPBA solution was 1000 μL, the SERS signal was the strongest; when the amount exceeded 1000 μL, the SERS signal decreased. This is because, with the increase of the amount of 4-MPBA solution, the amount of Raman signal molecule 4-MPBA modified on the surface of Ag NPs increases, so the SERS signal is enhanced; When the amount of 4-MPBA solution is too large, too many Ag–S bonds are generated, and the local electromagnetic field on the surface of Ag NPs is weakened, 49 so the SERS signal strength decreases instead.
Characterization of Chip@Apt@CEA@4-MPBA@Ag
It can be seen from the SEM of Chip@Apt@CEA@4-MPBA@Ag (Fig. 3a) that white aggregates appeared on the chip, which were inferred to be the complex formed by Aptamer, CEA, and Ag@4-MPBA. (a) The SEM of Chip@Apt@CEA@4-MPBA@Ag. (b) The SERS spectra of chip, Chip@Apt, Chip@Apt@CEA, Chip@Apt@CEA@4-MPBA, and Chip@Apt@CEA@4-MPBA@Ag.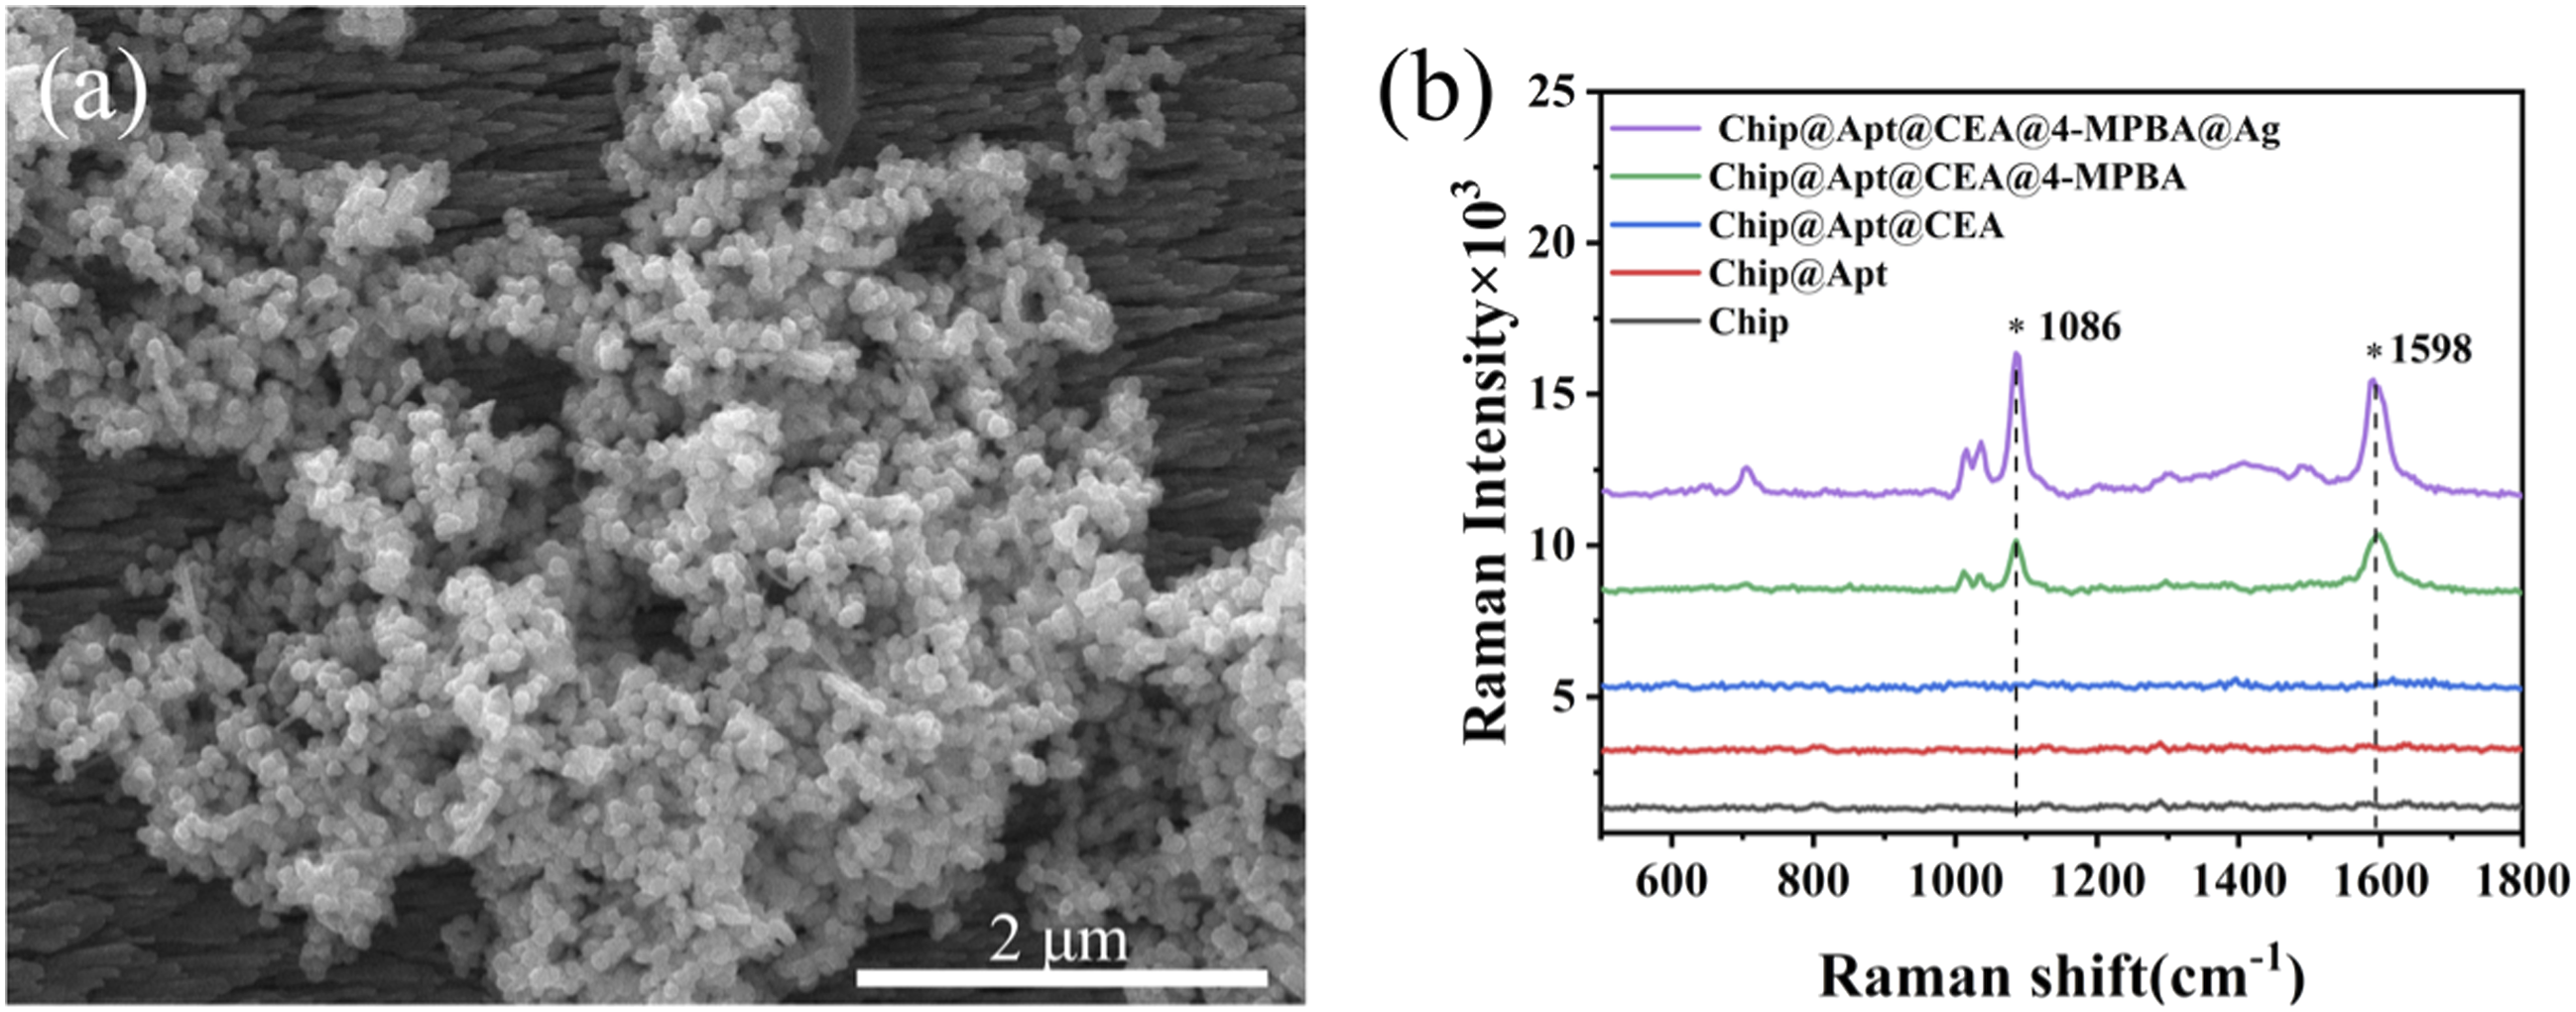
The XRD patterns of chip, Chip@Apt, Chip@Apt@CEA, and Chip@Apt@CEA@4-MPBA@Ag are shown in Fig. S4. The characteristic peaks of Ag at 2θ are 38.1, 44.3, 64.5, 77.4, and 81.5, which correspond to the crystal planes of (111), (200), (220), (311), and (222) according to the standard card (Joint Committee on Powder Diffraction Standards, or JCPDS, no. 04-0783). Due to the incorporation of Ag-containing SERS tag, the diffraction peaks of Chip@Apt@CEA@4-MPBA@Ag increased significantly. The above-mentioned changes in Ag NPs diffraction peaks can also prove the successful preparation of Chip@Apt@CEA@4-MPBA@Ag.
As shown in Fig. 3b, no Raman characteristic peaks were found in chip, Chip@Apt, and Chip@Apt@CEA, but obvious Raman peaks appeared in Chip@Apt@CEA@4-MPBA, indicating that the SERS capture substrate enhanced effect on the Raman spectrum of 4-MPBA. A higher Raman peak appeared on Chip@Apt@CEA@4-MPBA@Ag, and the signal intensity was about three times higher than that of Chip@Apt@CEA@4-MPBA, which indicated that the SERS capture substrate and Ag NPs had a significant enhancement effect on the Raman spectrum of 4-MPBA, and produced a synergistic effect. Therefore, Ag@4-MPBA was selected as the SERS tag, which could further improve the sensitivity of the sensor.
Relevant Performance of this Proposed Sensor
As shown in Fig. 4a, the SERS intensity at 1085 cm−1 gradually increased with the increase of CEA concentration from 1 pg·mL−1 to 100ng ng·mL−1, indicating that SERS intensity was highly related to the concentration of CEA. Figure 4b showed a good linear relationship between the SERS intensity and the logarithm of CEA concentration in the range of 1–106 pg·mL−1 The regression equation was I
SERS
= 1008.48LogC + 3664.32, the correlation coefficient (R2) was 0.9907, and the limit of detection (LOD) was 0.447 pg·mL−1 (the signal-to-noise ratio or S/N = 3). Compared with the reported CEA detection methods (Table S2), the detection range and LOD of the proposed method are comparable or even better than those of previous methods. The low LOD of this method may be due to the synergistic enhancement of the Raman signal of 4-MPBA by silver nanorods array and Ag NPs. (a) The Raman spectra of the SERS sensor for the detection of CEA at 1–106 pg·mL−1. (b) The linear relationship between the log concentration of CEA and the Raman intensity at 1085 cm−1. (c) The SERS intensity for CEA detection against other potentially interfering proteins (including LPL, HAS, IgG, cTnI, CRP, and BSA) at 1085 cm−1. (d) The Raman spectra of uniformity experiments (taking detection of 1 ng·mL−1 CEA as an example). (e) The Raman spectra of repeatability experiments (taking detection of 100 pg·mL−1 CEA as an example). (f) The SERS intensity of stability experiment, taking detection of 10 ng·mL−1 CEA as an example.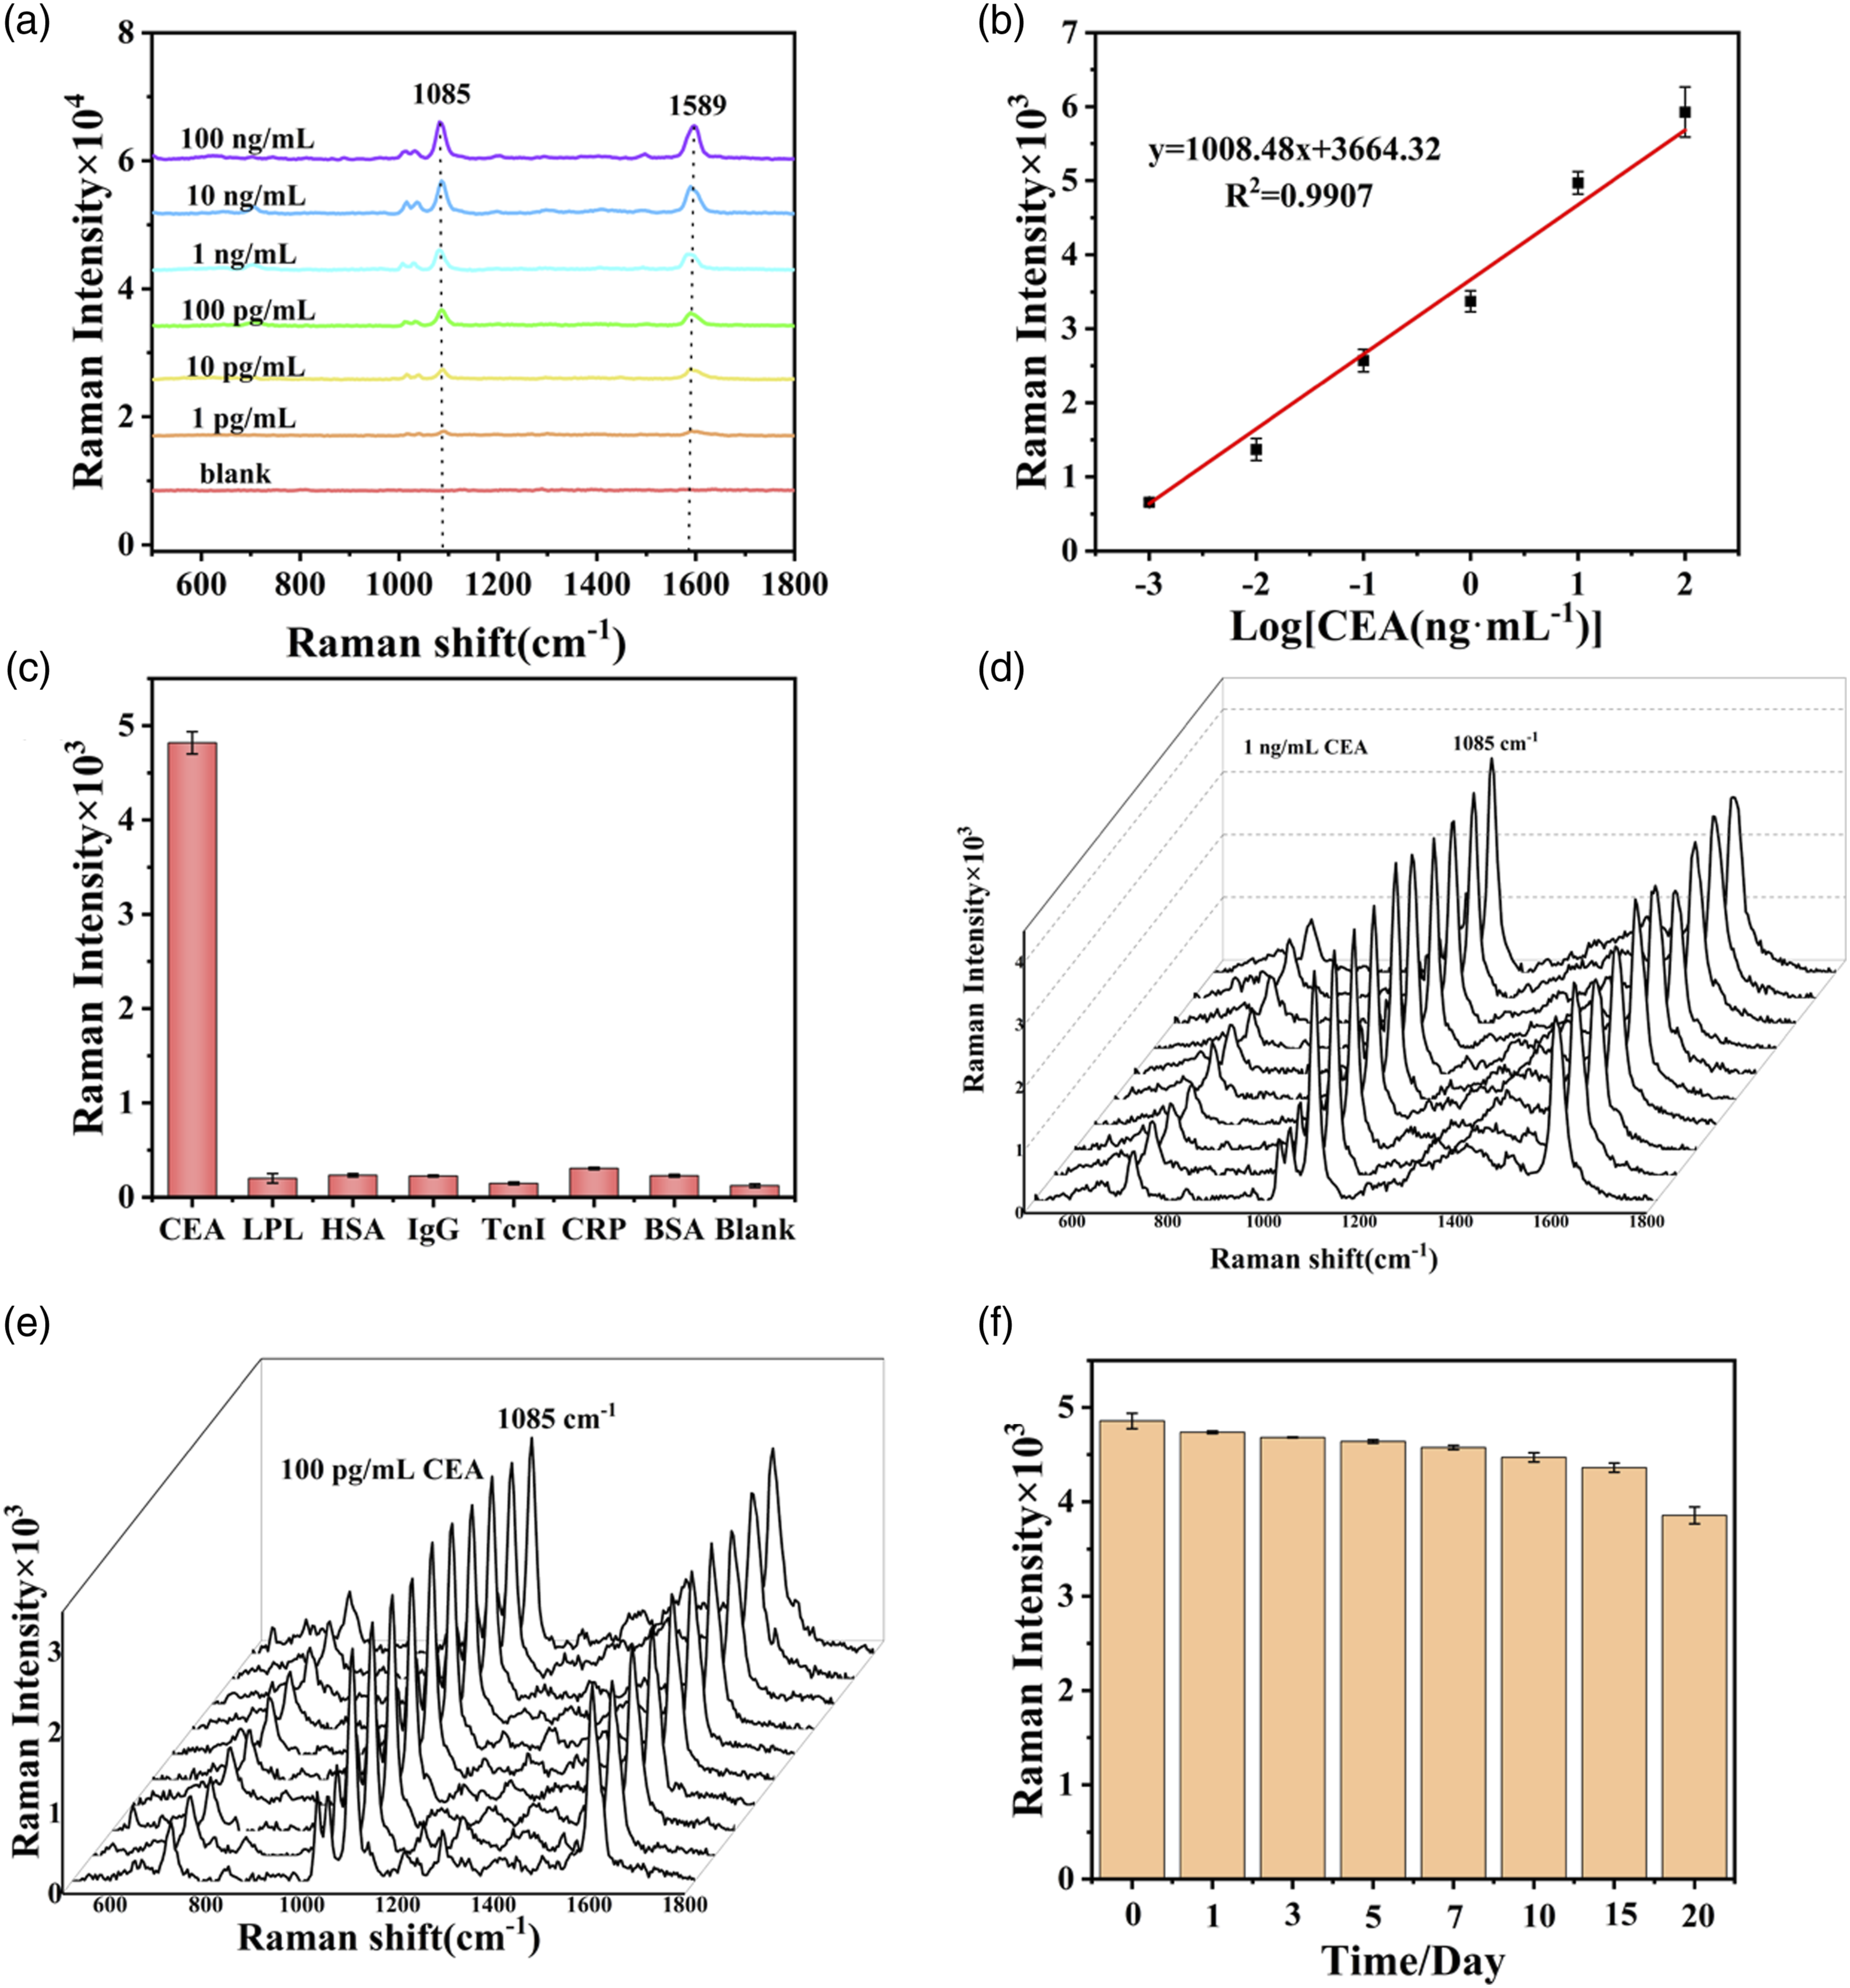
To examine the selectivity of the proposed sensor, 10 μL of Lipoprotein lipase (LPL), Human Serum Albumin (HSA), immunoglobulin G (IgG), cardiac troponin-I (cTnI), C-reactive protein (CRP), and Bovine serum albumin (BSA) standard solution, and blank sample (PBS) were detected three times by this method in parallel, respectively (Fig. 4c). The SERS signal of CEA detected by the proposed method was the strongest, which was much larger than that of other protein samples. The SERS signals of the blank sample and the interfering protein samples were almost the same, which indicated that the sensor had good selectivity and specificity for the detection of CEA.
To evaluate the uniformity and repeatability of this proposed sensor, the standard solution of 1 ng·mL−1 CEA was detected, the SERS signals of 10 different points were collected, and the SERS spectra are summarized as shown in Fig. 4d first. The relative standard deviation (RSD) was 3.9%, indicating that the SERS signals had good uniformity. Second, the standard solution of 100 pg·mL−1 CEA was detected, the SERS signal of the same point was collected 10 times, and the SERS spectrum was summarized as shown in Fig. 4e. After multiple laser irradiation to the same point, the SERS at 1085 cm−1 decreased slightly with a relative standard deviation (RSD) of 6.2%, which indicated good SERS signal repeatability.
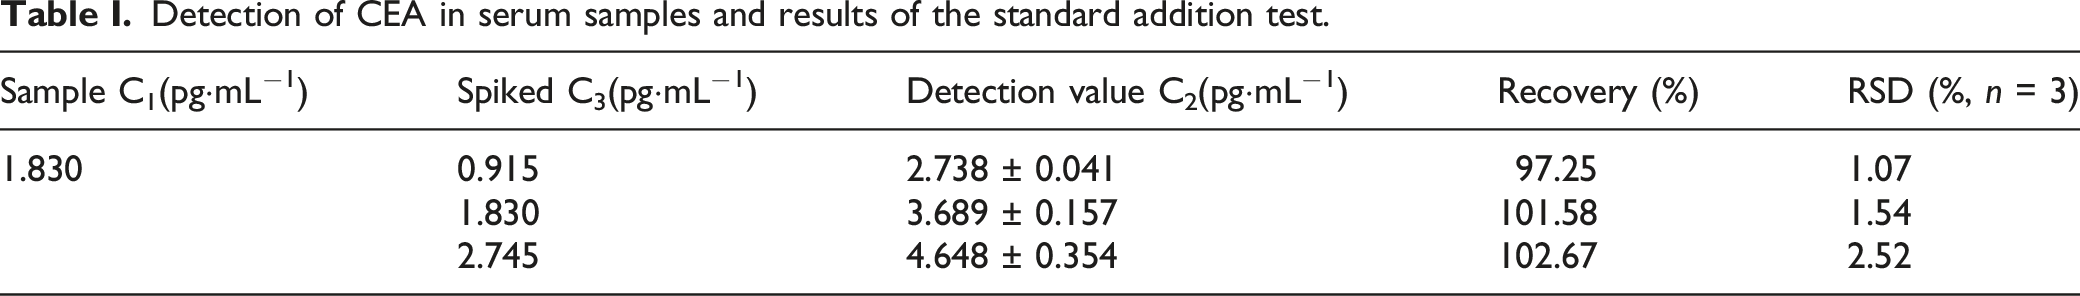
Detection of CEA in serum samples and results of the standard addition test.
To assess the stability of the proposed sensor, 10 ng·mL−1 of CEA standard solution was determined. During 0, 1, 3, 5, 7, 10, and 15 days, SERS intensities remained almost the same (Fig. 4f). However, on the 20th day, the SERS intensity decreased significantly, and the sensor was no longer suitable for the detection of CEA protein, indicating that the sensor had good stability within 15 days.
Conclusion
In this paper, we described the development of a SERS aptasensor for CEA constructed by the SERS capture substrate that used the aptamer-SH of CEA to modify the chip, the SERS tag (Ag@4-MPBA). The results showed that the SERS sensor exhibited a linear relationship between the SERS intensity and the logarithm of CEA concentration from 1 pg·mL−1 to 100 ng·mL−1, and the regression equation was I SERS = 1008.48LogC + 3664.32 (R2 = 0.9907), and the LOD was 0.447 pg·mL−1 (S/N = 3). The standard addition test was performed on CEA in serum, and the recovery was between 97.25% and 102.67%. This sensor had the advantages of good specificity, high sensitivity, and a wide linear range and is expected to be applied to the detection of CEA in serum.
Supplemental Material
Supplemental Material - Construction of a Carcinoembryonic Antigen Surface-Enhanced Raman Spectroscopy (SERS) Aptamer Sensor Based on the Silver Nanorod Array Chip
Supplemental Material for Construction of a Carcinoembryonic Antigen Surface-Enhanced Raman Spectroscopy (SERS) Aptamer Sensor Based on the Silver Nanorod Array Chip by Rui Li, Lijun Li, Yan Zhang, Xin Lin, Heyuanxi Guo, Chubing Lin, and Jun Feng in Applied Spectroscopy
Footnotes
Declaration of Conflicting Interests
The author(s) declared no potential conflicts of interest with respect to the research, authorship, and/or publication of this article.
Funding
The author(s) disclosed receipt of the following financial support for the research, authorship, and/or publication of this article: This work was supported by the Guangxi Natural Science Foundation Grant No. 2019GXNSFDA245025, and National Natural Science Foundation of China Grant No. 81860633.
Supplemental Material
All supplemental material mentioned in the text is available in the online version of the journal.
References
Supplementary Material
Please find the following supplemental material available below.
For Open Access articles published under a Creative Commons License, all supplemental material carries the same license as the article it is associated with.
For non-Open Access articles published, all supplemental material carries a non-exclusive license, and permission requests for re-use of supplemental material or any part of supplemental material shall be sent directly to the copyright owner as specified in the copyright notice associated with the article.