
Abstract
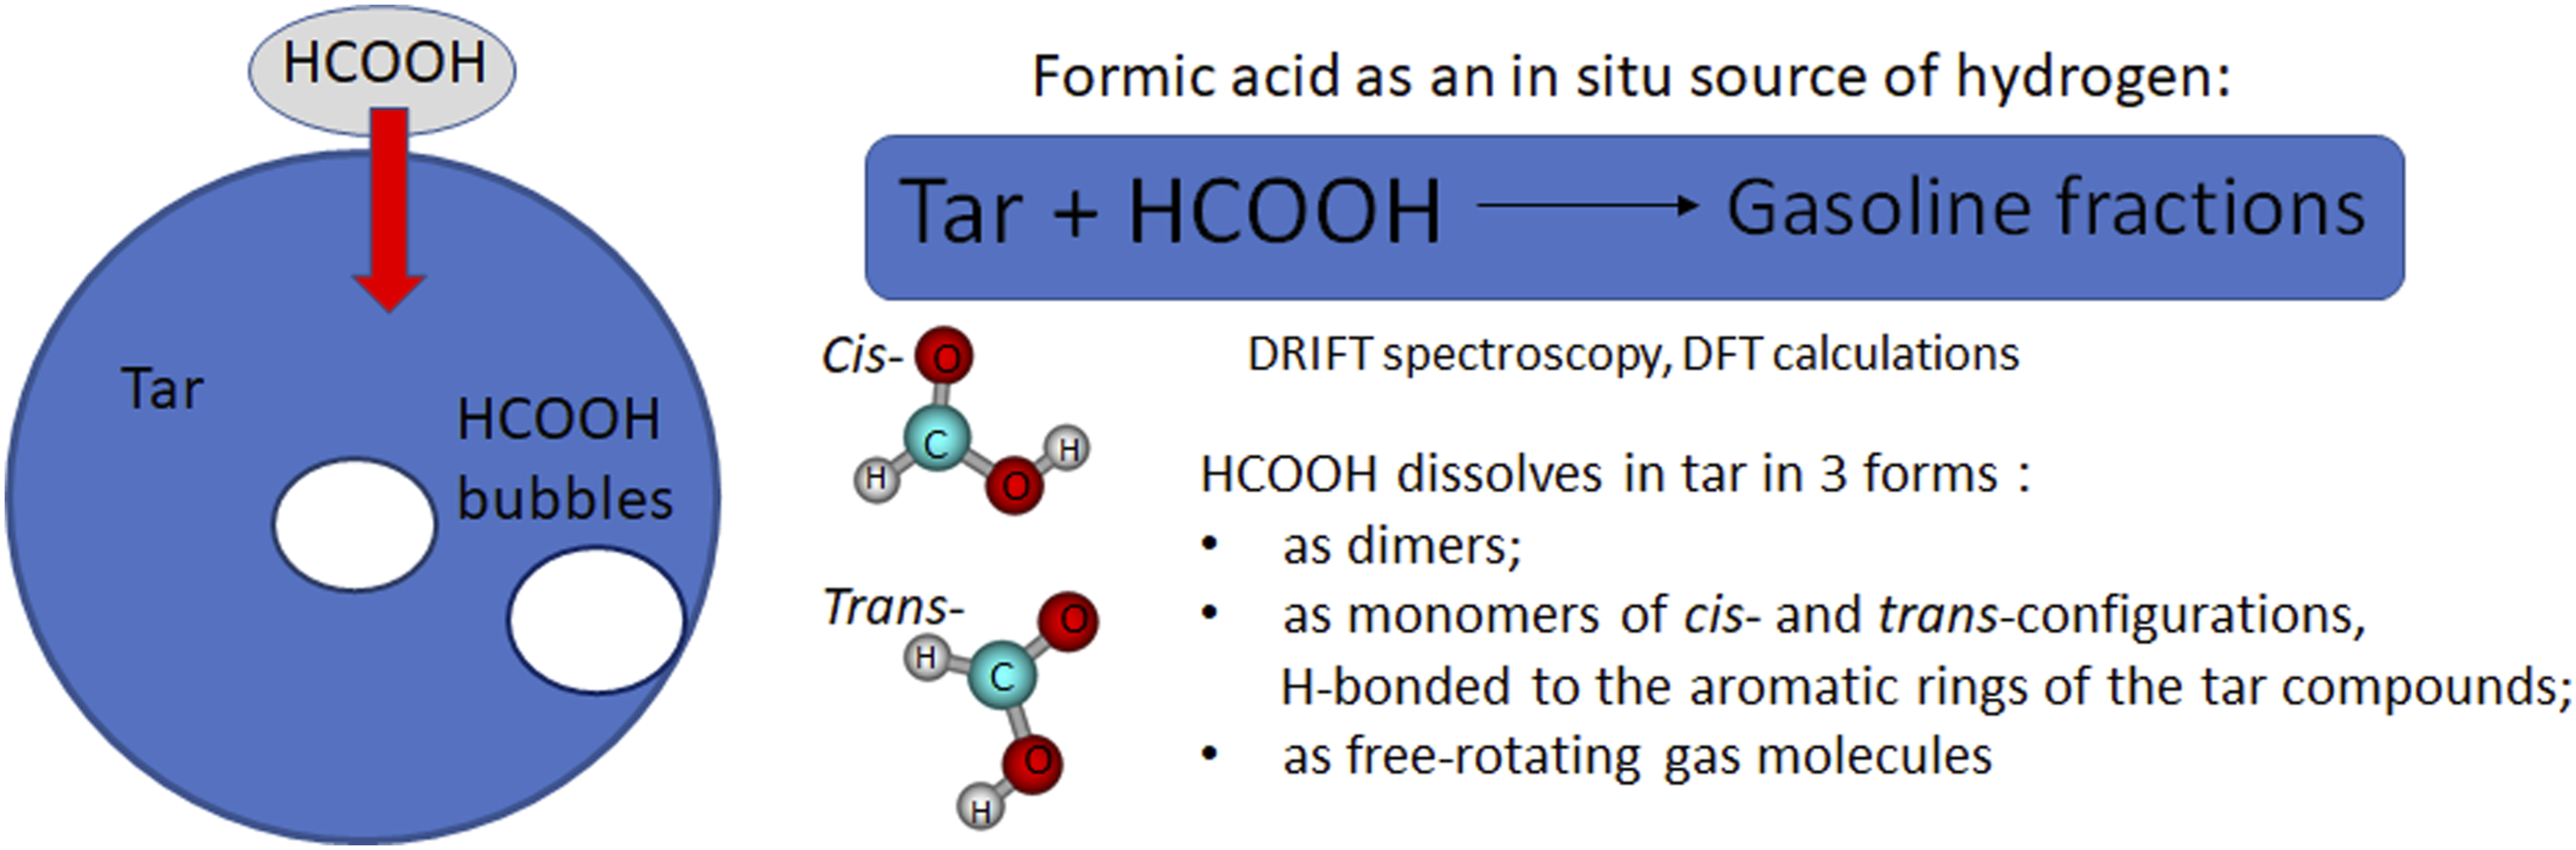
Formic acid is considered as a promising hydrogen carrier and can be used as a source of hydrogen in the processing of heavy oil fractions such as tar. The interaction of formic acid with tar was studied by infrared Fourier transform spectroscopy via special technique using a mirror substrate. The infrared (IR) spectra were interpreted considering density functional theory (DFT) calculations. It was shown that formic acid dissolved in tar in three forms, as dimers, monomers of cis- and trans-configurations, hydrogen-bonded to the aromatic rings of the tar compounds, and as free-rotating gas molecules (microbubbles in the tar bulk). The research performed provides an opportunity and methodological base for studying the process of tar conversion in the presence of formic acid into gasoline fractions at temperatures up to 300 oC.
Introduction
In recent decades, interest in the study of formic acid has intensified, which is largely due to practical activity in the area of green energy, including hydrogen.1–8 Formic acid is considered as a high-quality organic hydrogen source with low flammability and toxicity (compared to methanol or ammonia) and can be produced from biomass or from CO2 and renewable H2.8–10 In addition, recently the quality of oil produced in many parts of the world has been declining, it has become heavier and more sulfurous, and the overall quality of oils has been deteriorating.1 Formic acid is also considered as an efficient method of hydrogen storage.9–13 It was proposed to use formic acid as a source of hydrogen for the conversion of tar into gasoline fractions. 14
An effective method for studying formic acid is vibrational spectroscopy,15,16 including combinations with quantum chemical calculations.17–21 It is now strictly established that the formic acid monomer exists in cis- and trans-configurations. 19 In these configurations, the hydrogen of the hydroxyl group is located in the direction between an oxygen atom and a hydrogen atom of the CH group, or between two oxygen atoms. These configurations differ in the frequencies of OH stretching vibrations. The cis configuration is characterized by a band around 3616–3617 cm−1, while the trans configuration has a lower frequency band at 3554–3567 cm−1. In addition, it is well known that formic acid forms sufficiently strong dimers at room temperature with a decomposition enthalpy of about 50 kJ/mol and a dissociation entropy of 180 J/mol·K. 17 The IR spectrum of the dimer is characterized by a wide band of OH stretching vibrations of hydrogen-bonded groups in the range of 2500–3500 cm−1.17–20,22
This work is focused on studying the state of formic acid after interaction with tar at room temperature. We believe that obtained results can provide an insight into the mechanism of formic acid interaction with tar which allows efficient hydrocracking of such heavy raw materials as tar into gasoline and diesel fractions.
Experimental
Materials and Methods
The properties of the tar sample after interaction with formic acid were studied at room temperature by infrared Fourier transform spectroscopy using a mirror substrate. IR spectra were recorded on a Shimadzu IRTracer-100 spectrometer with a DRS-8000 diffuse reflection attachment in the range 400–6000 cm−1 with a resolution of 4 cm−1 and an accumulation of 100 scans. The methodological approach for acquiring IR spectra using a mirror substrate was described in detail earlier. 23 In brief, a viscous tar sample right after the interaction with formic acid was spread on a mirror plate using a spatula to relatively thin layer, while the focus of the incident infrared beam on the sample was aligned to this plate. In view of the fact that the samples are spread on a mirror substrate with a thickness of between 25 and 50 µm, transflection spectra are measured.
The experimental IR spectra were compared to the data obtained from DFT (B3LYP) calculations with 6-311++G(d, p) basis sets.
Results and Discussion
Figure 1 shows the IR spectrum of the original tar. Tar is known to contain aromatic, cyclic, paraffinic hydrocarbons, asphaltenes, and petroleum resins.
24
Nuclear magnetic resonance applied to study the distribution of hydrogen among the functional groups in heavy oil fractions showed that up to 50% of hydrogen was present in methylene groups, the rest was aliphatic methyl and benzylic hydrogens, and, lastly, the aromatic hydrogens.24,25 The IR spectrum of the tar sample contains a number of absorption bands which characterize the vibrations of various bonds and groups (Fig. 1). The main characteristic bands and their assignment are listed in Table I. Such a spectrum significantly complicates the identification of the formic acid spectrum, therefore, the procedure of subtracting the spectrum of the initial tar from the spectra of the formic acid solution in the tar was performed. The obtained spectra are shown in Figs. 2 and 3. Figure 3 shows IR spectra registered after applying the solution to a mirror plate after different exposure times in air. These spectra are typical for the C=O antisymmetric vibration of the COOH group. During aging, formic acid evaporated from the solution with tar. IR spectrum of initial tar. Assignment of the observed absorption bands for the tar sample after the reaction. IR spectra of OH groups of formic acid dissolved in tar: (1) spectrum of the initial tar, (2) spectrum of the mixture of tar with formic acid (17 g of tar and 3 g of formic acid), (3) differential spectrum obtained by subtracting Spectrum 1 from Spectrum 2. The inset shows an enlarged fragment of the 3100–3800 cm−1 range. IR spectra of C=O groups of formic acid dissolved in tar. The spectra were registered during the evaporation of formic acid (subtracting the spectrum of the initial tar): (1) 3 min after applying the sample to the mirror substrate, (2) after 5 min, (3) after 7 min, (4) after 10 min, (5) after 20 min, and (6) the differential spectrum obtained subtracting Spectrum 1 from the Spectrum 2 with correction of the intensity of Spectrum 2.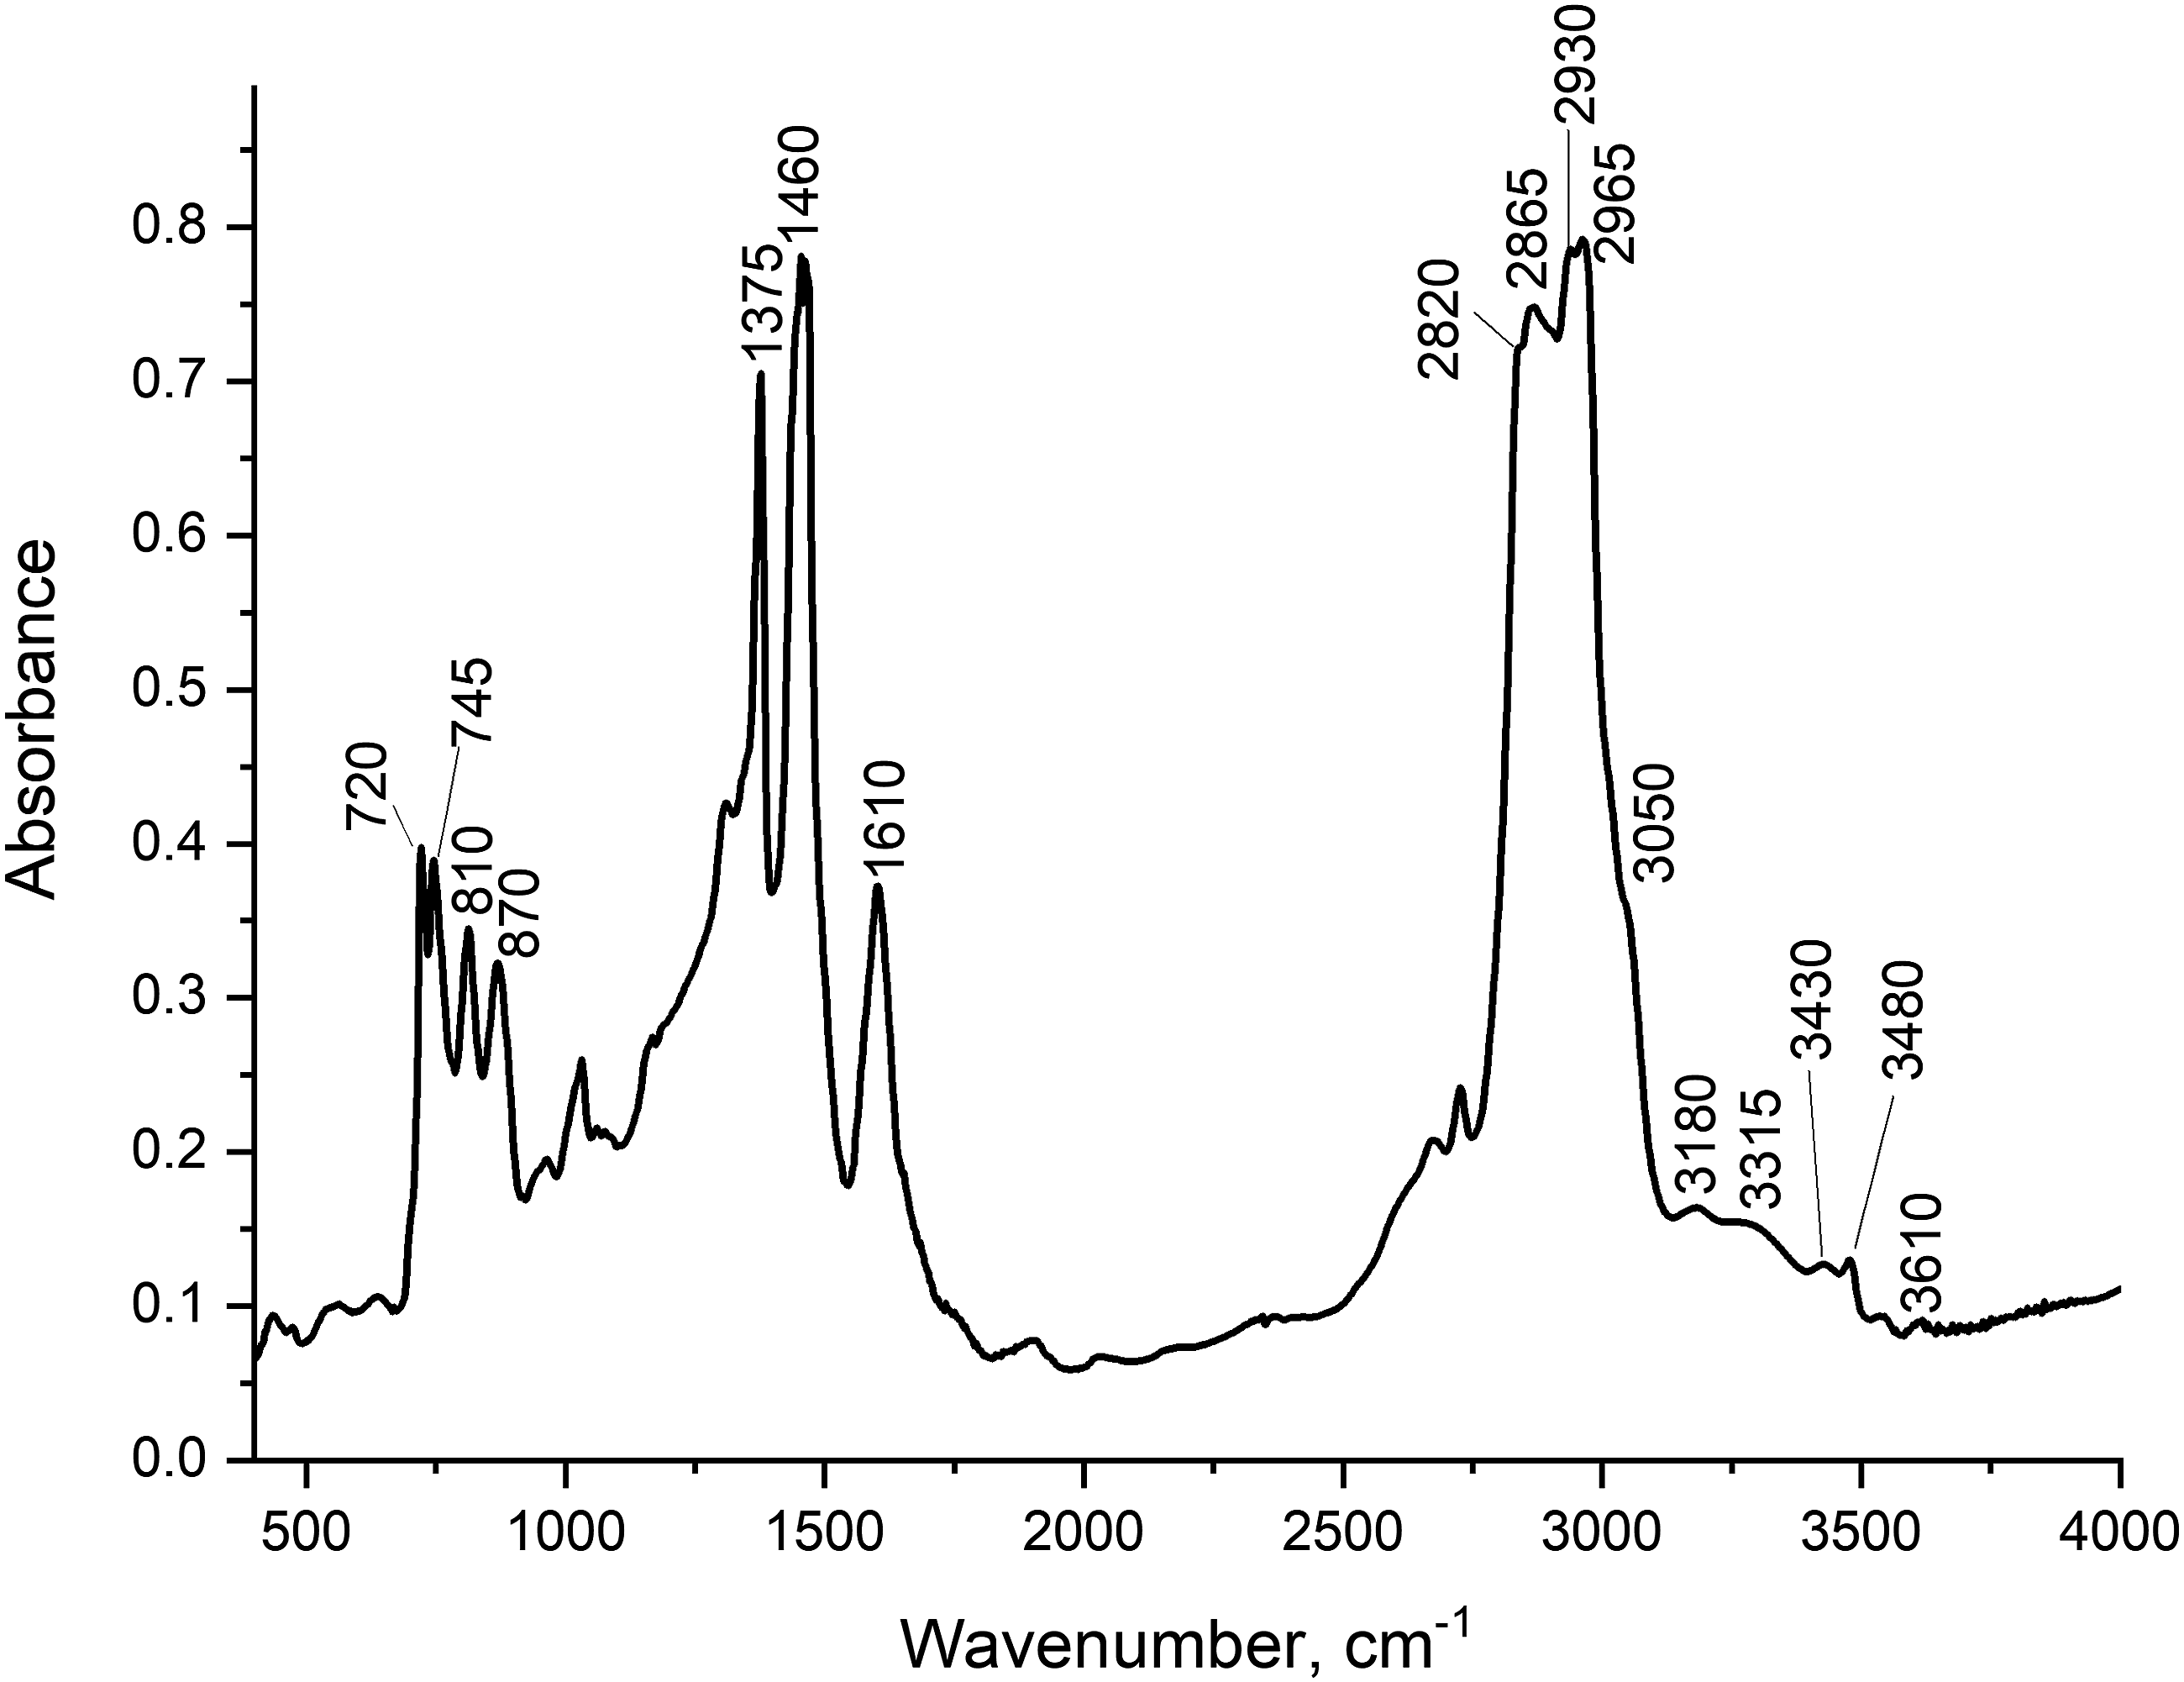
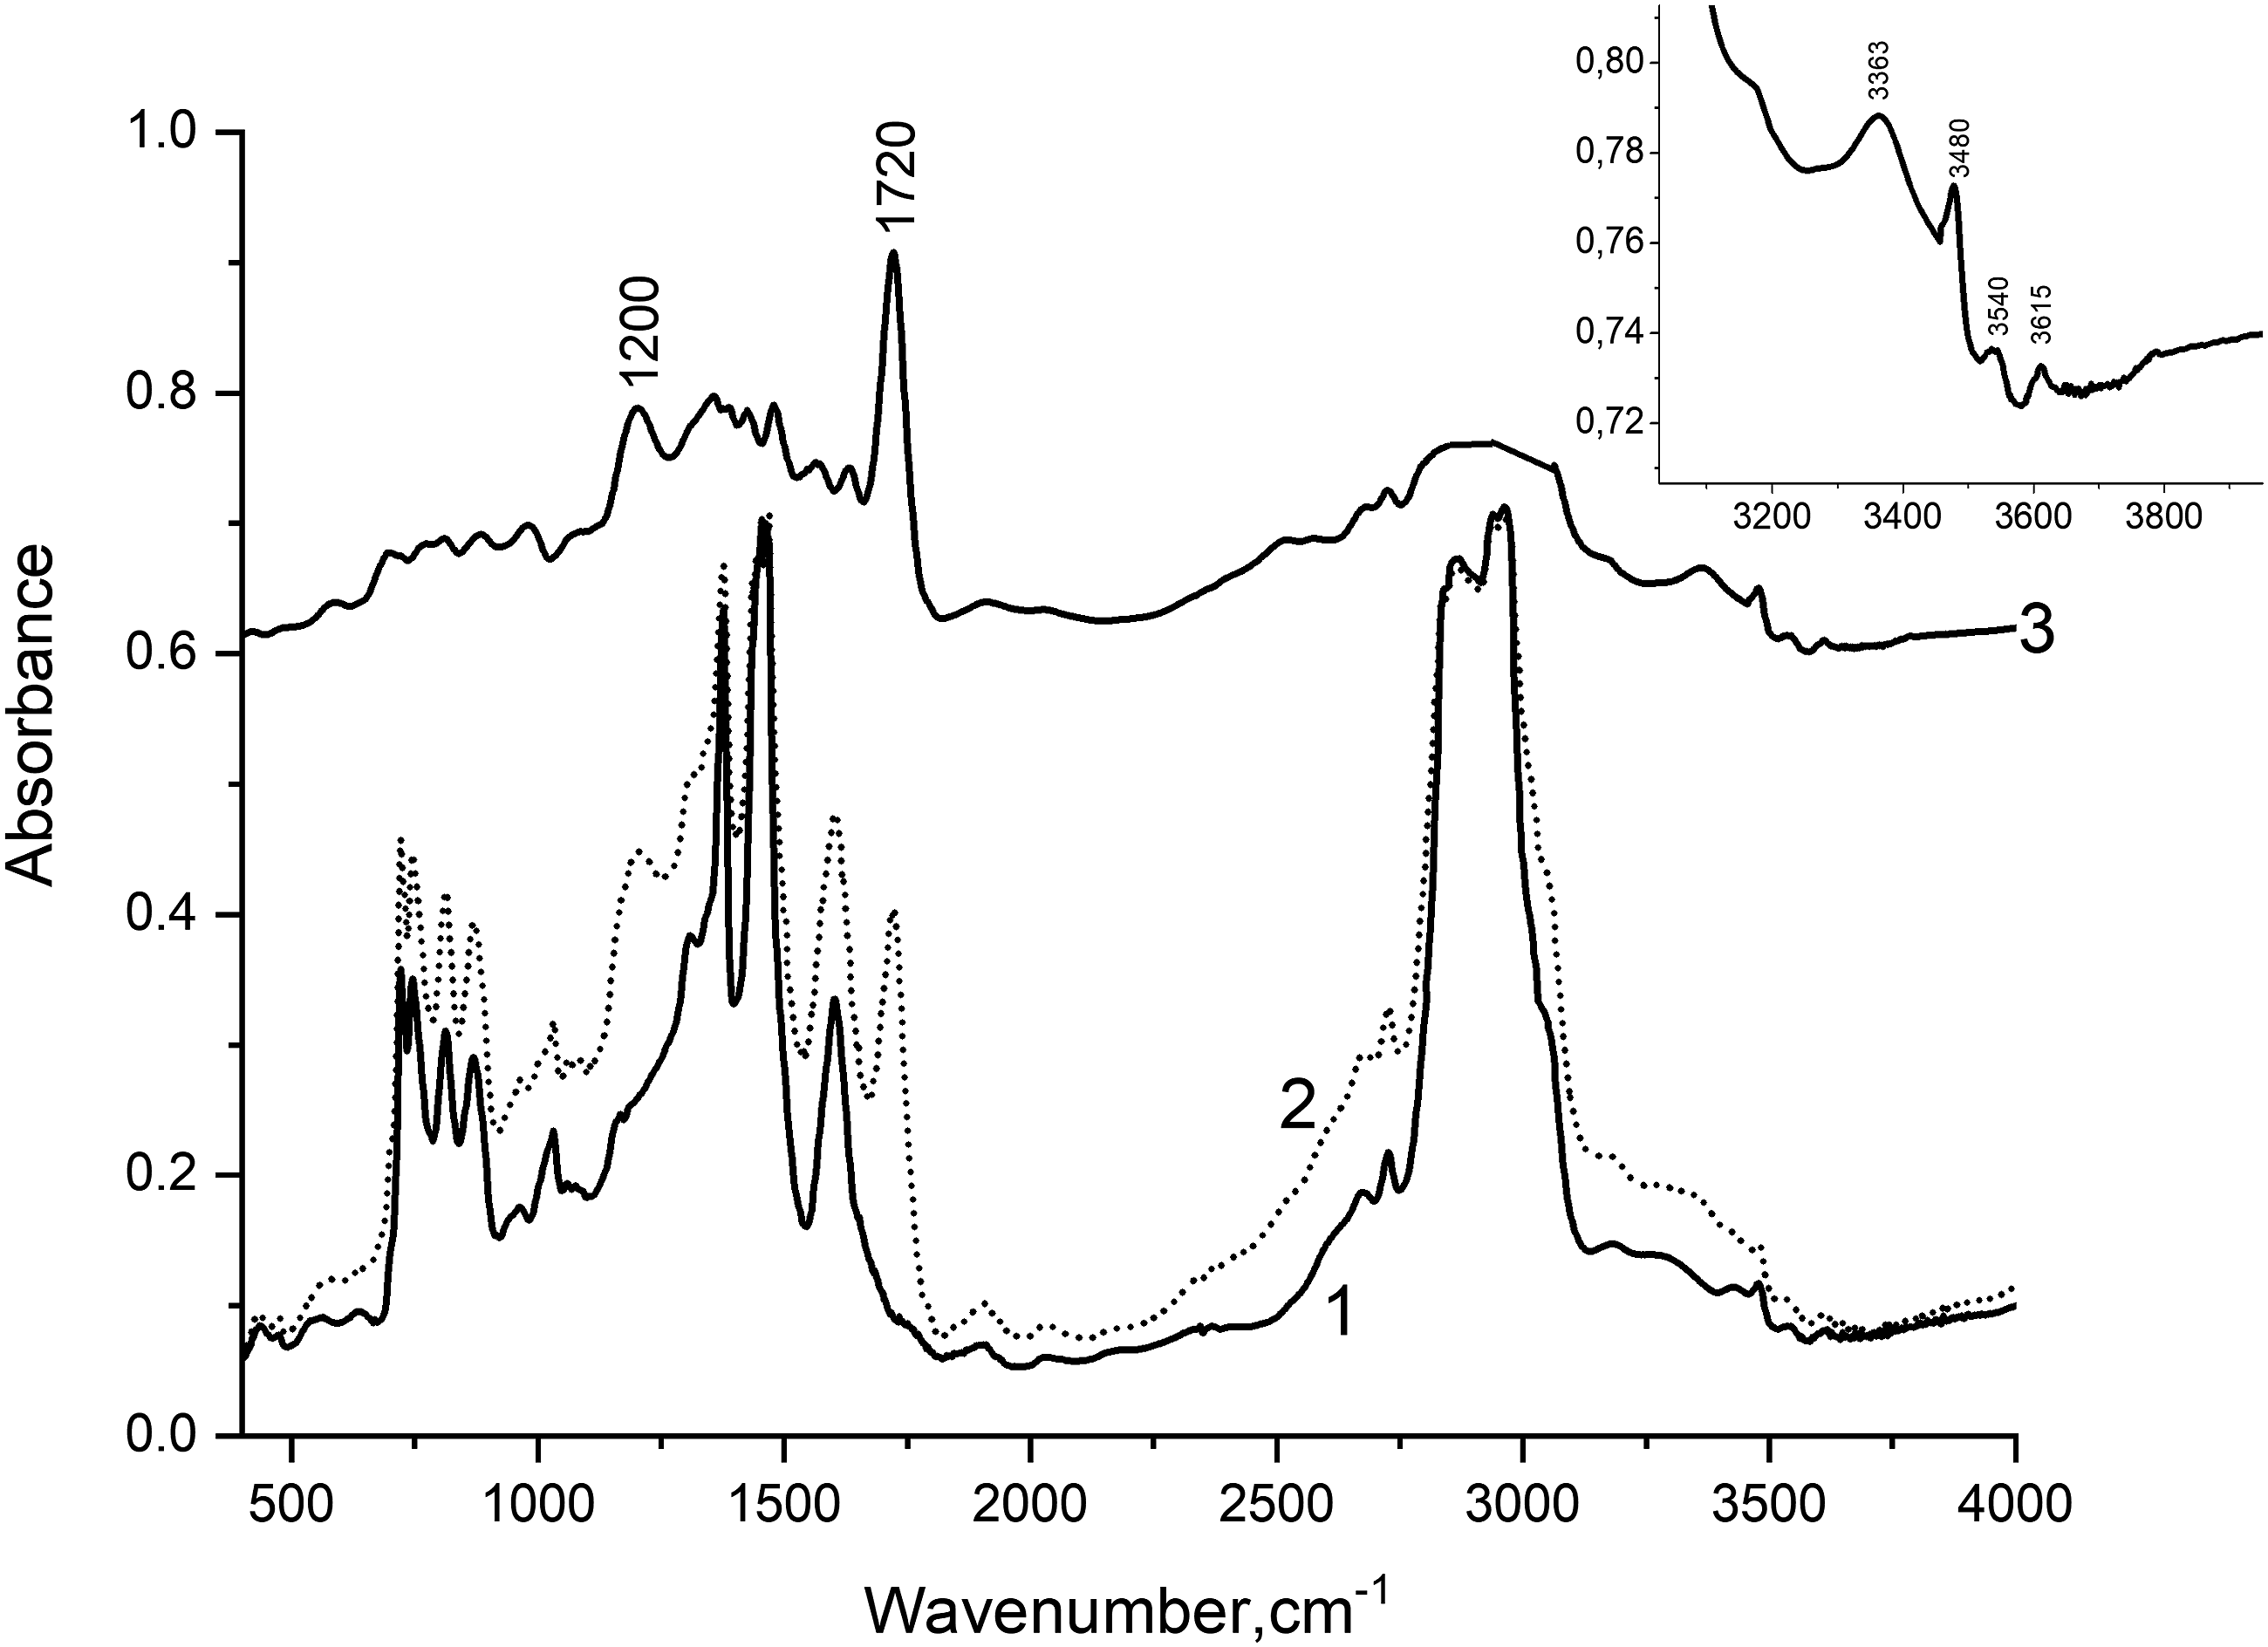
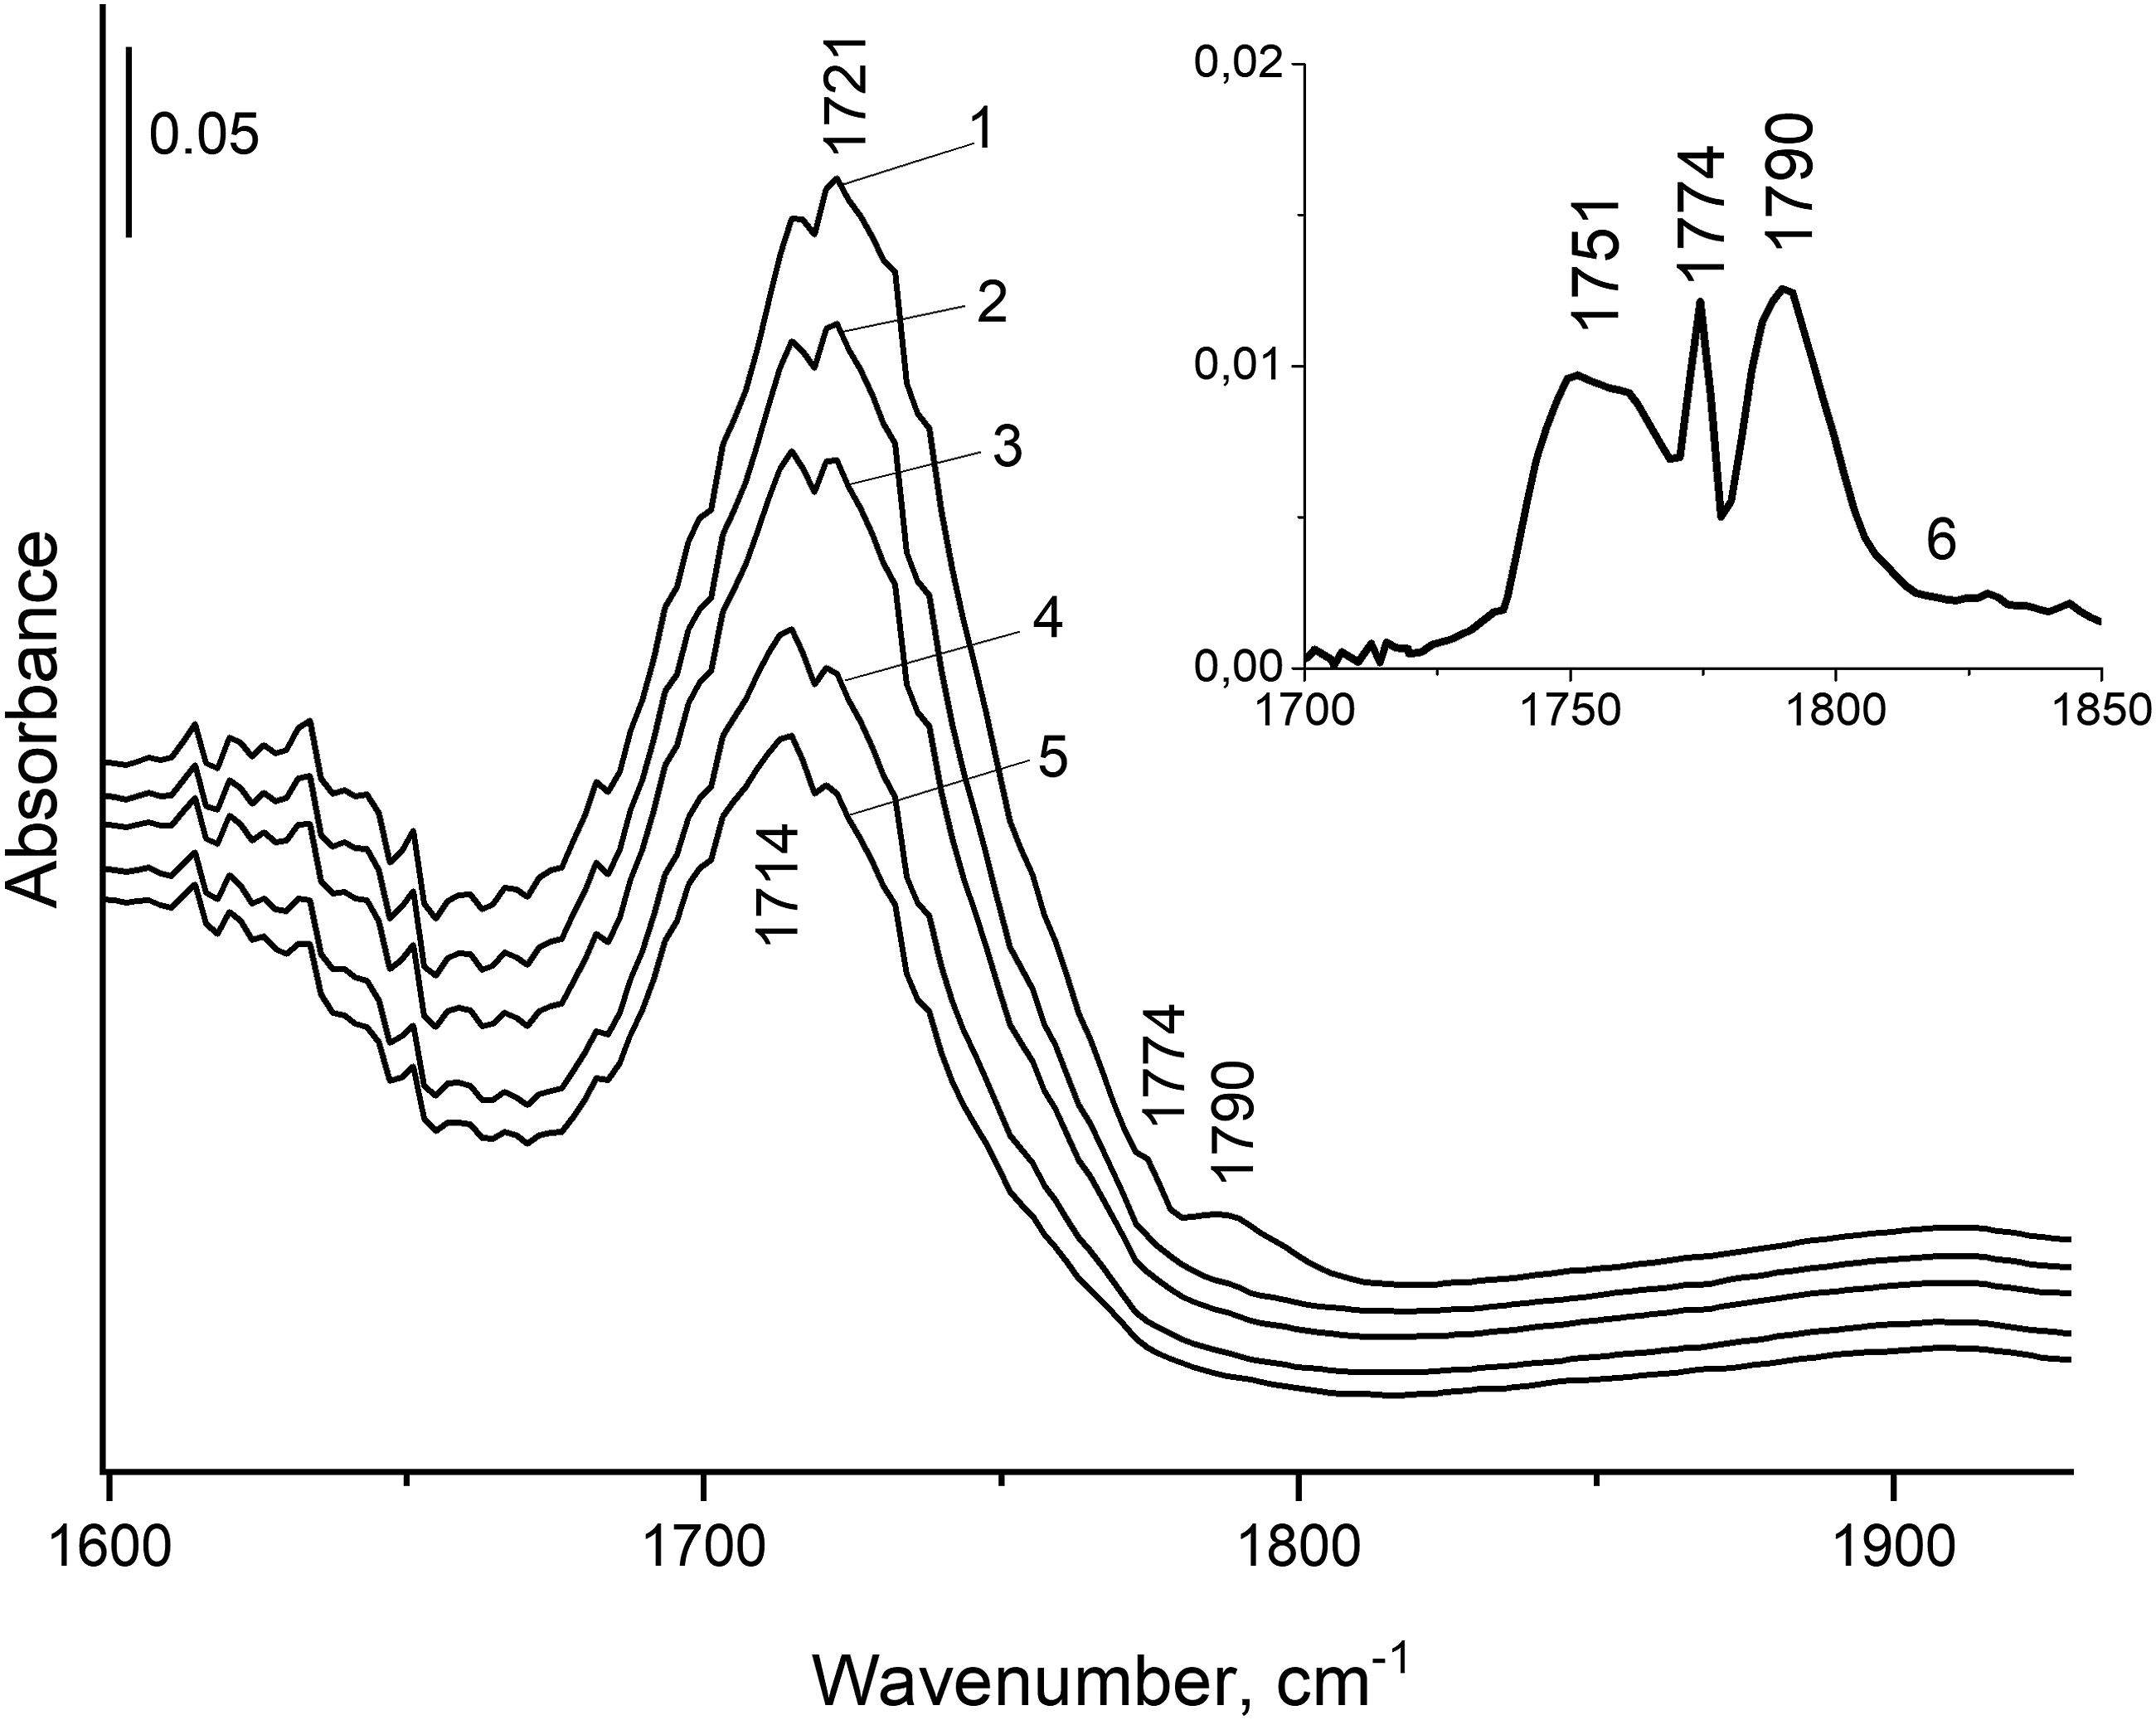
Figures 2 and 3 show that several states of formic acid are present in the sample: (i) Formic acid as dimers (bands at 1200 and 1720 cm−1, and a wide band in the range of 2200–3100 cm−1.17–19 (ii) Formic acid as gaseous monomers (the bands at 1751, 1774, and 1790 cm−1 are characteristic of the vibrational–rotational components of freely rotating molecules20–22). As can be seen from Fig. 2, gaseous formic acid exists in the sample as two isomers, cis- and trans-configurations, with bands at 3616–3620 and 3540–3570 cm−1, respectively. Based on the relative intensity of the C=O bands of stretching vibrations in gaseous formic acid molecules (bands at 1751, 1774, and 1790 cm−1, Fig. 3), the relative proportion of gaseous monomers does not exceed 2–3%. (iii) The rest of the acid is in the form of monomers hydrogen-bonded with tar (bands at 3363 and 3480 cm−1). To assign the bands of hydrogen-bonded OH groups, we calculated the energy of proton abstraction from the cis- and trans-configurations of the acid (Table II). Calculation of acidity (proton abstraction energy) of different configurations of formic acid monomers. Red balls: oxygen; blue balls: carbon; gray balls: hydrogen.
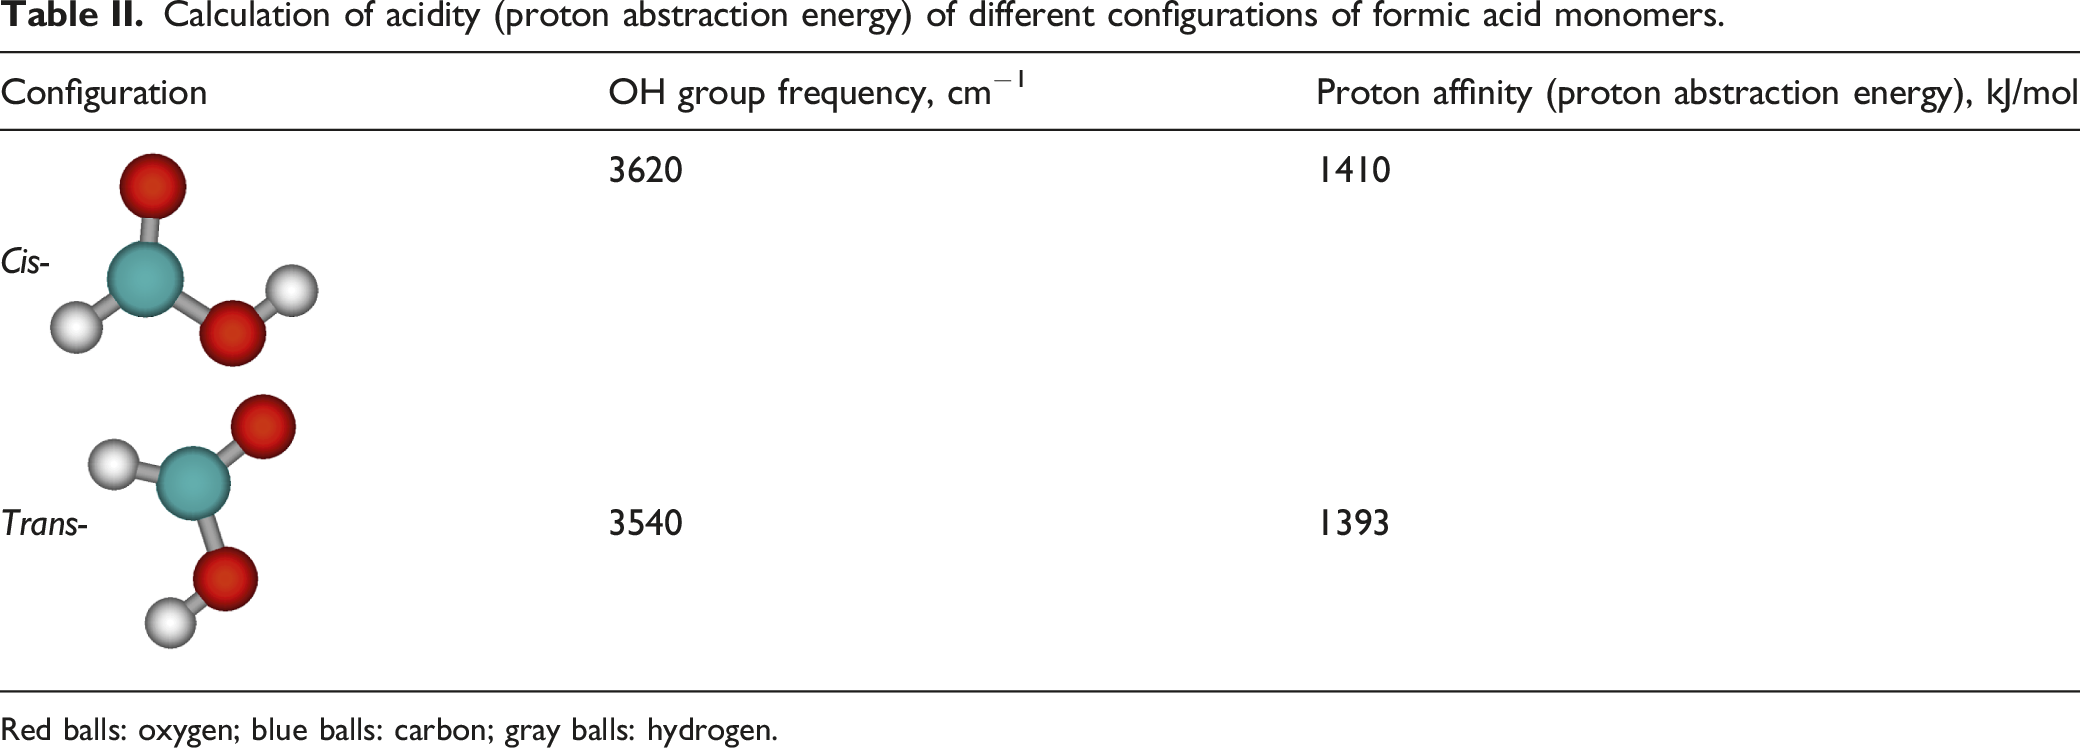
Since the proton abstraction energy is lower for the trans-configuration, it is more acidic and, therefore, the OH group band is expected to shift to lower frequencies with molecules that are part of the tar (most likely with aromatic rings). Therefore, the band at 3363 cm−1 can be attributed to the hydrogen-bonded formic acid molecule in the trans configuration (shift of 177 cm−1), and the band at 3480 cm−1 can be attributed to the cis-configuration (shift of 140 cm−1).
Figure 3 shows the change in the intensity and position of the C=O bands of groups of different forms of formic acid with time. It can be seen that the bands at 1774 and 1790 cm−1 characterizing vibrational–rotational components of freely rotating molecules are not observed as early as 5 min after applying the sample to the mirror substrate. These gaseous monomers of formic acid exist as microbubbles in the bulk of the tar and disappear within five minutes. The intensity of the bands of dimers (band at 1721–1714 cm−1) of the acid decreases with time at a much lower rate; in 20 minutes, its intensity decreases by less than 50%. At the same time, the band shifts to the low-frequency region by 7 cm−1. The shift to low frequencies means that as the acid concentration decreases, the remaining dimers become stronger, which may be due to the interaction of the dimers with the “solvent”, which is tar.
The amount of dissolved formic acid was determined from data on the ratio of tar and acid (17 g/3 g), at which the system was single phase without the presence of a separate liquid phase and a separate solid tar. This corresponded to a formic acid content of 5 µmol/g.
Conclusion
Thus, it has been established that formic acid dissolves well in tar at room temperature and atmospheric pressure, approximately 5 mmol/g. If we consider formic acid as a source of hydrogen, then such an amount of hydrogen dissolved in the tar could be achieved at a hydrogen pressure of about 100 atm. The solubility of hydrogen in fuels at atmospheric pressure is only 1.8·10−5 mol/mL. Therefore, formic acid is an excellent source of hydrogen in the processes of hydrogenation and hydrocracking of high molecular weight hydrocarbons, which is observed in catalytic experiments. 14
Formic acid dissolves in tar in three forms: in the form of dimers and monomers of cis and trans configurations, hydrogen-bonded to the aromatic rings of the molecules that make up the tar. In addition, during the dissolution, formic acid exists in the form of free-rotating gas molecules, which is explained by the formation of microbubbles in the bulk of the tar.
Footnotes
Declaration of Conflicting Interests
The author(s) declared no potential conflicts of interest with respect to the research, authorship, and/or publication of this article.
Funding
The author(s) disclosed receipt of the following financial support for the research, authorship, and/or publication of this article: This study was supported by the Russian Science Foundation, project no. 17–73–30032. The experiments were carried out using facilities of the shared research center, National Center of Investigation of Catalysts, at Boreskov Institute of Catalysis.