
Abstract
The ability to obtain information on the composition of airborne particles is a necessary part of identifying and controlling risks from exposure to potentially toxic materials, especially in the workplace. However, very few aerosol sampling instruments can characterize elemental composition in real time or measure large inhalable particles with aerodynamic diameter exceeding 20 µm. Here, we present the development and validation of a method for real time elemental composition analysis of large inhalable particles using laser-induced breakdown spectroscopy (LIBS). The prototype sensor uses a passive inlet and an optical triggering system to ablate falling particles with an LIBS plasma. Particle composition is quantified based on collected emission spectra using a real-time material classification algorithm. The approach was validated with a set of 1480 experimental spectra from four different aerosol test materials. We have studied effects of varying detection thresholds and find operating conditions with good agreement to truth values (F1 score ≥ 0.9). Details of the analysis method, including subtracting the spectral contribution from the air plasma and reasons for the infrequent misclassifications, are discussed. The LIBS elemental analysis can be combined with our previously demonstrated direct-reading particle sizer (DRPS) to provide a system capable of both counting, sizing, and elemental analysis of large inhalable particles.
Introduction
There is a lack of aerosol sampling technology capable of simultaneous real-time characterization of the size, concentration, and composition of inhalable particles greater than ∼20 µm in diameter. For occupational exposure, airborne particles are often separated into size categories based on their aerodynamic diameter (da), which also dictates how deeply they penetrate into the human respiratory system—respirable (da ≤ 4 µm), thoracic (da ≤ 10 µm), and inhalable (da ≤ 100 µm).1,2 Aerosol research and instrumentation have primarily focused on detecting small (respirable and thoracic) particles due to their prevalence in almost all environments and the health hazards associated with their inhalation. However, inhalable particles larger than 20 µm are also present in many industrial environments. For example, grinding, 3 laser machining, 4 lead smelting, and battery manufacturing 5 all produce aerosols with mass median diameters larger than 20 µm. Additionally, wind-blown dust can contribute to high concentrations of inhalable aerosol outdoors.6,7 When large inhalable particles are present in an environment, the particle number density is typically much lower than that for smaller, respirable particles. However, such large particles often represent a significant fraction of the total aerosol mass concentration, and the majority of regulatory exposure limits are mass-based. 8
State-of-the-art aerosol measurement devices, such as aerodynamic particle sizers (e.g., 3321, TSI Inc., US) and optical particle counters (e.g., 11-D, GRIMM Technik Ainring, Germany), are appropriate for both research purposes and hazard monitoring in the workplace; however, these instruments are typically limited to a maximum particle size of approximately 20 µm. The difficulties in detection (counting) of large particles include the following: (i) inertial losses during inlet aspiration or subsequent transmission of the particle into the detection region of the instrument 9 or (ii) the tendency towards optical saturation due to large scattering signals in optical systems. 10
If the materials contained within an inhaled particle are hazardous to health (e.g., lead, nickel, or beryllium), then it is important to identify the presence of these species to limit exposure. A common method to characterize the elemental composition of inhalable aerosol involves collection on filter media, typically over an eight-hour work shift or longer, followed by laboratory analysis using spectroscopic techniques such as inductively coupled plasma (ICP) or X-ray fluorescence (XRF). Time-integrated filter measurement can provide accurate information about elemental composition, but this approach requires substantial time and resources12,13 and cannot provide information on the timing and duration of exposure events. Filter-based methods also cannot link composition (and exposure) to specific particle sizes counts. The ability to determine the composition of large inhalable particles in real-time combined with a counting and sizing system, as we demonstrate, can allow for more rapid response and mitigation of hazardous airborne materials relative to existing methods.
The focus of the present work is the development of a direct-reading particle sizer (DRPS) that uses optical scattering signals and laser-induced breakdown spectroscopy (LIBS) to obtain direct time-resolved measurements of the aerodynamic diameter and elemental composition of large (∼20–100+ μm) airborne particles. The counting and sizing rely on Mie scattering 11 from a pair of vertically separated laser beams as has been described in our past work 12 ; here, we focus on expanding the device’s LIBS capabilities. The LIBS technique has been employed in many fields for both qualitative and quantitative compositional analysis. Elemental analysis with LIBS involves ablation of sample material by a microplasma, induced by a high-powered laser pulse incident on the sample, and then analyzing the resulting optical emission spectrum. 13 The species (generally atoms) contained within the plasma emit light at specific wavelengths (frequencies) in the form of “emission lines”. Comparing the wavelengths of the detected lines against spectral databases allows the identification of species present within the irradiated sample. Aspects of LIBS analysis that are advantageous for aerosol sampling include the possibility of compact, mobile, real-time instrumentation (without sample preparation), the ability to obtain sufficient signals with only a few nanograms of material, 13 and the ability to integrate with optical-based sizing and counting.
Material identification with LIBS most commonly uses relatively large, stationary solid samples and repeat (often hundreds to thousands of laser shots) measurements to improve signal-to-noise ratios, including the possibility of moving the beam sample location over the course of the measurement. 13 Elemental analysis of aerosol samples using LIBS has also been demonstrated, typically also with stationary samples, where multiple approaches can be used to immobilize the particles including collection on filters, 14 on a charged needle, 15 or trapping by an electrodynamic balance.16,17 Although trapping single particles can be advantageous in some cases, we follow an approach in which particles settle through the instrument under the influence of only gravity. The falling particles carry information on their aerodynamic diameter (based on settling velocity) allowing us to perform both counting (with Mie scattering) and the real-time LIBS composition measurements. There have been several demonstrations of LIBS methods based on free-firing (untriggered) lasers aimed at moving aerosol streams, though sampling rates (i.e., the probability of actually hitting a particle) were limited to only ∼1–5%.18,19 In general, attempting to perform LIBS on individual moving particles adds complexity in terms of requiring precise overlap of the particle and laser plasma in both time and space There have been limited reports in the literature of such approaches. Tjarnhage et al. use an optical Mie scattering triggering scheme relatively similar to ours (but with an aerosol concentrator at the inlet) and achieve single particle sampling rates up to 70%. 20
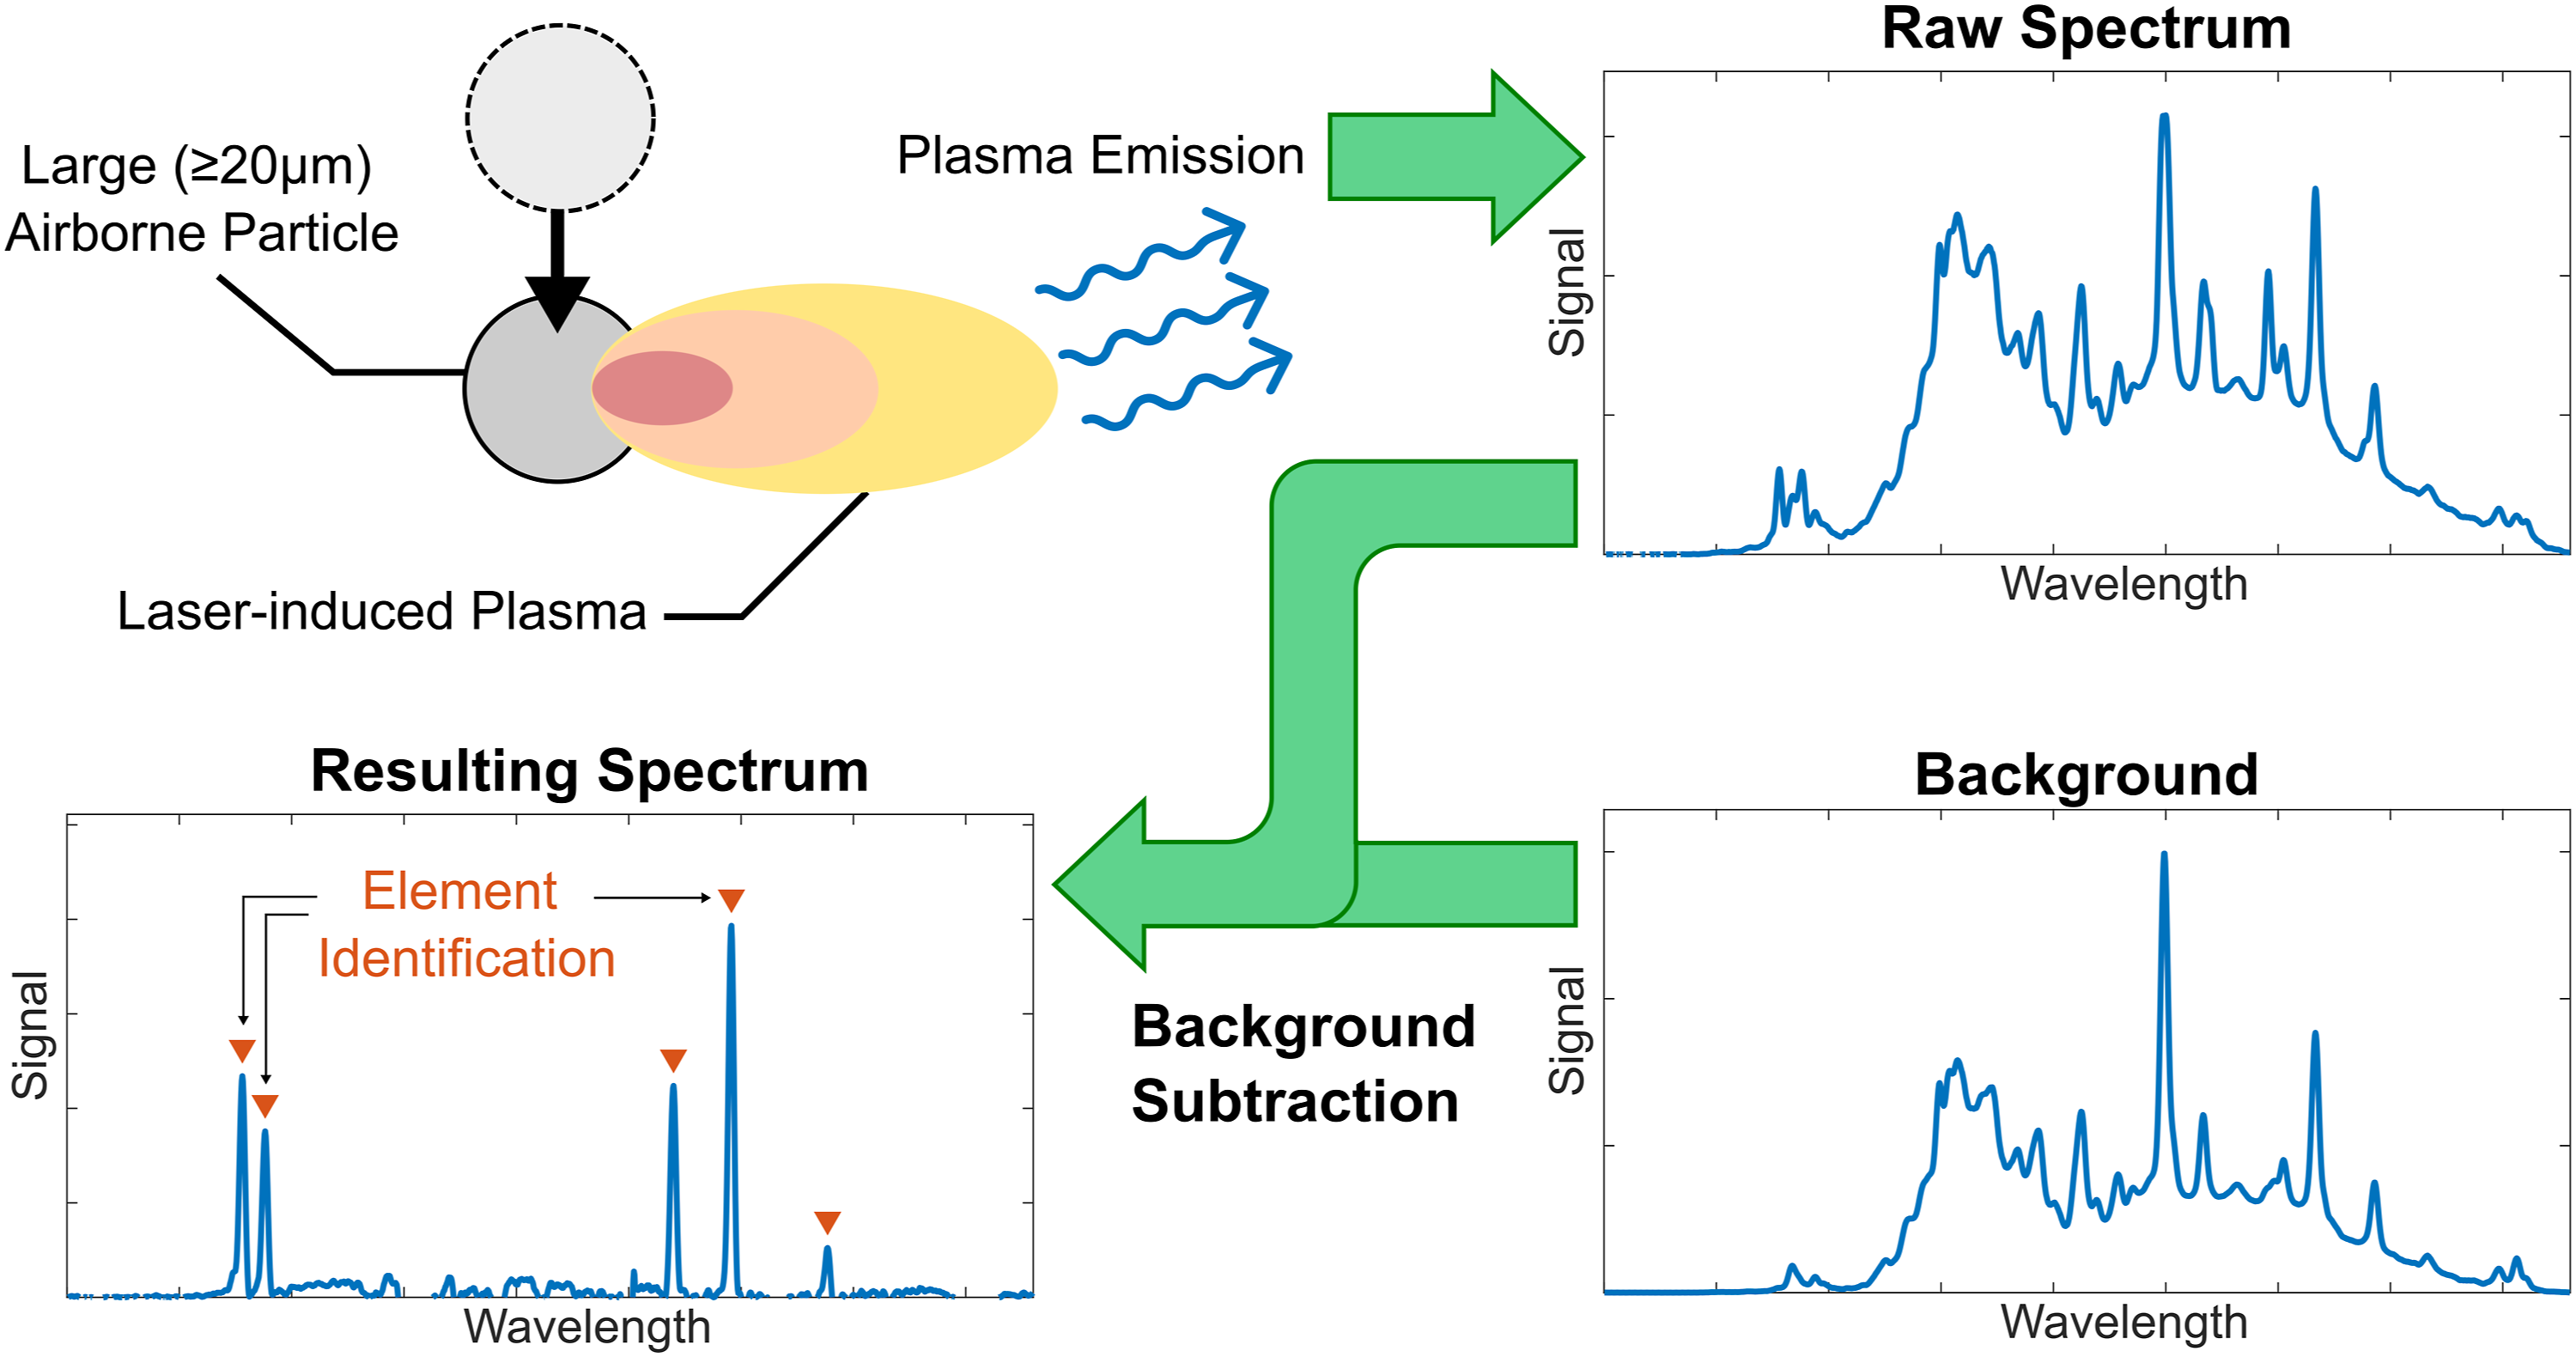
A challenge in LIBS analysis, which is particularly prevalent in sampling of freefalling particles, is the necessity to discriminate between spectral features resulting from ablation of the analyte particle versus from the surrounding matrix, that is, accompanying optical emission from the surrounding air. There can be more subtle “matrix-effects”, for example, radiative or chemical coupling between the plasmas due to the air and due to the particle, which influences the overall spectral features. These effects tend to be stochastic depending upon the exact overlap between the illuminating laser pulse and particle. Note that in our regime of laser pulse energy and particle size, the fraction of each particle that gets ablated by the laser-induced microplasma is small.18,21 A related analysis challenge is the temporal evolution of plasma light. At the earliest stages of the plasma lifetime, the emitted light is dominated by broadband continuum emission which is generally not useful for line-based spectral identification. 13 Subsequently, as the plasma decays and the continuum emission reduces, photons are emitted primarily by line emission (between bound states of the constituent atoms or ions), allowing the determination of elemental composition. Spectrometers with time-gated detection can be used to collect LIBS light only in the later stages of plasma decay as a means to reduce the contribution of the early time continuum emission.13,22 Low-cost commercial USB spectrometers with ungated detectors can also be used for LIBS, though timing jitter (between the trigger pulse and signal acquisition) is typically a few microseconds or more which past research has shown to be problematic given that a timing precision of tens or hundreds of nanoseconds is required to reliably remove the continuum and gather accurate LIBS line emission data. 23 Given our interest in simple equipment, and following this past work, we therefore use a USP spectrometer with ungated detection in an approach where we measure and subtract reference spectra containing the continuum emission. Common approaches to mitigate the influence of continuum emission and/or matrix effects involve using intensity thresholds (relative to the baseline) to qualify individual spectral peaks. The thresholds can be adaptive based on background noise levels and peak intensities,18,24,25 or standard deviations of detector counts.26–28
Experimental
DRPS Overview
A direct-reading particle sizer (DRPS) for particles larger than 20 µm has been previously developed and validated in our laboratory.
12
The basic setup is shown in Fig. 1. In summary, particle counting and sizing is based on time-of-flight Mie scattering as free-falling particles transit between a pair of vertically separated 785 nm continuous-wave diode laser beams. Particle composition is determined with LIBS using a neodymium–doped yttrium aluminum garnet (Nd:YAG) laser pulse (Ultra CFR, Big Sky Laser Technologies Inc., US) directed at the particle location in the lower Mie counting beam. In more detail, the Mie scattering signal from the lower diode laser beam, as detected by a photodiode sampled by an oscilloscope (Techtronix TDS5034B), is used both for time-of-flight sizing (in tandem with the Mie signal from the upper beam) and to generate a temporal trigger for firing of the LIBS laser. Light emitted from the LIBS microplasma is collected with a compact spectrometer (Ocean Insight HR4000) for subsequent analysis. Schematic of the DRPS prototype (not to scale). (Left) A side view of the two vertically optical scattering stages. (Right) A top-down view of the lower detection stage highlighting components of the LIBS system.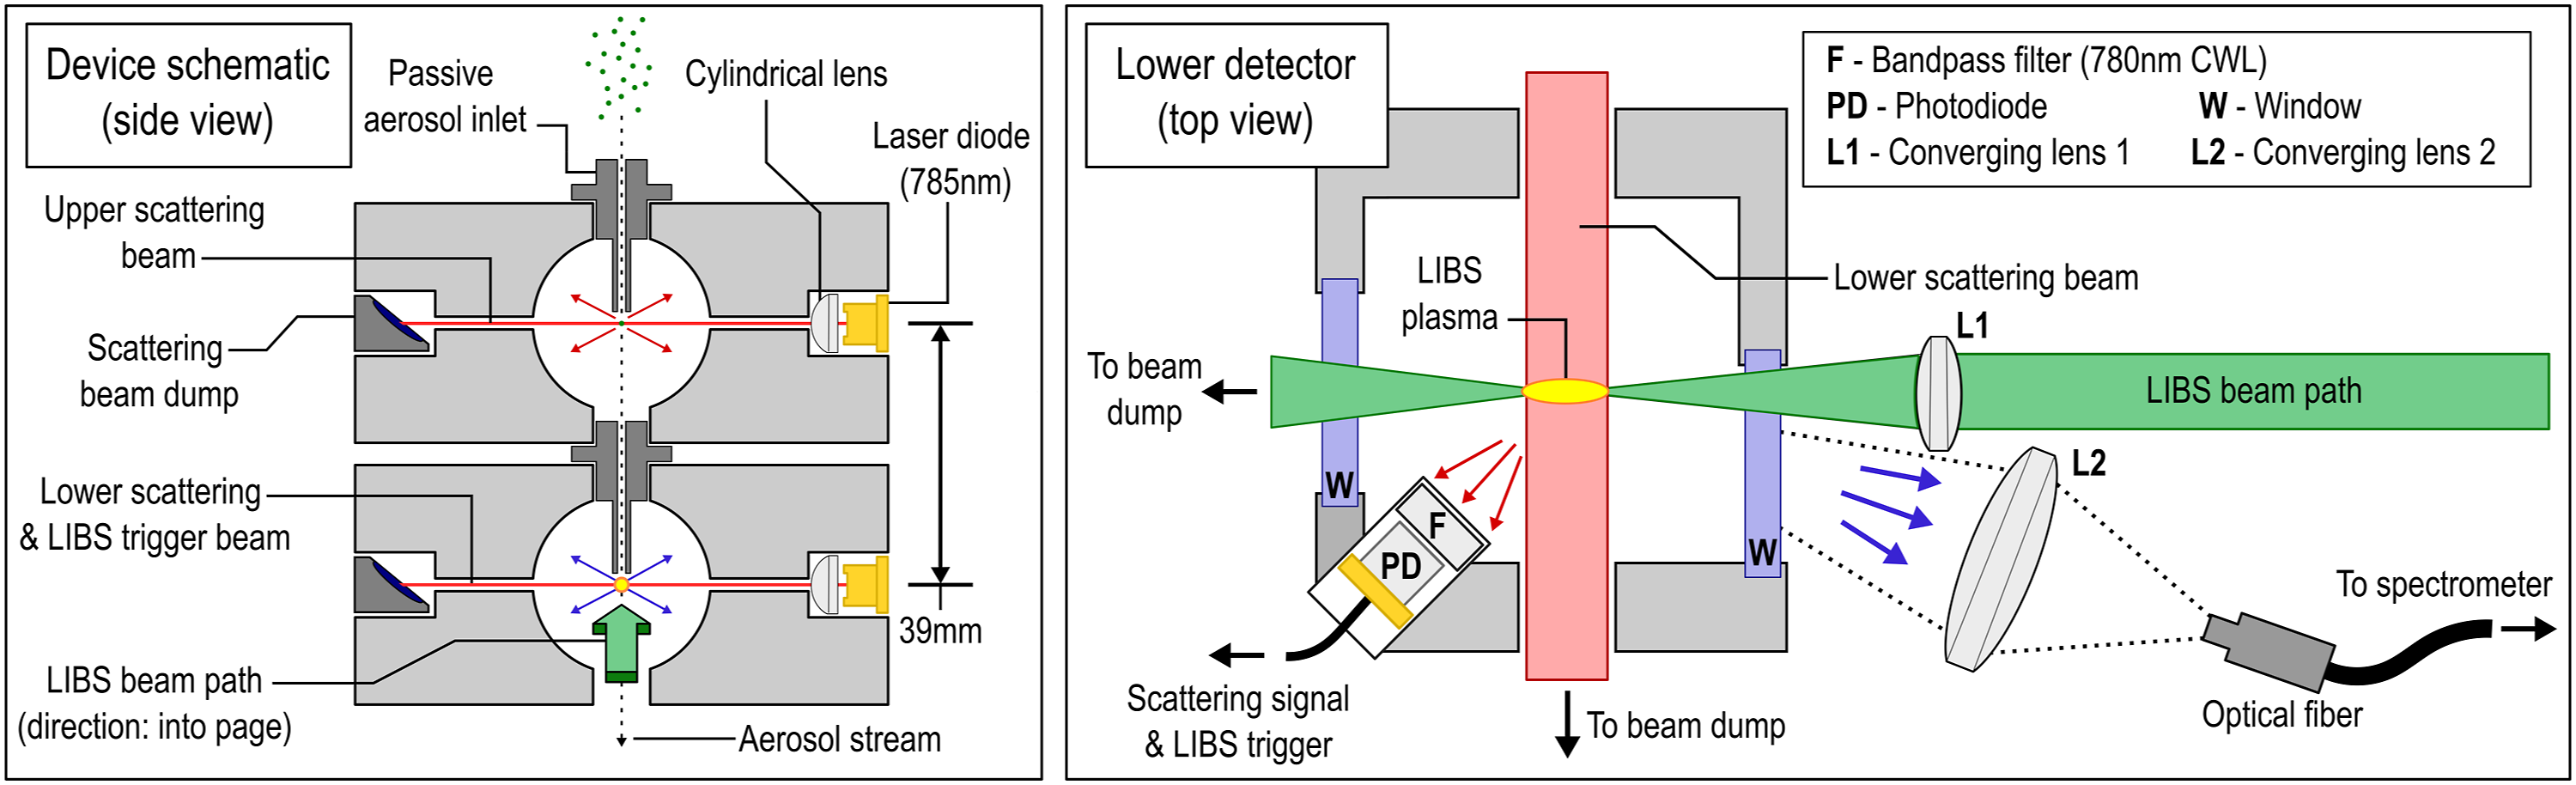
The LIBS pulses from the Nd:YAG laser have a wavelength of 1064 nm, time duration of ∼6 ns, and are focused to the measurement region with a positive lens of focal length 40 mm (LA4130-ML, Thorlabs Inc.). We operate with delivered laser pulse energy of 41+/−2 mJ (based on shot-to-shot variation) which is sufficient to achieve reliable plasma breakdown (∼100% of laser shots) in laboratory air. After each plasma pulse event, a holdoff period of 500 ms is imposed during which the LIBS laser does not fire. The holdoff period is to allow any flow disturbances caused by the laser spark shockwave to subside before subsequent probing. We estimate the laser plasma to be an ellipsoid approximately 2–3 mm long in the direction of the spark-forming laser and ∼200–700 µm in both orthogonal directions. This approximate estimate is based on measurements of plasma kernels reported in the literature.18,29,30 The focusing optics of the LIBS laser (and LIBS trigger timing) were aligned to maximize the spatiotemporal overlap between the microplasma and the path of the falling particles (as defined by the entry inlet of ∼1.5 mm diameter at top of apparatus). Given these dimensions, we estimate that the plasma covers approximately 45% of the projected area of the falling aerosol stream. If the trajectory of a falling particle does not intersect the microplasma, then it will not be ablated and the resulting spectrum (which is still recorded based on the Mie trigger) will contain only emission peaks from the room air. The dimension of the inlet orifice was chosen to provide a rough balance between LIBS hit rate and measured particle count rates.
Optical emission from the LIBS microplasma is collected by a lens (LA4306-ML, Thorlabs Inc., US) that is positioned at roughly 45° in the back-scatter direction and imaged with 1:2 magnification onto the bare end of a 1.5 mm core diameter optical fiber (M93L, Thorlabs Inc., US) that passes collected light to the spectrometer. The spectrometer records spectral data over a wavelength range of 250–1100 nm using a 25 µm wide entrance slit and a 3648-pixel charge-coupled device (CCD) detector. The spectral resolution of our system results in a measured peak full width at half-maximum (FWHM) of ∼2.3 nm for narrow mercury emission lines from a calibrated light source (CAL 2000, Ocean Insight, US). The resolution value is consistent with that found from a numeric estimate based on the spectrometer parameters such as grating groove density and detector pixel size. 31 A single spectrum is collected each time the Nd:YAG laser fires using the provided software (OceanView v2.0.8, Ocean Insight). An oscilloscope (TD5034B, Tektronix Inc., US) is used to generate a signal to trigger the LIBS laser pulse and simultaneously begin spectral acquisition. Each spectrometer integration period lasts 3 ms. Post-processing of raw spectra and emission peak detection is performed using Matlab (R2021a, The MathWorks Inc.) script, as described below.
Test Aerosol Selection and Dispersion
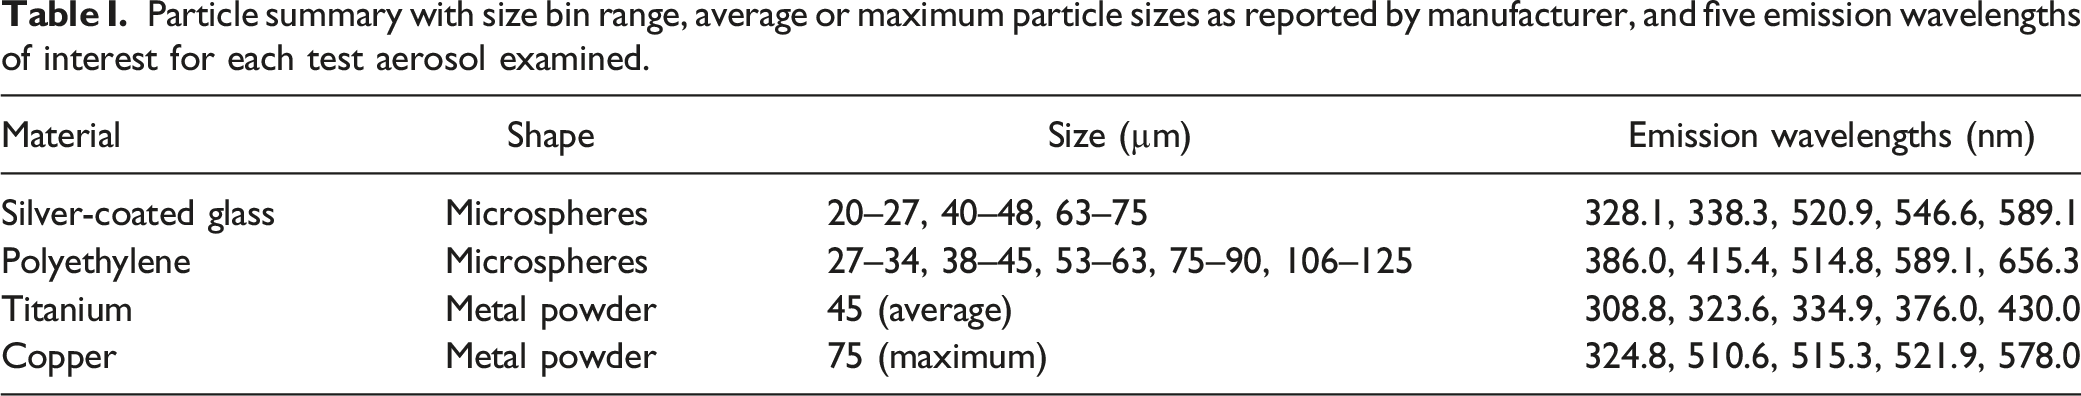
Particle summary with size bin range, average or maximum particle sizes as reported by manufacturer, and five emission wavelengths of interest for each test aerosol examined.
Test particles were dispersed in the laboratory by generating a small jet of air with a rubber squeeze bulb to eject a small quantity (<1 mg) of material through a copper pipe into the air. 12 The resultant aerosol then falls and enters into the top inlet of the DRPS, with each particle achieving its terminal settling velocity before reaching the inlet. Based on the test aerosols, we recorded 1380 experimental spectra (about evenly spread over the four material classes) for validation of the LIBS peak detection and automatic classification algorithm. Only one aerosol type was dispersed at once, therefore, a single test material was assumed to be present in the sampling environment at a given time. However, there is a remote possibility of residual particles from previous trials deposited within the dispersion hardware being resuspended and sampled. Owing to the plasma-particle spatial overlap issue mentioned above, the set of spectra contain a mix of spectra with particle emission lines (plasma hit the particle) along with spectra containing lines from only the air plasma (plasma missed the particle or ablated too small of a particle mass below the limit of detection). Additionally, 100 spectra were collected in the absence of test aerosols as a set of known air-only spectra for a final set of 1480 test spectra.
LIBS Analysis Methods
One of the main goals of the current work is to develop a classification algorithm to determine the elemental composition of the analyte (falling particle), including the possibility of identifying air-only spectra for cases where the laser plasma misses the particle, based on examination of individual test spectra. Here, we evaluate the algorithm’s efficacy by comparing the predicted species for a given test spectrum versus “truth” values determined from offline manual classification of the same spectra (see Supplemental Material). The classification algorithm (as applied to a test spectrum) follows a series of steps, the first of which is a background subtraction to remove contributions from the continuum and air emission lines. This is followed by a second step which uses a threshold approach to look for the presence of analyte lines in targeted regions. Based on the spectral line identifications, a logic is used to classify analyte materials and assign material scores (details below).
Because the laser beam is incident on particles within ambient air, even in cases where the laser hits the particles, there will inevitably be microplasma formation in air surrounding the particle. The resulting plasmas will therefore always include spectral contributions from air species, such as dissociated and ionized nitrogen and oxygen, which can potentially overlap and interfere with emission lines of the particle species. To mitigate the effect of air species on the particle spectra, we perform a scaling and subtraction step based on an air reference spectrum. The air reference is derived from 100 air plasma spectra recorded at the regular LIBS operating conditions but with no large particles present. The 100 spectra are nominally similar but have some variation in spectral intensities resulting from small shot-to-shot variations in LIBS laser energy and the stochastic nature of plasma breakdown. From these spectra, we determine a final mean air reference spectrum and standard-deviation air spectrum. For each test spectrum, we subtract the mean air spectrum after finding a multiplicative constant for amplitude of the mean air spectrum that brings the test and air spectra to best possible least-squares agreement over wavelength regions selected to be free from strong particle lines. Examples of a raw test spectrum, scaled air spectrum, and the final post-subtraction spectrum are shown in Fig. 2. The final spectrum exhibits strong emission features associated with the ablated particle species, which was silver-coated glass in the example presented in Fig. 2. Example of a raw experimental LIBS spectrum containing emission from air and a silver-coated glass particle, the air spectrum scaled to match this signal, and resulting signal after subtraction of the air spectrum. Wavelengths of interest for all four test materials are indicated by vertical dashed lines.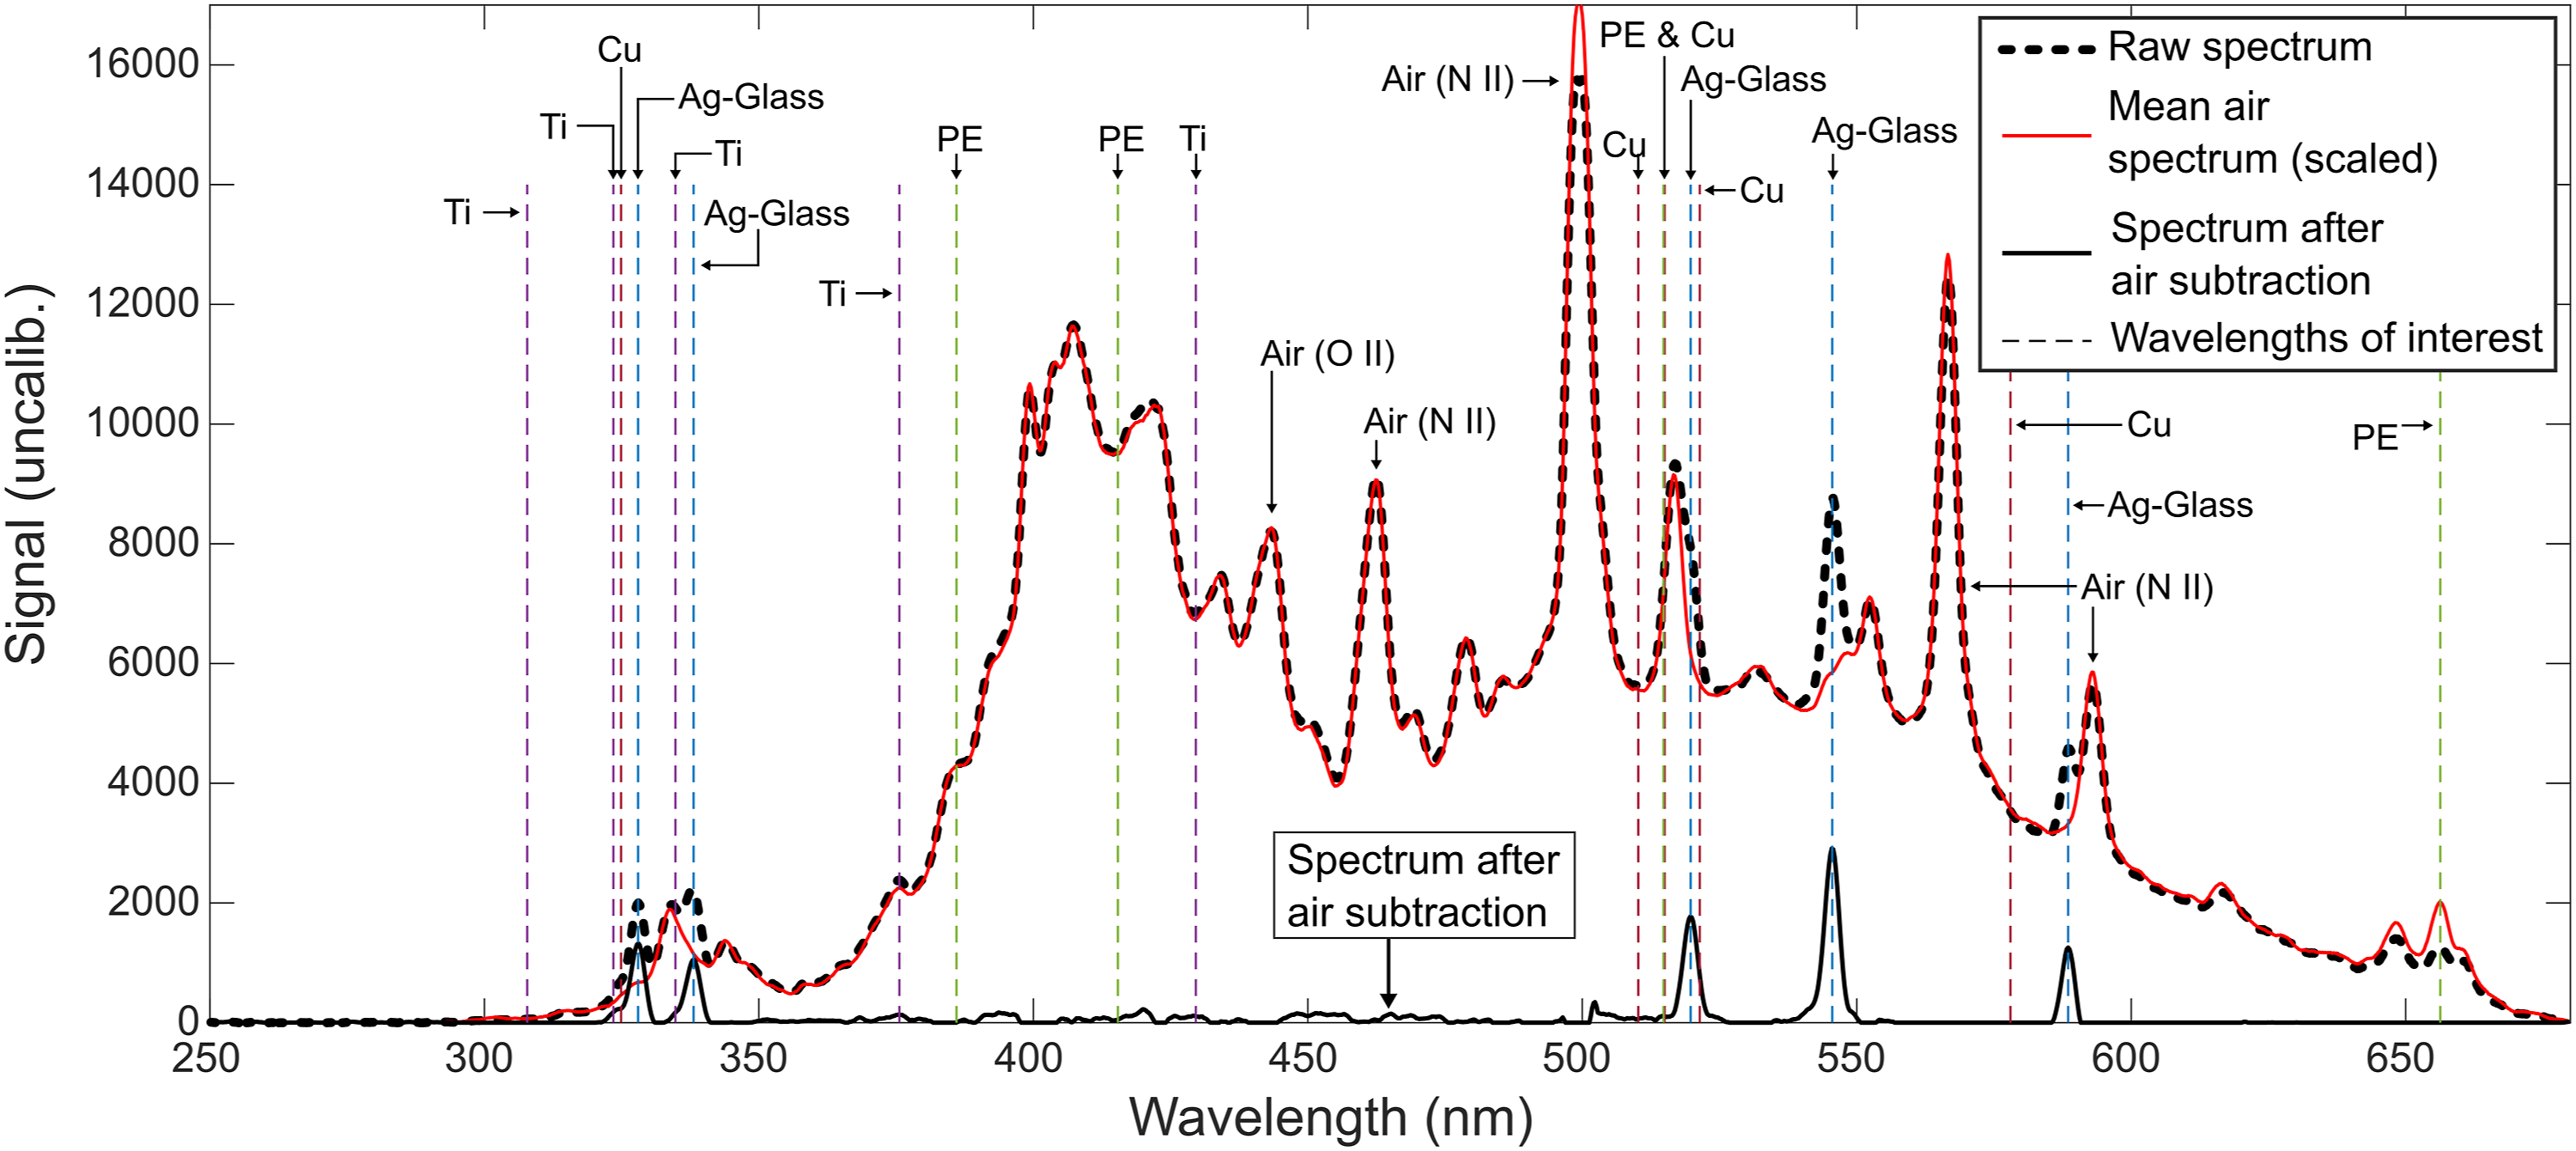
After the air subtraction, the algorithm looks for the presence of analyte lines from candidate species. For each of the four test materials, the five strongest emission peaks were identified for a total of 20 wavelength values of interest (see Table I). The target wavelengths for copper and titanium were based on the five strongest peaks within the detection range based on a National Institute of Standards and Technology (NIST) spectral database.32,33 The five strongest emission peaks were determined experimentally for each of the other two test aerosols, which are comprised of multiple materials in an unknown ratio. Although air features may overlap with the lines of interest, the air plasma subtraction procedure typically eliminates this problem (see the 520.4 nm Ag(I) line with interference from N(II) line at 518 nm in Fig. 2). A challenge for spectral line identification is that, owing to variations in plasma formation and in spatial overlap of particle and plasma, the air subtraction step can lead to small anomalous peaks associated with artifacts of the subtraction, that is, not due to real spectral features, in the final spectrum. One of the functions of peak thresholding in the classifier algorithm is to avoid erroneous detection due to these residual noise features. Details of the windowing and thresholding are as follows. At each candidate line location, a series of nine data points centered on the wavelength of interest is extracted from the LIBS spectrum to create a detection window ∼2 nm wide. If a sufficiently strong peak exists within this window, a single positive peak identification for the corresponding material is recorded. The condition for strength is based on the peak spectral intensity within the window (of the post-subtraction spectrum) exceeding a pre-determined value, which we refer to as the absolute intensity threshold (AIT). The AIT depends on wavelength and is determined based on different multiples of the standard-deviation air reference spectrum (e.g., AIT = 0.5σ, where σ is the standard-deviation air reference spectrum). A positive detection from one such candidate line counts as +1 towards the signal’s material score (which can range from 0–5 for each candidate material). An additional prominence threshold (PT) is also applied to each peak to ensure that the intensity of the peak is sufficiently high, relative to the neighboring values. Further information about the peak prominence calculation and process used to optimize the prominence threshold can be found in the Supplemental Material.
For each test spectrum, a material score (M) is assigned for each class based on the number of positively identified peaks associated with the class. Final assignment logic can be adjusted depending on the application but for initial work the classifier assumes each test particle belongs to only one class based on the maximum material score and with a requirement of a minimum usable material score of two. If the maximum material score is not met, the signal is considered as an air spectrum. For example, the experimental spectrum in Fig. 3 contains five peaks identified as titanium. The strong peak located at ∼324 nm was recorded toward the material score for copper as well, due to overlap of detection windows. Material scores for the example spectrum are MTi = 5 and MCu = 1, resulting in a correct classification of titanium. The current implementation of the algorithm requires the classifier to select a single class for each signal. In the rare cases (<5%) in which the resulting material scores for multiple classes are equal, the class with the highest peak intensity is selected. The classifier identification is currently performed in post-processing but could be implemented into real-time data analysis in the future. Performance of the material score sorting approach is further examined below. Example LIBS spectrum containing emission from a titanium particle after air subtraction. The gray shaded region indicates an AIT value of 0.5σ that must be exceeded for a positive peak detection. Detected peaks and their corresponding material class are identified with triangular markers.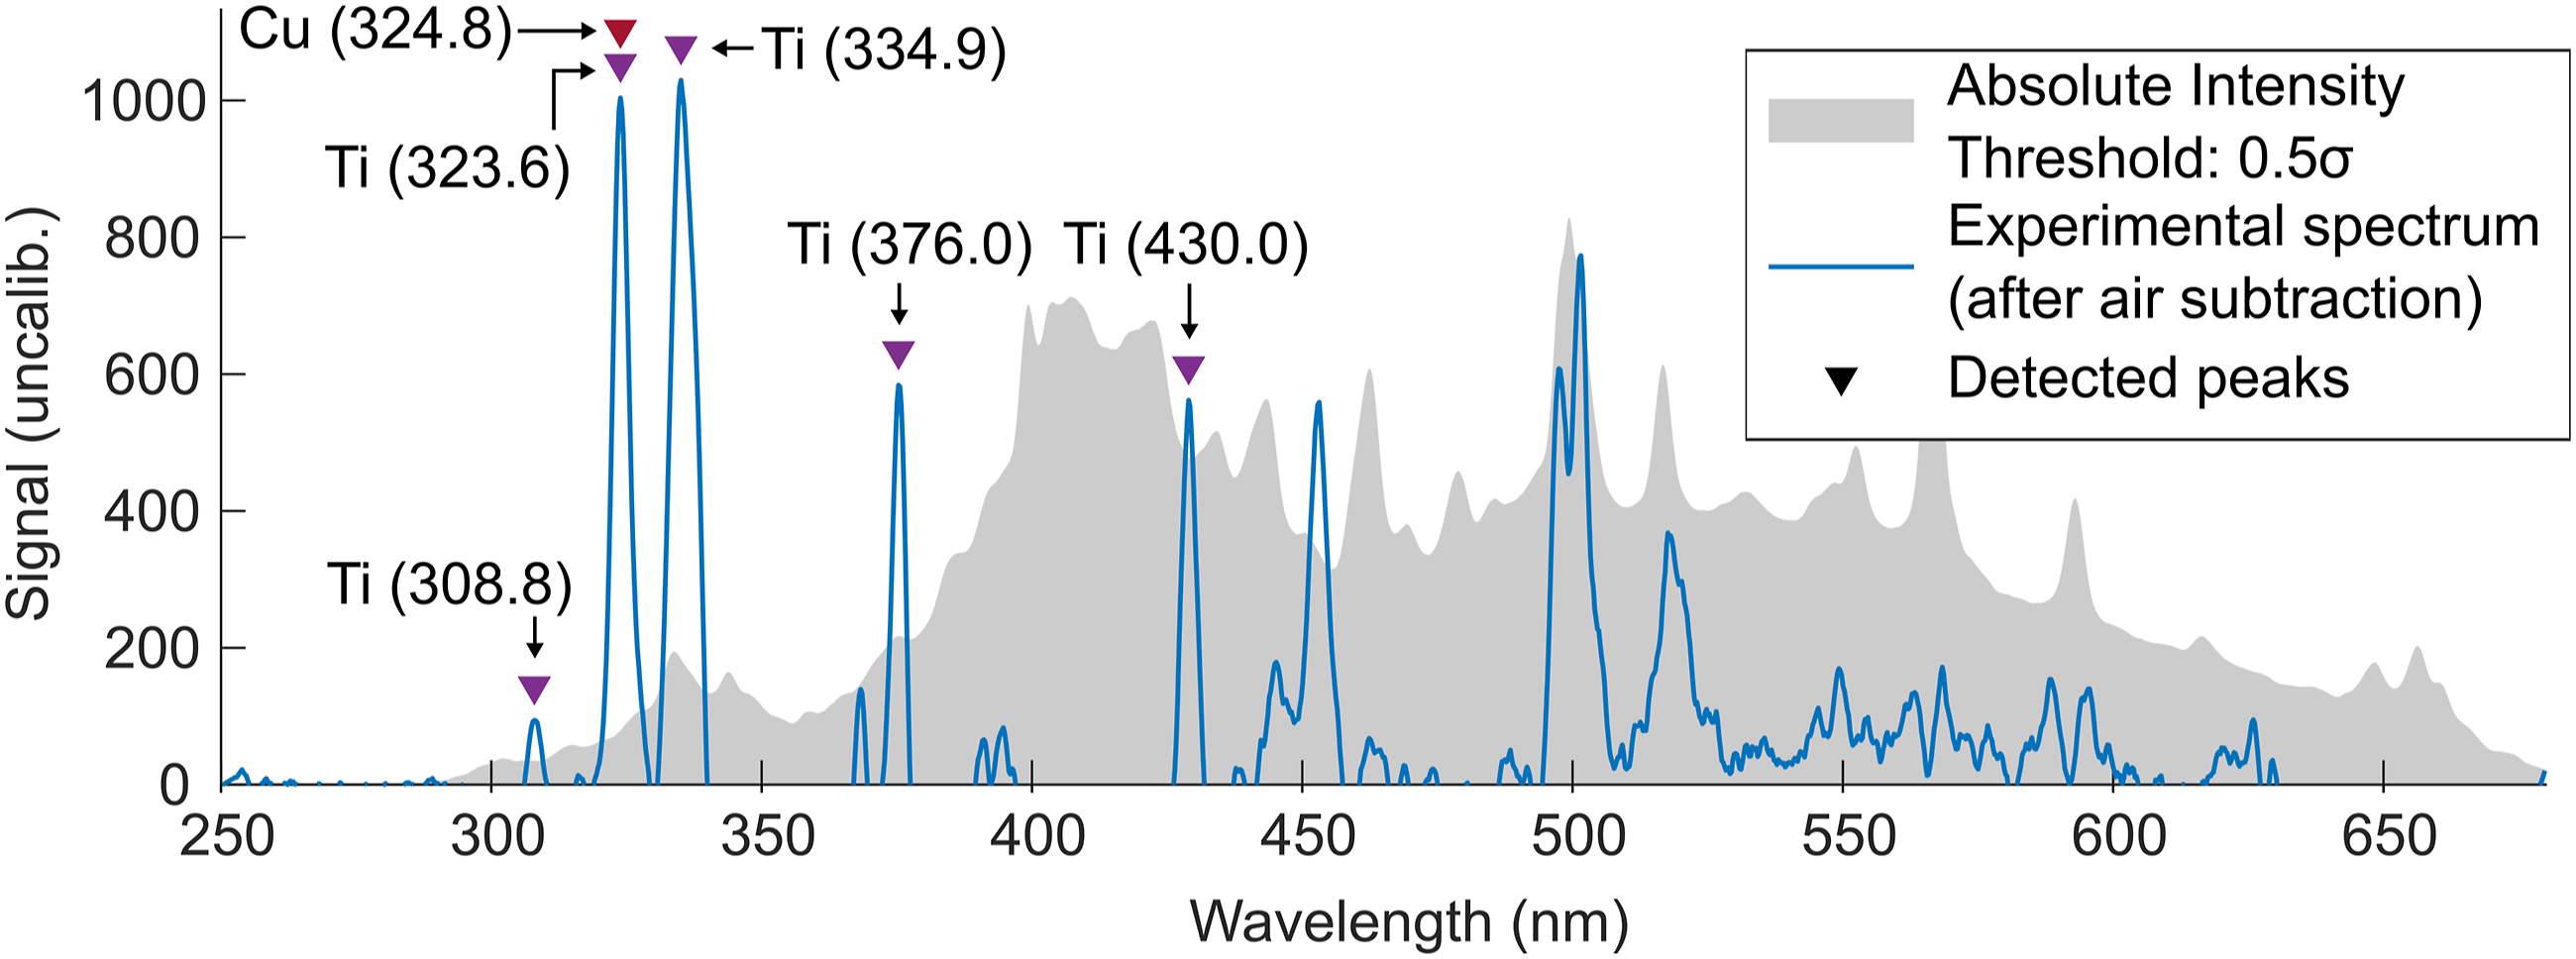
Results and Discussion
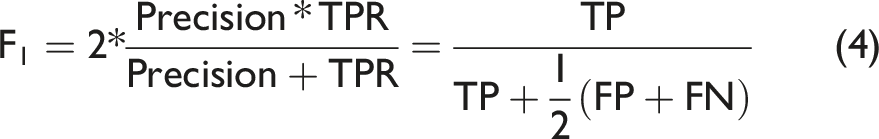
To examine the performance of our classifier algorithm, we compare the predictions of material class against the manual (truth) classifications for the set of 1480 test spectra. The algorithmic approach can be treated as a multiclass problem based on assigning test spectra to respective classes corresponding to material, including air-only. The class counts obtained by the algorithm and by manual classification are used to calculate quality metrics of true positive rate (TPR), precision, and false positive rate (FPR):
Building on the above, another useful performance metric is the F1 score which provides a measure of the overall agreement between truth and algorithmic classifications, with equal weighting given to both precision and TPR:
35
Higher values of F1 indicate better performance (with a range from 0 to 1).
An additional performance metric, which also accounts for the instrument flow configuration and plasma overlap, is provided by the LIBS efficiency (ηLIBS) defined as the fraction of particles entering the DRPS (through the 1.5 mm inlet) that are correctly identified by LIBS: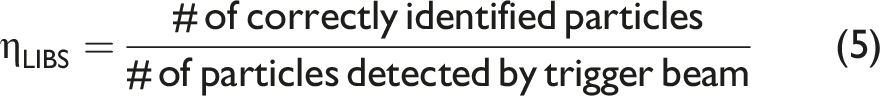
The classification algorithm was applied to the test dataset using different values of the intensity threshold (AIT) ranging from 0 to 1σ. Figure 4 shows plots of TPR, FPR, Precision, and the F1 score for one-versus-all analyses based on each material class (and their macro-averaged values) versus AIT. Each of these parameters can range from 0 to 1, with high values indicating better performance, except in the case of FPR where low values are preferred. With regards to TPR (for non-air materials), the general trend is simply that increasing the AIT much above zero causes the TPR rate to start to fall; this can be interpreted that, as thresholds get larger, it is increasingly likely for the algorithm to miss weak spectral emissions. However, there can be a penalty for too low of a threshold, in that the algorithm can mistakenly consider noise (or subtraction artifacts) as actual material peaks, that is, there will be false positive. For this reason, we see that if the AIT is very low (<∼ 0.15σ), we have a decrease in precision and an increase in FPR. F1 score, precision, TPR, and FPR for each test particle class, macro average of the four classes (dashed line), and air-only spectra over 0 ≤ AIT ≤1.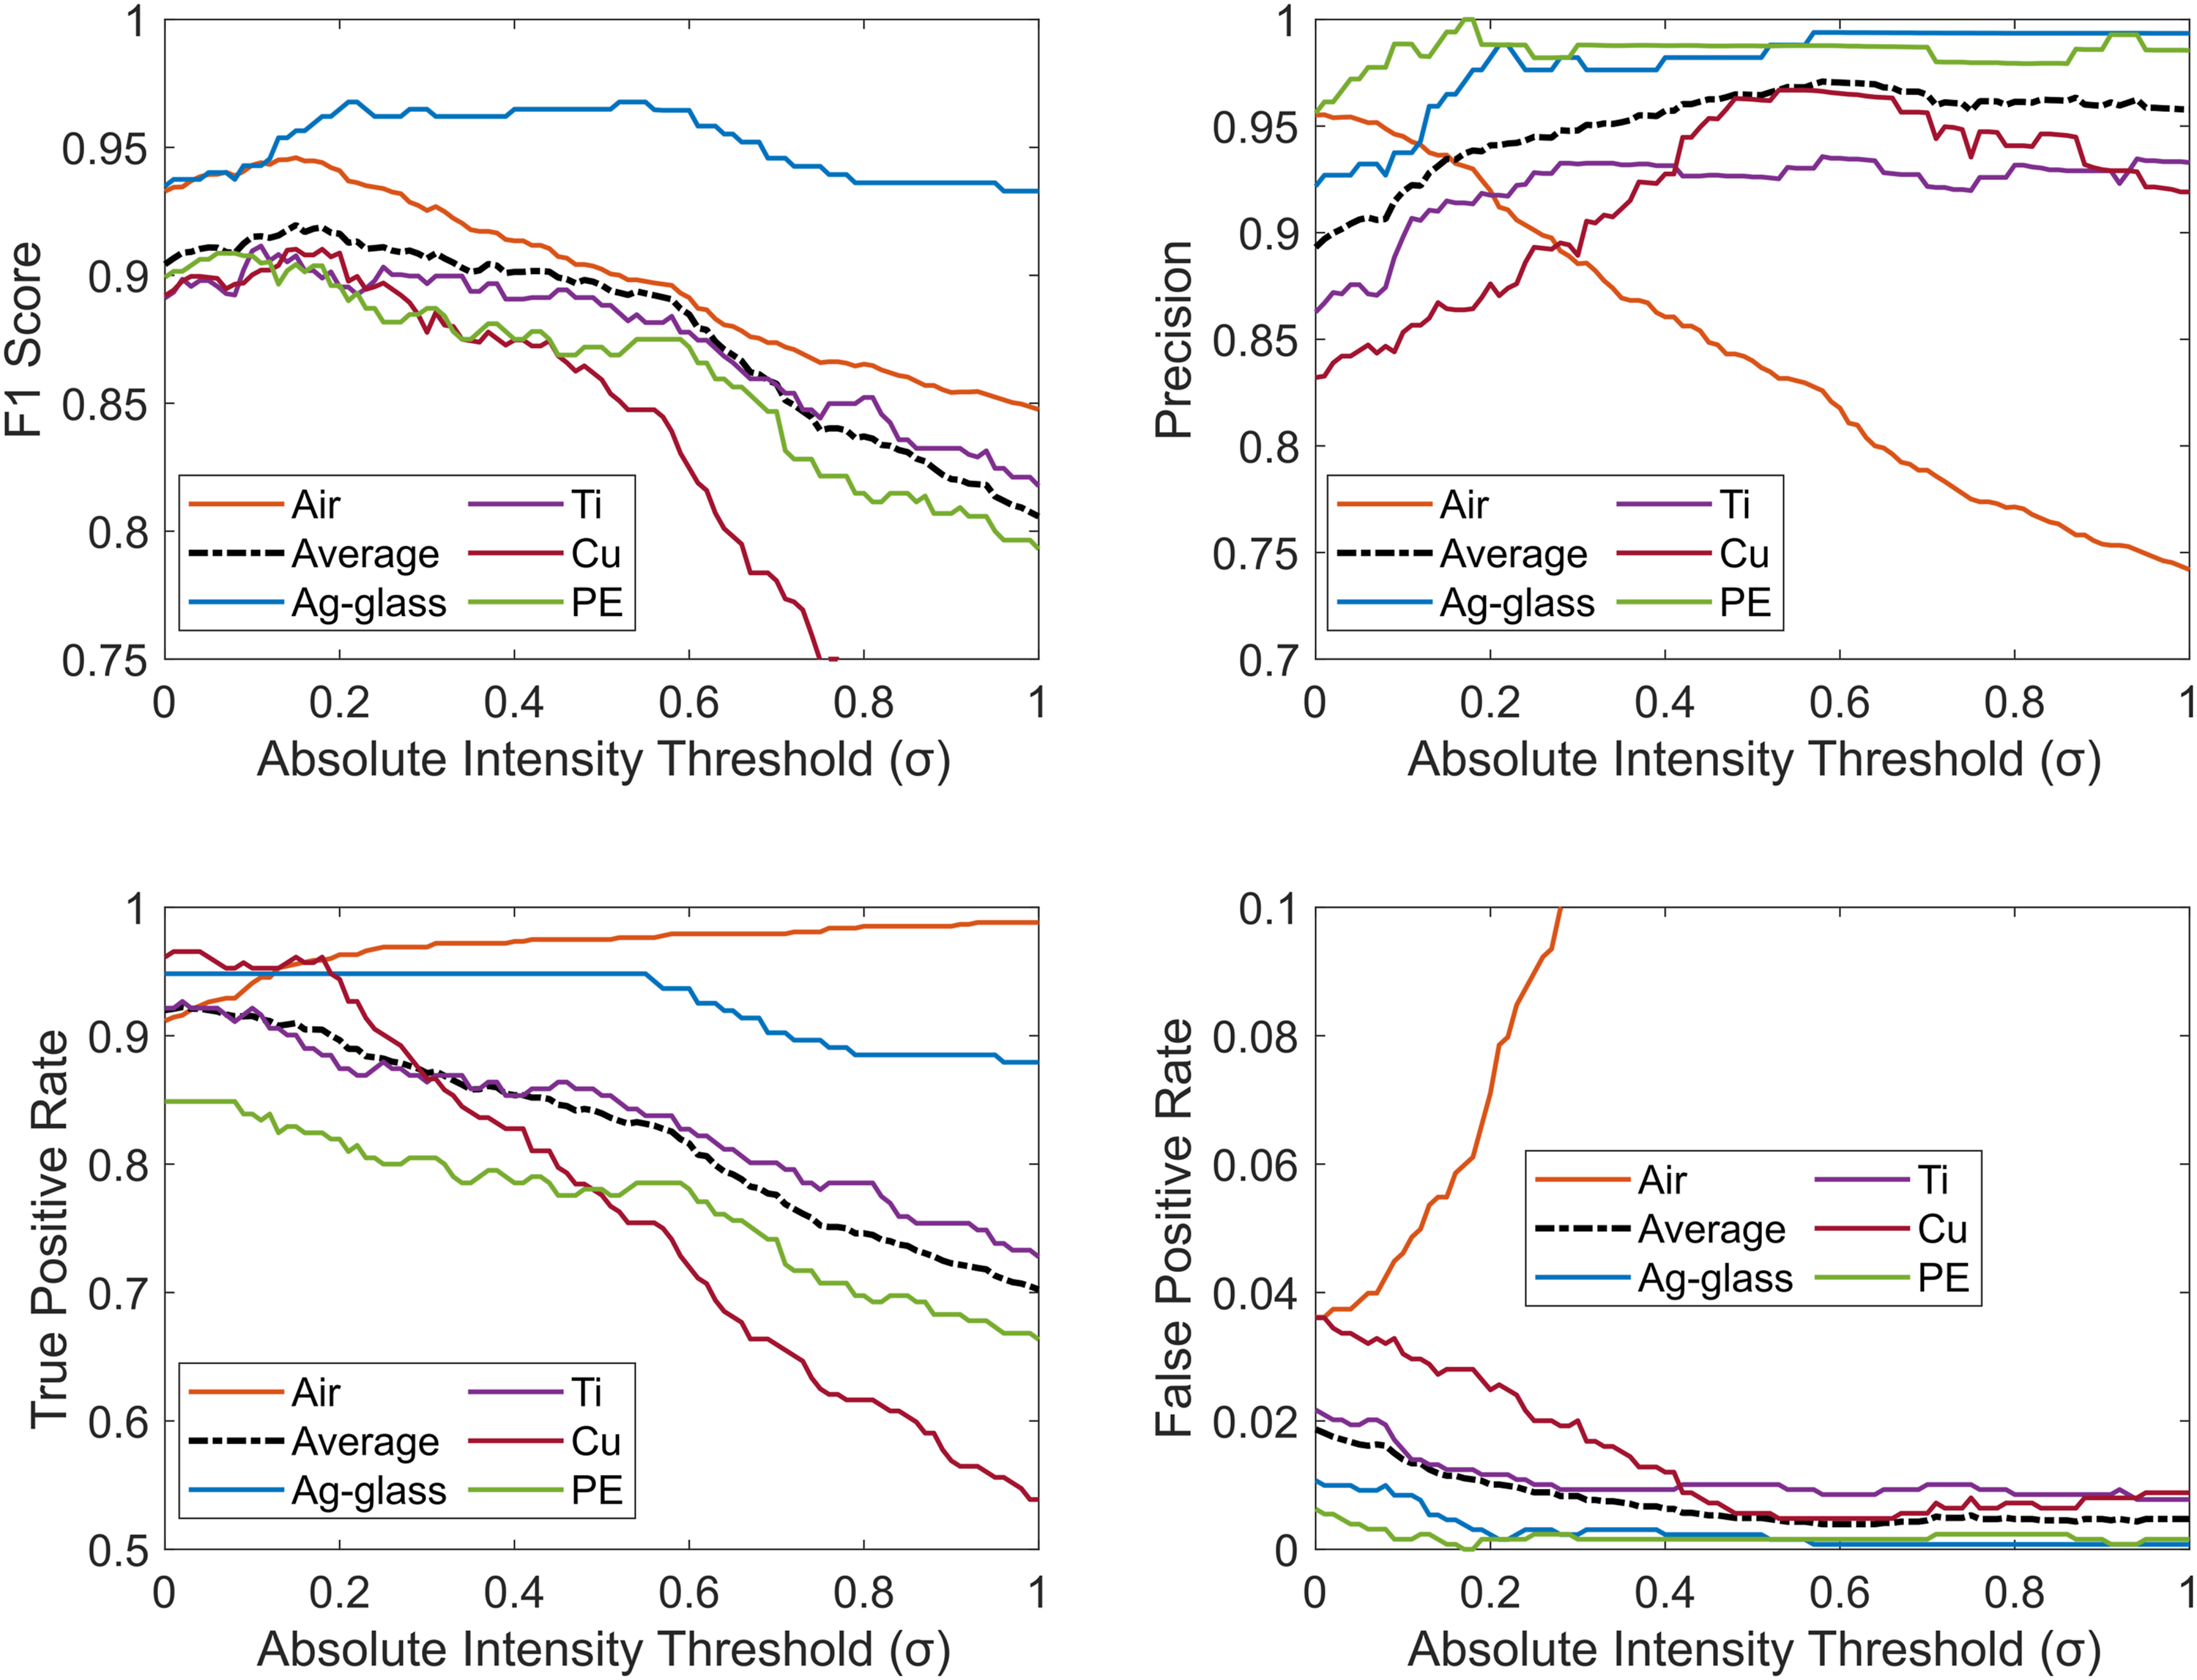
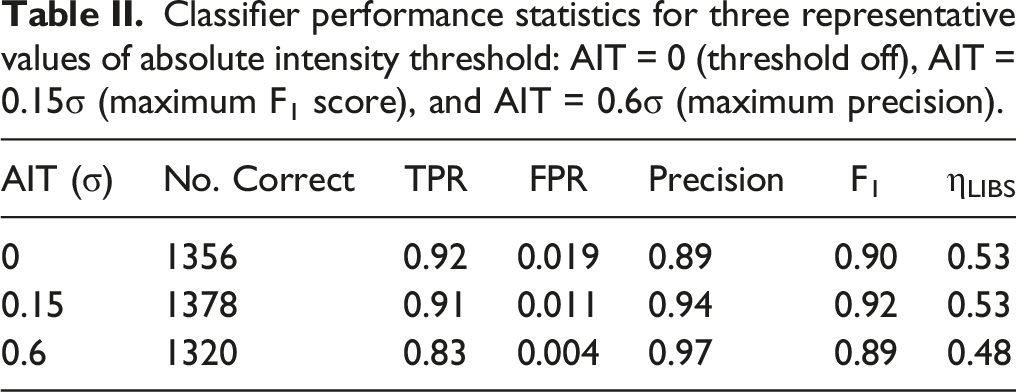
Classifier performance statistics for three representative values of absolute intensity threshold: AIT = 0 (threshold off), AIT = 0.15σ (maximum F1 score), and AIT = 0.6σ (maximum precision).
Conclusion
The LIBS spectral analysis method has been integrated with a prototype DRPS as a step toward simultaneous real time counting/sizing and elemental composition of large inhalable particles. We have developed an automated analysis method able to correctly classify a large majority of test spectra from four particle types. The method includes subtracting contributions (matrix effects) from the air plasma emission contribution and using a thresholding approach to identify features against a prepopulated spectral database. The effect of the intensity threshold on classifier performance metrics including F1 score, and precision was examined and revealed potential operating points.
While the results of the present work are already quite promising for practical use, various modifications to increase performance can be considered in future work. The LIBS efficiency is driven by two major factors—the probability of the plasma successfully ablating a particle (aerosol hit rate) and the classification accuracy of the peak detection algorithm. An increased aerosol hit rate may be achieved through alternative beam-focusing optics or adjustment of the plasma/inlet geometry. The accuracy of the classifier can be improved by algorithmic changes (e.g., details of the air plasma subtraction step) or hardware changes in relation to spectral acquisition. The relatively simple, low-cost USB spectrometer system used in this work has limitations including trigger-to-acquisition timing jitter and a coarse spectral resolution that would not be present with a high fidelity, time-gated spectrometer. However, the experimental results demonstrate adequate material identification using the present system by suppression of continuum and air plasma emission via signal post-processing. Additionally, many machine learning approaches including principal component analysis, support vector regression, and artificial neural networks 36 have also been demonstrated for LIBS data processing for identification of materials with similar elemental composition (e.g., polymers 37 and soils 38 ) and can be examined in future work to extend the capabilities of the DRPS.
Supplemental Material
Supplemental Material - In-Situ Elemental Composition Analysis of Large Inhalable Aerosol Using Laser Induced Breakdown Spectroscopy
Supplemental Material for In-Situ Elemental Composition Analysis of Large Inhalable Aerosol Using Laser Induced Breakdown Spectroscopy by James Sipich, Christian L’Orange, John Volckens, and Azer Yalin in Applied Spectroscopy
Footnotes
Acknowledgments
The authors acknowledge Particles Plus Inc. for support with sampling hardware.
Declaration of Conflicting Interests
The author(s) declared no potential conflicts of interest with respect to the research, authorship, and/or publication of this article.
Funding
The author(s) disclosed receipt of the following financial support for the research, authorship, and/or publication of this article: This work was funded by the National Institute for Occupational Safety and Health (NIOSH) under Grant 1 R21OH011287-00.
Supplemental Material
All supplemental material mentioned in the text is available in the online version of the journal.
References
Supplementary Material
Please find the following supplemental material available below.
For Open Access articles published under a Creative Commons License, all supplemental material carries the same license as the article it is associated with.
For non-Open Access articles published, all supplemental material carries a non-exclusive license, and permission requests for re-use of supplemental material or any part of supplemental material shall be sent directly to the copyright owner as specified in the copyright notice associated with the article.