
Abstract
Attenuated total reflection Fourier transform infrared (ATR FT-IR) spectroscopy is a powerful instrumental method of chemical analysis of solids and liquids. The majority of published studies by in situ ATR FT-IR spectroscopy describe analysis of homogeneous samples, such as liquid solutions under circulation, or films on the ATR crystal that react with the gas of interest. The in situ ATR FT-IR spectroscopic studies of specimens in physical shape of crystals or powder that react with a gas or vapor are rare. This work describes a modification of in situ time-dependent ATR FT-IR spectroscopy to allow monitoring heterogeneous reaction “solid-gas” of powder in controlled atmosphere and in the time domain. Also, we describe a new facile gas flow chamber attachment to ATR FT-IR spectrometer which allows creating controlled atmosphere surrounding the specimen on the ATR crystal. Additionally, the capabilities of the described in situ time-dependent ATR FT-IR spectroscopy experiment in controlled atmosphere are enhanced by the sensor for in situ time-dependent monitoring the relative humidity (RH) of air surrounding the specimen. The operation of the setup for in situ time-dependent ATR FT-IR spectroscopy in controlled atmosphere is demonstrated by monitoring reaction of gradual desorption of water vapor from color-indicating molecular sieves under controlled low air humidity. Further, the described spectroscopic method and apparatus is applied to monitor the reverse process, namely sorption of water vapor by color-indicating molecular sieves under controlled elevated air humidity. Water molecules are found to reversibly interact with two distinct sorption sites in the sorbent: the Si–O backbone and the color-indicating Co(II) centers. The reported variant of in situ time-dependent ATR FT-IR spectroscopy in controlled atmosphere is powerful, yet facile and straightforward. It is promising for mechanistic, in situ studies of sorption, desorption, chemosensing, heterogeneous catalysis and photocatalysis, and analysis of chemical kinetics of various “solid-gas” reactions.
Keywords
Introduction
Fourier transform infrared (FT-IR) spectroscopy is a well-established method to learn about chemical composition and reactions of various materials. Studies of solids and their reactions with gases or vapors are of particular importance, since these reactions are commonly utilized in sorption, separations, heterogeneous catalysis, photocatalysis, chemosensing, environmental monitoring, and beyond. The FT-IR spectrometer allows collection and analysis of infrared spectra in transmission mode when the IR light passes through the specimen at a 90° angle. Usually, one distinguishes between ex situ FT-IR spectroscopic characterization of specimens, and studies of their chemical reactions. The in situ experiment is commonly defined as the one where the instrumental (spectroscopic in this case) analysis of the reacting compound is conducted directly in the reactor and during the reaction. In contemporary research of sorption and heterogeneous (photo)catalysis, of particular interest are FT-IR spectroscopy experiments conducted using in situ modality.
Attenuated total reflection Fourier transform infrared (ATR FT-IR) spectroscopy is a facile, yet powerful method of instrumental analysis. In an ATR FT-IR experiment, an ATR accessory is added to infrared spectrometer, so that the evanescent field of the IR beam comes in direct contact with specimen on the ATR crystal. One common advantage of ATR FT-IR versus transmission FT-IR spectroscopy is that pure and intact specimen (and its reactions) can be studied, since no “matrix” material such as potassium bromide (KBr) is needed. Another advantage of ATR FT-IR setup is availability of several types of internal reflection elements (IRE); the IRE is a crystal with high refractive index and excellent IR transmitting properties. Depending on application, one can select an IRE (or, the ATR crystal) with desired performance. For example, the ATR crystal made of germanium offers small IR radiation penetration depth, which is advantageous in studies of, for example, supported thin films. On the other hand, diamond offers high inertness and hardness, in addition to wide spectral range. Indeed, ATR FT-IR spectroscopy finds applications in studies of thin films, 1 optoelectronic devices, 2 in pharmaceutical research, 3 electrochemical oxidation 4 and reduction, 5 and sorption on porous materials.6,7 ATR FT-IR spectroscopy can also be used for quantitative analysis. 8 Schuttlefield et al. 9 reported the combination of the ATR FT-IR spectroscopy and quartz crystal microbalance (QCM) technique, to quantitatively investigate water vapor uptake by the atmospherically relevant particles of sodium chloride (NaCl), ammonium nitrate (NH4NO3), ammonium sulfate ((NH4)2SO4), calcium nitrate (Ca(NO3)2), and silicon dioxide (SiO2). Most of these are water-soluble salts, and this approach allows quantification of the amount of water adsorbed or dissolved by the particles at the given relative humidity.
Furthermore, when a specimen on the ATR crystal is exposed to a gas of interest and the IR spectra of specimen are recorded as function of time, the experiment is termed in situ time-dependent ATR FT-IR spectroscopy. Recently, we reported in situ time-dependent ATR FT-IR spectroscopy6,7 for studies of sorption and desorption of water on highly porous coordination polymers in air at ambient humidity. The term “controlled gaseous environment”, for example, 10 can mean using a mixture of gases different from those common in ambient air, for example, inert gases. Studies of reactions in controlled atmosphere find extensive use in fabrication of electronic devices (in cleanrooms at controlled humidity 11 ), usage of electronics and nano-electronics, for example, photovoltaic devices, 12 solid-state chemistry and physics, 13 instrumental methods of chemical analysis, 14 environmental research, 15 life sciences, 10 the food industry, 16 and work with hazardous materials. 17
For work with inert gases or air (e.g., of varied oxygen concentration), it is possible to place the FT-IR spectrometer in a glove box. 18 An appealing approach would be to use a removable reaction flow chamber added to an ATR FT-IR spectrometer. However, to our knowledge, there are no commercially available ATR accessories for FT-IR spectrometers, which would allow in situ and time-dependent collection of IR spectra during “solid-gas” reactions in controlled atmosphere where the “solid” is a powder or crystal.
There are reports of using in situ ATR FT-IR spectroscopy and imaging for studies of chemical reactions. This became possible due to custom-built in situ spectroscopic reactors, and work in this field stems from paper by Kazarian et al. 19 The cell in Kazarian et al. 19 was designed for studies of supercritical fluids and polymers at high pressure (extraction, impregnation, partitioning). Vincent et al. 20 reported diffusion of D2O in CO2-swollen poly(methyl methacrylate) films, and Flichy et al. 21 investigated reaction of poly(dimethylsiloxane) with high-pressure CO2. Flichy et al. 21 presents a flow-through cell suited for studies of polymers in the form of films prepared on ATR FT-IR crystal. Other groups used high pressure in situ ATR FT-IR flow-through cell, see, for example, Novitskiy et al. 22 for monitoring phase transitions in multicomponent fluids at high temperature. Also, there are many papers on in situ ATR FT-IR studies of CO2 sorption, for example, Wilfong et al. 1 on tetraethylenepentamine films, Hasell et al. 23 on porous organic cages, and Woodward et al. 24 on polymer sponges for chemoselective CO2 capture. There are reports on ATR FT-IR spectroscopic imaging using microscope, for example, for polymers. 25 The FT-IR spectroscopic imaging in transmission mode 26 uses different measurement principle and optical geometry.
The majority of reports on in situ ATR FT-IR spectroscopy and imaging describe films of polymers on ATR crystal. On the other hand, in situ ATR FT-IR studies of specimens in physical shape of crystals or powder are very rare. Silverwood et al. 27 reported an in situ ATR FT-IR study of sorption of gaseous CO2 and H2 on nanoparticles 3–4 nm in diameter. Likewise, there are limited in situ ATR FT-IR spectroscopic studies of reactions of solids with water vapor. Jervis et al. 28 combined a commercial vapor generator instrument (VGI) with transmission FT-IR accessory. The first limitation is that VGI only allows work with vapor of water, and the second one is using constant humidity (equilibrium), for example, for sorption isotherms, 28 but not in time domain (kinetics or reaction dynamics). Recently, we described ATR FT-IR spectroscopy in the in situ and time-dependent regimes 6 to investigate dynamics and mechanism of bonding water vapor in air to a highly hygroscopic porous material, metal-organic framework MIL-160(Al). The experiment was conducted in ambient air at relative humidity (RH) set by room dehumidifier. 6 We also reported an in situ time-dependent ATR FT-IR spectroscopic study of an opposite process, a stage-wise desorption of water vapor from a super-hydrophilic metal–organic framework with porphyrin linker 7 to ambient air, after the sorbent was pre-saturated with water vapor.
Zeolites and molecular sieves are major sorbents 29 widely used for separation of various small molecules, including air separation 30 and sorption of water vapor. Structure and composition of molecular sieves can be tuned toward better selectivity and/or higher capacity of sorption. FT-IR and ATR FT-IR spectroscopy are major methods of characterization of molecular sieves, and studies of mechanism of their interaction with adsorbates 31 including water.
Herein, we report the following. First, we describe a method of in situ time-dependent ATR FT-IR spectroscopy of powdered specimen in controlled atmosphere, conducted using simple gas flow chamber attachment to the infrared spectrometer. Second, the capabilities of in situ time-dependent ATR FT-IR spectroscopy in controlled atmosphere are further enhanced by in situ recording the relative humidity (RH) and temperature of air reacting with the specimen. Third, operation of in situ time-dependent ATR FT-IR spectroscopy in controlled atmosphere is demonstrated by monitoring gradual desorption of water vapor from color-indicating molecular sieves, under the controlled low RH of air. Fourth, in situ time-dependent ATR FT-IR spectroscopy in controlled atmosphere is tested by monitoring the reverse process, sorption of water vapor by color-indicating molecular sieves under controlled high air humidity.
Materials and Methods
Chemicals
Color-indicating 4A molecular sieves (denoted herein as ColMolSiev) were from Alfa Aesar/Thermo Fisher Scientific.
Instrumental Characterization of Specimen
The FT-IR spectra were taken using Nicolet IS10 spectrometer in ATR FT-IR mode. Scheme S1 (Supplemental Material) shows generic schematics (not to scale) of the ATR accessory. The spectrometer in this work was equipped with Golden Gate ATR accessory (from SPECAC, part no. GS10500) with diamond crystal. In OMNIC data acquisition software of the FT-IR spectrometer, the resolution was set at 4 cm−1, optical aperture at the “open” parameter, and each spectrum was averaged over 512 scans (12.7 min.). To avoid adverse effect of water vapor in ambient air on IR spectra, the FT-IR spectrometer was continuously purged with an IR purge gas (dried air) at the rate of 0.8495 m3/h (30 ft3/h), which was measured by the flow meter (model Dwyer RMA-7). The dried air was produced by the FT-IR purge gas generator (Whatman Parker Balston, model 75-45). Namely, the inlet of purge gas generator was set at pressure of 60 psi (pound per square inch) and connected to the output of a single-stage portable electric hot dog air compressor (model Kobalt Quiet Tech two-gallon single-stage).
This setup allows creating dried air of spectroscopic quality: the remaining trace water content, per specifications of purge gas generator, is equivalent to a −73 °C (−100 ℉) dewpoint. This corresponds to relative humidity of the obtained dried air at <1% RH. The same purge gas generator also removes carbon dioxide CO2 to a concentration of less than 1 part per million (ppm), per specifications. To continuously monitor the quality of FT-IR spectra and remove artifacts due to water vapor, the OMNIC data acquisition software had the “atmospheric correction” parameter enabled. The “spectral quality results” parameter was set at “H2O level” ≥95% and spectra were plotted in absorbance mode.
Powder X-ray diffraction (XRD) patterns were collected by diffractometer model Rigaku MiniFlex using a Cu K-alpha line at 0.15406 nm with the 2θ increments of 0.02°.
Gas Flow Chamber Attachment
The body of the flow chamber has three walls (the left side, the right side, and the rear side), the specimen entrance door (the front side), Scheme S2 (Supplemental Material), and a “roof” but no “bottom”. Drawing in Scheme S2 was made using SketchUp Pro 2022 program. The walls, for example, (1), (3) the roof, and (2) the door in Scheme S2, were fabricated from sheets of Plexiglas 3.175 mm (1/8 in.-thick; McMaster). The height of each wall was 17.78 cm (7 in.), while the width was 22.86 cm (9 in.). The walls were glued to each other and to the roof using professional grade cyanoacrylate super glue of medium viscosity (Glue Masters brand). The door was mounted to the side wall with two steel hinges (not shown for simplicity).
To create the opening for the gas inlet port (no. 4, Scheme S2), the rear wall was drilled through. The obtained through hole was equipped with quick-disconnect panel-mounted hose barb adapter made of acetal (Colder part number PMCD1604). Outside of the flow chamber, this adapter has quick-disconnect termination for facile connection to the gas supply line. The gas supply line was flexible plastic tubing with an outside diameter (OD) of 6.35 mm (1/4 in.) attached to quick-disconnect hose elbow adapter (Colder part number PMCD2302). A simple rectangular cutout was made in the rear wall (no. 5, Scheme S2) for compatibility with lock mechanism in the top panel of FT-IR spectrometer Nicolet IS10. Gas flow chamber was mounted on top panel of spectrometer, it fully covered the ATR accessory (Scheme S1) with specimen, and better fit to the panel was achieved by reusable putty blocks. The cutout in the wall of the flow chamber was also used to withdraw the USB cable of temperature and humidity sensor (data logger), model Elitech RC-4HC, which was placed inside the chamber. The sensor measured temperature between −30 and +60 °C and relative humidity (RH) within 0–100%. The sensor was sending RH and temperature to lab computer (PC) every few seconds, using data logging software from Elitech.
Setup for the Preparation of Flow of Humidified and Dried Air
The humidified air for in situ hydration of ColMolSiev has been prepared as follows. First, the flow of ambient air (at RH∼30%) was created using a single-stage portable electric hot dog air compressor (Kobalt Quiet Tech). Second, the compressed ambient air was passed through a simple in-flow humidification setup, Scheme S3 (Supplemental Material) at flow rate of 0.8495 m3/h (30 ft3/h).
The in-flow humidification setup contained one 1000 mL Büchner flask (at air inlet) and one 500 mL Büchner flask (at air outlet). Each flask had a stopper, and flasks were connected via flexible pneumatic nylon tube of 6.35 mm (1/4 in.) OD (shown not to scale). The 6.35 mm (1/4 in.) nylon tube inside the 1000 mL flask was terminated by pneumatic air muffler with stainless steel mesh (from Uxcell), for better dispersion of air bubbles, and each flask was about half-filled with deionized (DI) water. After passage through this in-flow humidification setup, the humidified air had RH = 40%. The humidified air from the outlet of in-flow humidification setup was directed to the inlet port of the flow chamber via flexible pneumatic nylon tube with 6.35 mm (1/4 in.) OD. The in situ hydration (by sorption of water vapor) of ColMolSiev was conducted by passing the humidified air with RH = 40% through the flow chamber when the specimen was on the ATR crystal.
The dried air for in situ dehydration of ColMolSiev in the flow chamber was prepared similarly to IR purge gas. The differences are as follows. The air compressor (California Air Tools 8010A) was used, which was connected to the FT-IR purge gas generator (Whatman Parker Balston, model no. 75-52). This setup allows creating dried air of the spectroscopic quality with relative humidity RH <1% ( −73 °C dewpoint) and at flow rate up to 1.4158 m³/h (50 ft3/h).
Specimen Preparation
The first type of the specimen was color-indicating molecular sieves (of blue color) as received from vendor, in the form of beads approximately 2 mm in diameter. The beads were ground in an agate mortar and pestle to powder, which is denoted asisColMolSiev. The second type of the specimen was obtained, after asisColMolSiev has been held in the ambient air at approximately RH = 30% overnight, after which it became of gray color (denoted ambColMolSiev). The third type of the specimen was obtained after ambColMolSiev has been held in the flow chamber in the stream of humidified air at approximately RH = 40%; it is denoted hydColMolSiev.
In Situ Time-Dependent ATR FT-IR Spectroscopy in a Controlled Dry Atmosphere to Study Water Desorption from a Color-Indicating Molecular Sieves
A sample of powdered ambColMolSiev was placed on the ATR crystal, when the flow chamber was attached to the FT-IR spectrometer, with its door opened to ambient air. First, the sample was allowed to equilibrate with moisture in ambient air (RH = 30%). Then, the door of the flow chamber was closed, and the chamber has been purged with dried air (RH <1%) at the flow rate of 2.2653 m³/h (80 ft3/h) obtained by combining outputs of two FT-IR purge gas generators. The ATR FT-IR spectra were sequentially collected, and settings of FT-IR spectrometer were the same as before.
In Situ Time-Dependent ATR FT-IR Spectroscopy in a Controlled Humidified Atmosphere to Study Water Sorption by the Color-Indicating Molecular Sieves
After water vapor desorption has been conducted in situ (above), the flow of purge gas through the flow chamber has been switched from dried air to humidified air (RH = 40%) and was held at 0.8495 m³/h (30 ft3/h) flow rate. The ATR FT-IR spectra were sequentially collected, and settings of the FT-IR spectrometer were the same.
Results and Discussion
Characterization of Active, Ambient, and Hydrated Color-Indicating Molecular Sieves
The active form of powdered color-indicating molecular sieves (of blue color) is denoted asisColMolSiev. The survey ATR FT-IR spectrum of asisColMolSiev is shown in Fig. 1. Figure 1 also has, for comparison, ATR FT-IR spectra of two other forms of this sorbent, hydColMolSiev and ambColMolSiev. Survey ATR FT-IR spectra of ColMolSiev in asis, hydrated, and ambient forms.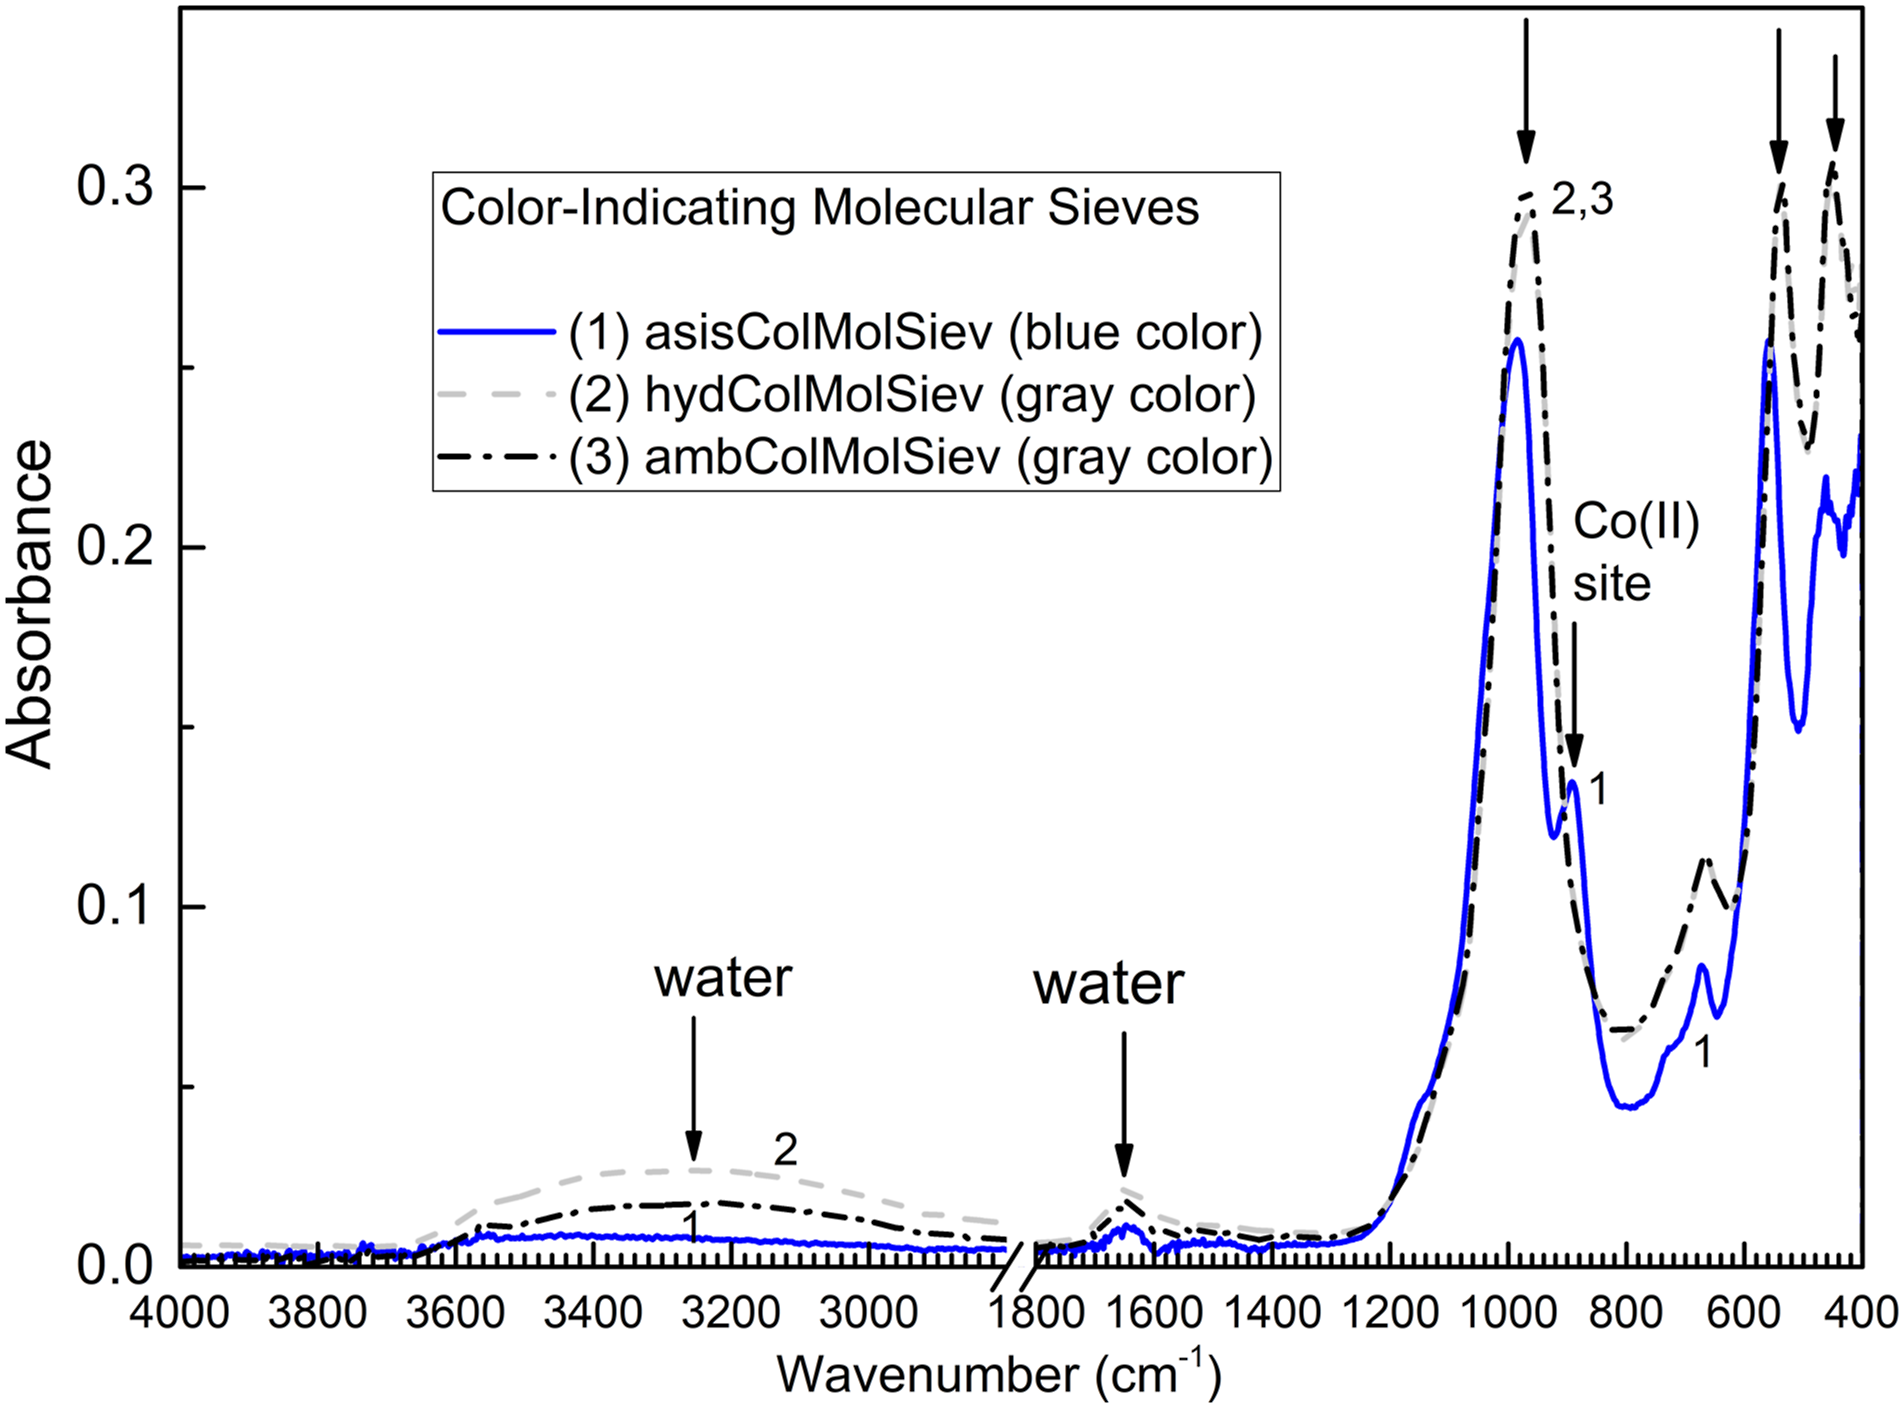
In Fig. 1, spectra of both hydColMolSiev and ambColMolSiev have a broad band at approximately 3600–3000 cm−1, which corresponds to the overlapped antisymmetric and symmetric vibrations of water bonded to 4A zeolite. 32 Spectral band of water is of higher intensity in the spectrum of hydColMolSiev than ambColMolSiev, as expected. This band is very weak in the spectrum of asisColMolSiev, also as expected. In addition, spectra have a band at 1645 cm−1 which is most pronounced for hydColMolSiev. It was reported 32 in FT-IR spectrum of 4A zeolite at 1660 cm−1 and it corresponds to bending band of water. Interestingly, the ATR FT-IR spectrum of asisColMolSiev in Fig. 1 also has this band, although at lower intensity; this indicates that the sample of asisColMolSiev has sorbed some water from ambient air during grinding (see Materials and Methods). Therefore, the majority of work has been conducted with ambColMolSiev which is stable in ambient air and allows reliable characterization by both ex situ and in situ methods of instrumental analysis.
Furthermore, the spectrum of asisColMolSiev in Fig. 1 has a strong peak at 985 cm−1 with a shoulder at 890 cm−1. This is consistent with report of Crawford et al. 33 on ATR FT-IR spectra of zeolite NaX and color-indicating Zeolite NaX prepared by ion exchange with Co(II) nitrate. The peak at 985 cm−1 is due to the antisymmetric stretching vibrations of Si–O(Si) bridges in silicates. 34 It is well known that doping sorbents, 35 including molecular sieves 36 with Co(II) creates their characteristic blue color of “dry” sorbents, which is changed to pink color when the sorbent contains adsorbed water. Importantly, spectral shoulder at 890 cm−1 in Fig. 1 has been reported in the spectrum of color-indicating Zeolite NaX 33 , but not in the spectrum of regular Zeolite NaX. Therefore, the 890 cm−1 peak in Fig. 1 belongs to Co(II) site in lattice of 4A zeolite.
In Fig. 1, the lack of shoulder at 890 cm−1 in the spectra of hydColMolSiev and ambColMolSiev indicates that Co(II) site interacts with water adsorbate, consistently with mechanism of color change in this material. Further, the peak at 673 cm−1 in Fig. 1 corresponds to symmetric Si–O–Si vibration, which was calculated by the DFT calculations 34 to be at 682 cm−1. Also in Fig. 1, spectra of both ambColMolSiev and hydColMolSiev show this peak redshifted to 665 cm−1 from its position at 673 cm−1 in spectrum of “dry” form asisColMolSiev. The redshift of IR peak of sorption site is explained by harmonic oscillator model: when adsorbate molecule binds to sorption site, the mass of the latter increases and the wavenumber (energy) of vibration decreases (“redshift”). This indicates interaction of Si–O–Si bonds in sorbent in this work with water adsorbate.
Yet other major peaks in Fig. 1 are, as follows: (1) The one at 559 cm−1 (for asisColMolSiev) that shifts to 538 cm−1 for hydColMolSiev and ambColMolSiev, and (2) the one at 463 cm−1 (for asisColMolSiev), which shifts to 452 cm−1 for both hydColMolSiev and ambColMolSiev. These peaks correspond to deformations δ(SiO2) which were predicted by the DFT calculations 34 to be at 519 and 425 cm−1, respectively. The observed spectral changes in this work are consistent with bonding water to SiO2 groups in color-indicating molecular sieves. The presence or absence of spectral shoulder at 890 cm−1 due to color-indicating Co(II) site is one of the most useable FT-IR spectroscopic “fingerprints” of hydration reaction, which occurs (or does not occur) in molecular sieves sorbent.
We performed an ex situ characterization of ColMolSiev using powder XRD. However, contrary to the ATR FT-IR spectrometer in this work, which has the flow chamber attachment with controlled air humidity, the XRD instrument does not have such or related capability. Therefore, it does not allow for the protection of hygroscopic molecular sieves from ambient air humidity, so the XRD pattern of asisColMolSiev was not obtained. Similarly, the XRD pattern of hydColMolSiev (which is unstable at ambient air humidity) was not obtained. Figure 2 shows XRD pattern of ambColMolSiev. Powder XRD of ambColMolSiev sorbent.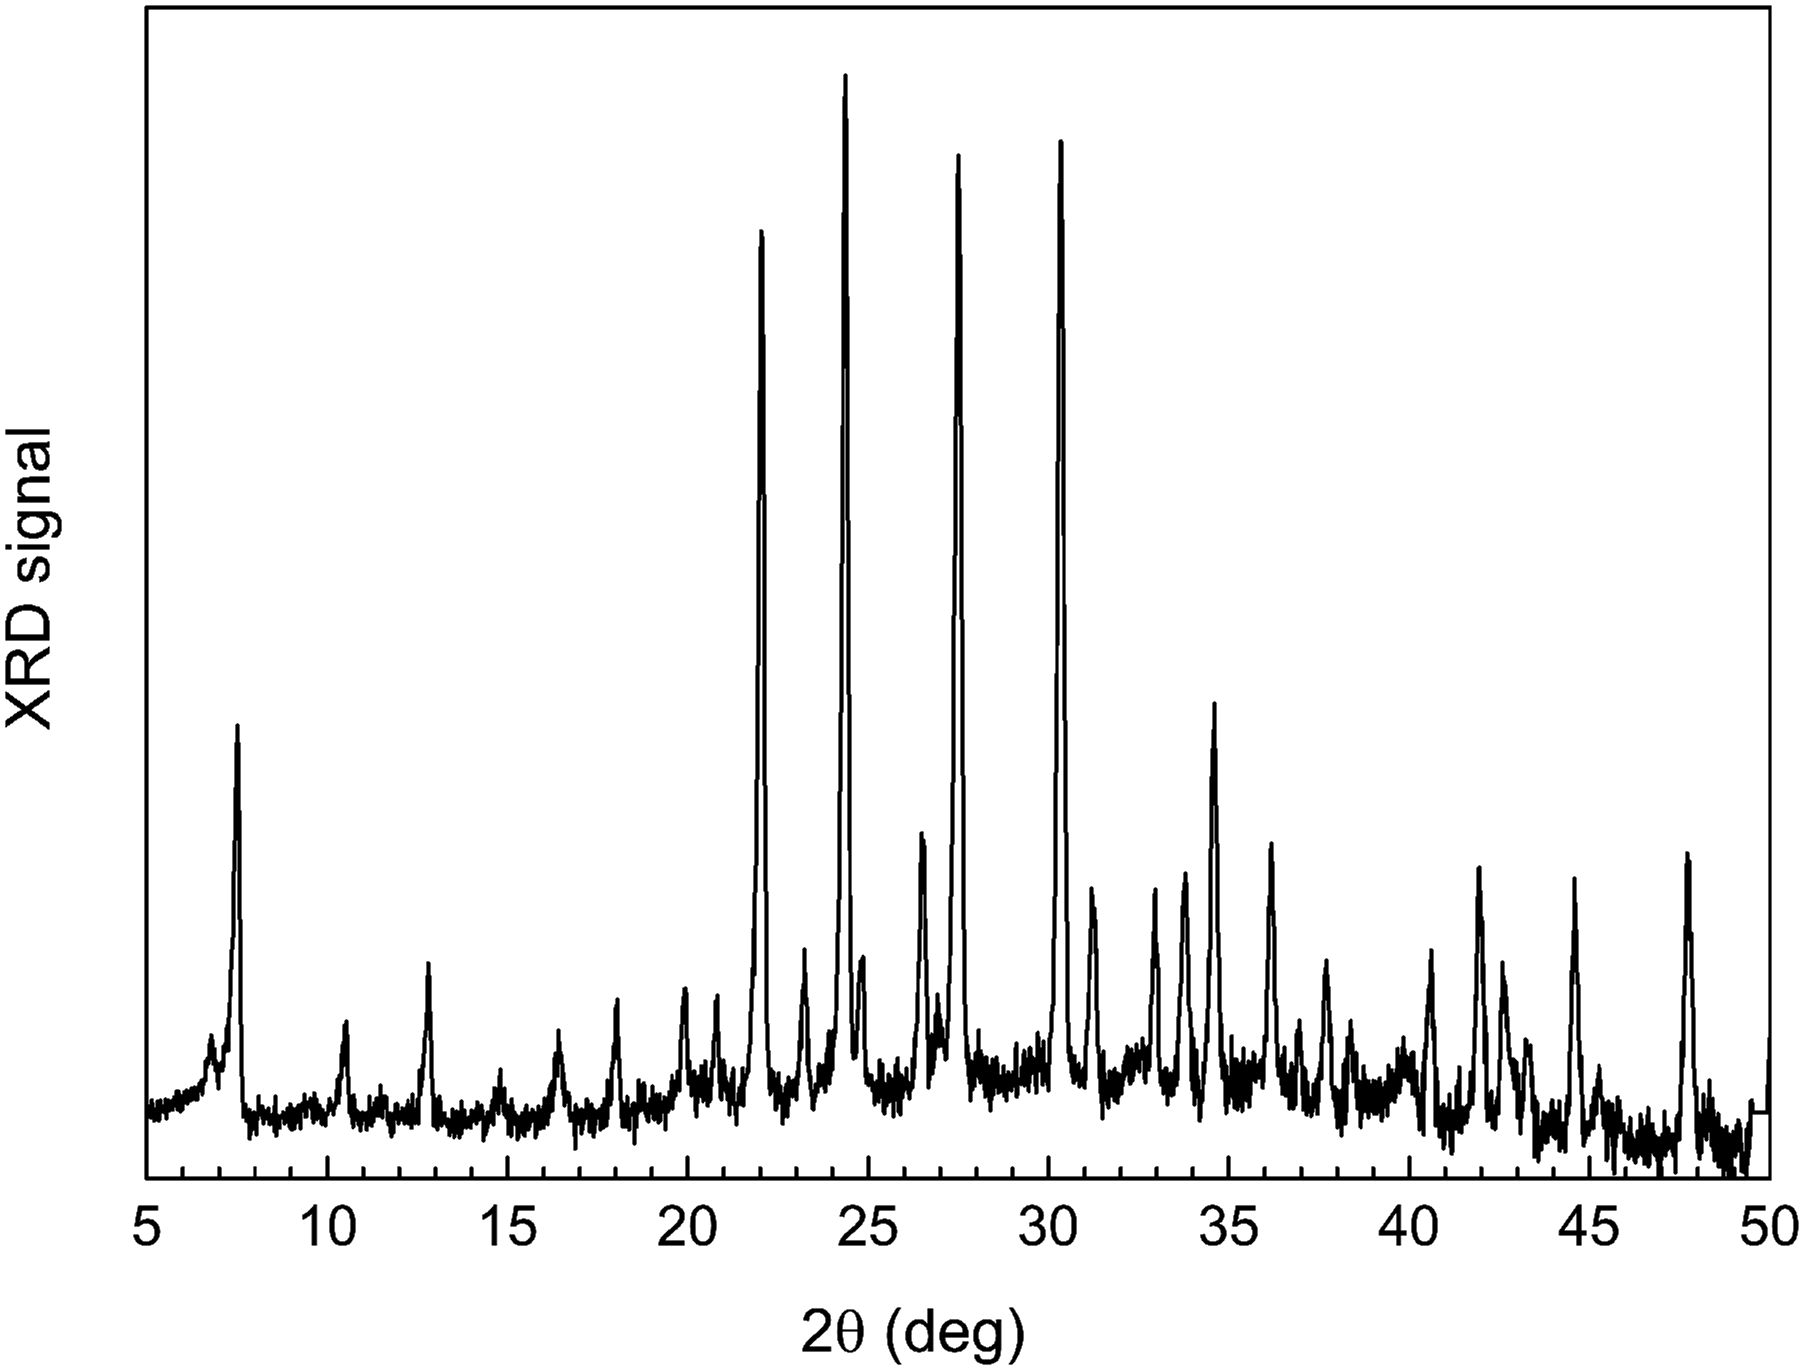
The XRD pattern in Fig. 2 is in good consistency with literature reports, in particular with work of Crawford et al., 33 who reported the XRD pattern of cobalt-containing NaX zeolite. The XRD pattern is also consistent with data by Zamani et al., 37 who reported the set of Miller indices for peaks of 4A zeolite (cubic lattice and space group Fm3c). Namely, the XRD peaks in Fig. 2 are assigned as follows: 7.5° (200), 10.5° (220), 12.8° (222), 16.4° (420), 19.8° (440), 22.1° (660), and 24.3° (622). The XRD pattern in Fig. 2 is also consistent with data for 4A zeolite by Broussard et al., 38 who published peaks in the range of 2θ = 5–50°. This confirms that cobalt additive present in ColMolSiev in this work, which has the lattice of 4A zeolite, does not significantly modify its crystalline lattice.
In Situ Time-Dependent ATR FT-IR Study of Water Desorption by Color-Indicating Molecular Sieves Conducted at the Controllably Varied Air Humidity
Before the start of this experiment, a sample of powdered ambColMolSiev was placed on the ATR crystal, with the flow chamber attached to FT-IR spectrometer, but with the door opened to ambient air. The sample was allowed to pre-sorb moisture from ambient air (RH = 30%) for over 2 h. Then, the RH in the flow chamber started to be continuously recorded by the humidity sensor inside the chamber (Fig. 3). Controlled relative humidity (RH) of air in the flow chamber as function of time.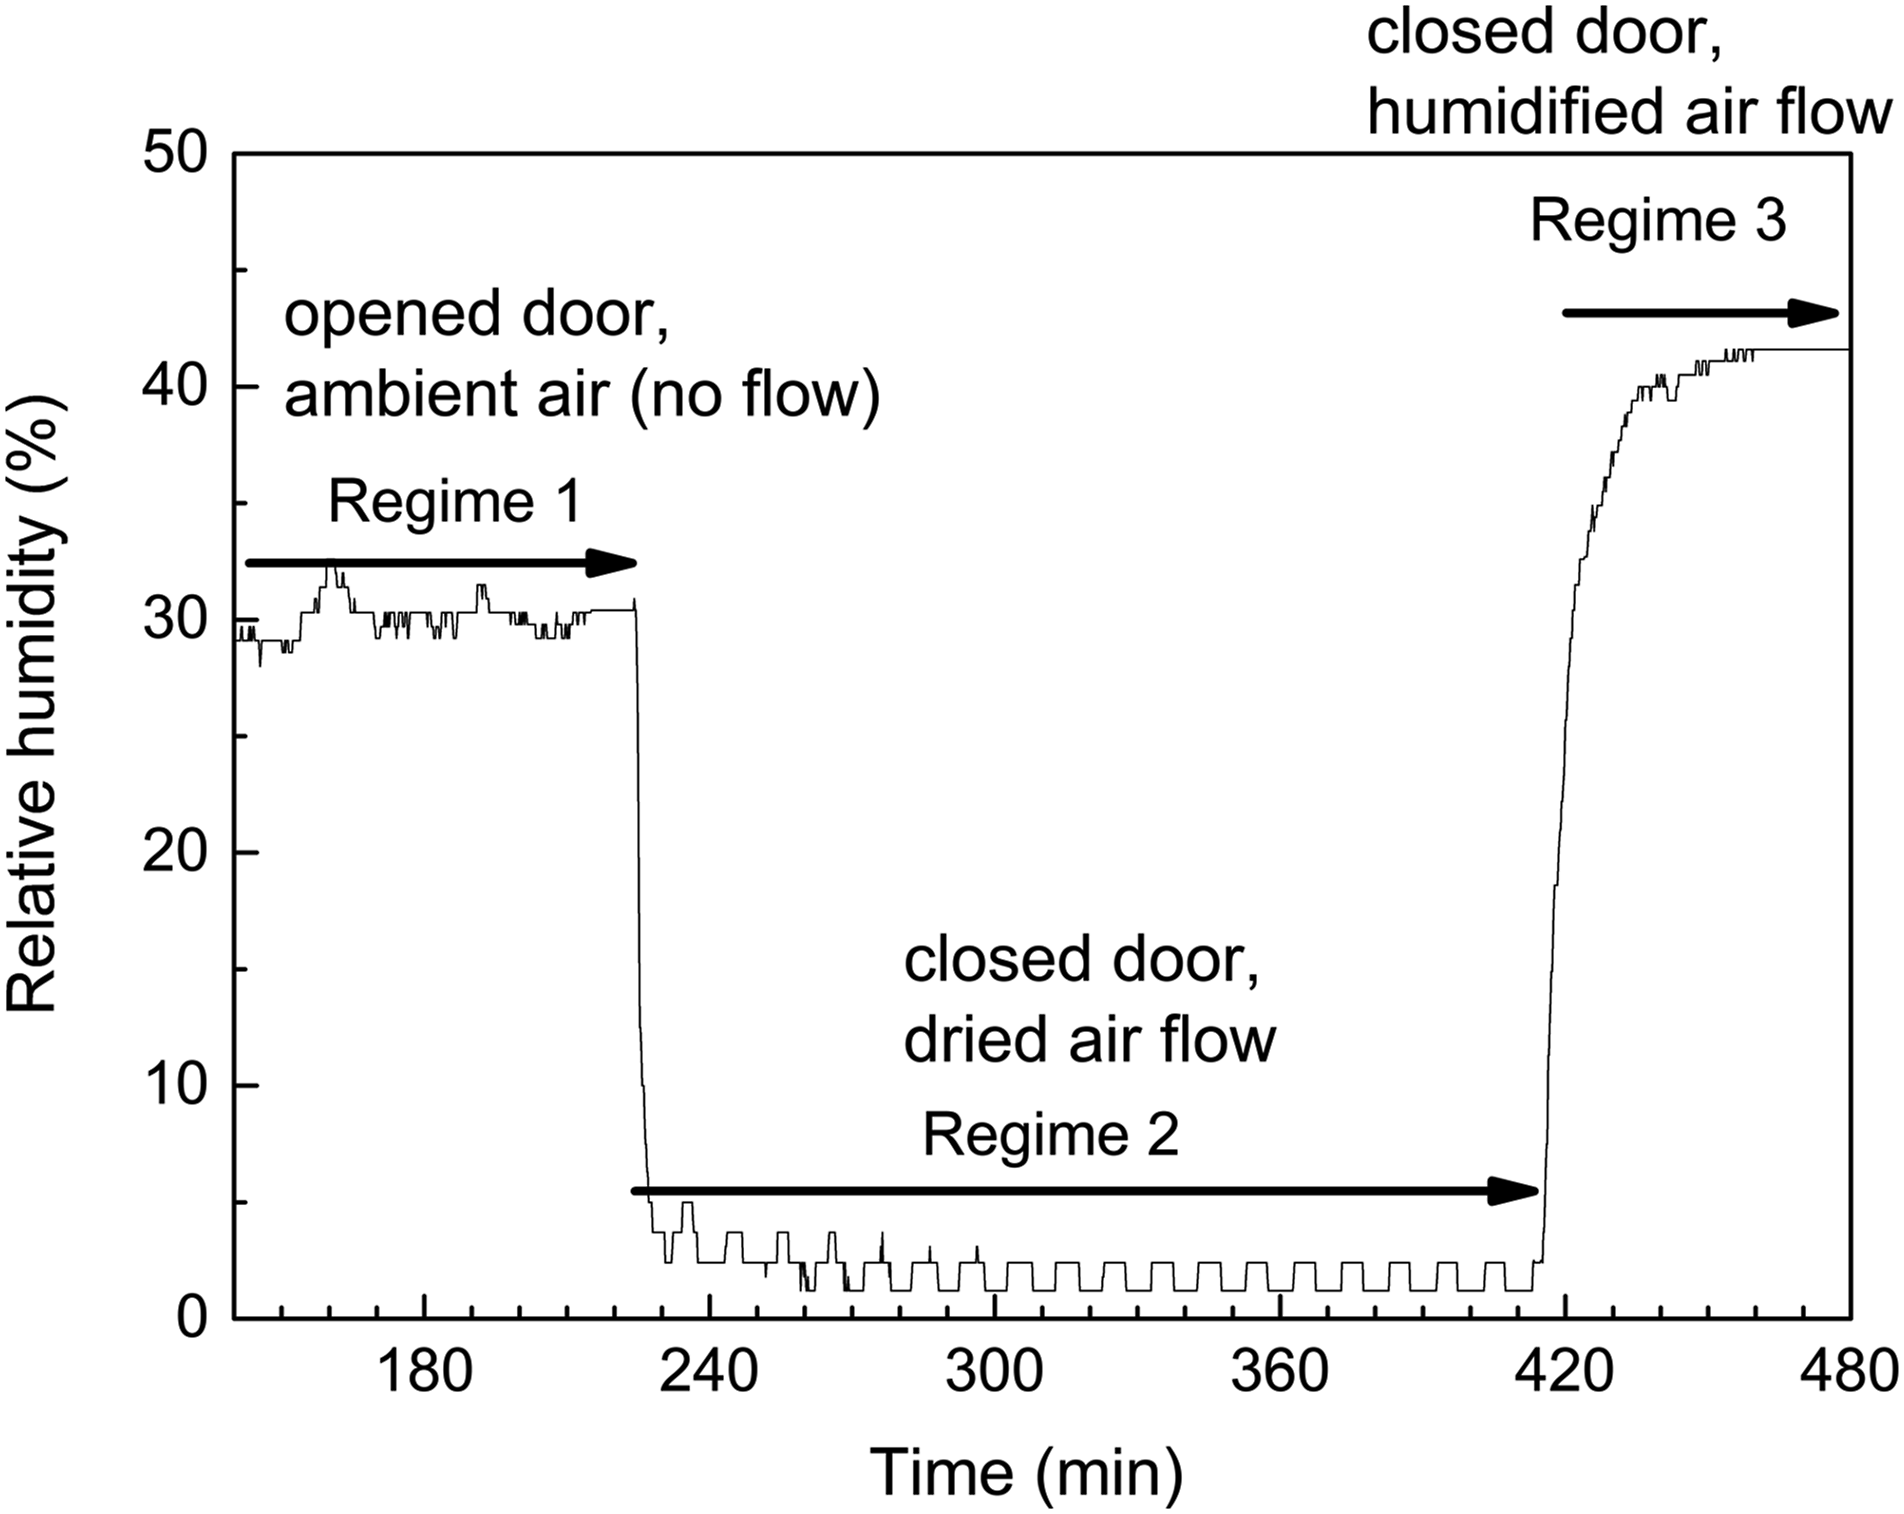
For the period shown by the first arrow (Fig. 3, Regime 1), the RH remained stable at about 30%. During this period, the ATR FT-IR spectra of ambColMolSiev were also periodically recorded, and they remained the same (data not shown); the representative spectrum is in Fig. 1. The temperature measured by the same sensor in the vicinity of sample remained constant at 27 °C.
Then, at the time corresponding to the start of Regime 2 (Fig. 3), the door of the flow chamber was closed, and the chamber started to be purged with spectroscopically dry air (RH<1%) at the flow rate of 2.2653 m³/h (80 ft3/h). As expected, the RH inside the flow chamber has sharply decreased and remained constant (fluctuations indicate that humidity sensor is operating at the lower end of its dynamic range). Simultaneously, the in situ time-dependent ATR FT-IR spectra of specimen on the ATR element have been recorded. This corresponds to Regime 2 of in situ desorption of water by the sorbent in the flow of dried air.
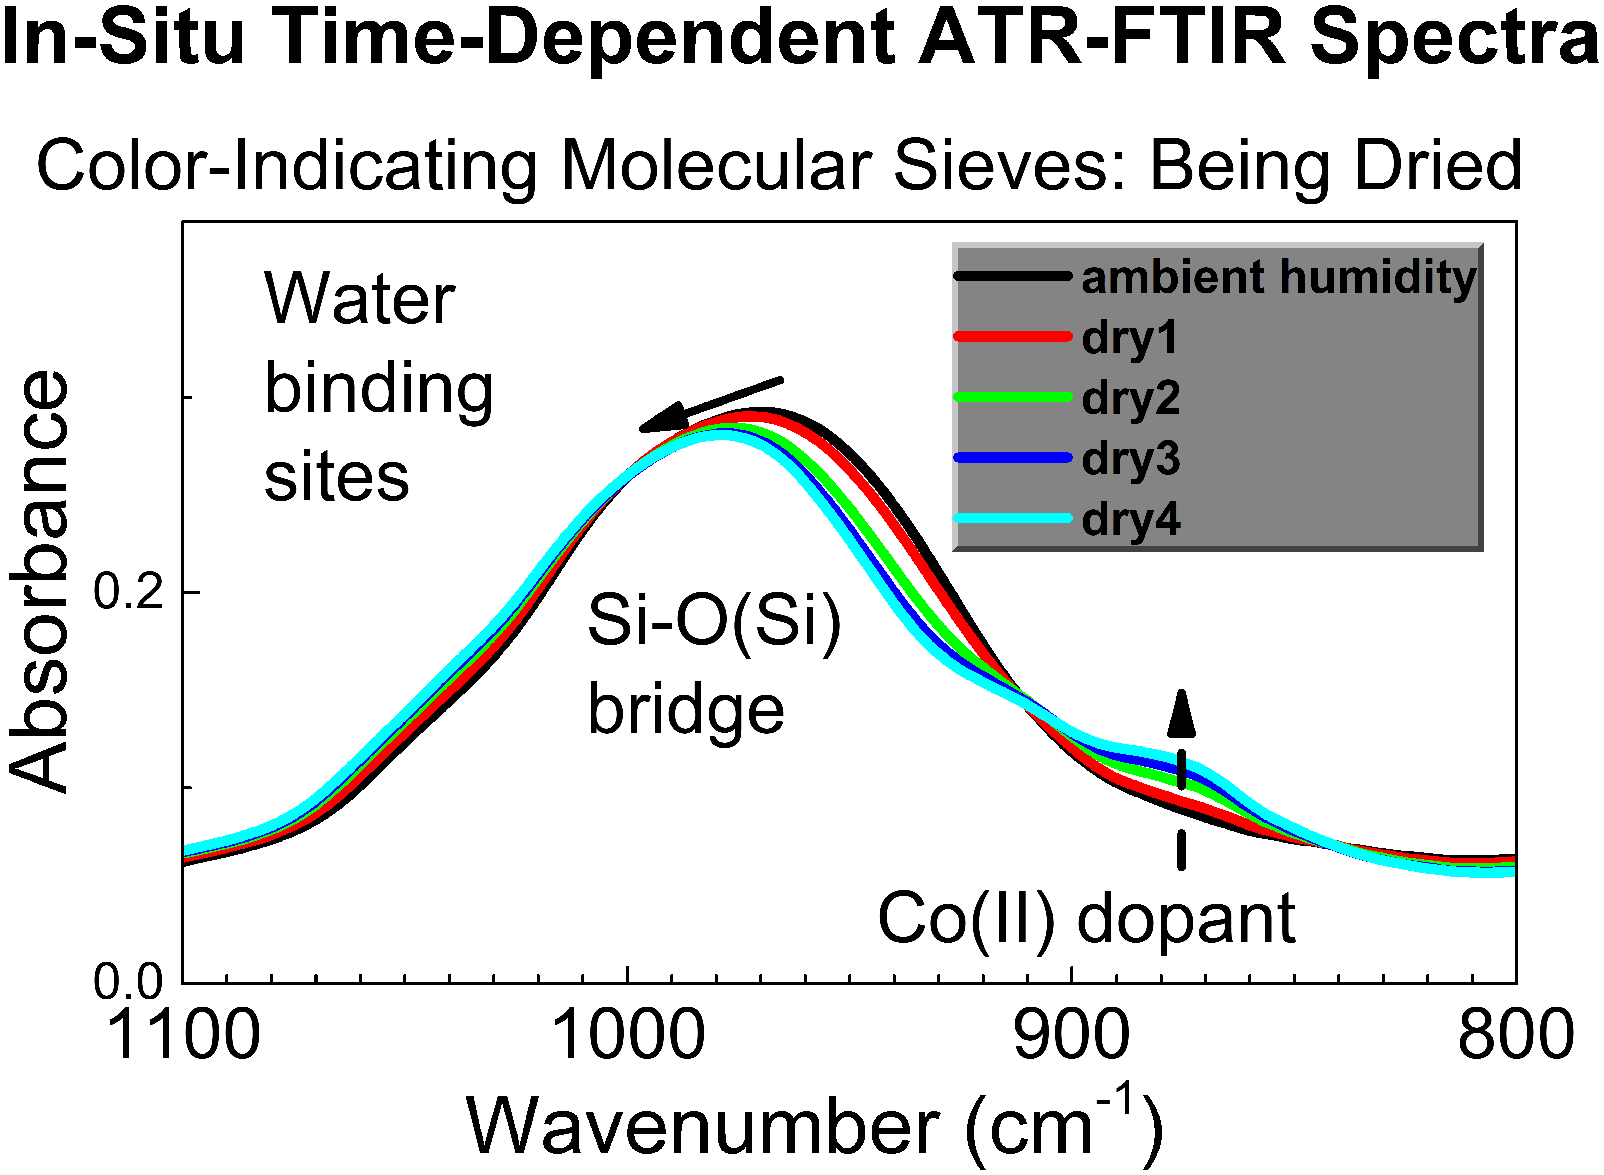
Figure 4 shows the in situ time-dependent ATR FT-IR spectra of the specimen in controlled atmosphere recorded during Regime 2 (the flow of dried air over the specimen). The spectra labeled dry 1, dry 2 etc. (Fig. 4), have been collected sequentially, and each spectrum was collected for 512 scans (12.7 min.). In Figs. 4a and 4b, one can see gradual disappearance of peaks due to pre-sorbed water, that is, the broad band at 3500–3000 cm−1 (Fig. 4a) and the deformation peak at approximately 1650 cm−1 (Fig. 4b). At the same time, Fig. 4c shows progressive shift of peaks of Si–O bonds in the sorbent, indicating water loss by the sorbent from sites having Si–O bonds. In addition, also in Fig. 4c, the shoulder at approximately 890 cm−1 steadily grows, indicating gradual water loss (desorption) from the color-indicating Co(II) site in the sorbent. For some specimens, change of their contact with diamond ATR crystal could occur, for example if the specimen is a flexible polymer. Then, the specimen can “swell” upon sorption of vapor of adsorbate, see, for example, Woodward et al.,
24
and “shrink” upon desorption, which could modulate the IR absorbance. However, zeolites are known to have rigid framework, hence we do not expect their “swelling” or “shrinking” during reactions in the study. The in situ time-dependent ATR FT-IR spectra of ambColMolSiev during the progressive water vapor desorption in the flow of dried air (Regime 2).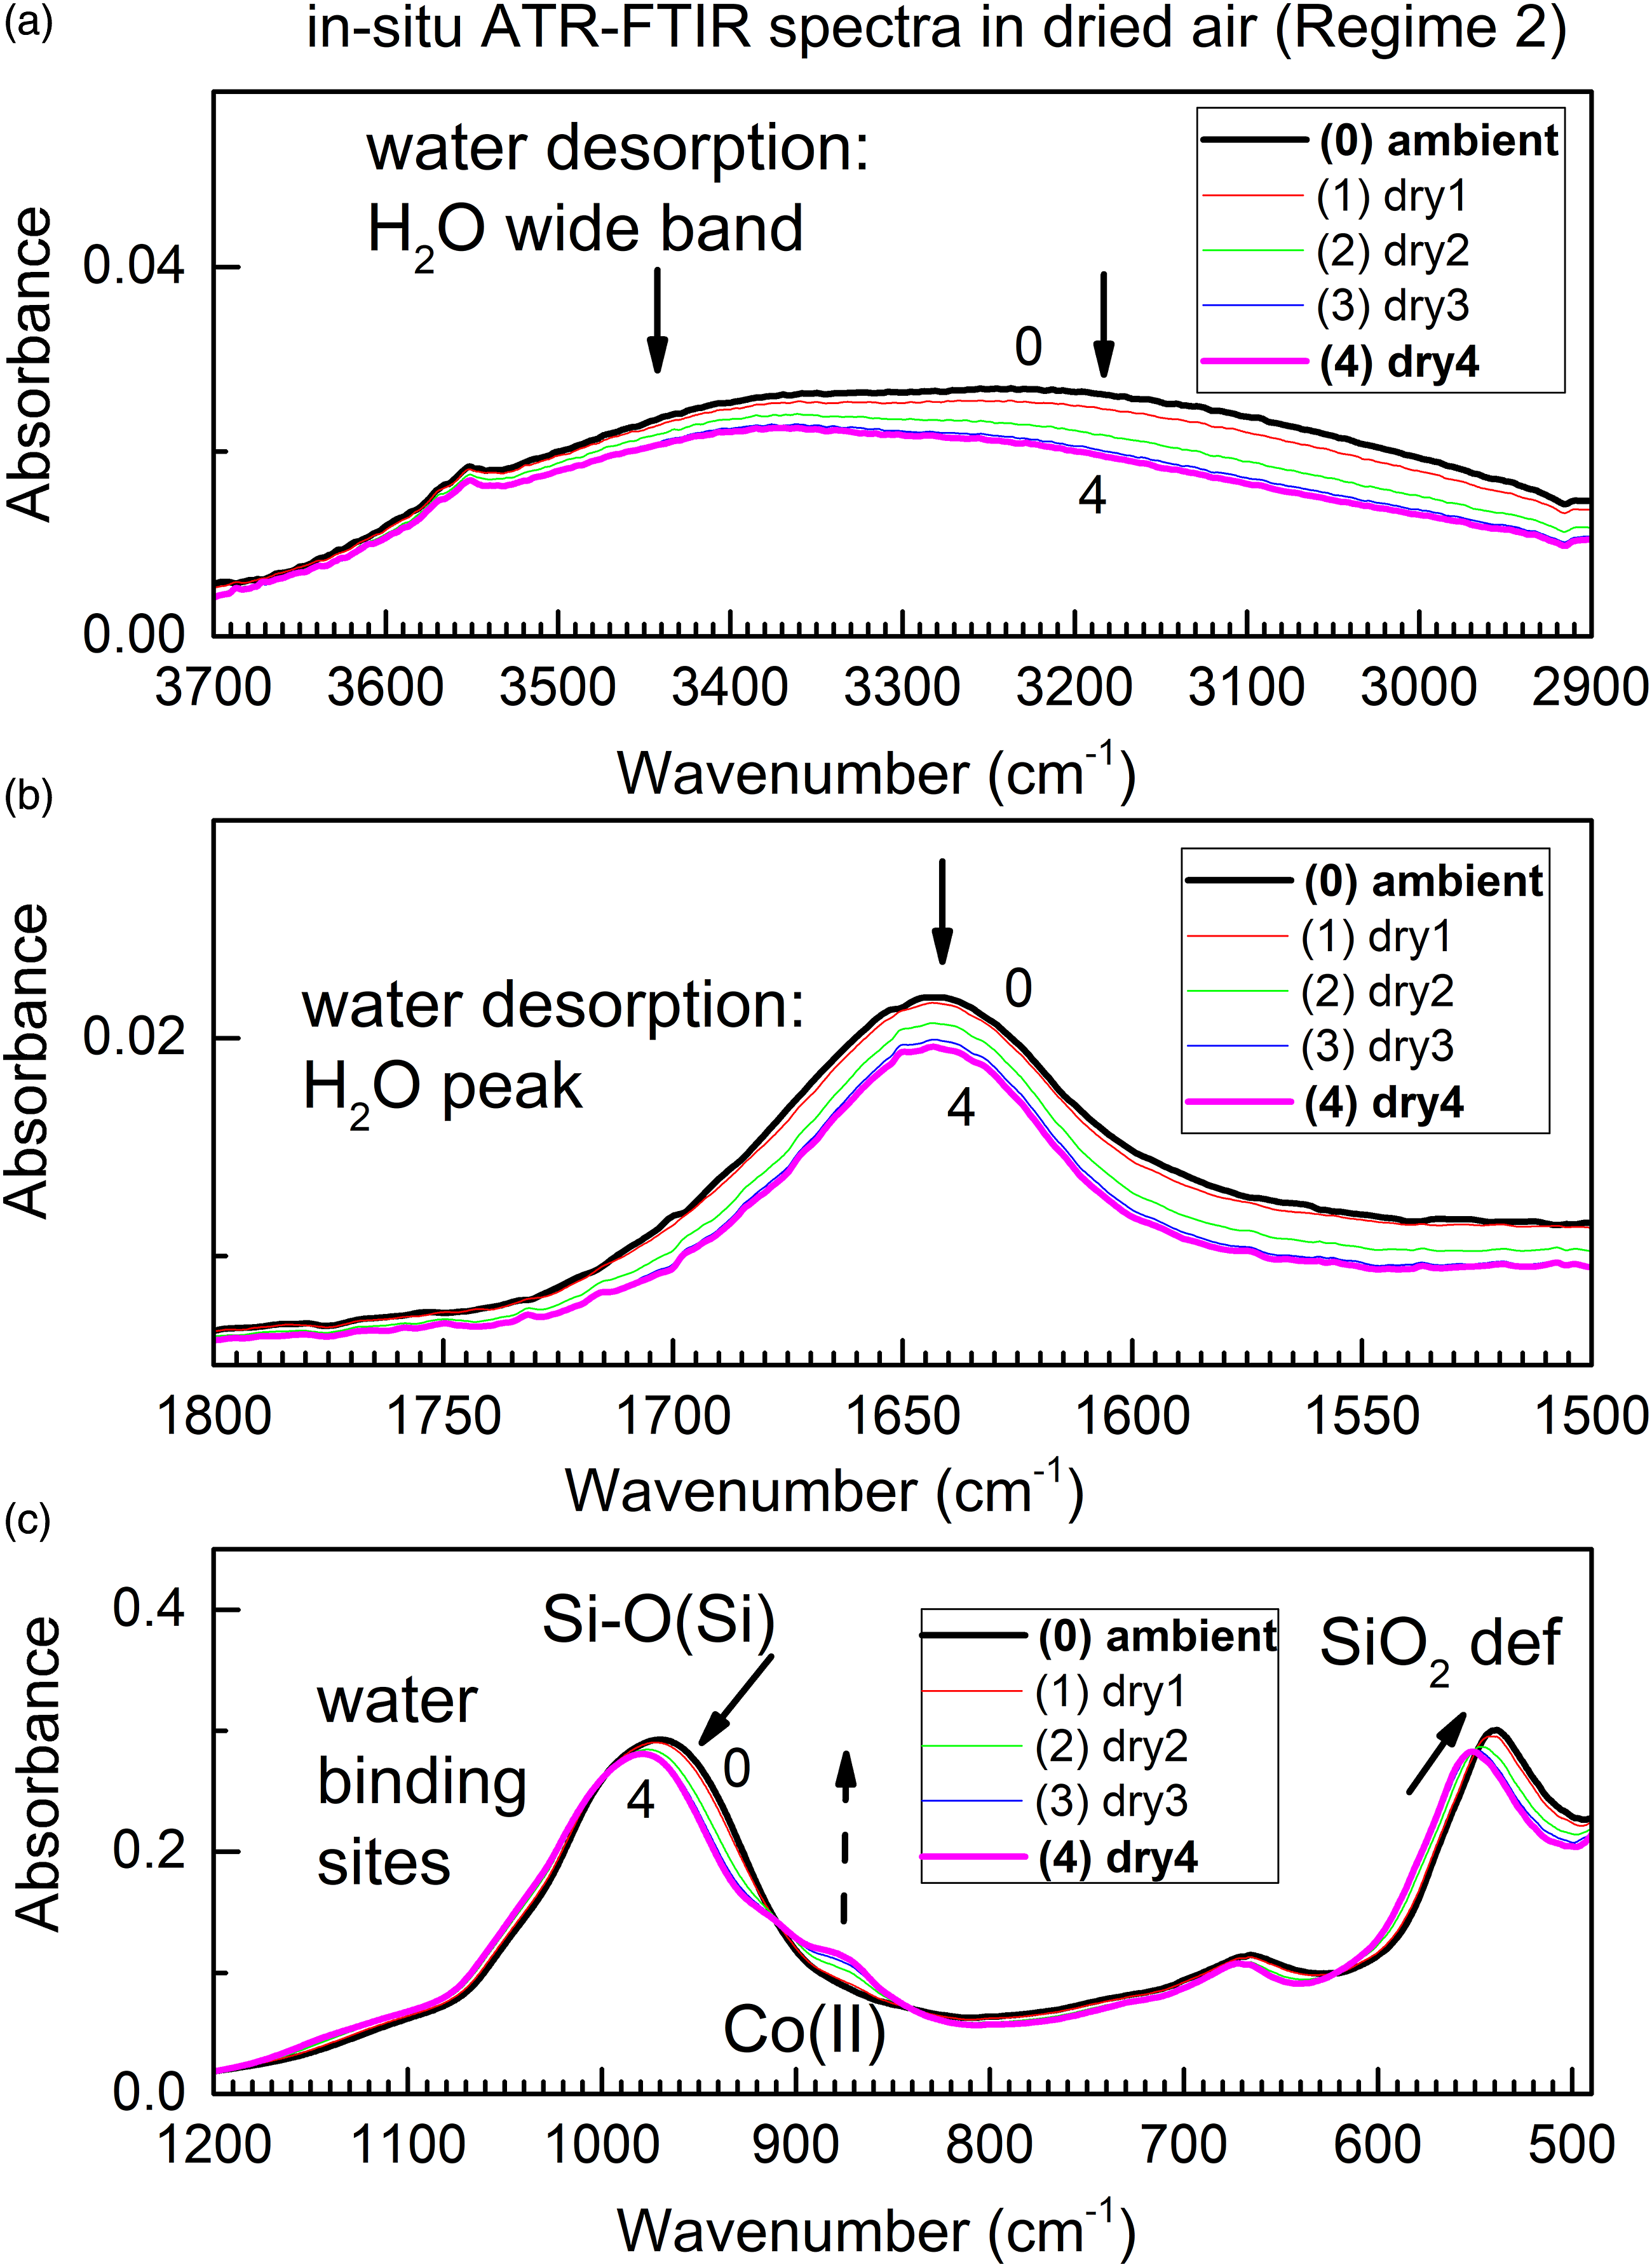
It is important to note that changes in the spectra in Fig. 4 due to water loss by the sorbent continue, when the RH in the flow chamber is maintained stable at the low value, see the plateau of Regime 2 in Fig. 3. This indicates the capability to create controlled constant low humidity of air surrounding the specimen on the ATR element of FT-IR spectrometer. In turn, this allows conducting the in situ time-dependent ATR FT-IR spectroscopic studies of reaction of water desorption by the sorbent, Eq. 1

Herein, the reactant is ambColMolSiev which is assigned the formula ColMolSiev[H2O]x. The product is dried ColMolSiev which is assigned the formula ColMolSiev[H2O]x–y. Because of the continuing water loss, the x and y stoichiometric indexes are dynamic, i.e., they change with time.
It is of interest to investigate, whether in situ time-dependent ATR FT-IR spectroscopy, when conducted in controlled atmosphere, is capable to differentiate between sorption (or desorption) from two different sites in the same sorbent. Figure 5 shows in situ time-dependent ATR FT-IR spectra of ColMolSiev in selected spectral range, during Regime 2 and under longer time scale (up to 140 min.). Spectral ranges of interest include the peak of Si–O vibration in the crystal lattice of zeolite “host” (approximately 985 cm−1) and of the Co(II) color-indicating dopant (approximately 890 cm−1). The in situ time-dependent ATR FT-IR spectra of Si–O and Co(II) sites in ambColMolSiev during water loss in the flow of dried air (Regime 2), under the longer time scale.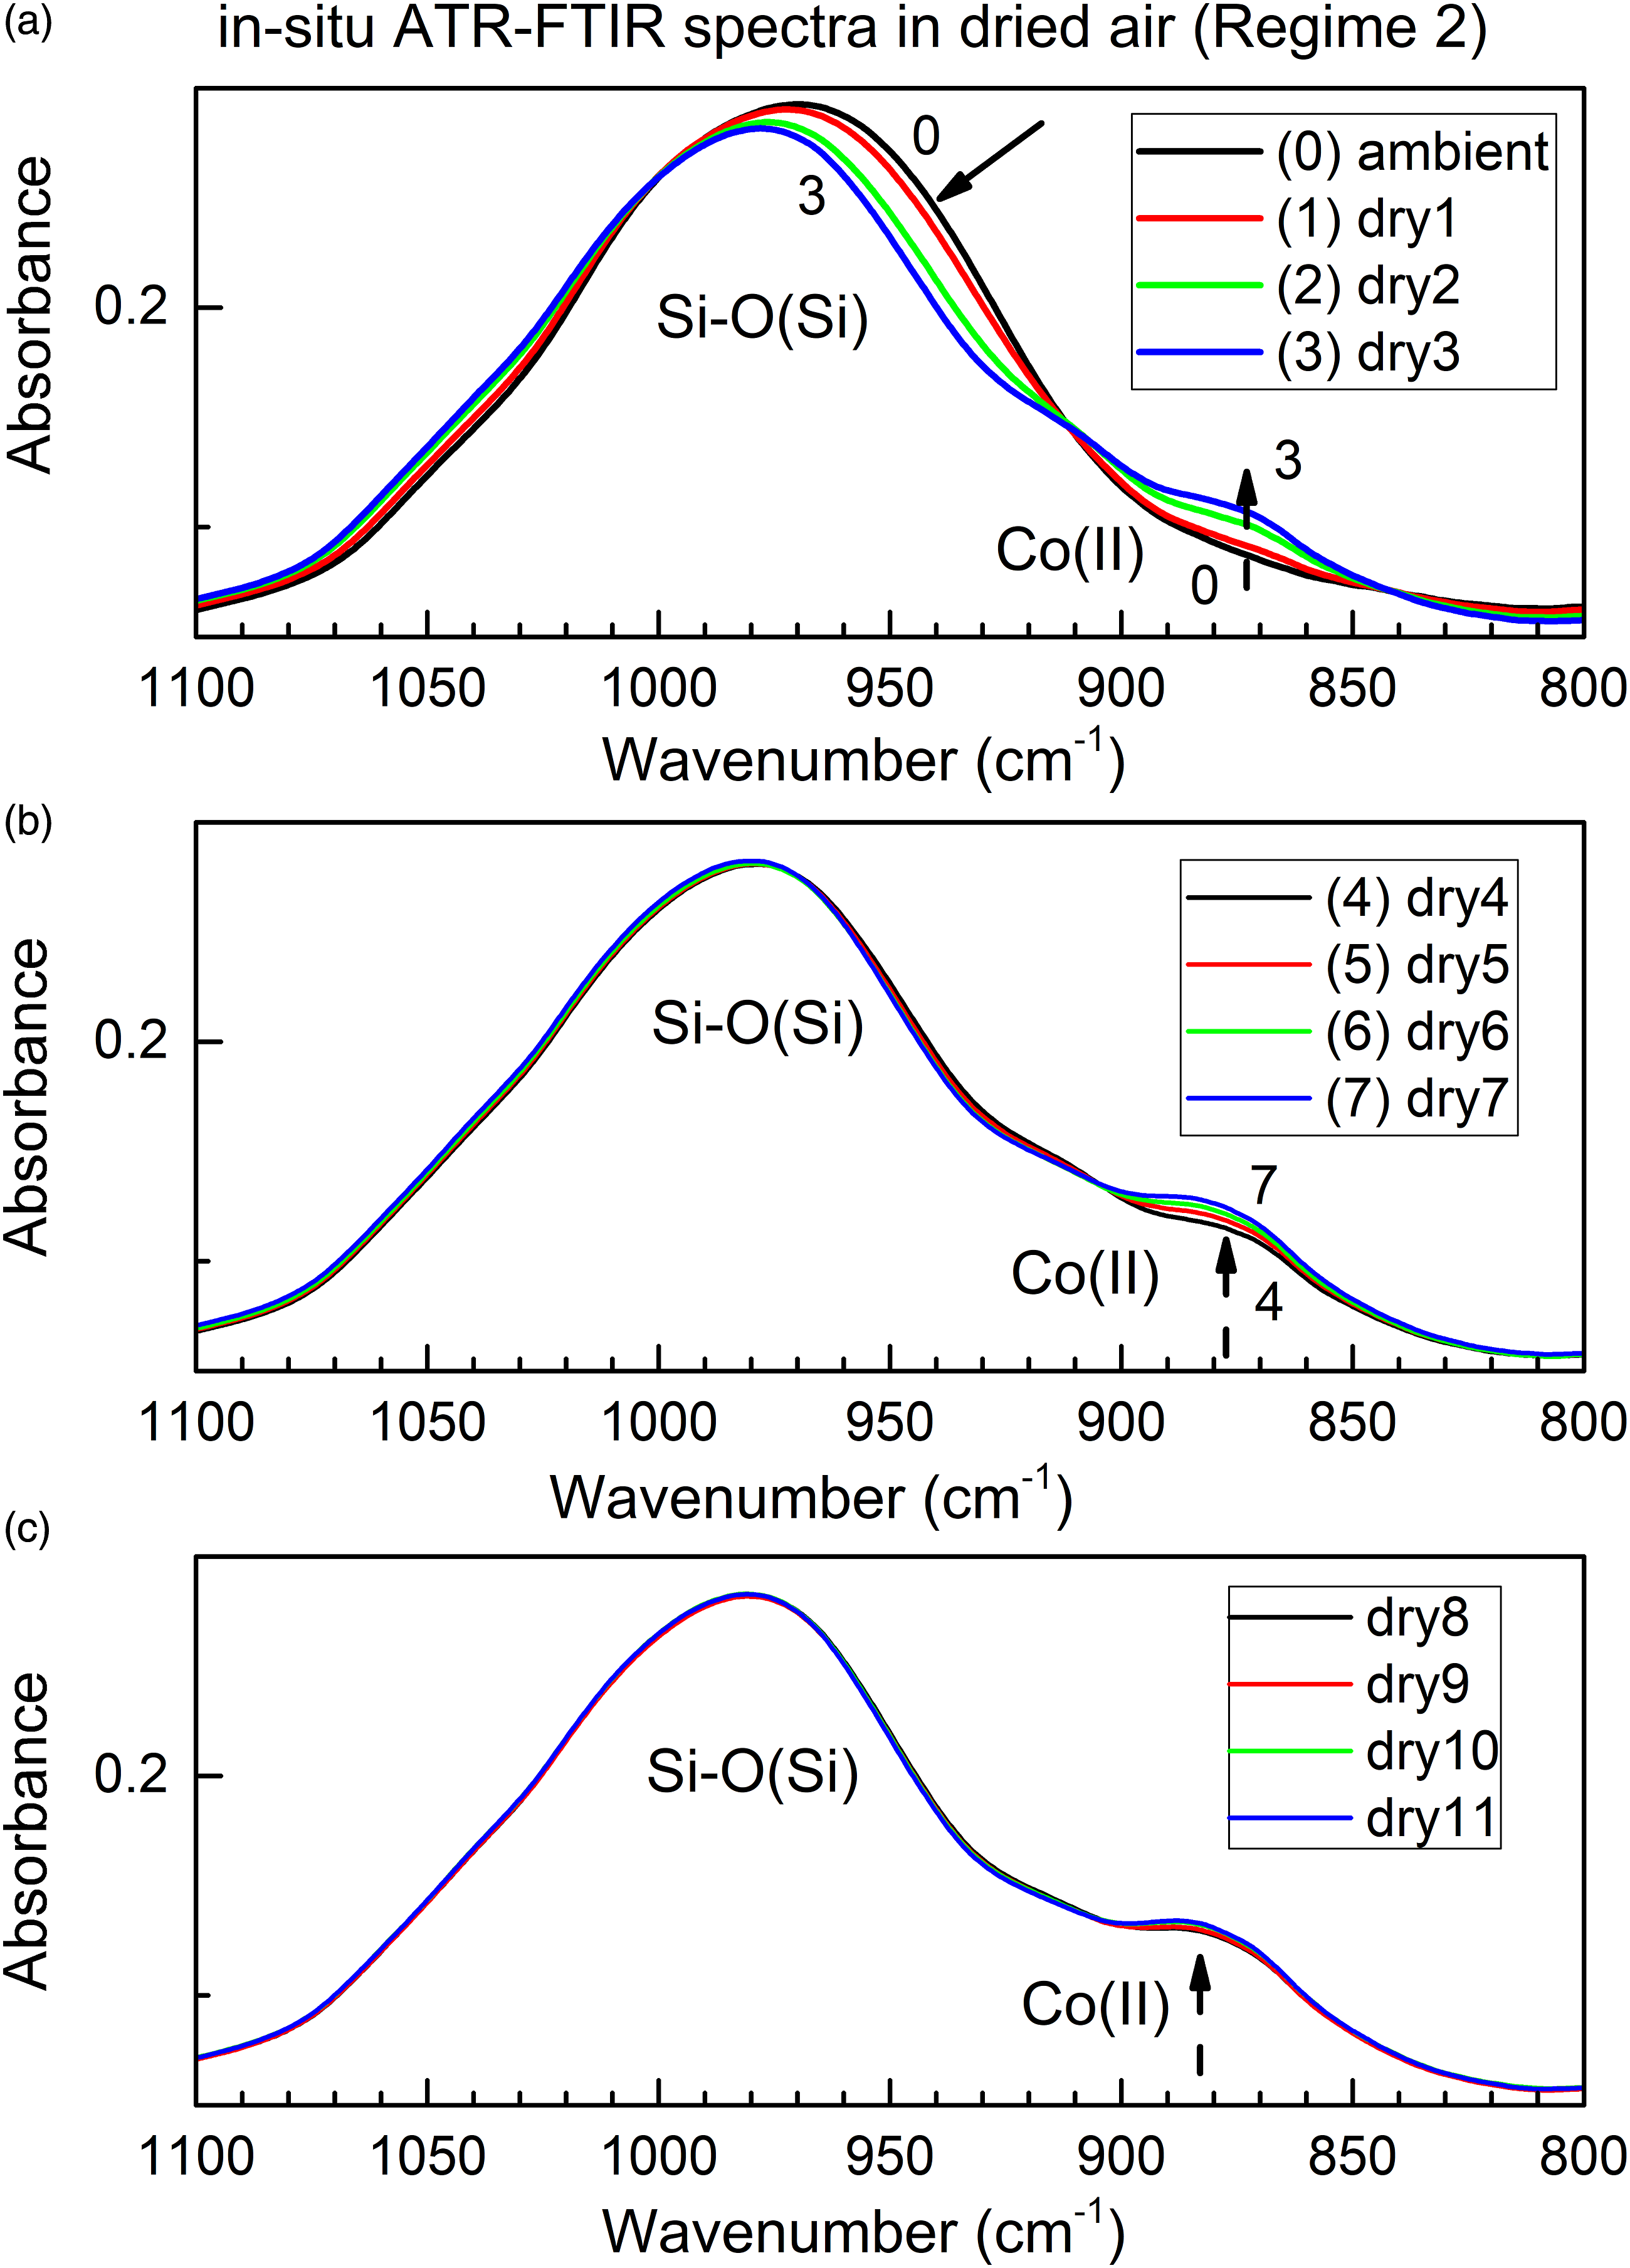
It is important to note, that there are two distinct timescales of water desorption from these two sites. First, water loss from Si–O bonds stops after four subsequent collections of spectra within up to about 50 min (four scans × 12.7 min/scan). In contrast, water loss from the color-indicating Co(II) center in the sorbent proceeds on a much longer time scale for up to over 140 min (11 scans × 12.7 min/scan), or about three times longer. This indicates the capability of in situ time-dependent ATR FT-IR spectroscopy, when combined with controlled atmosphere, to differentiate between desorption from the two distinct sites in the same sorbent.
Based on the spectra in Figs. 4 and 5, only a partial removal of water adsorbate occurs in Regime 2 in the flow of dried air, since some water is still present in the sorbent (range 3500–3000 cm−1) even after 11 successive scans of ATR FT-IR spectra. Hence, water desorption is described by Eq. 1 in which the product ColMolSiev[H2O]x–y contains some water. This is expected, since regeneration (complete water desorption) of ColMolSiev (per Data Sheet from the vendor) requires heating it over 150 °C.
In Situ Time-Dependent ATR FT-IR Study of Water Sorption Using Color-Indicating Molecular Sieves in the Flow Chamber at the Controllably Varied Air Humidity
It is of importance to investigate whether the described method can be used for in situ studies of the opposite process in the same sorbent, namely sorption of water vapor from air. After Regime 2 (water desorption) has been completed, the gas entering the flow chamber with specimen on the ATR element has been switched to humidified air. The so obtained Regime 3 (water sorption) is shown in Fig. 3. The reaction of water sorption at the elevated RH of humidified air flowing over the specimen can be described by Eq. 2:

The reactant is driedColMolSiev with formula ColMolSiev[H2O]x–y which has been previously in situ-prepared in the flow chamber during Regime 2, see previous section. In Regime 3, this specimen sorbs water vapor, and it is being converted to product with formula ColMolSiev[H2O]x–y+z. Figure 6 shows in situ time-dependent ATR FT-IR spectra collected during gradual water sorption by driedColMolSiev; spectral ranges are the same as in Fig. 4. The in situ time-dependent ATR FT-IR spectra of in situ dried ColMolSiev during the subsequent water vapor sorption in the flow of humidified air (Regime 3).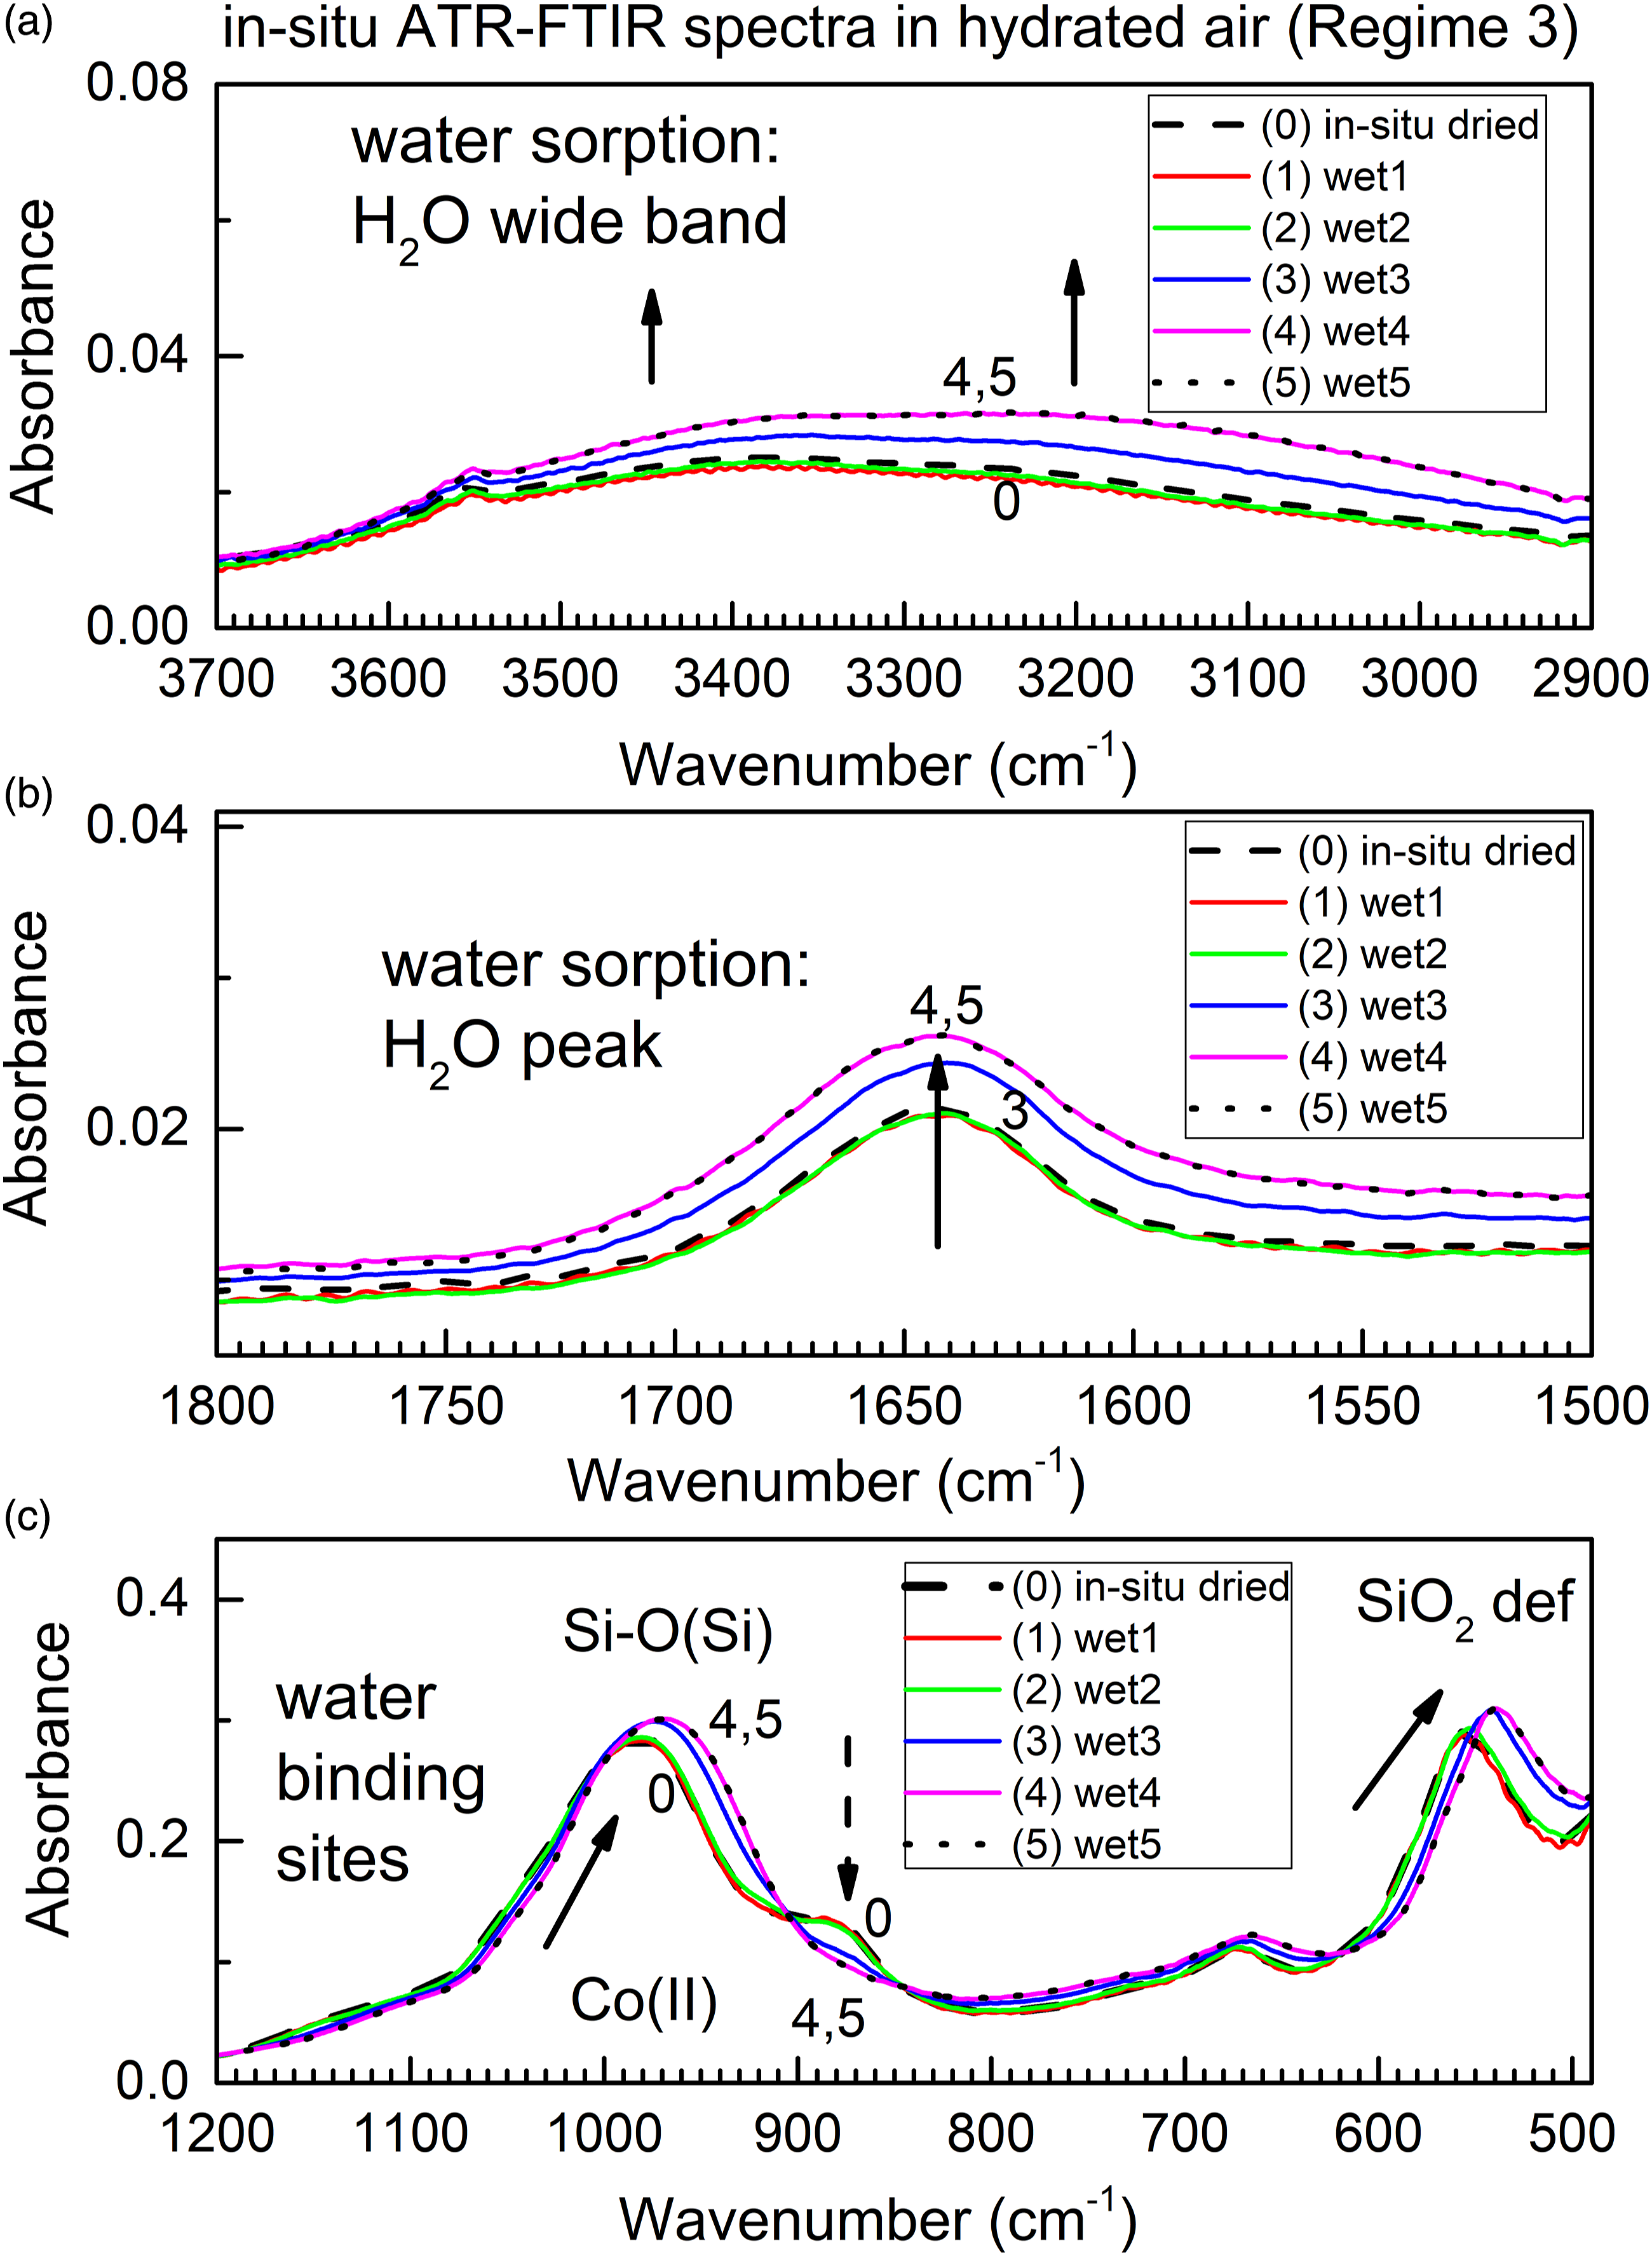
Data in Fig. 6 show that water vapor is being progressively sorbed by the sorbent; changes in peaks due to both Si–O and Co(II) sites confirm water bonding to them. Namely, peaks due to adsorbed water (Figs. 6a and 6b) increase, while peaks due to Si–O bonds are shifted and the peak due to dehydrated Co(II) site is decreasing. Further, a comparison of Fig. 6 and Fig. 4 allows a conclusion that the described method allows facile ATR FT-IR spectroscopic studies of both sorption and desorption under in situ conditions and as function of time, without exposing the specimen to ambient atmosphere.
Importantly, there is a variety of reversible spectral changes in Figs. 4 and 6. The first type of change is a decrease in IR absorbance of the band due to adsorbate (water) in Fig. 4a, during desorption. Its corresponding “reverse” change is an increase in IR absorbance of this band in Fig. 6a, during sorption. The second type of change is an increase in IR absorbance of peak due to the humidity-sensitive color-indicating Co(II) site in Fig. 4c, during desorption. Its corresponding “reverse” change is a decrease in IR absorbance in Fig. 6c, during sorption. The third type of change is a “blue” shift of the Si–O(Si) peak in Fig. 4c, during desorption, see the progression from spectrum 0 to spectrum 4. Its corresponding “reverse” change is a “red” shift in Fig. 6c, during sorption, see the progression from spectrum 0 to spectra 4 and 5. Periodic changes in the refractive index of the sorbent upon sorption and desorption, even if present, would affect all peaks through the same type of spectral change, which is not the case. The observations are consistent with reversible chemical reactions:

and

Figure 7 shows time progression of the ATR FT-IR spectra of the two most important water sorption sites, the Si–O(Si) bond and Co(II) site, in the time scale of up to 140 min. One can see that both spectral changes stop after four scans (about 4 × 12.7 min = 50 min.) which indicates that water sorption is completed. The in situ time-dependent ATR FT-IR spectra of Si–O and Co(II) sites in ColMolSiev during water sorption in the flow of humidified air, under the long time-scale.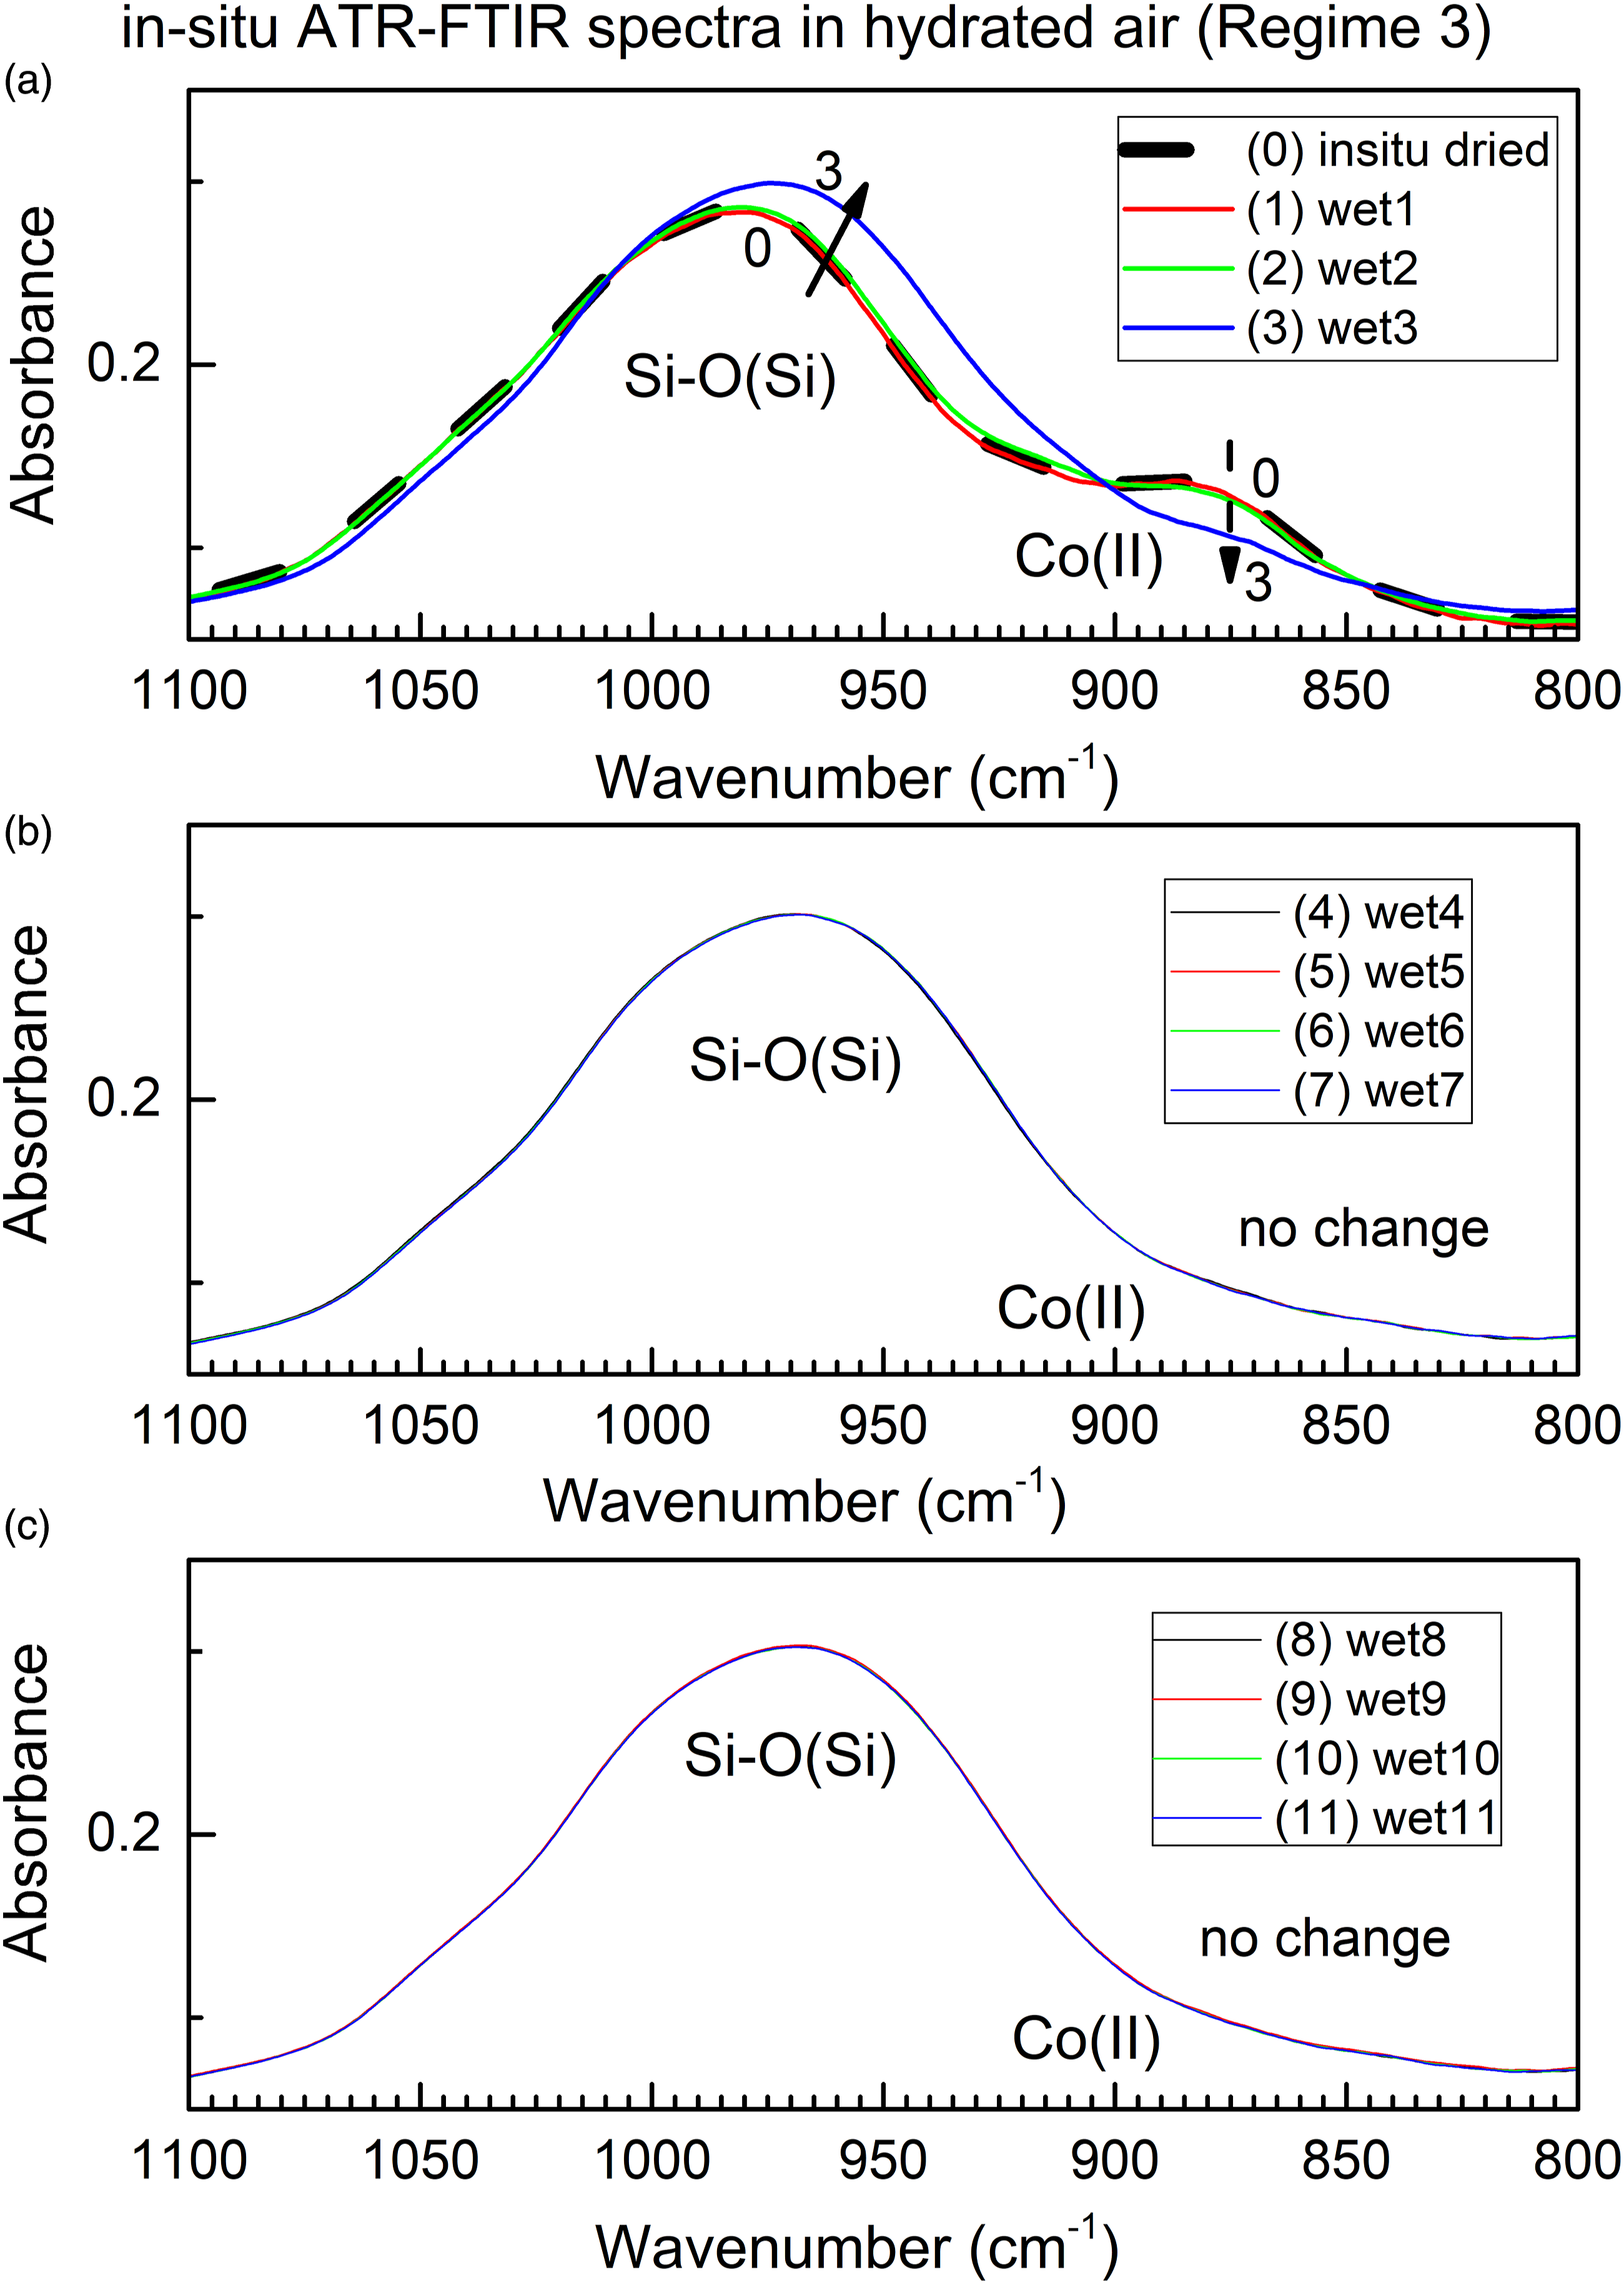
This is in contrast with respective spectra in Fig. 5, which shows that water desorption proceeds on the significantly (factor 2) longer time scale than sorption. This finding is consistent with behavior of molecular sieves, which are designed to readily sorb, but not desorb, water vapor from air at room temperature.
The data demonstrate that in situ ATR FT-IR spectroscopy conducted in the facilely built gas flow chamber allows mechanistic and time-dependent monitoring both sorption and desorption reactions of the same sorbent. The reported method allows controlled-atmosphere ATR FT-IR spectroscopic studies of powders in air, for example, with variable content of oxygen, as well as in the presence of gases not commonly found in air, potentially including volatile toxic compounds, if the dedicated outlet valve is furnished. Further, the reported allows in situ time-dependent ATR FT-IR spectroscopic studies of solid samples in physical forms other than powder, for example, crystals, micro-electronic, 2 and chemosensor devices. The described enhanced-capability in situ time-dependent ATR FT-IR spectroscopy of powders in controlled atmosphere can be efficiently used in studies of sorption, desorption, separations, heterogeneous catalysis and photocatalysis of “solid-gas” materials systems, chemosensing, work with hazardous materials, and for other applications where the spectroscopic specimen characterization in controlled atmosphere and in situ reaction monitoring are needed.
Conclusion
This work describes new variant of in situ ATR FT-IR spectroscopy with operation under time-dependent conditions, while also working in controlled atmosphere, and with specimen in the form of powder undergoing heterogeneous reaction “solid-gas” of sorption and desorption. For this purpose, infrared spectrometer Thermo Fisher Scientific IS10 equipped with an ATR accessory of common model Golden Gate was employed in combination with facile gas flow chamber attachment. The flow chamber is also equipped with sensor for recording air relative humidity (RH) and temperature, to allow time-resolved controlled atmosphere during collection of in situ time-dependent ATR FT-IR spectra of specimens undergoing the reaction. First, the method of in situ time-dependent ATR FT-IR spectroscopy in controlled atmosphere is successfully tested, under controlled low air humidity, to monitor reaction of gradual water desorption from color-indicating molecular sieves. Second, this method is verified by in situ monitoring the reverse reaction, namely sorption of water vapor by color-indicating molecular sieves under controlled elevated air humidity. The described in situ time-dependent ATR FT-IR spectroscopy of powders in controlled gaseous atmosphere is promising for studies of sorption, desorption, kinetics of heterogeneous reactions “solid-gas”, mechanistic research in heterogeneous catalysis and photocatalysis, chemosensing, environmental monitoring, and work with hazardous materials.
Supplemental Material
Supplemental Material - In Situ Time-Dependent Attenuated Total Reflection Fourier Transform Infrared (ATR FT-IR) Spectroscopy of a Powdered Specimen in a Controlled Atmosphere: Monitoring Sorption and Desorption of Water Vapor
Supplemental Material for In Situ Time-Dependent Attenuated Total Reflection Fourier Transform Infrared (ATR FT-IR) Spectroscopy of a Powdered Specimen in a Controlled Atmosphere: Monitoring Sorption and Desorption of Water Vapor by Alexander Samokhvalov, and Stanley McCombs in Applied Spectroscopy
Footnotes
Acknowledgments
Research was sponsored by the Army Research Office and was accomplished under Grant Number W911NF-20-1-0290. The views and conclusions contained in this document are those of the authors and should not be interpreted as representing the official policies, either expressed or implied, of the Army Research Office or the U.S. Government. The U.S. Government is authorized to reproduce and distribute reprints for Government purposes notwithstanding any copyright notation herein. A.S. thanks Dr. R. Budhani from Department of Physics & Engineering Physics at Morgan State University for providing partial support of this work, via undergraduate research contract of S. McCombs sponsored by the Army Research Office under Cooperative Agreement Number W911NF-21-2-0213.
Declaration of Conflicting Interests
The author(s) declared no potential conflicts of interest with respect to the research, authorship, and/or publication of this article.
Funding
The author(s) disclosed receipt of the following financial support for the research, authorship, and/or publication of this article: This research was sponsored by the Army Research Office and was accomplished under Grant Number W911NF-20-1-0290, W911NF-21-2-0213.
Supplemental Material
All supplemental material mentioned in the text is available in the online version of the journal.
References
Supplementary Material
Please find the following supplemental material available below.
For Open Access articles published under a Creative Commons License, all supplemental material carries the same license as the article it is associated with.
For non-Open Access articles published, all supplemental material carries a non-exclusive license, and permission requests for re-use of supplemental material or any part of supplemental material shall be sent directly to the copyright owner as specified in the copyright notice associated with the article.