
Abstract
An elegant, well-established effective data filter concept, proposed originally by Abraham Savitzky and Marcel J.E. Golay, is undoubtedly a very effective tool, however not free from limitations and drawbacks. Despite the latter, over the years it has become a "monopolist” in many fields of spectra processing, claiming a "commercial" superiority over alternative approaches, which would potentially allow to obtain equivalent or in some cases even more reliable results. In order to show that basic operations performed on spectral datasets, like smoothing or differentiation, do not have to be equated to the application of the one particular single algorithm, several of such alternatives are briefly presented within this paper and discussed with regard to their practical realization. A special emphasis is put on the fast Fourier methodology (FFT), being widespread in the general domain of signal processing. Finally, a user-friendly Matlab routine, in which the outlined algorithms are implemented, is shared, so that one can select and apply the technique of spectral data processing more adequate for their individual requirements without the need to code it prior to use.
Keywords
Introduction
Despite a continuous development of spectroscopy, it is not possible even now to experimentally acquire the "ideal" sets of spectral data. This regularity is inextricably linked to the primal imperfectness of the measured signal known as the noise. In order to preserve the original, significant information carried by the recorded signal, one would usually make the best possible efforts to reduce the level of the noise among the collected data. This can be generally done in two ways, at the stage of acquisition (optimization of an experiment) and right after it. The latter approach, involving mathematical and statistical apparatus is known under the name of filtering, smoothing, denoising, or more generally, signal (pre)processing.1,2
The term processing, however, is not limited only to the problem of noise reduction. In fact, any modification applied to spectra supporting their interpretation may be included in this definition. 2 Particular attention is given in this paper to the group of rather basic transformations, 3 enabling it to reveal additional information initially “hidden” within the originally recorded signal, namely, calculation of spectral derivatives. This is due to the fact that such straightforward at first sight operations can be effectively applied to a baseline correction2,3 as well as overlapping band decomposition.4–8
Since both smoothing and differentiation are rather standard and widely used operations performed in spectroscopic research, 3 most of the computer packages related to the acquisition and/or analysis of spectra (data) are supplemented with the routines to allow them to automatically perform the proper calculations. While this arrangement in general tends to be highly convenient for the users, it has one potential pitfall. The majority of commercial user-friendly routines are based on (and thus supports) only one type of data processing algorithm, that is, the approach originally proposed by Savitzky and Golay. 9
Although the Savitzky–Golay filter is undoubtedly an extremely useful tool (and thus has become a “monopolist” in the spectral processing domain), it has been reported to have some drawbacks, too.10–15 Even though a variety of upgrades have been introduced to increase its efficiency,14,16–18 yet, some limitations related to the very core of the algorithm still remain impossible to be fully resolved. For the above reasons, the Authors believe that alternative concepts of spectral processing should deserve more attention.
As an inspiring example of the substitute algorithm gaining popularity, a very intuitive concept of smoothing (denoising) the spectra proposed by Whittaker, 19 and successfully implemented (and validated) by Eilers, can be given.11,13,20 On the other hand, in various fields of signal processing, algorithms based on the Fourier transform methodology are commonly applied. 21 Interestingly, in the spectroscopic research related to chemistry, these are used rather occasionally, in spite of the reports on their significant potential.22–27 Perhaps this might result from seemingly complex Fourier methodology and/or from numerical difficulties related to its performance.21,28
Therefore, trying to address the outlined issue, the Authors would like to present how to practically implement fast Fourier transform (FFT) and several other techniques (see Supplemental Material) for the processing of spectra. Within a few pages of this paper, the alternative algorithms to the commercialized Savitzky–Golay filter are concisely described and commented with regard to their practical realization. Finally, a functional, ready-to-use routine written in Matlab 29 is shared so that one does not have to individually code them prior to usage.
Experimental
Theoretical Background
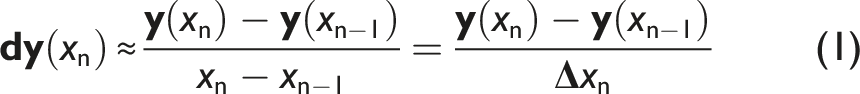
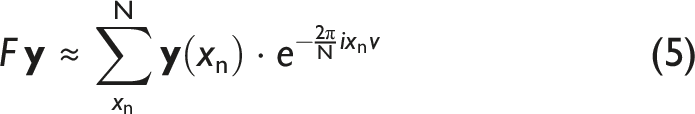
Differentiation of Spectra with Fast Fourier Transform. In the classical terms, the first derivative
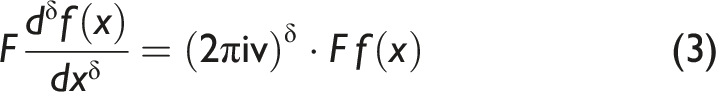
At the same time, in terms of the Fourier transform methodology, a recipe for estimation of the derivative

Hence, the differentiation procedure comes down to three consecutive steps—calculation of the Fourier transform F of the spectrum Schematic depiction of the relationship between spectra and their derivatives (Eq. 2) in both real (left) and the Fourier (right) domains, shown on the example of two overlapping Gaussian curves (dotted lines). The phase shift observed for the FFT of the first derivative 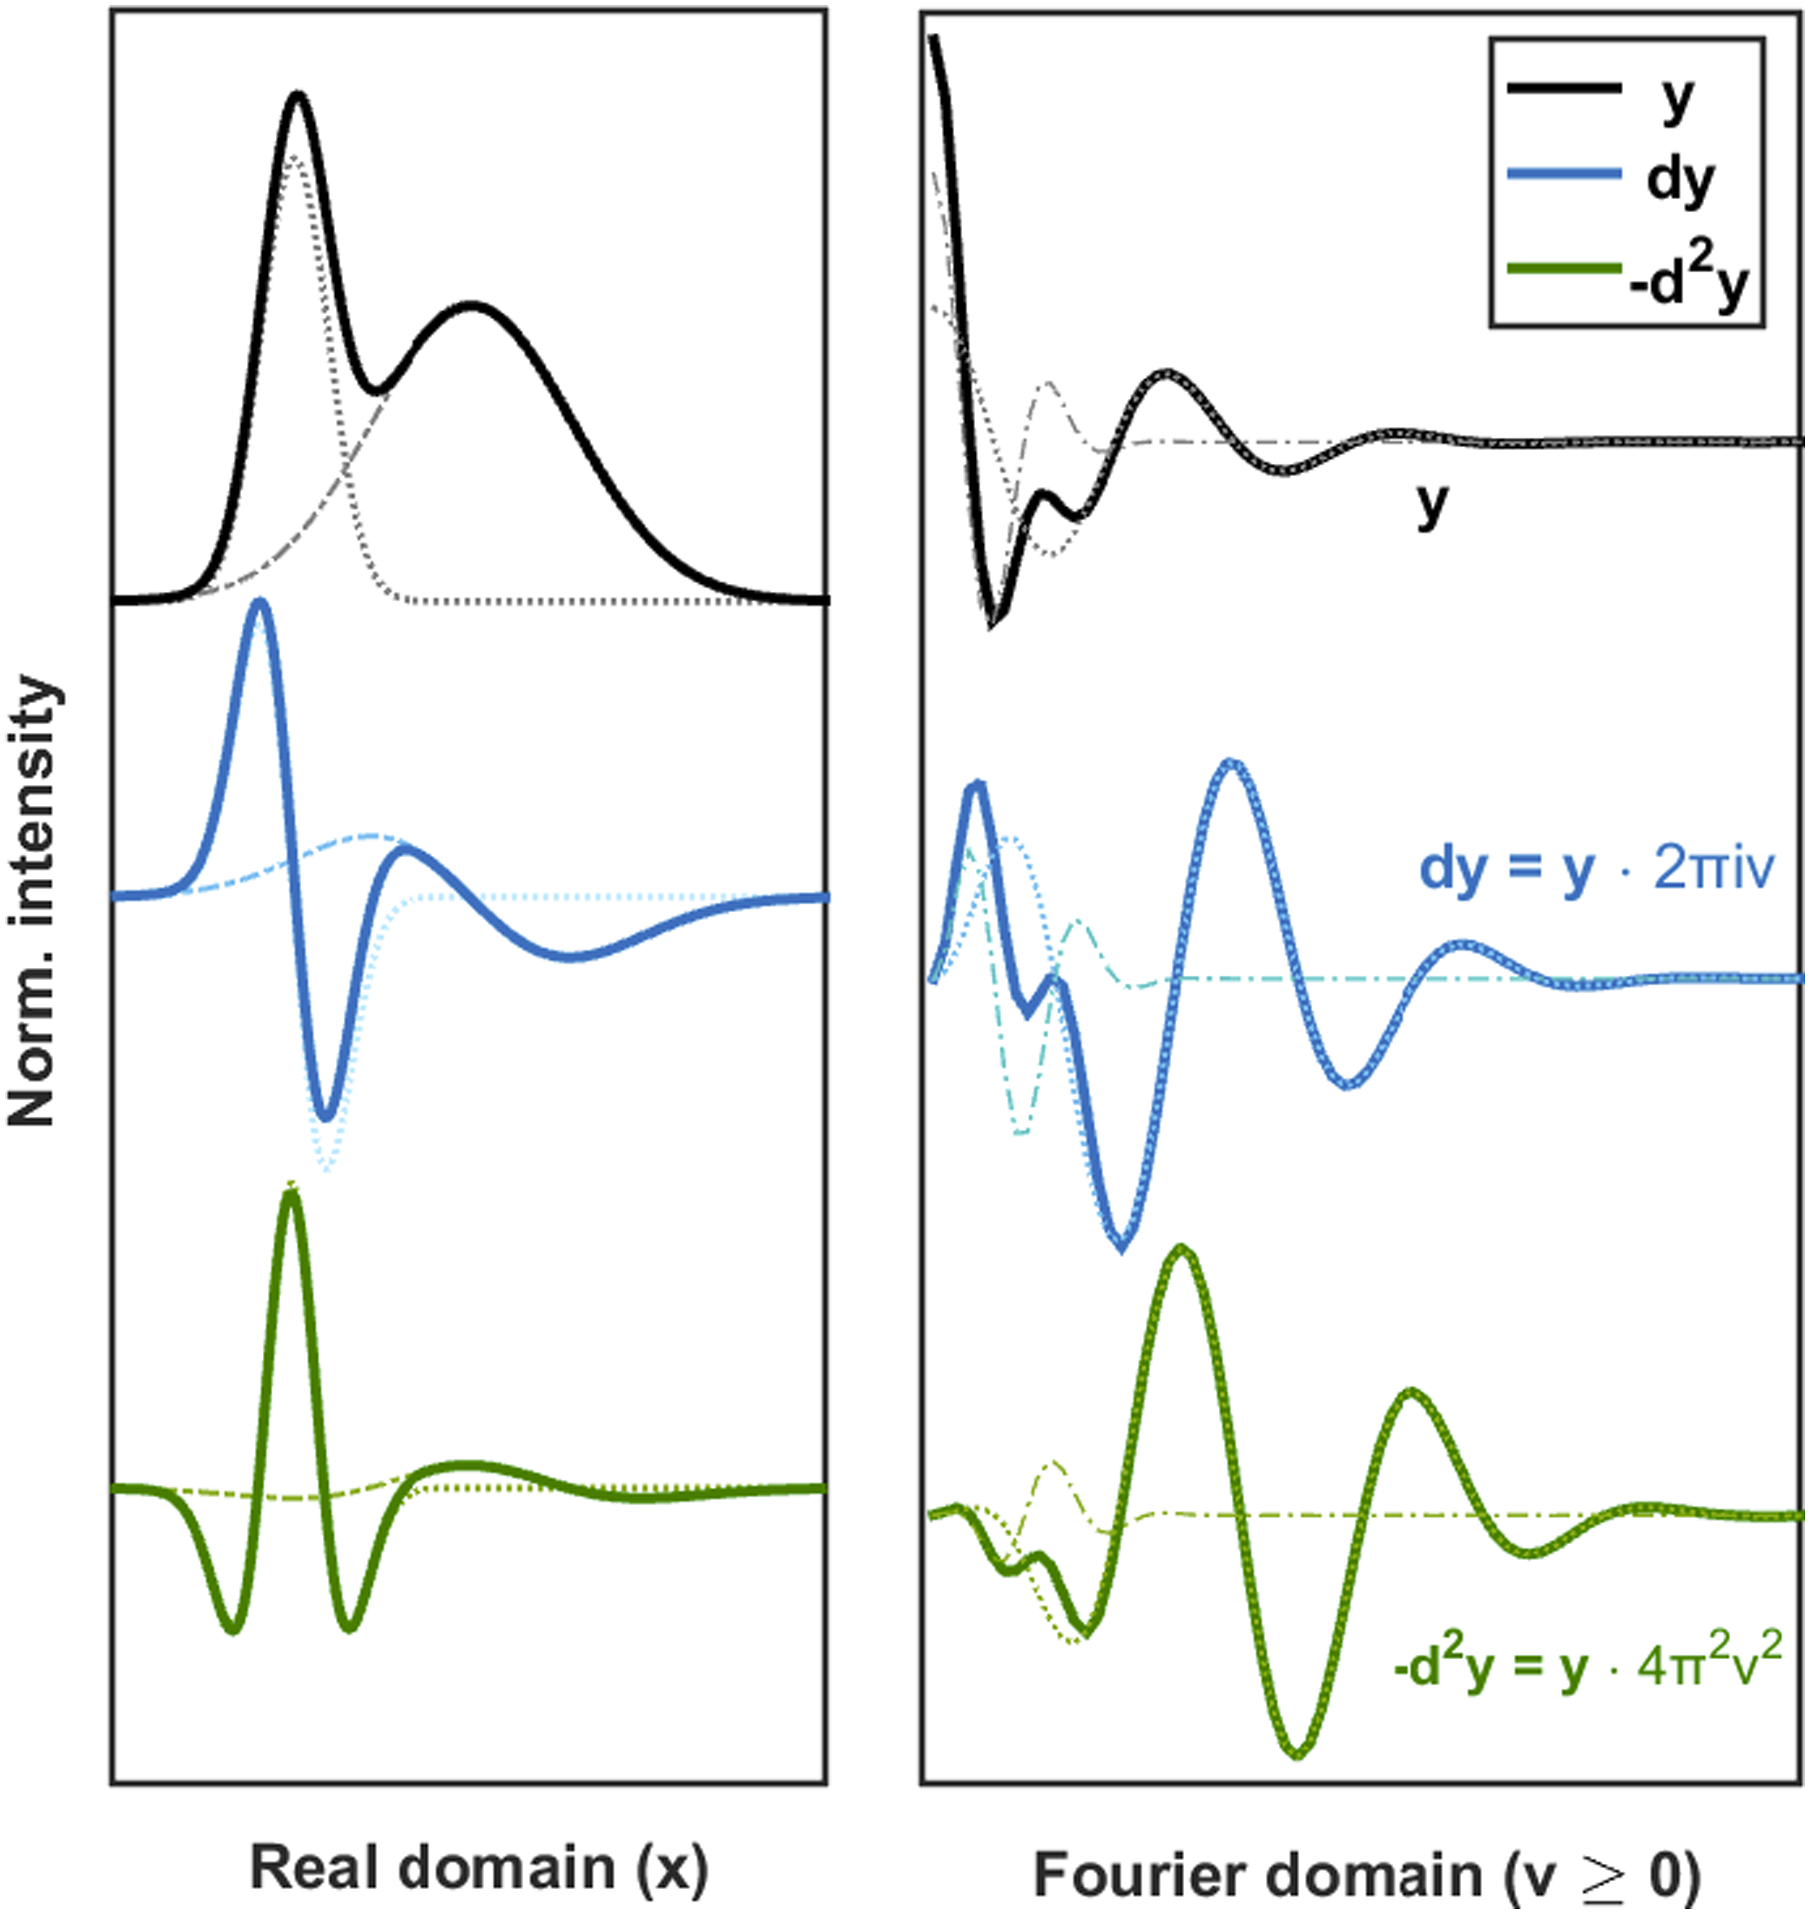
This very elegant theoretical concept has, however, one major pitfall in the exact form of the Fourier transform of the spectrum F
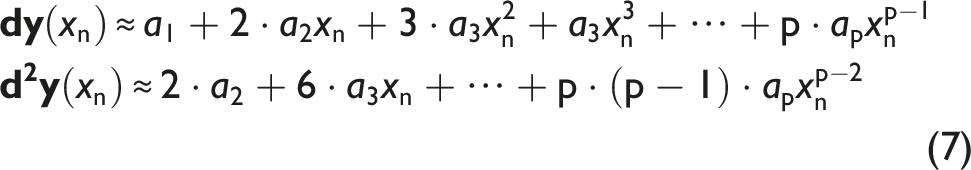
As the derivatives of any order are computed directly according to the exact formula (Eq. 2), no additional approximations are needed, which is an unquestionable advantage of the Fourier concept of differentiation. Hence, in this particular field, the FFT approach takes advantage over the Savitzky–Golay filter, as the latter assumes that the spectrum (signal) in a relatively small range of xn–w – xn+w (known as a data window), can be effectively reproduced with a polynomial curve of the order p:3,9,32
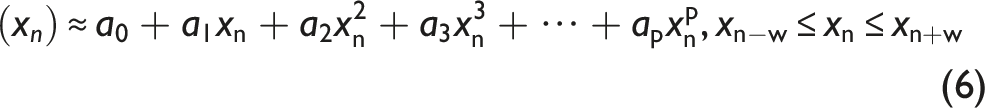
While such approximation tends to be fully reasonable, its implementation has (at least) one significant pitfall. The final output is strongly dependent on the choice of the parameters p (order of the fitted polynomial) and w (size of the data window), which in practice have to be adjusted individually to the particular dataset,13,15 ensuring the effective performance of the algorithm (robustness versus oversimplification; see Supplemental Material). This is not the case for the derivative computation in terms of the Fourier methodology, for which no parametrization is conceptually introduced.
Filtering of Spectra
In contrast to the outlined finite differences methodology (Eq. 1), both Savitzky–Golay model and Fourier transform allow to simultaneously reduce the (instrumental) noise, which can be represented as a set
Procedure of Fourier spectra filtering, schematically presented on the data taken from Figure 1. The crude spectrum (gray solid line) can be represented as the ideal spectrum (black solid line) disturbed by the noise (jagged horizontal line). The FFT of the former is apodized (zeroed) with a low-pass filter function (dashed line), cutting off the chaotic, “high-frequency” fragment of the computed Fourier transform (in the figure its real part is shown), dominated by the noise. In the result, the recovered spectrum (black dotted line) is characterized by a less “jagged” structure.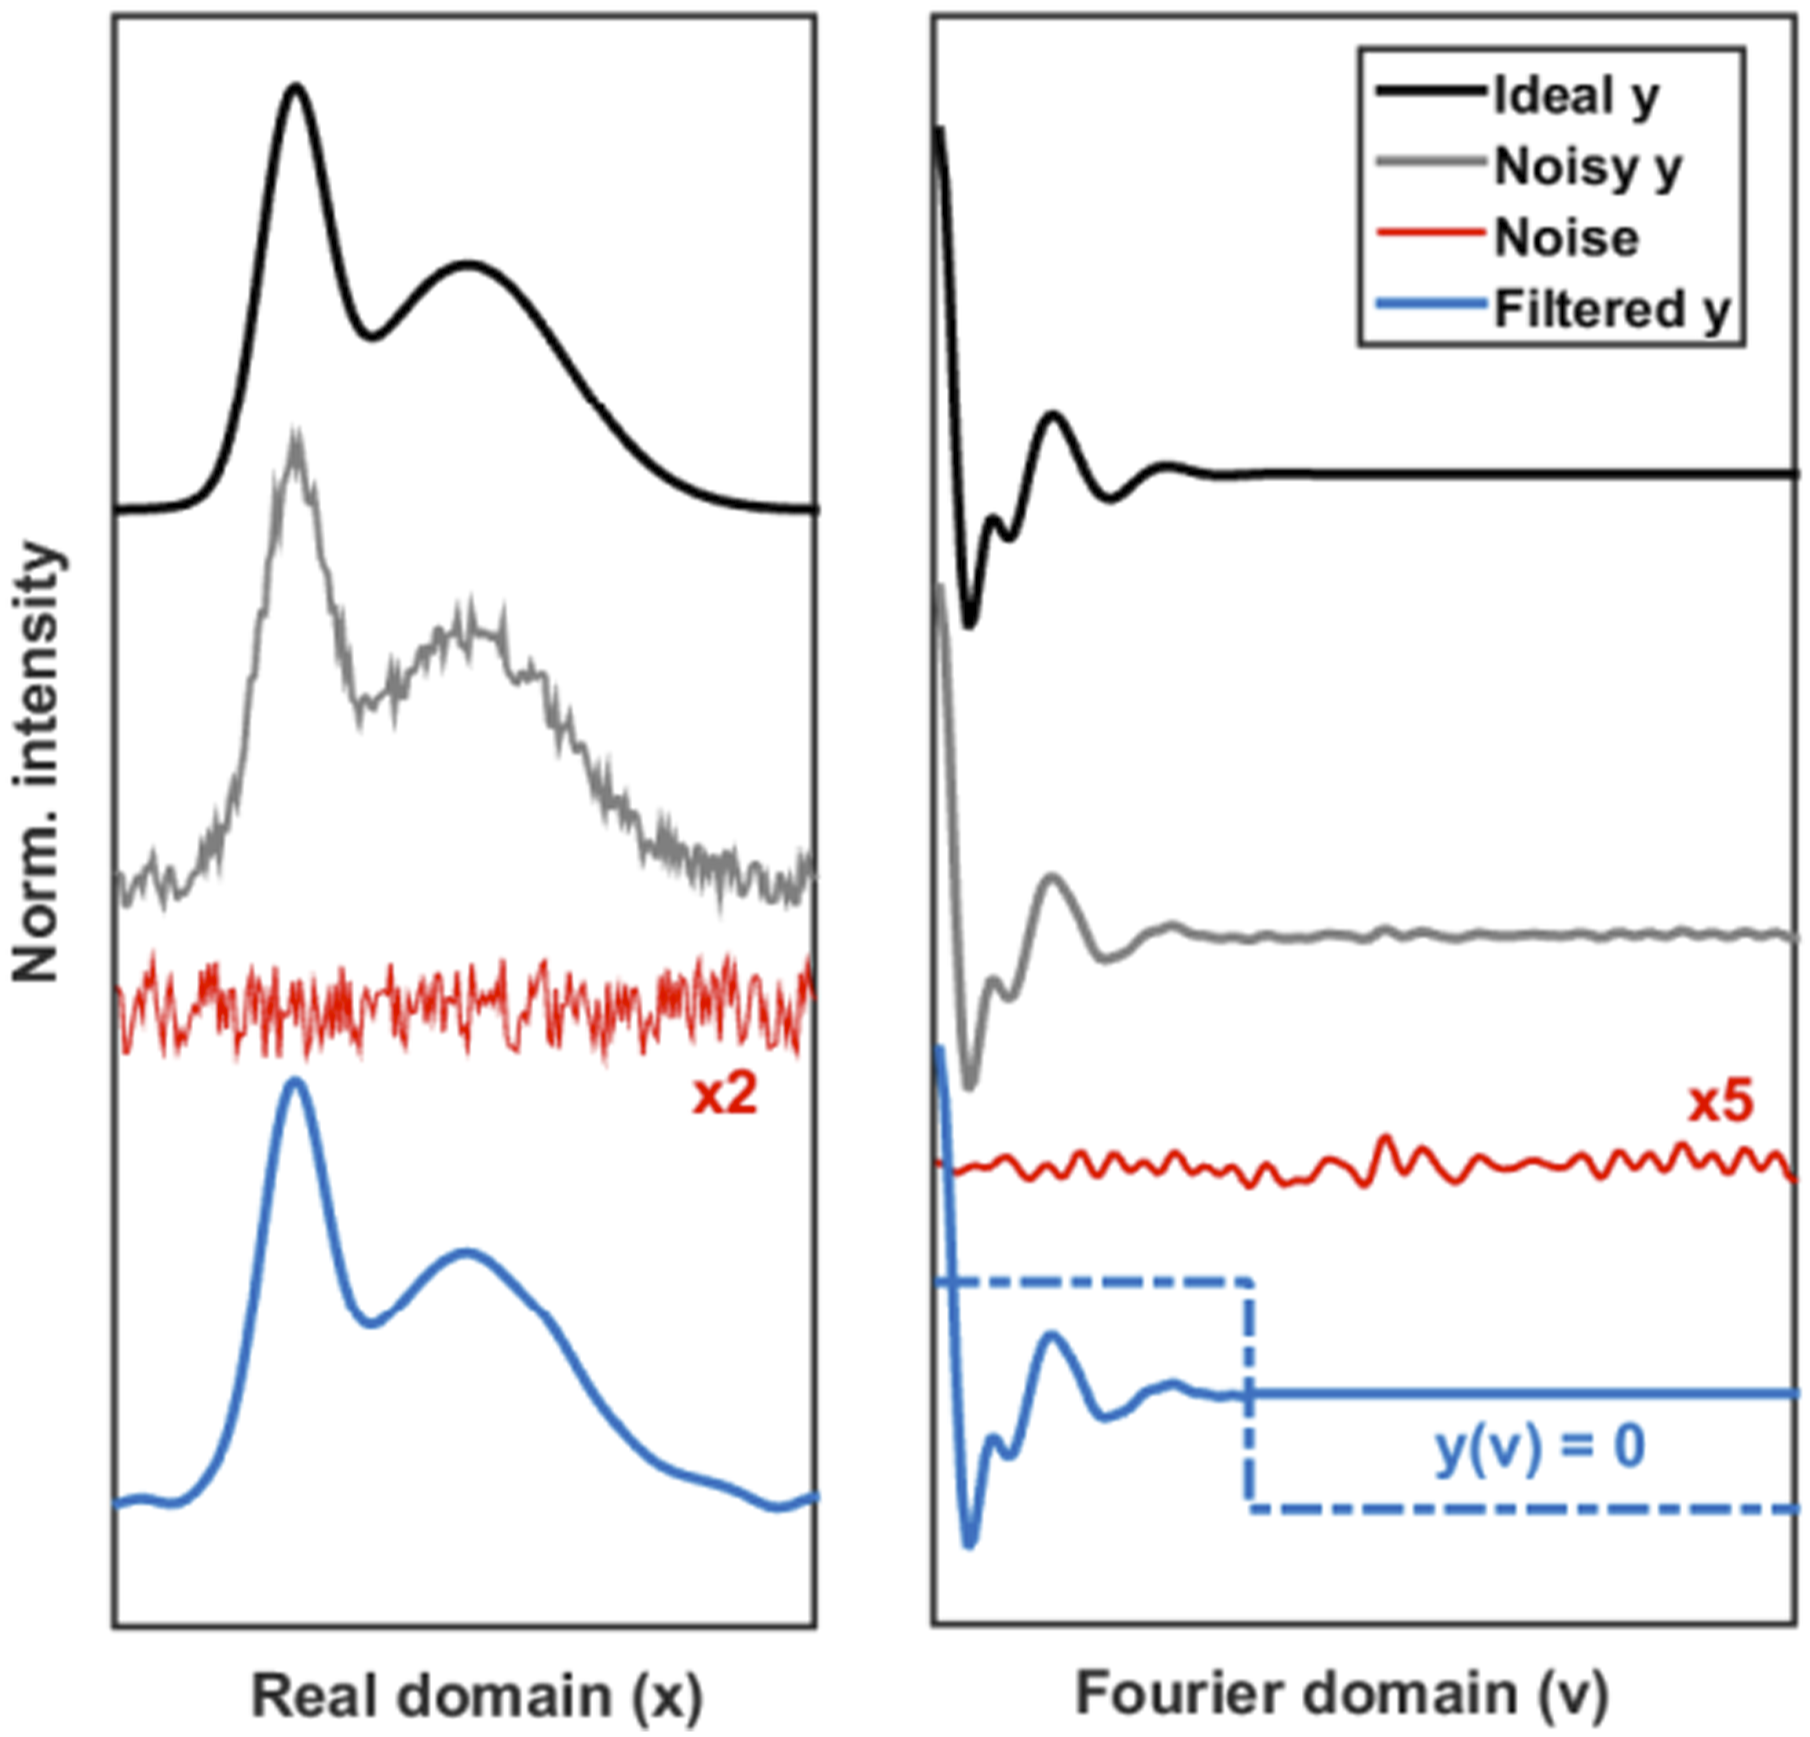

This is crucial especially for the estimation of derivatives of the higher order (see Figure S1, Supplemental Material).3,5,6,27 The concept of the Savitzky–Golay filtering is rather intuitive, that is, “crude,” “jagged” spectrum
Another ingenious, model-free concept on how the spectra may alternatively be preprocessed in terms of the classic methodology has been proposed and implemented by Eilers.
11
The ideal

Finally, the issue of the (instrumental) noise reduction can be effectively addressed using the Fourier related methodology.22,27,33 In principle, the representation of the ideal spectrum

Paradoxically, processing of the signal in such manner may be done without need to formally compute the FFT (see Supplemental Material). The spectrum

Results and Discussion
Regretfully, so elegant in theory Fourier methodology of spectra processing faces several practical hindrances, resulting mostly from the numerical issues.21,28 Two main of such difficulties are shortly reported below, followed by a brief commentary on how the Authors managed to (successfully) overcome them. Some minor remarks on the FFT implementation, on the other hand, can be found in the Supplemental Material.
Effect of the Edge
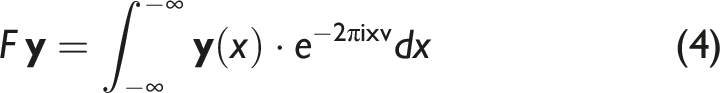
First and the major challenge to be coped with is a so-called “edge effect” or “edge problem”,21,37,38 commonly encountered in signal and image processing. In principle, this results from a discrepancy between the discrete nature of the processed datasets and the continuous character of the Fourier operations performed on them. Due to the very core of the Fourier transform (Eq. 4), the input is expected to be a function defined in the infinite domain of x ∈ (–∞,∞). Yet, the spectra are recorded as the finite sequence of points in the limited range of x1 ≤ xn ≤ xN. Consequently, the regions where the spectrum unexpectedly ends, are prone to a various types of numerical instabilities and for this reason are often being distorted during the data-processing procedure.37,38
A neat solution to overcome this obstacle is to artificially model the near-edge fragments of the datasets (Figure 3).
37
In case of the numerical convolution procedure performed purely in the original (real) domain (Eq. 11), surprisingly effective is to expand the signal by duplicating its edge values (i.e., first and last elements) several times, so that the problematic point is simply moved away from the actual spectrum
38
(Data Filtering Through Numerical Convolution, Supplemental Material). However, when the Fourier transform has to be actually computed, more sophisticated type of the “buffer” should be applied.
37
As the highest stability of the FFT (Eq. 5) is expected for the functions that are continuous and absolutely integrable (Eq. 4) upon N-periodic self-replication,
39
the Authors suggest extrapolating the signal according to the following expression, empirically developed by them for this purpose. Practical implementation of the Fourier transform to differentiation of the ultraviolet–visible (UV–Vis) absorption spectrum of anthracene (data taken from the previous work by Kałka and Turek
41
). Prior to the calculation of the FFT, the original signal 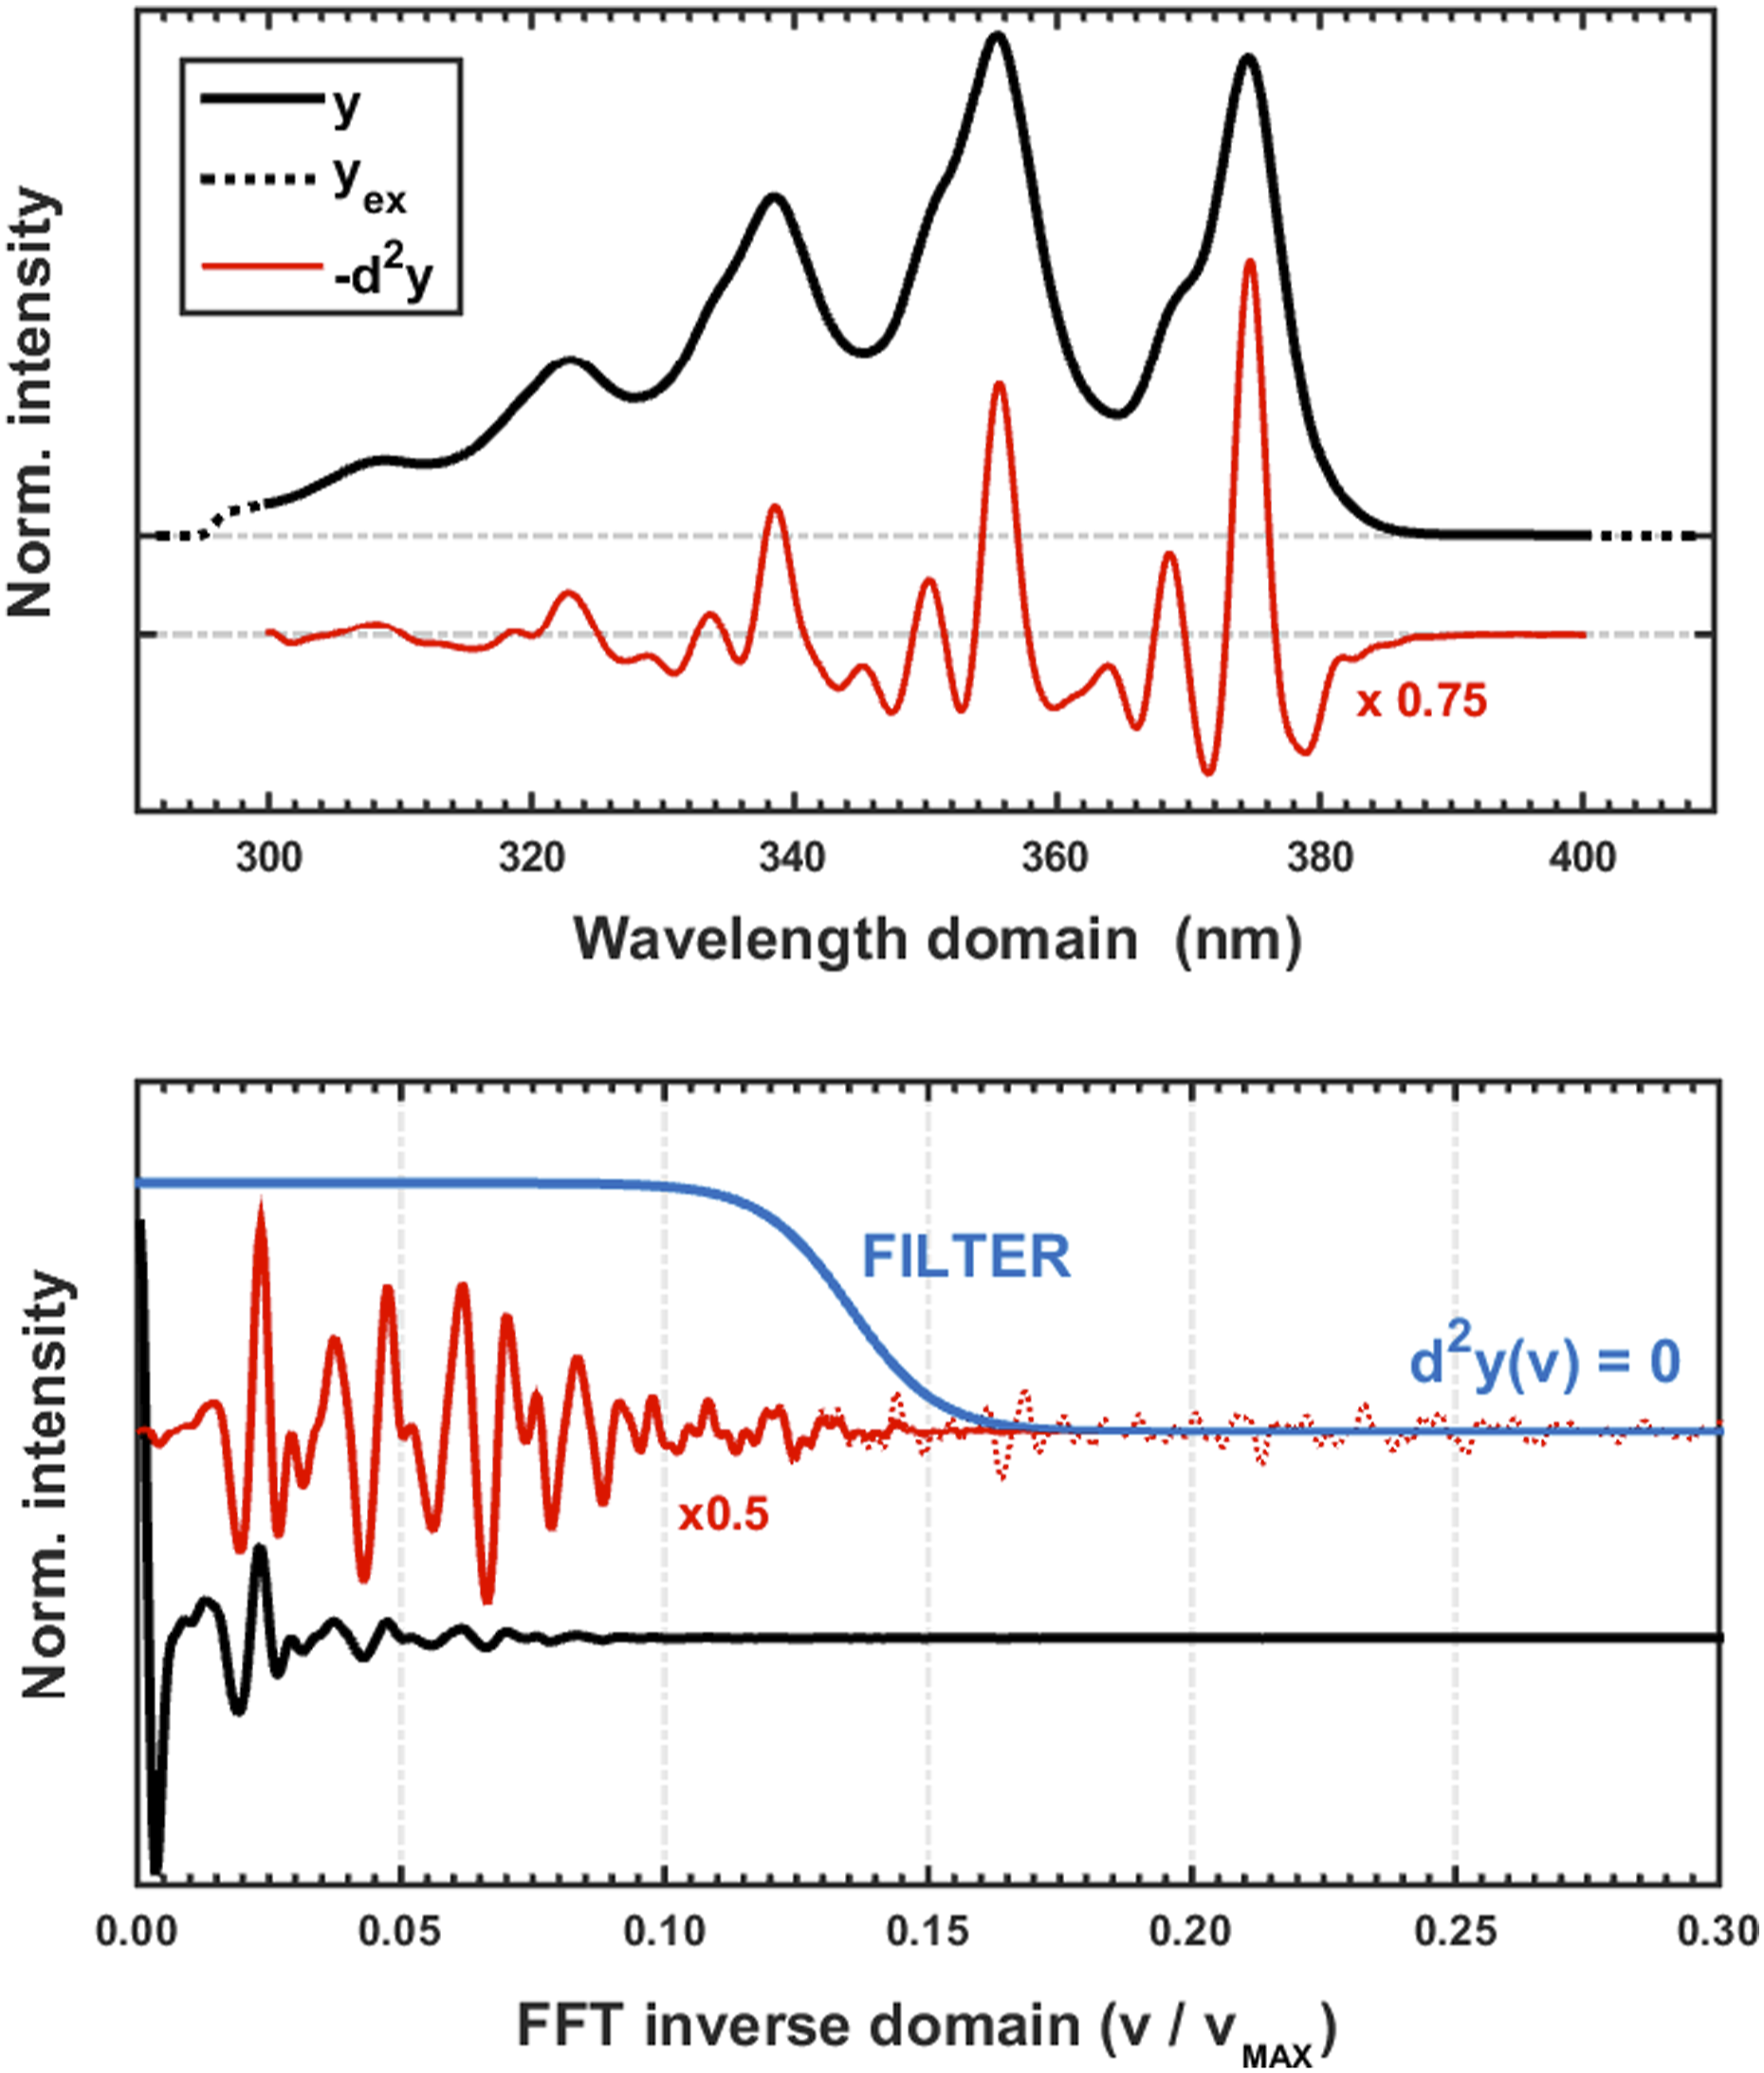
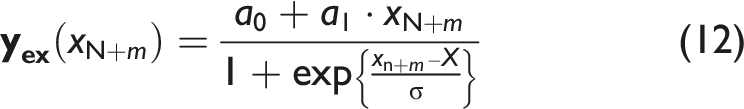
The above formula is a neat combination of two types of functions: a polynomial function (here of the first degree, that is, a linear one), approximating the evolution of the signal beyond the known values (numerator), and the sigmoidal function, dumping its intensity (denominator). The “patched” fragment of dataset
Apodization of the Residuals
According to the formula (Eq. 2), the derivative of the spectrum is obtained by multiplying its Fourier transform with a polynomial term of (2πiν)δ. Hence, the decay of the signal in the inverse domain should be maintained, although its rate would be slightly slower (Figure 1 and the Filtering of Spectra section above).25,27 Yet, due to the numerical accuracy limitations, the FFT in the region of the higher frequencies is usually approximated with close to zero values of a constant, low order of magnitude. Unfortunately, being the result of the performed multiplication, those residuals are effectively magnified and eventually the intensity of the output signal, expected to approach zero, starts to increase to significant values (Figure 3).6,27 In consequence, as its core-product (Eq. 2) is ill-defined, the differentiation procedure may end up with a failure. 6 As the outlined effect is additionally enhanced by the noise, the Authors suggest to smooth the spectra prior to the derivative calculation.
Therefore, in order to overcome the indicated numerical problem, apodization of the high-frequency fragment of the FFT can be applied.5,27 For this purpose, the Authors suggest using the already introduced sigmoidal function (cf. Eq. 12) as a low-pass filter
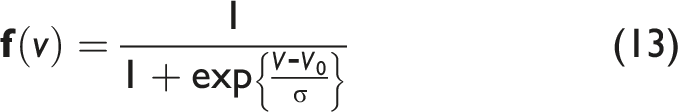
Such an ingenious solution has at least several advantages: the dumping of the signal is done in a continuous way, the core low-frequency part of the FFT remains practically unchanged, and finally the cutoff can be easily modified by adjusting parameters ν0 and σ, respectively (Supplemental Material). Ultimately, it is relatively straightforward for practical implementation. For all the reasons mentioned above, the Authors encourage to use this type of function also as an effective noise filter, alternatively to the classic bell-shaped profiles.1,24
Practical Realization
The Fourier approach to spectral processing, as well as several other concepts,3,33 namely, by Norris–Williams,3,35 Savitzky–Golay,9,32 and Whittaker (Eilers),11,19 have been successfully implemented by the Authors in a form of two shared functional routines (see Supplemental Material) coded in the well-known Matlab environment that is particularly suitable for scientific calculations (and is thus expected to be also compatible with the open source GNU Octave software
40
) and validated on the actual spectral datasets (e.g., Kałka and Turek
41
). The first script is dedicated to smoothing of the signal (
Conclusion
The main purpose of the paper was to show that processing of spectra does not have to be equivalent to the application of the Savitzky–Golay filter. By outlining at least a few alternative concepts, the Authors hope to encourage other researchers to seek for and to deliberately choose the most adequate technique due to their individual requirements. To initially facilitate this task, a functional, ready-to-use Matlab routine is provided to the readers, supporting several different methods of signal processing. Prominent amongst these is the less intuitive, but extremely potent Fourier transform, details of which are particularly highlighted and elaborated within the article, especially with regard to its practical implementation.
Supplemental Material
Supplemental Material - Searching for Alternatives to the Savitzky–Golay Filter in the Spectral Processing Domain
Supplemental Material for Searching for Alternatives to the Savitzky–Golay Filter in the Spectral Processing Domain by Andrzej J. Kałka, and Andrzej M. Turek in Applied Spectroscopy
Footnotes
Author Contributions
Andrzej J. Kałka: Concept and methodology of the study; software design, development, and validation; writing the original draft.
Andrzej M. Turek: Supervision of the study; writing the original draft.
Declaration of Conflicting Interests
The author(s) declared no potential conflicts of interest with respect to the research, authorship, and/or publication of this article.
Funding
The author(s) disclosed receipt of the following financial support for the research, authorship, and/or publication of this article: The undertaken research and development of the computer routines was supported by the funds of the DigiWorld Research Support Module under the program “Excellence Initiative—Research University” at the Jagiellonian University (U1U/W20/NO/28.11).
Supplemental Material
All supplemental materials mentioned in the text is available in the online version of the journal.
References
Supplementary Material
Please find the following supplemental material available below.
For Open Access articles published under a Creative Commons License, all supplemental material carries the same license as the article it is associated with.
For non-Open Access articles published, all supplemental material carries a non-exclusive license, and permission requests for re-use of supplemental material or any part of supplemental material shall be sent directly to the copyright owner as specified in the copyright notice associated with the article.