
Abstract
A novel approach for cost-effective and temporally resolved in-line combustion gas diagnostics based on spontaneous Stokes Raman spectroscopy is presented in this paper. The proposed instrument uses a multipass configuration designed to increase the scattering generation, giving information about gas species concentrations, including H2 and N2 that are not commonly available from analysis with absorption spectroscopy techniques. The system performs calibrated analysis providing both qualitative and quantitative information about the gas composition. Depending on the application, the device can work with spectra integration time from 0.15 s up to 10 s, with a Raman spectrum ranging from the H2 rotational peak at Raman shift of 587 cm−1 up to the H2 vibrational peak at 4156 cm−1, covering all the Raman emissions of major combustion species. The device response was characterized by a working pressure from 0.7 to 7.5 bar. The instrument prototype has been made completely transportable, designed to operate using a gas sampling system, and ready to be operated in relevant industrial in-line environments.
This is a visual representation of the abstract.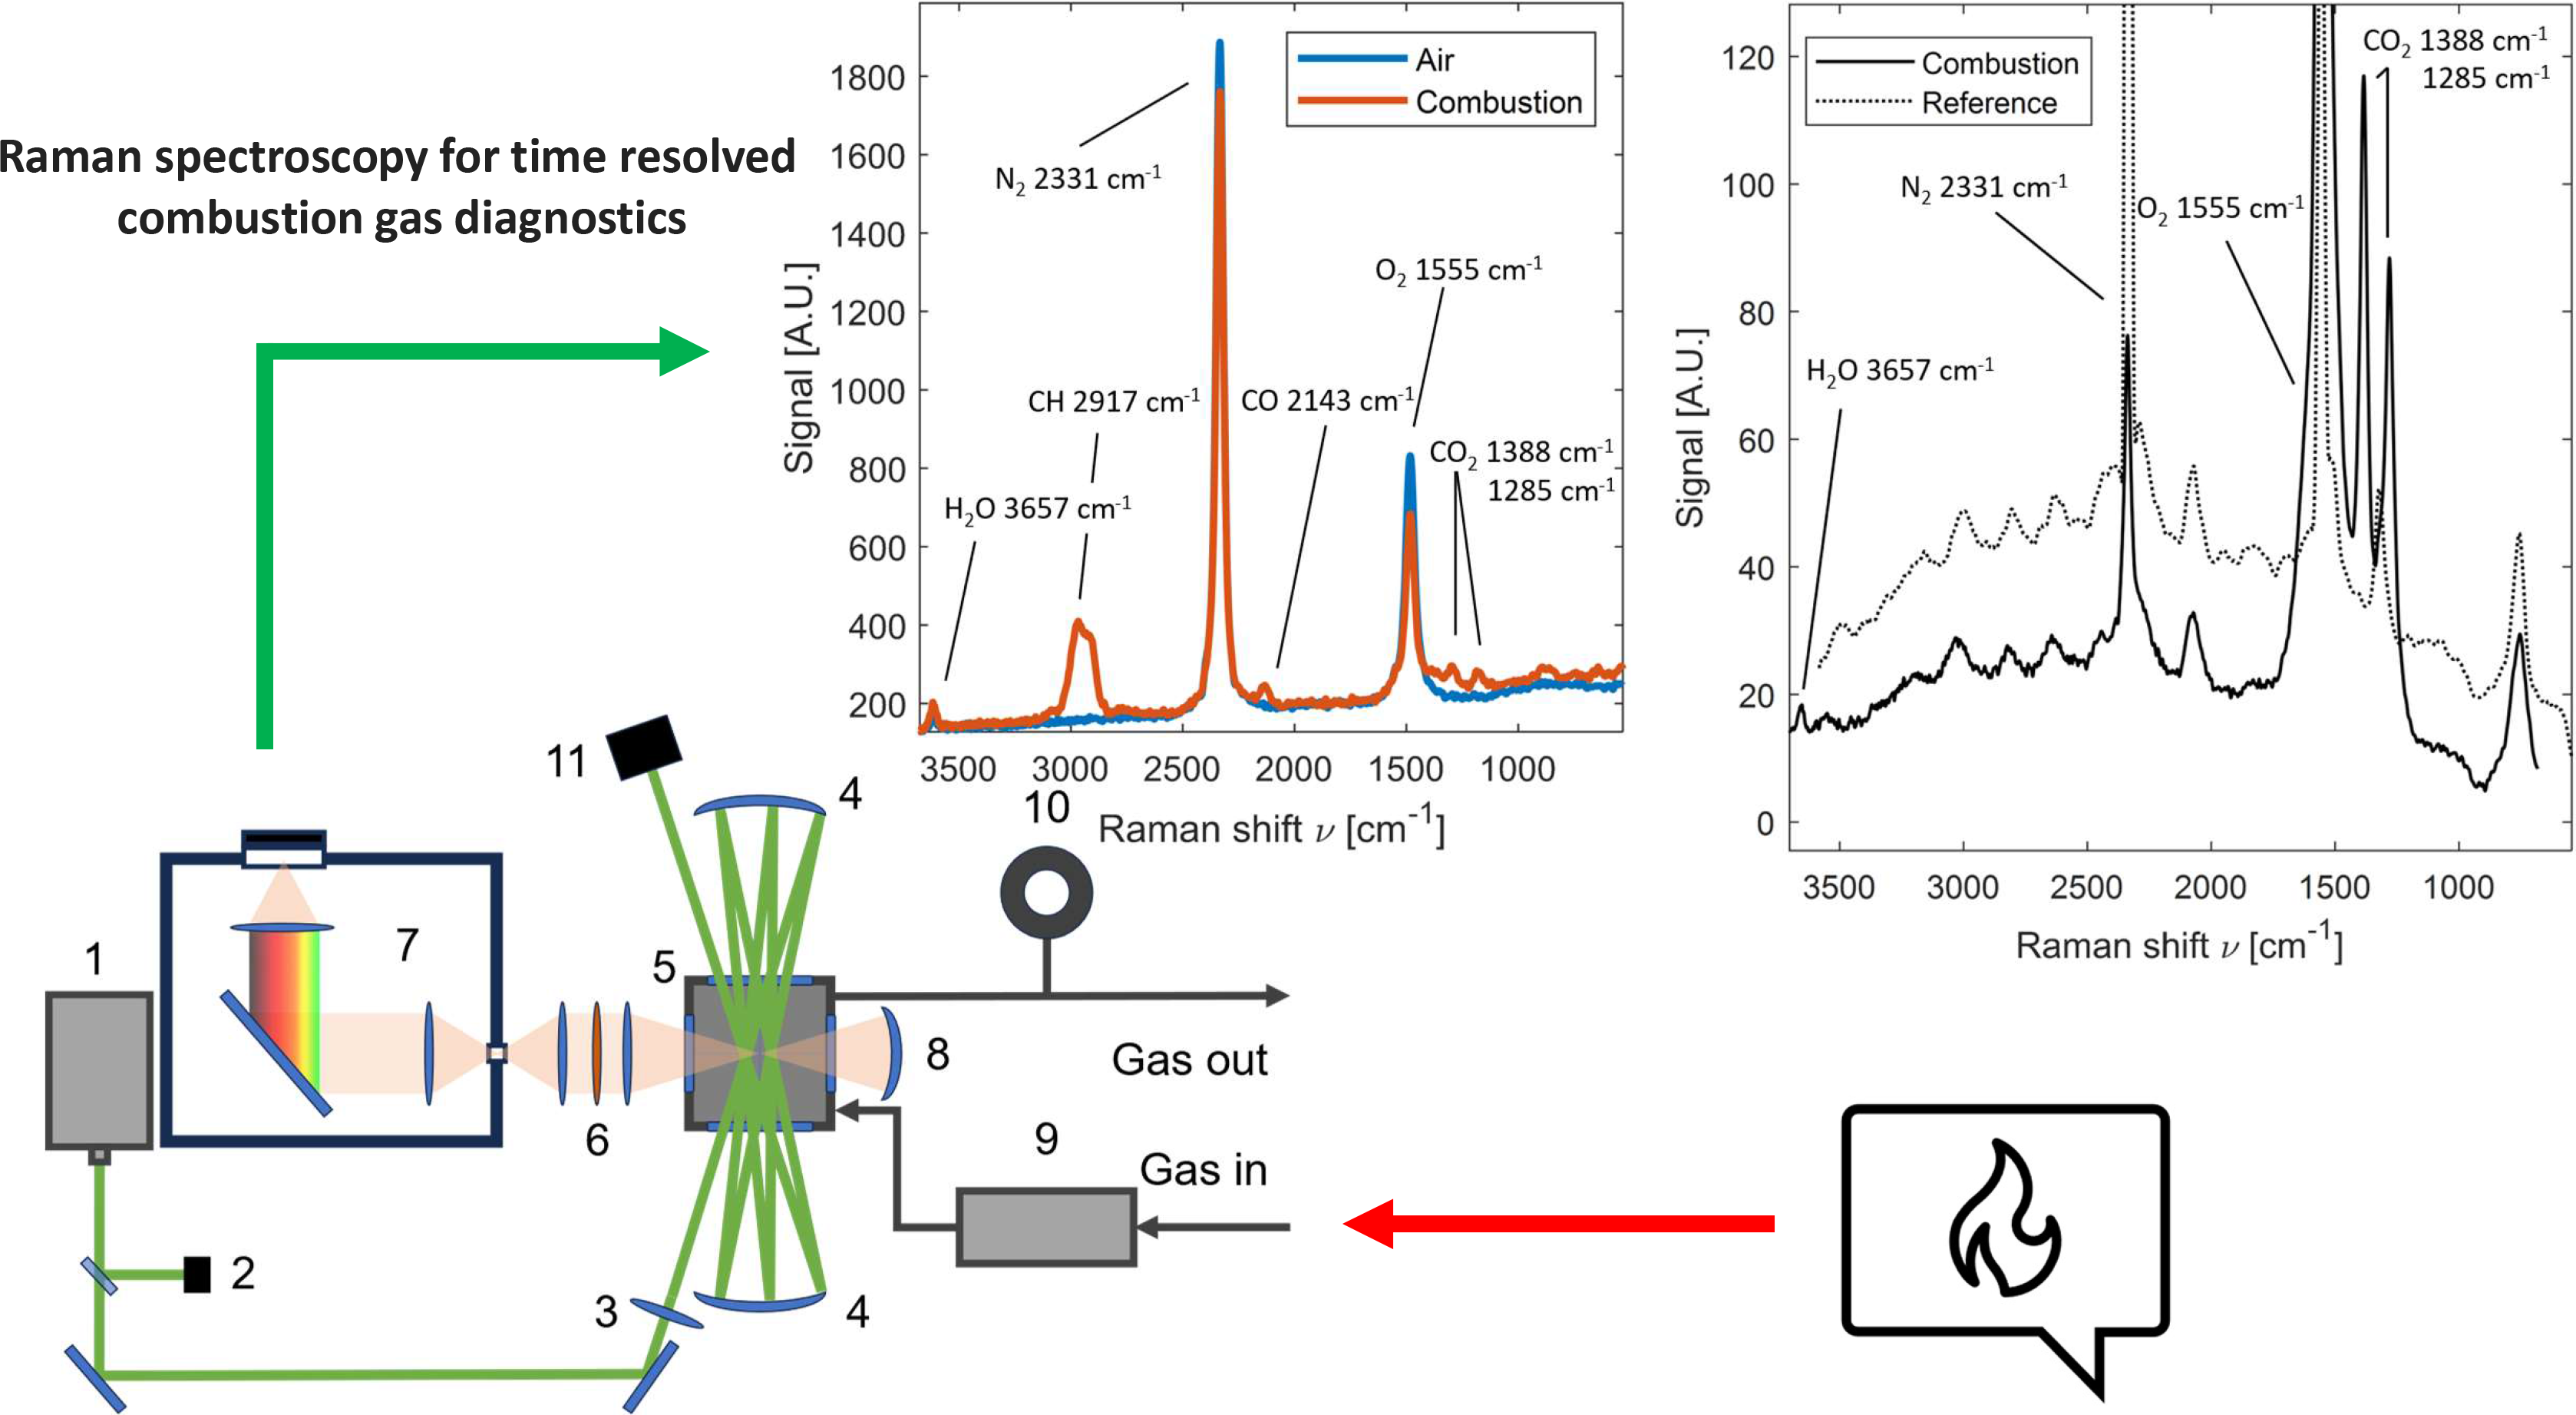
Introduction
In recent years, there has been significant progress in enhancing combustion efficiency, leading to potential cost savings and encouraging the adoption of more environmentally sustainable air pollution policies. The implementation of novel tools and diagnostics techniques is crucial for gaining comprehensive insights into the intricacies of combustion dynamics. Achieving and maintaining a good combustion process requires a high level of knowledge about its dynamics. The primary way to investigate the process is the combustion outcomes analysis. By determining the amount of unburned fuel or unreacted oxidizer it is possible to obtain information about the combustion temperature and quality.
To date, numerous proven techniques for gas analysis are employed in both industrial and scientific sectors. Gas chromatography,1,2 mass spectrometry,1,2 and electrochemical gas sensing2–4 are well-known approaches in combustion analysis. While these approaches ensure excellent detection performance, their most significant drawbacks lie in sample handling and processing procedures, sensor–sample contact, exploitation of consumables, or instrumentation costs. Furthermore, analyses conducted through gas chromatography or mass spectrometry are characterized by a low sampling rate not compatible with the time characterization of combustion dynamics.
Optical methods are a valuable option, offering a high data sampling rate without the need for specific sample preparation and gas carrier utilization. Moreover, they provide non-destructive and contactless analysis. In addition, optical analysis can offer insights into the dynamics of gas presence within the mixture. Prominent optical techniques include infrared (IR) absorption spectroscopy, such as Fourier transform infrared spectroscopy (FT-IR)5,6 or tunable diode laser absorption spectroscopy (TDLAS)7–11 approach, along with Raman spectroscopy. 12
Fourier transform infrared spectroscopy (FT-IR) and TDLAS techniques are based on the same principle: the absorption of radiation at different energy levels by the sample's molecules. FT-IR analysis allows the observation of absorption phenomena across a wide spectrum, providing the capability to detect various types of gases simultaneously. The TDLAS technique investigates the absorption of gases on specific energy bands that are characteristic of the substance being analyzed. This method requires prior knowledge of the gases present in the sample; conditions are not always guaranteed. Furthermore, a dedicated radiation source is usually required for each molecular species under investigation.
An intrinsic problem of absorption techniques is the difficulty in detecting the presence of gas species such as H213,14 and N2. With the rising interest in hydrogen as a green fuel, there is a growing need for the development of advanced tools and diagnostics techniques to comprehensively support its utilization in industrial applications. Furthermore, in the case of combustion that involves the use of atmospheric air as a comburent, nitrogen is the main component of the mixture, i.e., a diagnostics approach that also detects its content could be useful for the analysis of nitrogen oxides.
Raman spectroscopy relies on one of the principles of light scattering.12,15 When a laser source excites the sample molecules, a portion of the scattered light exhibits a characteristic wavelength-shifted fingerprint corresponding to the emitting molecule. The utilization of monochromatic pump radiation enables the observation of various gases with a single source. Furthermore, as it can be operated within the visible light range, the need for IR detectors is eliminated. However, the challenge in Raman gas analysis lies in the low density of the samples, as the amount of scattering is directly linked to the number of molecules within the region of interaction between matter and light.
Raman scattering is a less likely event compared to elastic (Rayleigh) scattering. Consequently, spontaneous Raman spectroscopy is not well suited for trace detection in gases. Major works on Raman spectroscopy applied to gas are represented by Eckbreth 12 for combustion applications and Schrötter 16 for general applications. Relevant application studies were carried out by the research group of Petrov,17–19 Seeger,20,21 and Frosch. 22
The setup proposed in this paper has a 90° configuration based on a multipass cell 17 with a single source at 532 nm. The instrument is calibrated for the detection of nitrogen (N2), oxygen (O2), carbon dioxide (CO2), hydrogen (H2), methane (CH4), carbon monoxide (CO), nitric oxide (NO), nitrogen dioxide (NO2), sulfur dioxide (SO2), hydrogen sulfide (H2S), and water (H2O). For other, unstable or difficult to calibrate chemical species, it is possible to retrieve qualitative information.
Previous studies have confirmed the applicability of Raman scattering in gas sample analyses with single20,23 and multipass setups.19,24,25 The multipass approach is known in the Raman gas spectroscopy, this system is designed to increase the spontaneous Raman scattering production in order to intensify the collected signal. For example, similar configurations were applied by Schluter et al. 26 to the breath analysis and by Petrov et al. 19 to ambient air composition studies and natural gas analysis. 27 Despite its use for various applications, there is a lack of studies about the involvement of this technique in in-line industrial combustion environments. With this aim our setup is engineered with cost-effectiveness in mind, utilizing mostly low-cost commercial off-the-shelf components.
Experimental
Materials and Methods
Figure 1 presents a schematic illustration of the instrument. The spontaneous Raman scattering is generated inside a windowed gas cell (5) using a neodymium-doped yttrium aluminum garnet (Nd:YAG) 532 nm continuous wave laser (CNI Laser, China) with 1 W of optical power (1) and is focused into the gaseous stream using a lens with a long focal length f = 200 mm (3). The interaction cell is coupled to a system of two spherical mirrors with f = 100 mm (4) to perform 18 reflections of the laser beam back to the focal plane, i.e., 19 passages. This design increases the optical power density in the light–matter interaction region to enhance the amount of generated signal. The scattered light is collected by a system of lenses (6) and analyzed through a dispersion grating spectrometer (7) coupled with an uncooled industrial-grade complementary metal–oxide–semiconductor (CMOS) camera. The addition of a spherical feedback mirror (8, f = 50 mm) has also been implemented, as it reflects the Raman scattering on this side into the spectrometer and approximately doubles the collected signal. Before entering the cell, the gases pass through a system of filters (9) to stop dust and oils. Other components are a photodiode for the laser power normalization (2), a manometer for the pressure normalization (10), and a beam dump (11).
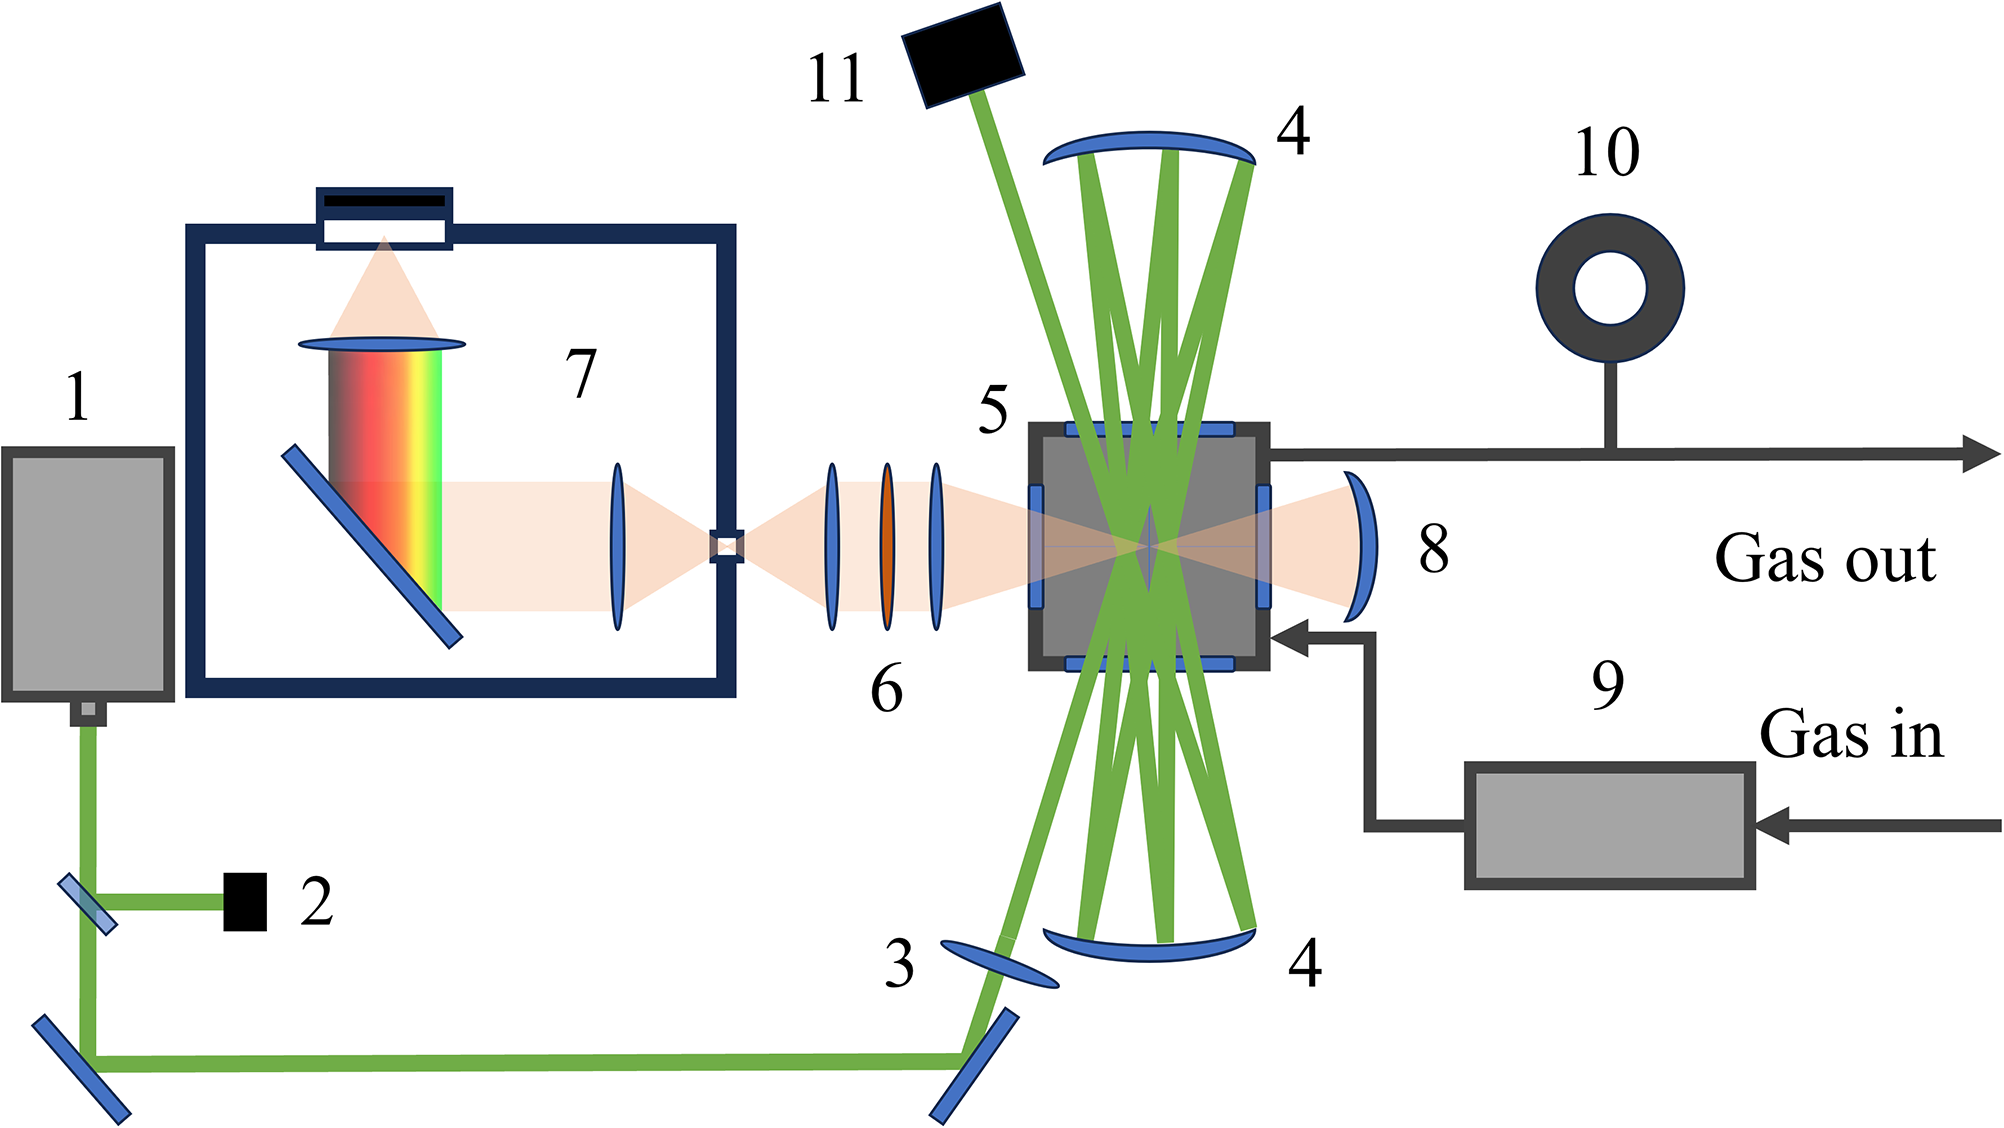
Illustration of the instrument setup.
The cell is made of stainless steel obtained by computer numerical control machining. It is designed to reduce at minimum its internal volume and to operate both above or below the ambient pressure. The windows used are 532 nm V-Coat, λ/4 N-BK7 (Edmund Optics) on the laser sides and VIS 0° Coated λ/4 N-BK7 Windows (Edmund Optics) on the scattering collection sides. The scattering is collected by an optical system composed of a Hastings Achromatic Triplet f = 40 mm (Thorlabs) as a collimator another Hastings Achromatic Triplet with a focal length f = 20 mm (Thorlabs) for focusing the signal on the slit; the focal lengths ratio between this two lenses provides a two times imaging demagnification factor. The strong Rayleigh component of the light at 532 nm is filtered away through a longpass filter with a cut-on wavelength of 550 nm (Thorlabs) placed between the two triplets where the light to be analyzed propagates as a collimated beam.
The scattering detection is performed with a Basler ACE 1920-40 μm camera, an industrial-grade device that uses an uncooled CMOS sensor (Sony IMX249, 1920 × 1200 pixels) with a pixel size of 5.86 μm × 5.86 μm. In ambient temperature operating conditions, the sensor temperature ranges normally between 47 and 52 °C.
The spectrometer used in this setup is an f/2.4, photographic lens-based custom design, it uses a 1200 grooves/mm diffraction grating (Edmund Optics) and has a dispersion of about 10 nm/mm on the detector focal plane. This allows us to analyze a portion of the spectrum that is 113 nm wide with a spectral resolution of 1.82 cm−1/pixel. In order to operate with a smaller amount of data and maintain a short processing time, a 4 × 4 binning is applied to the acquired frame, so the frame becomes 480 × 300 pixels (with a final spectral resolution of 7.28 cm−1/pixel).
The device can detect Raman scattering ranging from the rotational peaks of H2 with a Raman shift (ν) of 587 cm−1 to the vibrational peak of H2O at ν = 3657 cm−1. Additionally, the spectrometer is equipped with a rotation stage to adjust the grating angle, enabling the modification of the detected spectral region to capture the H2 vibrational peak at ν = 4156 cm−1.
The spectrometer accommodates an adjustable input slit (Thorlabs), and it was found that the ideal opening of the slit that minimizes the contribution of diffused light is 550 μm.
The overall instrument has been made transportable by placing all the mechanical and optical components on a custom case with 750 × 450 × 440 mm dimensions. Laser safety requirements are compiled by enclosing the laser beam into a region delimited by safety panels. The optical and mechanical components utilized in the system's implementation are chosen to optimize both robustness and costs.
Methods for Spectral Analysis
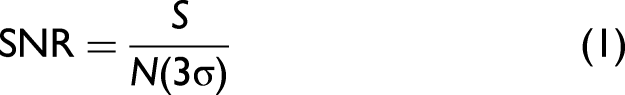
For performance evaluation, the signal (S) is considered as the maximum intensity value of the peak. The noise (N) is defined as three times the standard deviation of the intensity in a signal-free zone of the spectrum. The signal-to-noise ratio (SNR) is computed as:

Quantitative evaluation is conducted using a nonlinear least square fitting method, relying on reference gas calibrations. The calibration spectra are acquired at the same condition as the measurements (pressure and integration time), and they are generated as an average of 100 spectra of gas flows with known composition. Since during the combustion phenomena, the species concentration can vary greatly, the fitting algorithm uses different calibration sets for high and low concentrations.
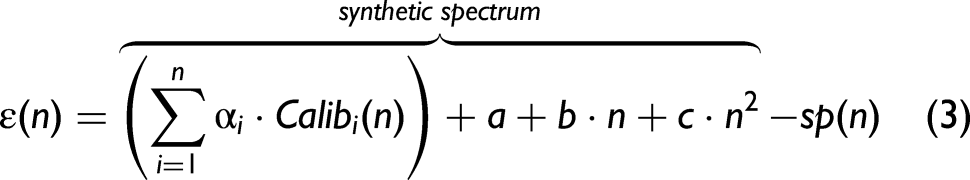
Starting from the calibration spectra of each “i-gas”, a synthetic spectrum is computed as a composition of the calibrations, multiplied by a multiplication factor αi, and a second-order polynomial, for the compensation of diffused light.
The αi factors and the polynomial coefficients are optimized through the nonlinear least square approach to minimize the residuals between the synthetic and the measured spectra. Residuals at pixel n are computed as:
An illustrative example of the fit results is depicted in Figure 2, where the analyzed spectrum consists of 96% N2 and 4% CO2. Notably, the magnitude of the residuals between the synthetic and measured spectra is two orders of magnitude lower than the analyzed signal.
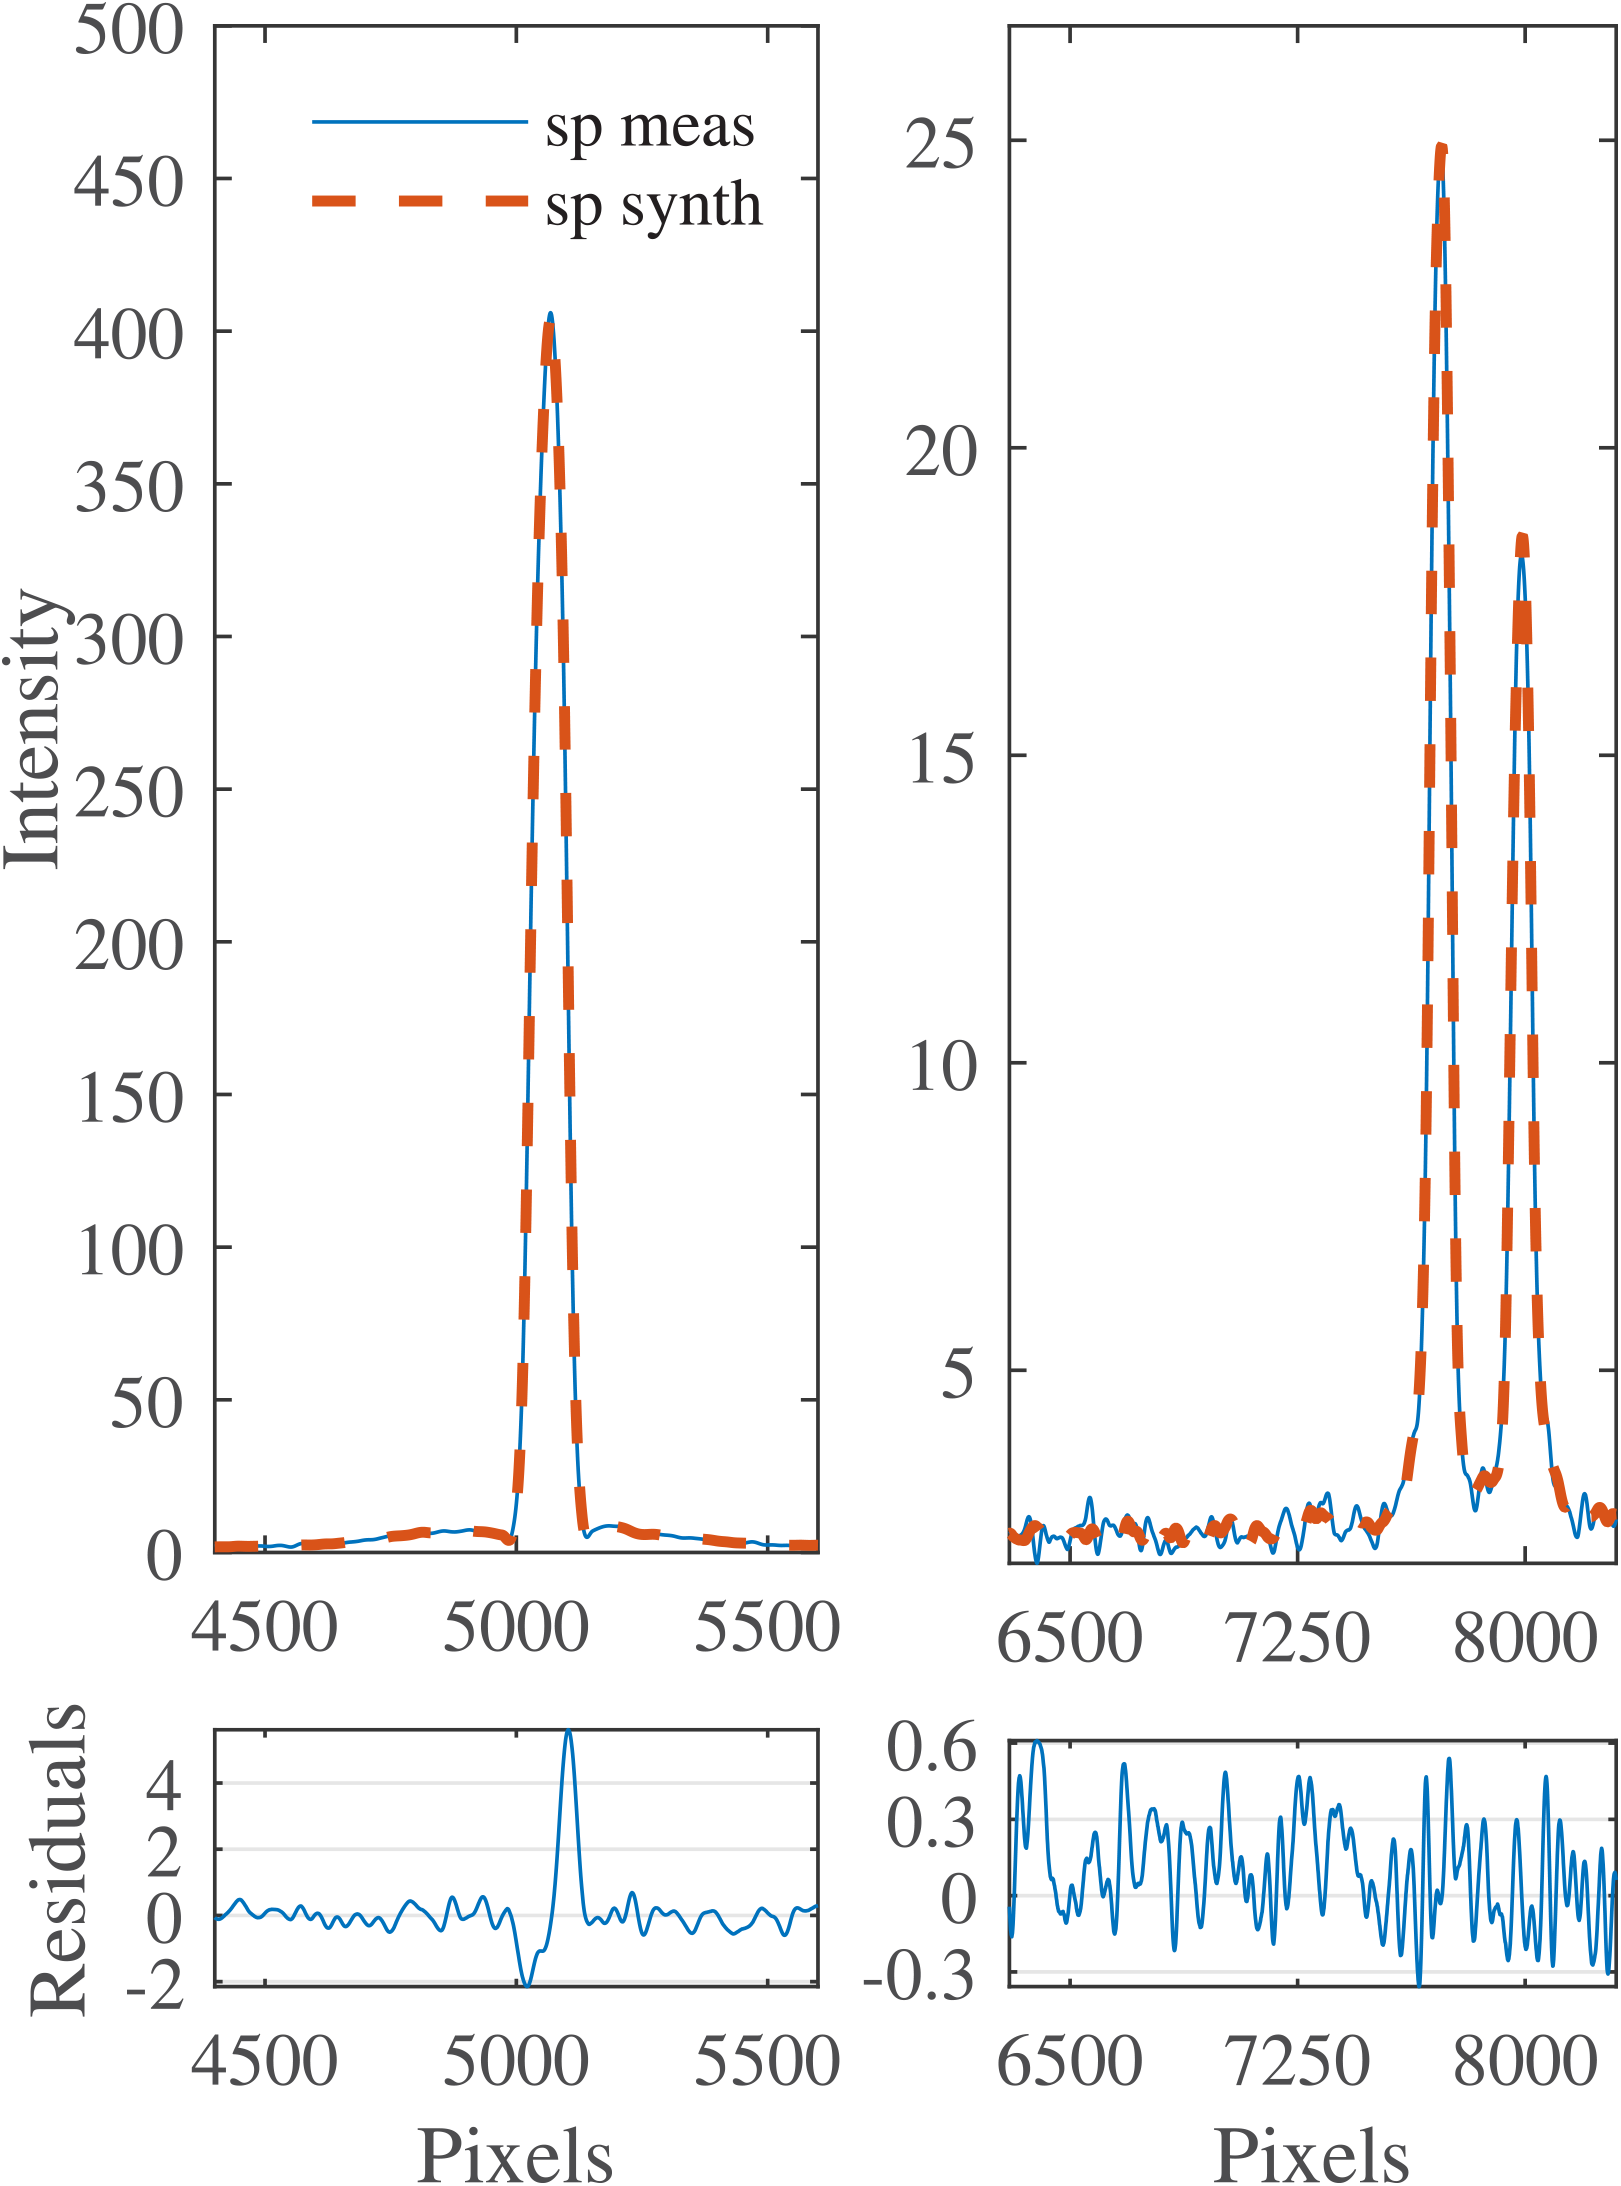
Example of the residuals between the synthetic spectrum (continuous blue line) compared to the measured spectrum (dotted orange line).
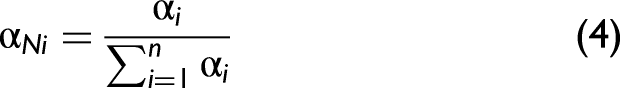
The data on the gas concentration are obtained from the αi multipliers, whose values are normalized to their sum for n gases as
Results and Discussion
Limits of Detection (LODs)
With the aim of characterizing the instrument performance, the LODs were computed in the case of integration time of 1 s and gas flowing at 1 bar of pressure. Referring to Eq. 2, the results for N2, O2, CO2, H2, CH4, CO, NO, NO2, SO2, H2S, and H2O are presented in Table I. The results related to the H2O analysis were obtained with analysis of the atmospheric humidity content.
Limits of detection (LODs) computed on direct measurements.
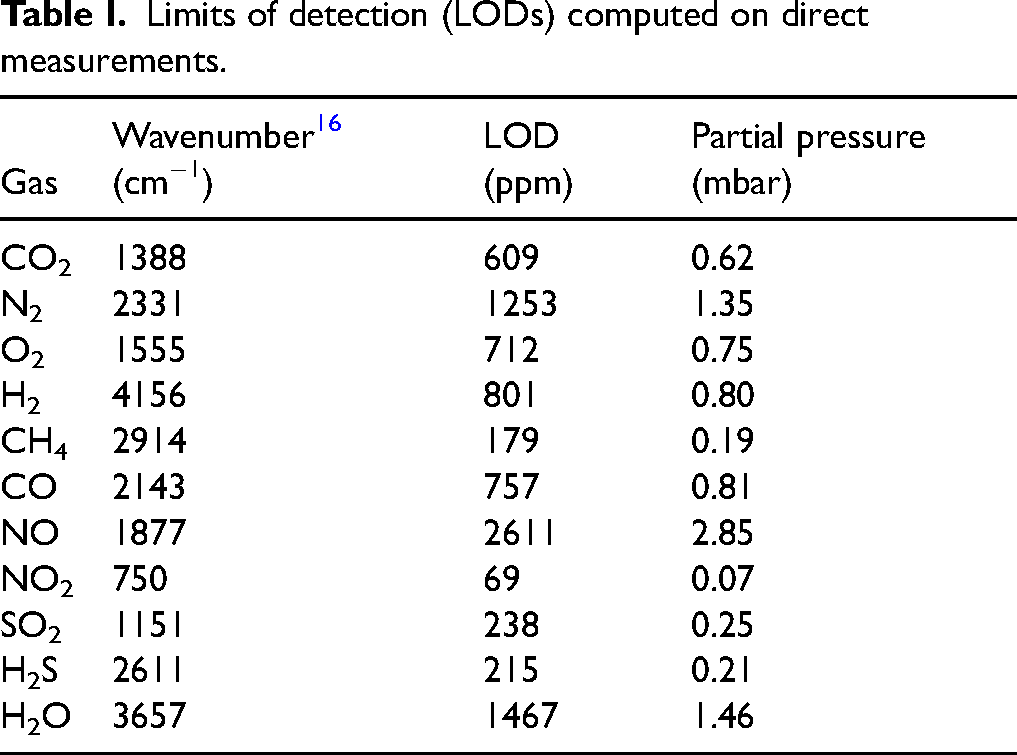
This work presents the LODs only obtained from a direct measure, in first approximation it is possible to extend the analysis of the LOD to every gas scaling the peak intensity by a factor related to the molecule cross-section. 19 For a more accurate estimation, direct measurement is required because also the grating and detector efficiencies influence the performance, as each band has its own characteristic emission wavelength. Moreover, residuals of cross-talk between species may affect the ultimate measurement performance.
A comparison of the 1 s performance of the instrument compared to the single-pass configuration without a mirror was performed. The study was conducted on the N2 vibrational band at 2331 cm−1 on a condition of gas flowing at 1 bar.
The multipass setup (with the addition of the feedback mirror) shows an improvement in LOD performance of about 12.16×, if compared to the single-pass case that presents an N2 LOD of 15 200 parts per million (ppm; 1.52%).
The system can work without the gas cell by directly placing the instrument in the measurement object. In this configuration, the instrument achieves even better results (30× improvement in the SNR compared to the single passage and analysis of ambient air) since the passage of the laser beam through the windows is avoided. However, this solution was evaluated as unsuitable for in-line phenomena diagnostics due to the high volume required compared to the gas cell approach. The high volume represents a critical issue for gas flow handling, introducing a non-negligible expansion of the gas flow.
A further analysis was conducted on the H2 vibrational band at 4156 cm−1 to test the LOD as a function of pressure (for a given integration time) or integration time (for a given pressure). The results related to SNR and LOD variations are presented in Figure 3, here are reported results for 0.15, 0.5, 1, 2, 3, 5, and 10 s of integration time and 0.7, 1, 2, 3, 5, and 7.5 bar of pressure. Values are normalized to SNR and LOD computed at 1 s and atmospheric pressure. As expected, the SNR exhibits a trend correlated with the square root of the integration time and behaves linearly with respect to pressure. This linearity arises as pressure increases the quantity of molecules interacting with the laser source.
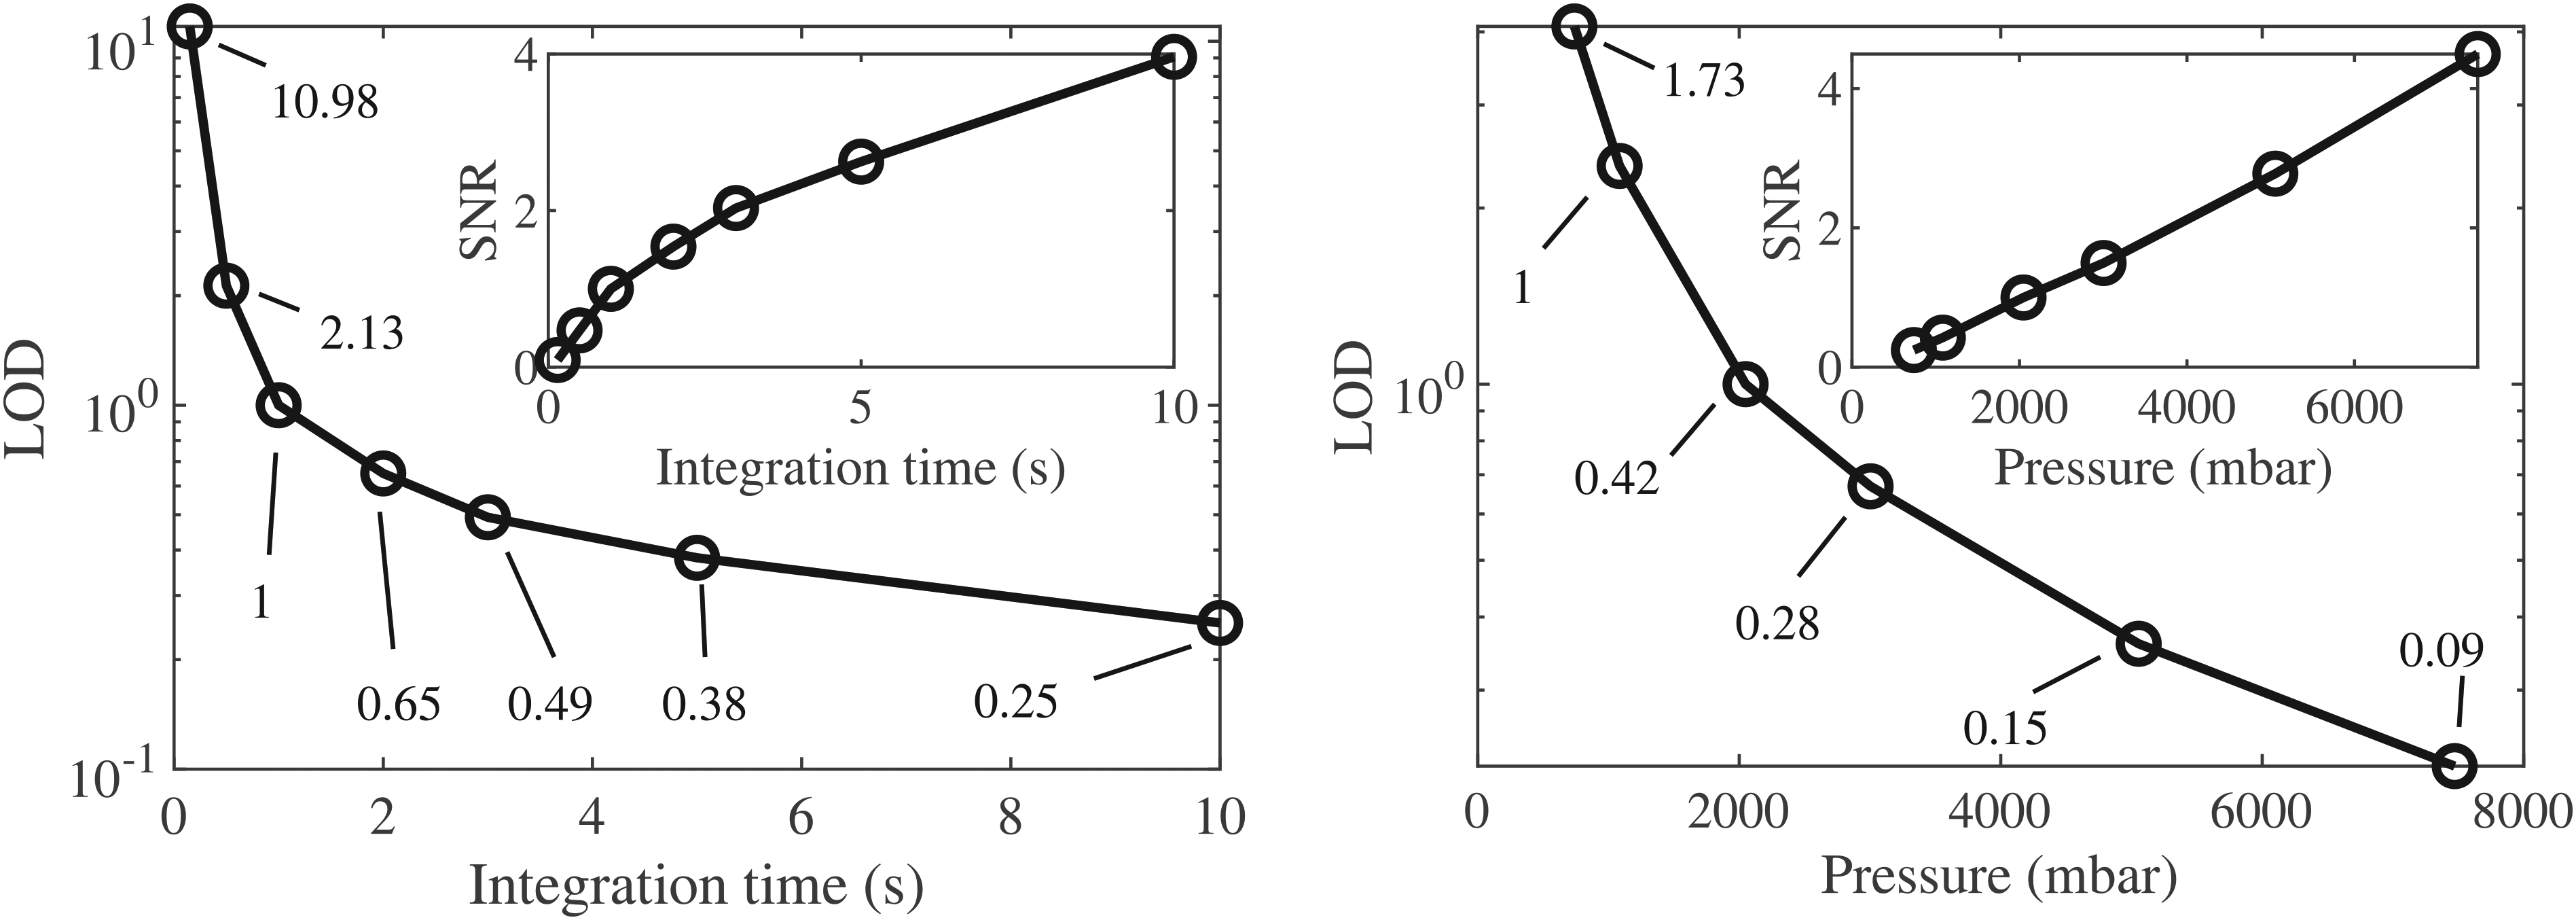
Effect of pressure and integration time on the instrument performance. LOD and SNR normalized at 1 s (left) and 1 bar (right).
From the calibration curves in Figure 3, it is possible to derive correction factors for the results shown in Table I under different conditions. For example, for measurements carried out at 150 ms and 0.7 bar flow pressure, a correction factor of 10.98 is obtained for the change in integration time, and of 1.73 for the change in pressure. The overall LOD correction factor is 19.
Repeatability
Several tests were conducted on different gas mixtures applying the fitting procedure above described in order to quantify the repeatability. These tests were performed on 100 composition measurements in a condition of constant flow composition.
Table II reports the results related to the fit analysis of low concentrations of gas flows conducted at 1 s of integration time and almost 1 bar pressure. Here are reported the mean values (μ) for each detected component, with their respective standard deviation (σ).
Examples of quantitative analysis on gas flow at approximately 1 bar of pressure with a component at low concentration.
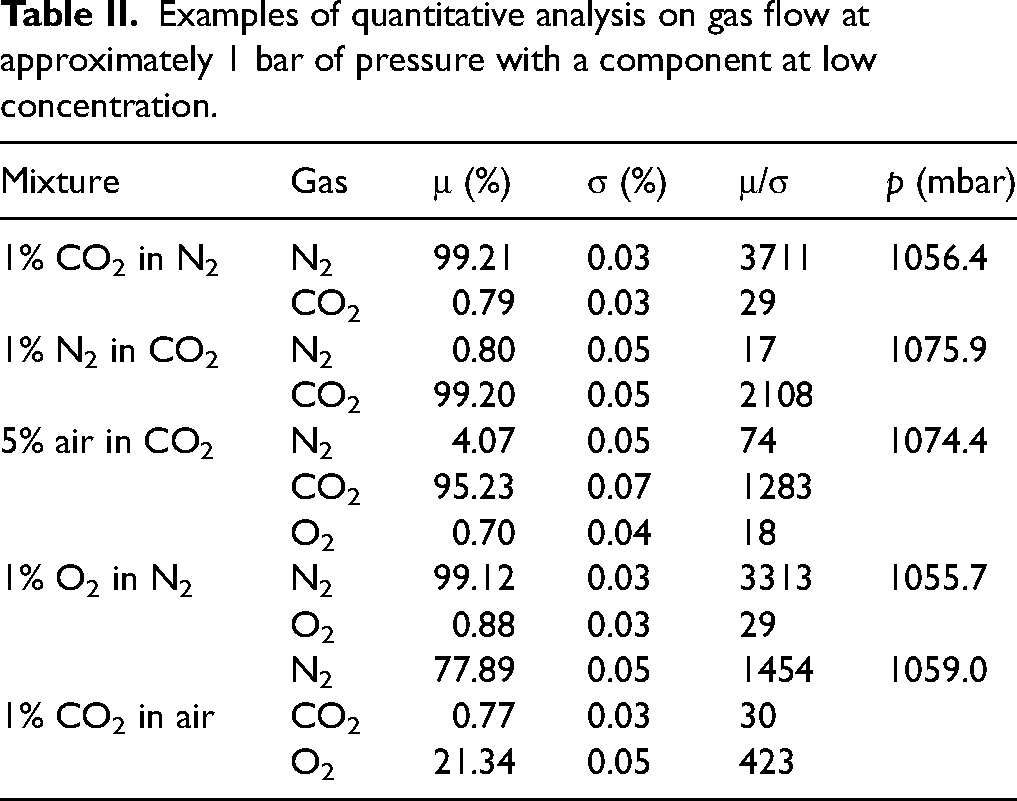
The fitting algorithm monitors the presence of gases within the mixtures, showing a slight deviation from the nominal value, which can be referred to as the uncertainty in the flow controller for very low fluxes. The repeatability of the measurement, as indicated by the fit results, exhibits a standard deviation in the range of 250–750 ppm depending on the gas analyzed.
The use of an argon flow to characterize background light before each measurement was evaluated. However, in the pursuit of crafting a cost-effective and user-friendly tool, this operation was discarded. The marginal improvements observed did not justify the complexity and consumption of a consumable element associated with this analytical procedure.
Qualitative Analysis of Combustion Processes
The instrument is calibrated for the gases listed in Table I. However, any gases not included in Table I remain detectable, excluding non-Raman active species. Although obtaining quantitative information about the concentration of these unlisted species in the analyzed mixture may not be feasible, acquiring qualitative information regarding their presence during the measurement cycle is readily achievable. This analysis can be performed when dealing with gas mixtures comprising chemical species for which precise experimental knowledge of the Raman spectrum is not available, either due to the high reactivity of the species or the complexity of the molecular structures involved or the unavailability of calibrated mixtures.
As a first example a field test of the exhaust of a four-stroke gasoline engine. It has been analyzed during variable engine load conditions; two acquired spectra are reported in Figure 4. The analysis was carried out at a cell pressure of approximately 0.7 bar (as sampling was performed with a vacuum pump and a probe placed at the exhaust muffler to avoid altering engine back pressure) and an integration time of 150 ms. The system recorded the time domain evolution of different gases; in the spectra are highlighted the peaks related to N2, H2O, O2, CO, CO2, and unburned fuel hydrocarbons (CH).
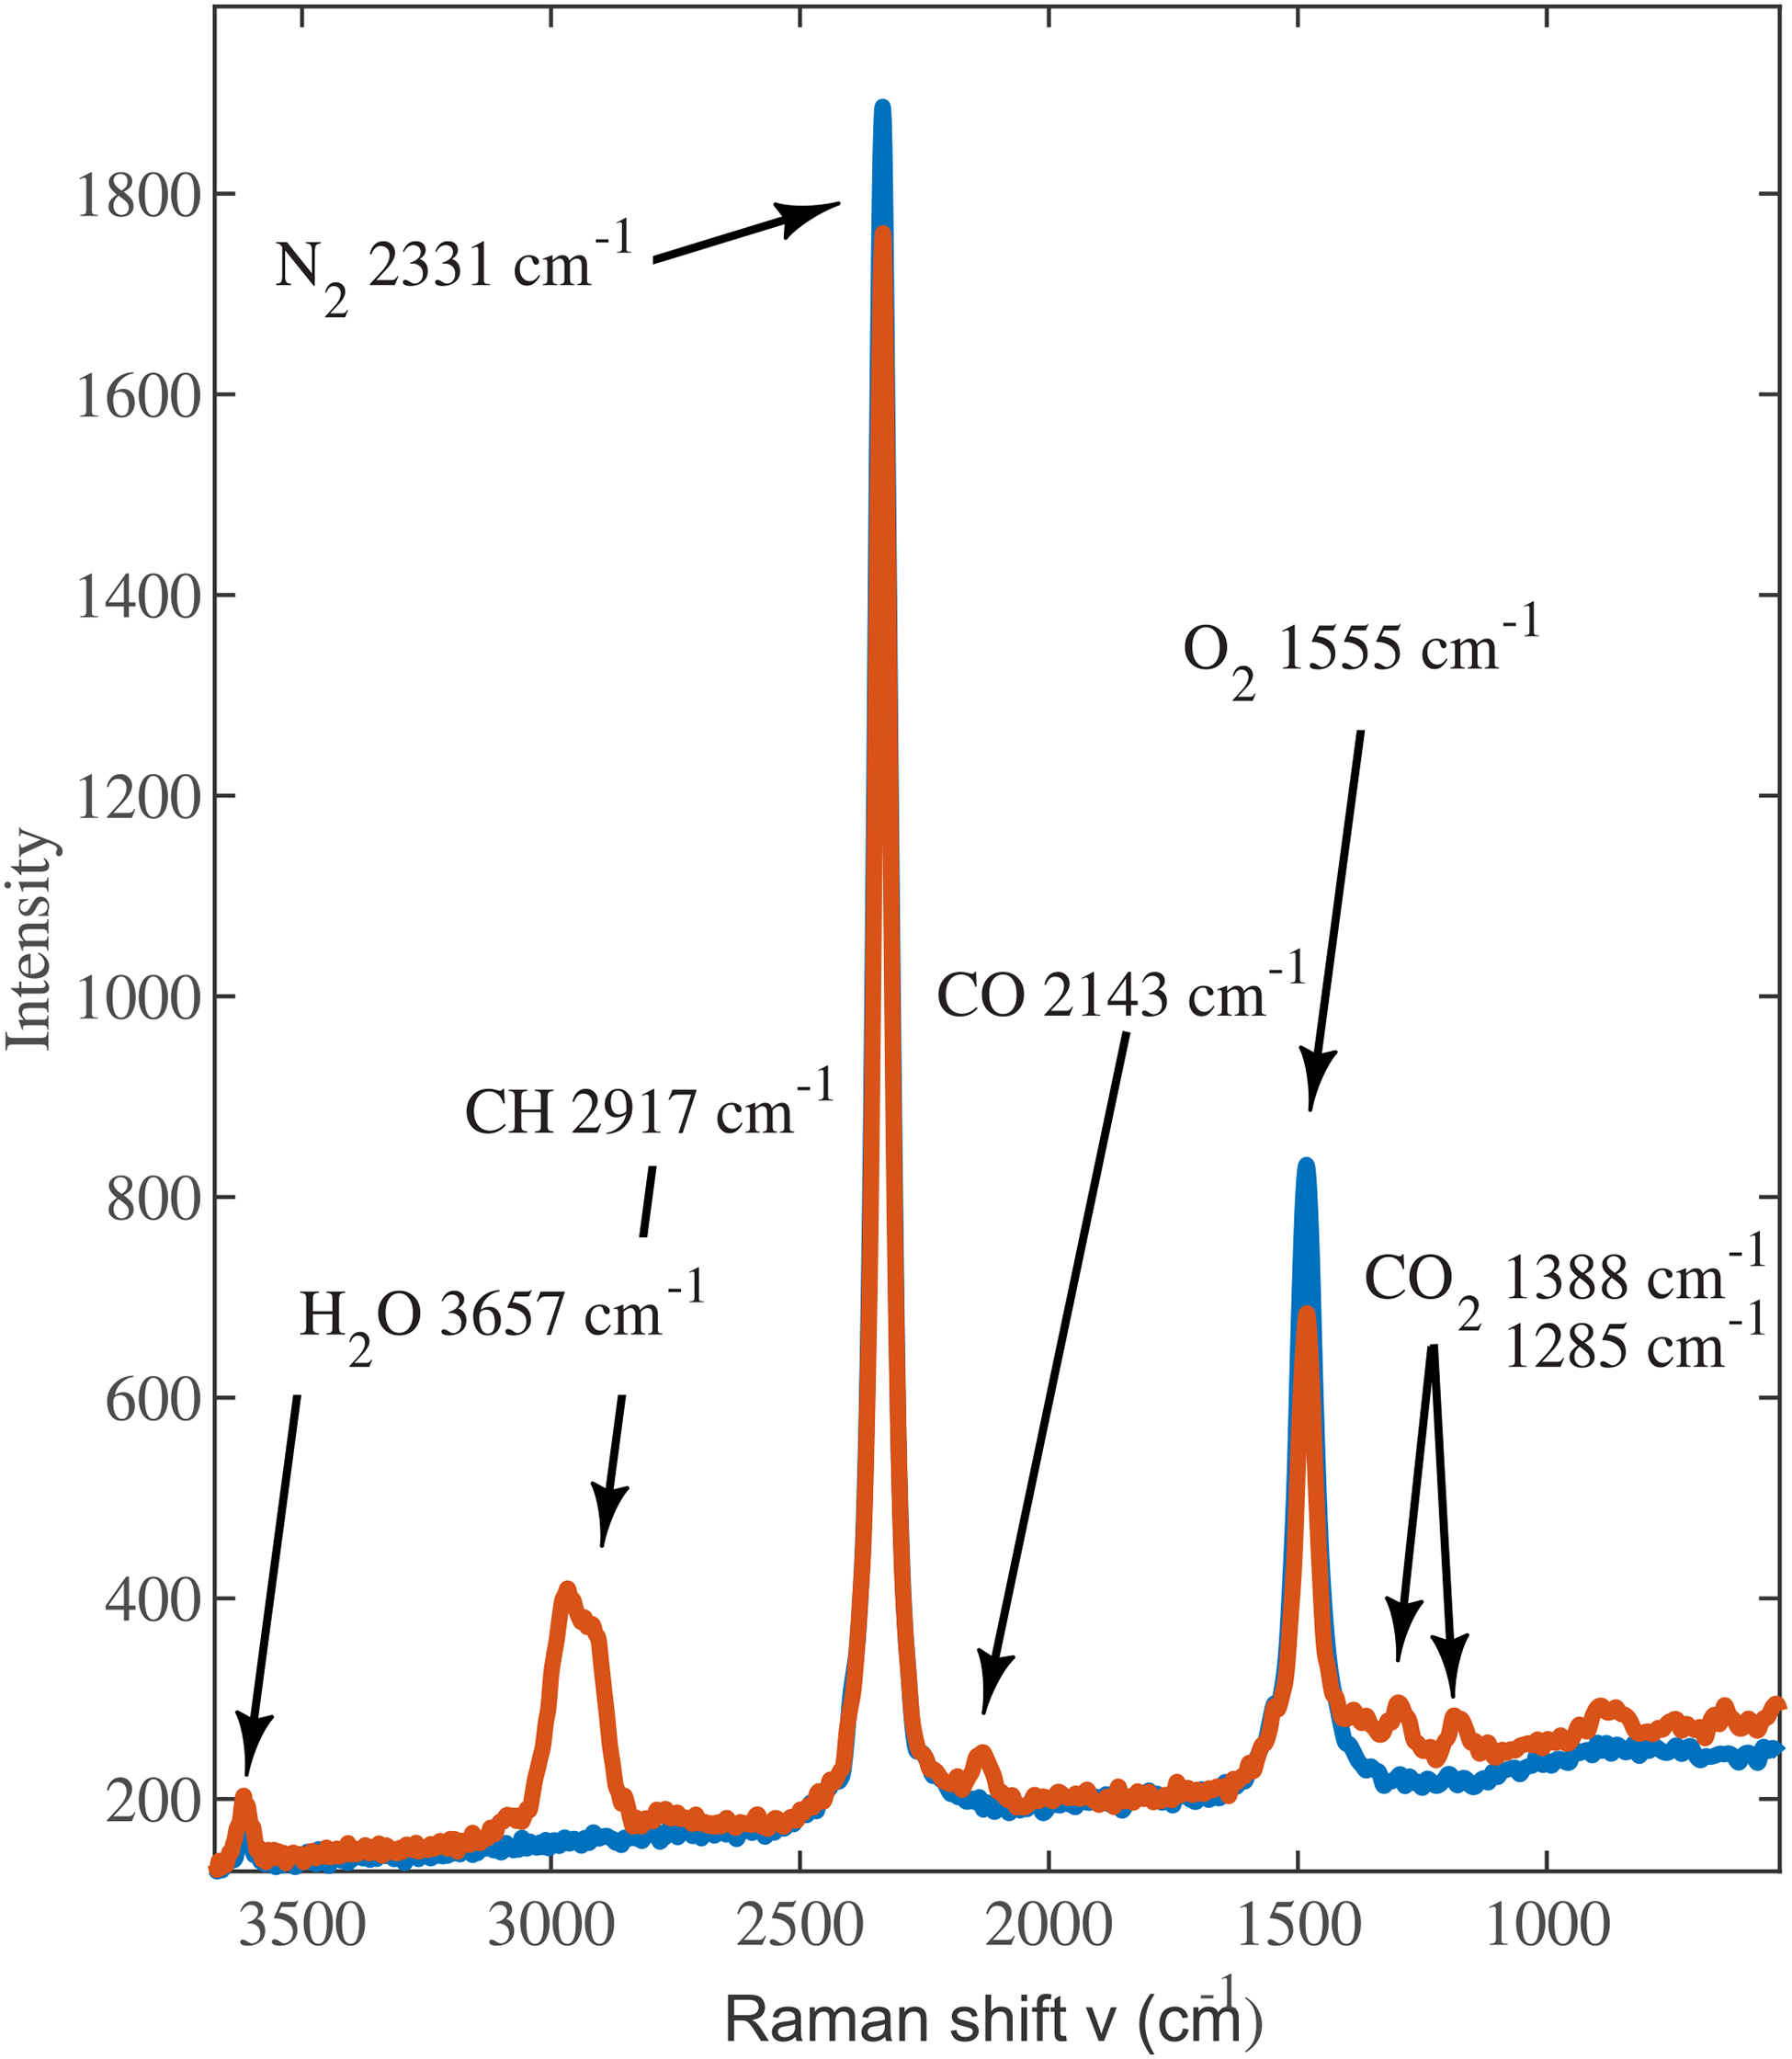
Example of spectra acquired during a combustion test, 0.7 bar and 150 ms of integration time.
In this scenario, the fuel utilized is the standard 95-octane petrol engine. Given its complexity as a compound that breaks down into shorter molecules during combustion, obtaining a calibration spectrum for the unburned fuel fraction is nontrivial. However, a noteworthy observation was the prominent presence of a band in the spectrum's segment associated with the stretching of the CH bond around 2917 cm−1.
Another example is the analysis of high-temperature combustion of urea or CO(NH2)2. The combustion took place in an oven at a temperature of 1350 °C, the environment was characterized by 100% O2. The analysis was conducted with an integration time of 0.5 s and a pressure of 1.2 bar.
Figure 5 presents a comparison between a spectrum acquired during combustion and a spectrum obtained from the analysis of a certified bottle containing a gas mixture composed of 1000 ppm of NO2, 79% N2, and 20.9% O2.
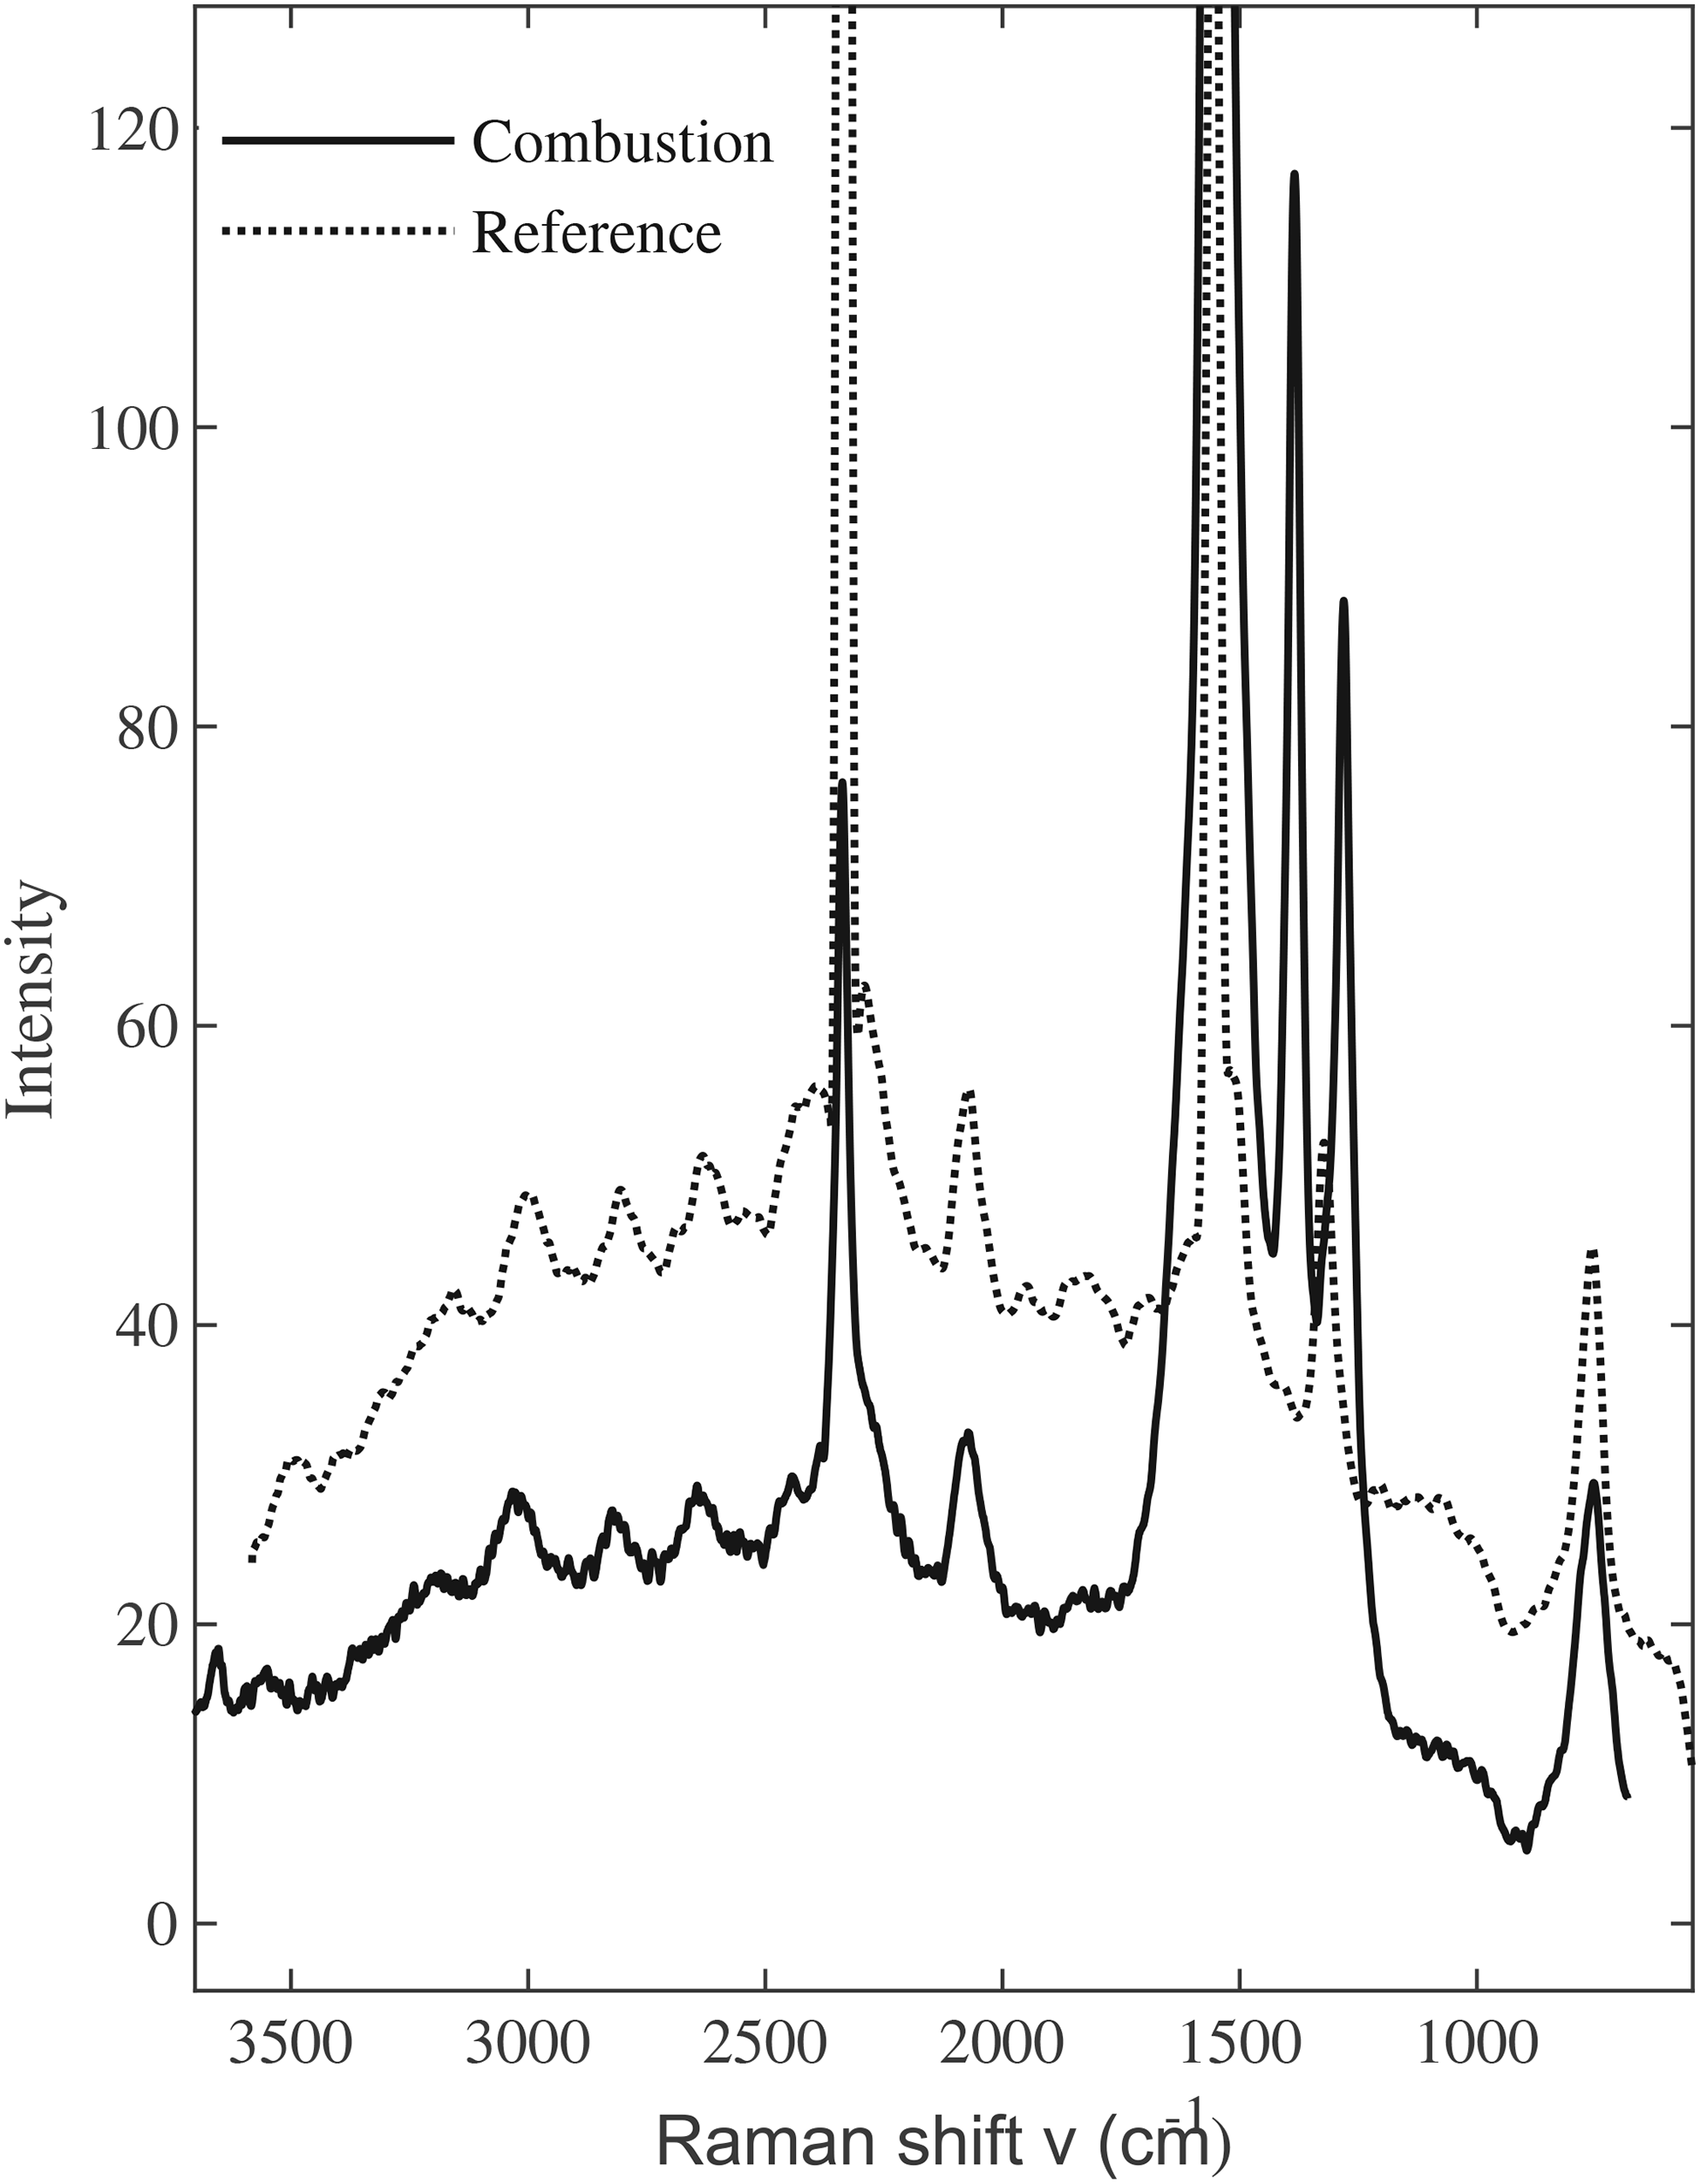
Comparison between the spectrum acquired during combustion and a spectrum obtained from a certified cylinder containing 1000 ppm of NO2, 79% N2, and 20.9% O2.
It is important to highlight that a significant contribution to the spectrum baseline arises from NO2 fluorescence induced by the excitation source at 532 nm. This phenomenon, commonly utilized for laser-induced fluorescence analysis, is well documented.28–30
The NO2 fluorescence exhibits a broad spectrum, starting at the excitation wavelength and extending towards the IR region. However, in the scenario presented, the NO2 detection is unaffected as the detector remains unsaturated. Any baseline interference caused by fluorescence can be effectively removed using numerical fitting techniques once the Raman spectrum of NO2 has been characterized and calibrated.
It is clearly visible that in the region between 1900 and 3250 cm−1 both spectra present common features, these are relatable to the presence of NO2 in the mixture and more in general the presence of NOx. Is it possible to conclude that the amount of NO2 observed is above the detection limit of the instrument? To obtain further information, a comprehensive characterization of the peaks and background evolution relative to NO2 concentration is required.
Conclusion
This investigation has highlighted the preliminary performances of a Raman spectroscopy analyzer as a valuable tool in combustion diagnostics. Notably, the system allows operations with an acquisition time of 0.15 s (at an operating pressure of 0.7 bar), representing a noteworthy advancement in Raman spectroscopy which could now be suitable for gaseous samples in dynamic regimes.
Performances were tested from 0.15 to 10 s of integration time and pressure from 0.7 to 7.5 bar inside the cell. In the configuration of 1 s integration time and pressure of 1 bar, the instrument archives LODs ranging from 70 to 2600 ppm depending on the molecule. The adopted configuration enables the detection of all the major combustion species including O2, H2, N2, CO2, CO, CH4, NO, NO2, SO2 H2O, and H2S.
Ongoing advancements in research and engineering will focus on improving the alignment's reliability and stability, reducing the device dimensions, and improving its setup procedures.
As this is the first prototype of the instrument, there could be some opportunity for improvement in the next generations of the system, particularly concerning SNR and LOD as they are associated with stray light sources. Also, the software routine will be further developed and updated aiming at an improvement of the fitting performance.
Footnotes
Acknowledgments
The authors acknowledge VELP Scientifica srl (Italy), in particular Dr. Sonia Corno, for providing the combustion data.
Declaration of Conflicting Interests
The authors declared no potential conflicts of interest with respect to the research, authorship, and/or publication of this article.
Funding
The authors disclosed receipt of the following financial support for the research, authorship, and/or publication of this article: This work was supported by Project PiPe4.0, part of ATTRACT that has received funding from the European Union's Horizon 2020 Research and Innovation Programme, GA 777222, and from the Project “Network 4 Energy Sustainable Transition—NEST” code PE0000021, Concession Decree No. 1561 of 11.10.2022 adopted by Ministero dell’Università e della Ricerca (MUR), CUP B53C22004060006, according to attachment E of Decree No. 1561/2022.