
Abstract
Raman spectroscopy has great potential for quantitative analysis of natural gas. Helium is one of the components of natural gas and has a wide range of applications. It was believed that noble gases could not be detected using this technique due to the absence of their vibrational spectra. In this study, we demonstrated an approach to extracting the content of helium from the Raman spectrum of methane and carried out test measurements for the first time. The approach is based on the determination of changes in the ν1 band of methane caused by the influence of helium and other components. The necessary spectroscopic parameters characterizing the effect of methane (CH4), helium (He), nitrogen (N2), carbon dioxide (CO2), and ethane (C2H6) on the ν1 band of methane at a resolution of 0.35 cm−1 were obtained. The validation of the approach showed that the helium content in natural gas can be measured with an uncertainty of 1 mol% at a sample pressure of 50 bar. The measurement precision can be increased to 0.01 mol% by using a high-resolution spectrometer. The described method does not claim to replace helium detectors, but it can be considered a valuable addition to Raman gas analysis of natural gas in developing an all-in-one device. The possibilities for further improvement of the approach are also discussed.
This is a visual representation of the abstract.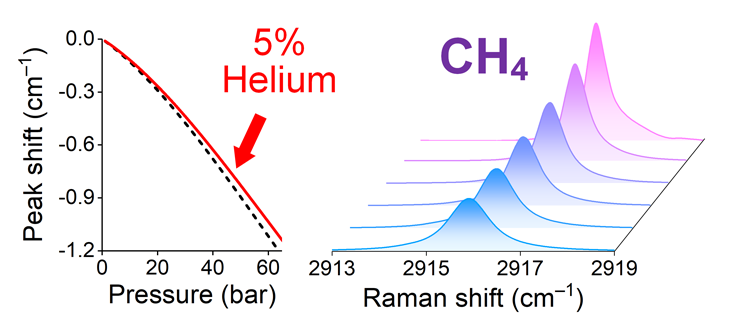
Introduction
Raman spectroscopy is a powerful tool for the noncontact detection of various chemical compounds. The scope of this technique includes flame thermometry for combustion diagnostics,1–4 exhaled air analysis,5–8 and analysis of natural inclusions in minerals.9–14 One of the most promising applications of Raman spectroscopy is the quantitative analysis of natural gas. The method is based on the linear relationship between the number density of a substance in a sample and its signal in the Raman spectrum. The use of advanced powerful lasers and high-sensitivity photodetectors made it possible to detect some compounds with sensitivity up to a few ppm.8,15–17 The application of helium is quite wide and ranges from medicine to chemical industry and geological exploration. Most commercial helium is produced from helium-bearing natural gas deposits, where its content can reach 7%.18–20 The process of helium production involves at least two stages. In the first stage, crude helium gas is extracted through fractional distillation of natural gas. The second stage is the gradual enrichment of crude helium by separating impurities such as hydrogen, argon, methane, and nitrogen. Activated charcoal is used as a final step to obtain high-grade helium with a purity of 99.995%. According to the International Organization for Standardization (ISO 6974-3), 21 a thermal conductivity detector (TCD) coupled with a gas chromatographic column containing argon as a carrier gas is used for the separation and detection of helium, hydrogen, oxygen, and nitrogen. The second column coupled with a TCD and a flame ionization detector in series is required for the detection of hydrocarbons. Helium cannot be measured directly by using vibrational spectroscopy because noble gases do not have vibrational spectra at standard temperature and pressure.22,23 However, according to the reported studies,24–27 the helium environment affects the Raman spectrum of methane, which is the dominant component of natural gas. The effect of all impurities of natural gas on the methane spectrum can be quantified using a model of sensitive spectral characteristics. Intermolecular interactions do not affect the intensity of the methane bands at pressures below 50 bar, 28 but the width and shift of the spectral lines depend on the gas density and composition.29,30 Therefore, measuring such characteristics can provide information about the helium content in a methane-bearing sample.
A major part of the information about the broadening and shift of methane spectral lines by pressure was obtained using high-resolution infrared absorption spectroscopy,31,32 including experimentally measured,33–39 and theoretically calculated40–44 parameters characterizing the influence of noble gases such as helium and argon. Additionally, collisional energy transfer processes in methane were investigated using time-resolved infrared double-resonance spectroscopy.45–47 Meanwhile, the literature on the broadening of individual rotational–vibrational lines in the Raman spectrum of methane is relatively sparse. The measured broadening coefficients of the resolved lines of methane by helium pressure were reported by Millot et al., 27 where the region of the isotropic Raman Q-branch of the 2ν2 overtone was considered. According to the Raman and infrared absorption measurements, the half-width of rotational–vibrational lines of methane diluted in helium is almost two times less than in pure methane. In addition, the pressure-induced shift of the spectral lines towards lower wavenumbers for pure methane is substituted by a weak blue shift in the helium medium.
The transformation mechanisms of the resolved Q-branch of the ν1 band of methane with increasing pressure and temperature were studied using methods of high-resolution stimulated Raman spectroscopy and coherent anti-Stokes Raman spectroscopy.25,48–52 Since its spectrum is very dense, the only published data providing any indication of the magnitude of the pressure broadening coefficients for the ν1 band transitions is an averaged value, measured by Volkov et al. 49 It was found that the pressure broadening coefficients of individual lines forming the Q-branch of the ν1 band is an order of magnitude greater than the vibrational broadening of the entire collapsed Q-branch.49,50 The time-resolved data of the ν1 band signal at low and high temperatures has been supplemented using the picosecond/femtosecond coherent anti-Stokes Raman spectroscopy.53–55 Moreover, accurate theoretical models for the isotropic Raman Q-branch of methane were developed and verified using the high-resolution spectra.25,51 However, at present, only the effects of argon, helium, and nitrogen on the resolved ν1 band of methane were studied.
Nevertheless, the influence of different molecular environments on the unresolved ν1 Raman band at high densities has been extensively studied.56–83 The shift of the ν1 peak has a strong response to the variation in gas density and composition that can be applied to develop a Raman densimeter, with further application in the analysis of natural inclusions in minerals. The dependences of the half-width of the unresolved ν1 band on the pressure in methane–helium mixtures were also measured using spontaneous 24 and coherent inverse Raman spectroscopy. 26 However, the reported data characterizing the effect of impurities on the methane spectrum is difficult to integrate into a unified model for helium detection because the measurements were made using spectrometers with significantly different spectral characteristics. In this work, we quantified the effect of the main components of natural gas on the ν1 band of methane using a spontaneous Raman spectrometer with a resolution of 0.35 cm−1. Based on a simple approach and obtained spectroscopic parameters, we have demonstrated the possibility of measuring helium content in natural gas using Raman spectroscopy for the first time.
Experimental
Materials and Methods
A spectrometer with sufficient resolution is required to reliably detect and separate the effects of intermolecular influence from each component. In this regard, we developed an experimental setup for recording high-resolution spontaneous Raman scattering spectra. The schematic diagram can be found in our previous work. 28 A single-mode continuous-wave (CW) neodymium-doped yttrium aluminum garnet (Nd : YAG) laser (SLN-532-5000, CNI Laser) was used as a source of exciting monochromatic radiation, providing 5 W of output power in continuous mode at a wavelength of 532.094 nm. The laser beam was focused into a hollow metal gas cell of volume 30 cm3 with fused quartz windows. The scattered light was collected at an angle of 90° to the direction of the laser beam propagation using an f/4 objective lens (f = 105 mm). It should be noted that this optical scheme gives significantly less background in the spectra than the 180° geometry. In this regard, the background in the recorded spectra was negligible, and its correction was not carried out. An f/8 spectrometer (f = 600 mm) equipped with a diffraction grating of 2400 lines/mm was used to decompose the scattered radiation into a spectrum. An f/4 objective lens (f = 210 mm) was used to focus the light on the entrance slit of the spectrometer. A charge-coupled device (CCD) sensor (Hamamatsu S10141, active area size 24.6 × 6.1 mm, pixel size 12 μm) equipped with thermoelectric cooling to −10°C was used to register the signals. All spectra were recorded in the range of 2800–3050 cm−1 without using a concatenation. The full width at half-maximum (FWHM) of the slit function was 0.35 cm−1 when using the 30 µm entrance slit.
The relationship between the CCD pixels and wavenumbers was obtained using a third-order polynomial to transform an intensity distribution of decomposed light into a spectrum. The polynomial coefficients were reliably determined by matching rotational–vibrational lines of the ν3 band in the experimental spectrum of pure methane at atmospheric pressure to the simulated ones (Figure S1, Supplemental Material). The spectrum simulation method is described in detail in the Supplemental Material. Excellent signal-to-noise was achieved in the region of weak ν3 lines by using a multipass excitation system. 84 This scheme gave a 10-fold amplification compared to the single-pass excitation scheme. The main experiment was carried out with a single-pass excitation scheme 28 due to the greater temporal stability of the scattered light collection geometry at high pressure in a gas cell. The uncertainty of the obtained wavenumber scale was found to be ±0.008 cm−1. We used this wavenumber scale for all other spectra and controlled only the relative shift using the ν1 band in the spectra of pure methane at a pressure of 1 bar, recorded at the beginning and end of each series of spectra. The signal-to-noise relative to the peak value of the ν1 band was about 1000 at atmospheric pressure and an exposure time of 100 s. The uncertainty of the absolute position in the spectra of pure methane was 0.015 cm−1 (three SDs), considering the instrumental drift due to vibrations and temperature fluctuations.
Procedure
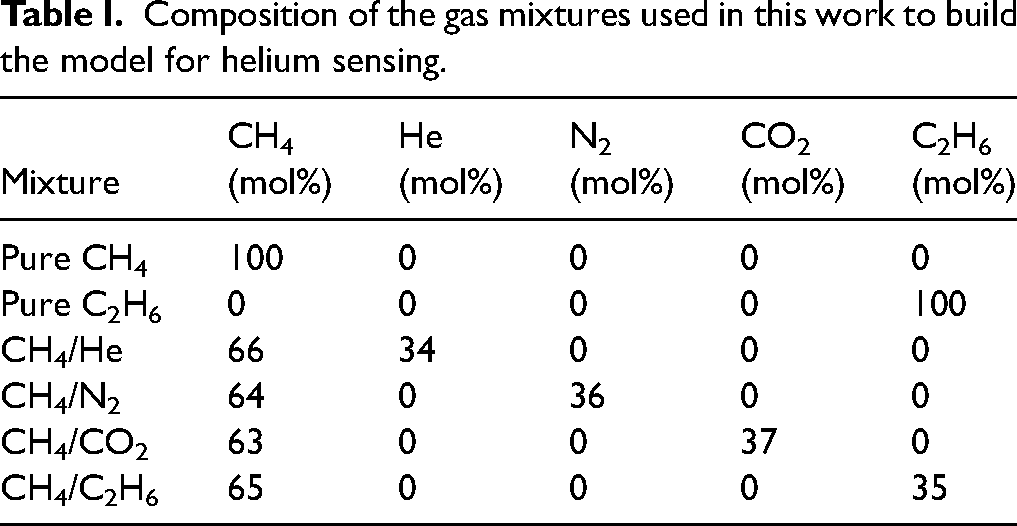
The mechanism of changing the vibrational bands of methane in the Raman spectrum of natural gas is complex because all impurities affect methane molecules simultaneously. To simplify the task, we studied the effect of each impurity separately using binary mixtures of methane/impurity (65/35 mol%) in the pressure range of 1–60 bar (Table I). Five spectra with 50 s exposure each were recorded at each pressure. The mixtures were prepared in a separate mixing chamber using pure samples of methane (CH4) (>99.99 mol%), nitrogen (N2) (>99.99 mol%), carbon dioxide (CO2) (>99.99 mol%), ethane (C2H6) (>99.9 mol%), and helium (He) (>99.99 mol%) with the required partial pressures. We believe the chosen mole fraction is adequate to provide sufficient signal-to-noise and the measurable effect of natural gas impurities. We used our Raman gas analyzer to confirm the obtained mole ratios from the partial pressures. The accuracy and precision of measuring natural gas using this analyzer have been previously demonstrated by Petrov et al. 15 The content of Raman-active impurities was measured with an uncertainty of less than 0.1 mol%. Additional measurements were conducted to confirm the mole ratio in the CH4/He mixture. For this purpose, the Raman spectra of pure methane and the CH4/He mixture were recorded, alternating the pure methane and methane with helium to eliminate the influence of fluctuations in laser power. Ten spectra with 50 s exposure each were recorded at a pressure of 25 bar to verify the mole fraction of helium and its uncertainty. Measurements of the intensity (area under the curve) of the methane spectra in these mixtures revealed that the helium content in the CH4/He mixture was 34.0 ± 0.5 mol%. Before each mixture was injected, the gas cell was vacuumed for several hours. The gas temperature was monitored using the internal thermocouple and maintained at 298 ± 1 K throughout the experiment. The gas pressure in the cell was controlled by a pressure gauge with an uncertainty of 0.01 bar. It is important to note that the bands of methane in the studied spectral range overlap with bands of ethane. In this regard, we also recorded the spectra of pure ethane at different pressures to extract the methane bands from the spectra of mixtures. The contribution of N2 and CO2 in this spectral range can be neglected.
Composition of the gas mixtures used in this work to build the model for helium sensing.
Helium Sensing Approach
The ν1 fundamental mode with a center of 2917 cm−1 is the most intense in the Raman spectrum of methane. This band represents a narrow Q-branch that is formed by a large number of closely spaced rotational–vibrational lines.85–91 As a result, a strong line-mixing effect is manifested in this region.50,92,93 The shape of the Q-branch is asymmetric at low pressure 25 due to the offset arrangement of the lines sharing the high rotational energy levels.55,94–96 The Q-branch tends to the symmetrical Lorentzian distribution at high gas density until the collapse of the rotational structure is accomplished.25,48,49,52 As shown in Figure 1, the recorded ν1 peak shifts towards lower wavenumbers and broadens with increasing pressure. The helium medium leads to the smallest shift and broadening of the methane band, while the ethane medium induces the largest changes at the same pressure of the gas mixture. The shape is slightly less symmetric in the mixture with helium at high pressure than in the ethane medium. This difference can be explained by the slowdown and acceleration of the merging of the rotational structure due to lower and higher broadening of methane lines by pressure of helium and ethane,84,97 respectively.
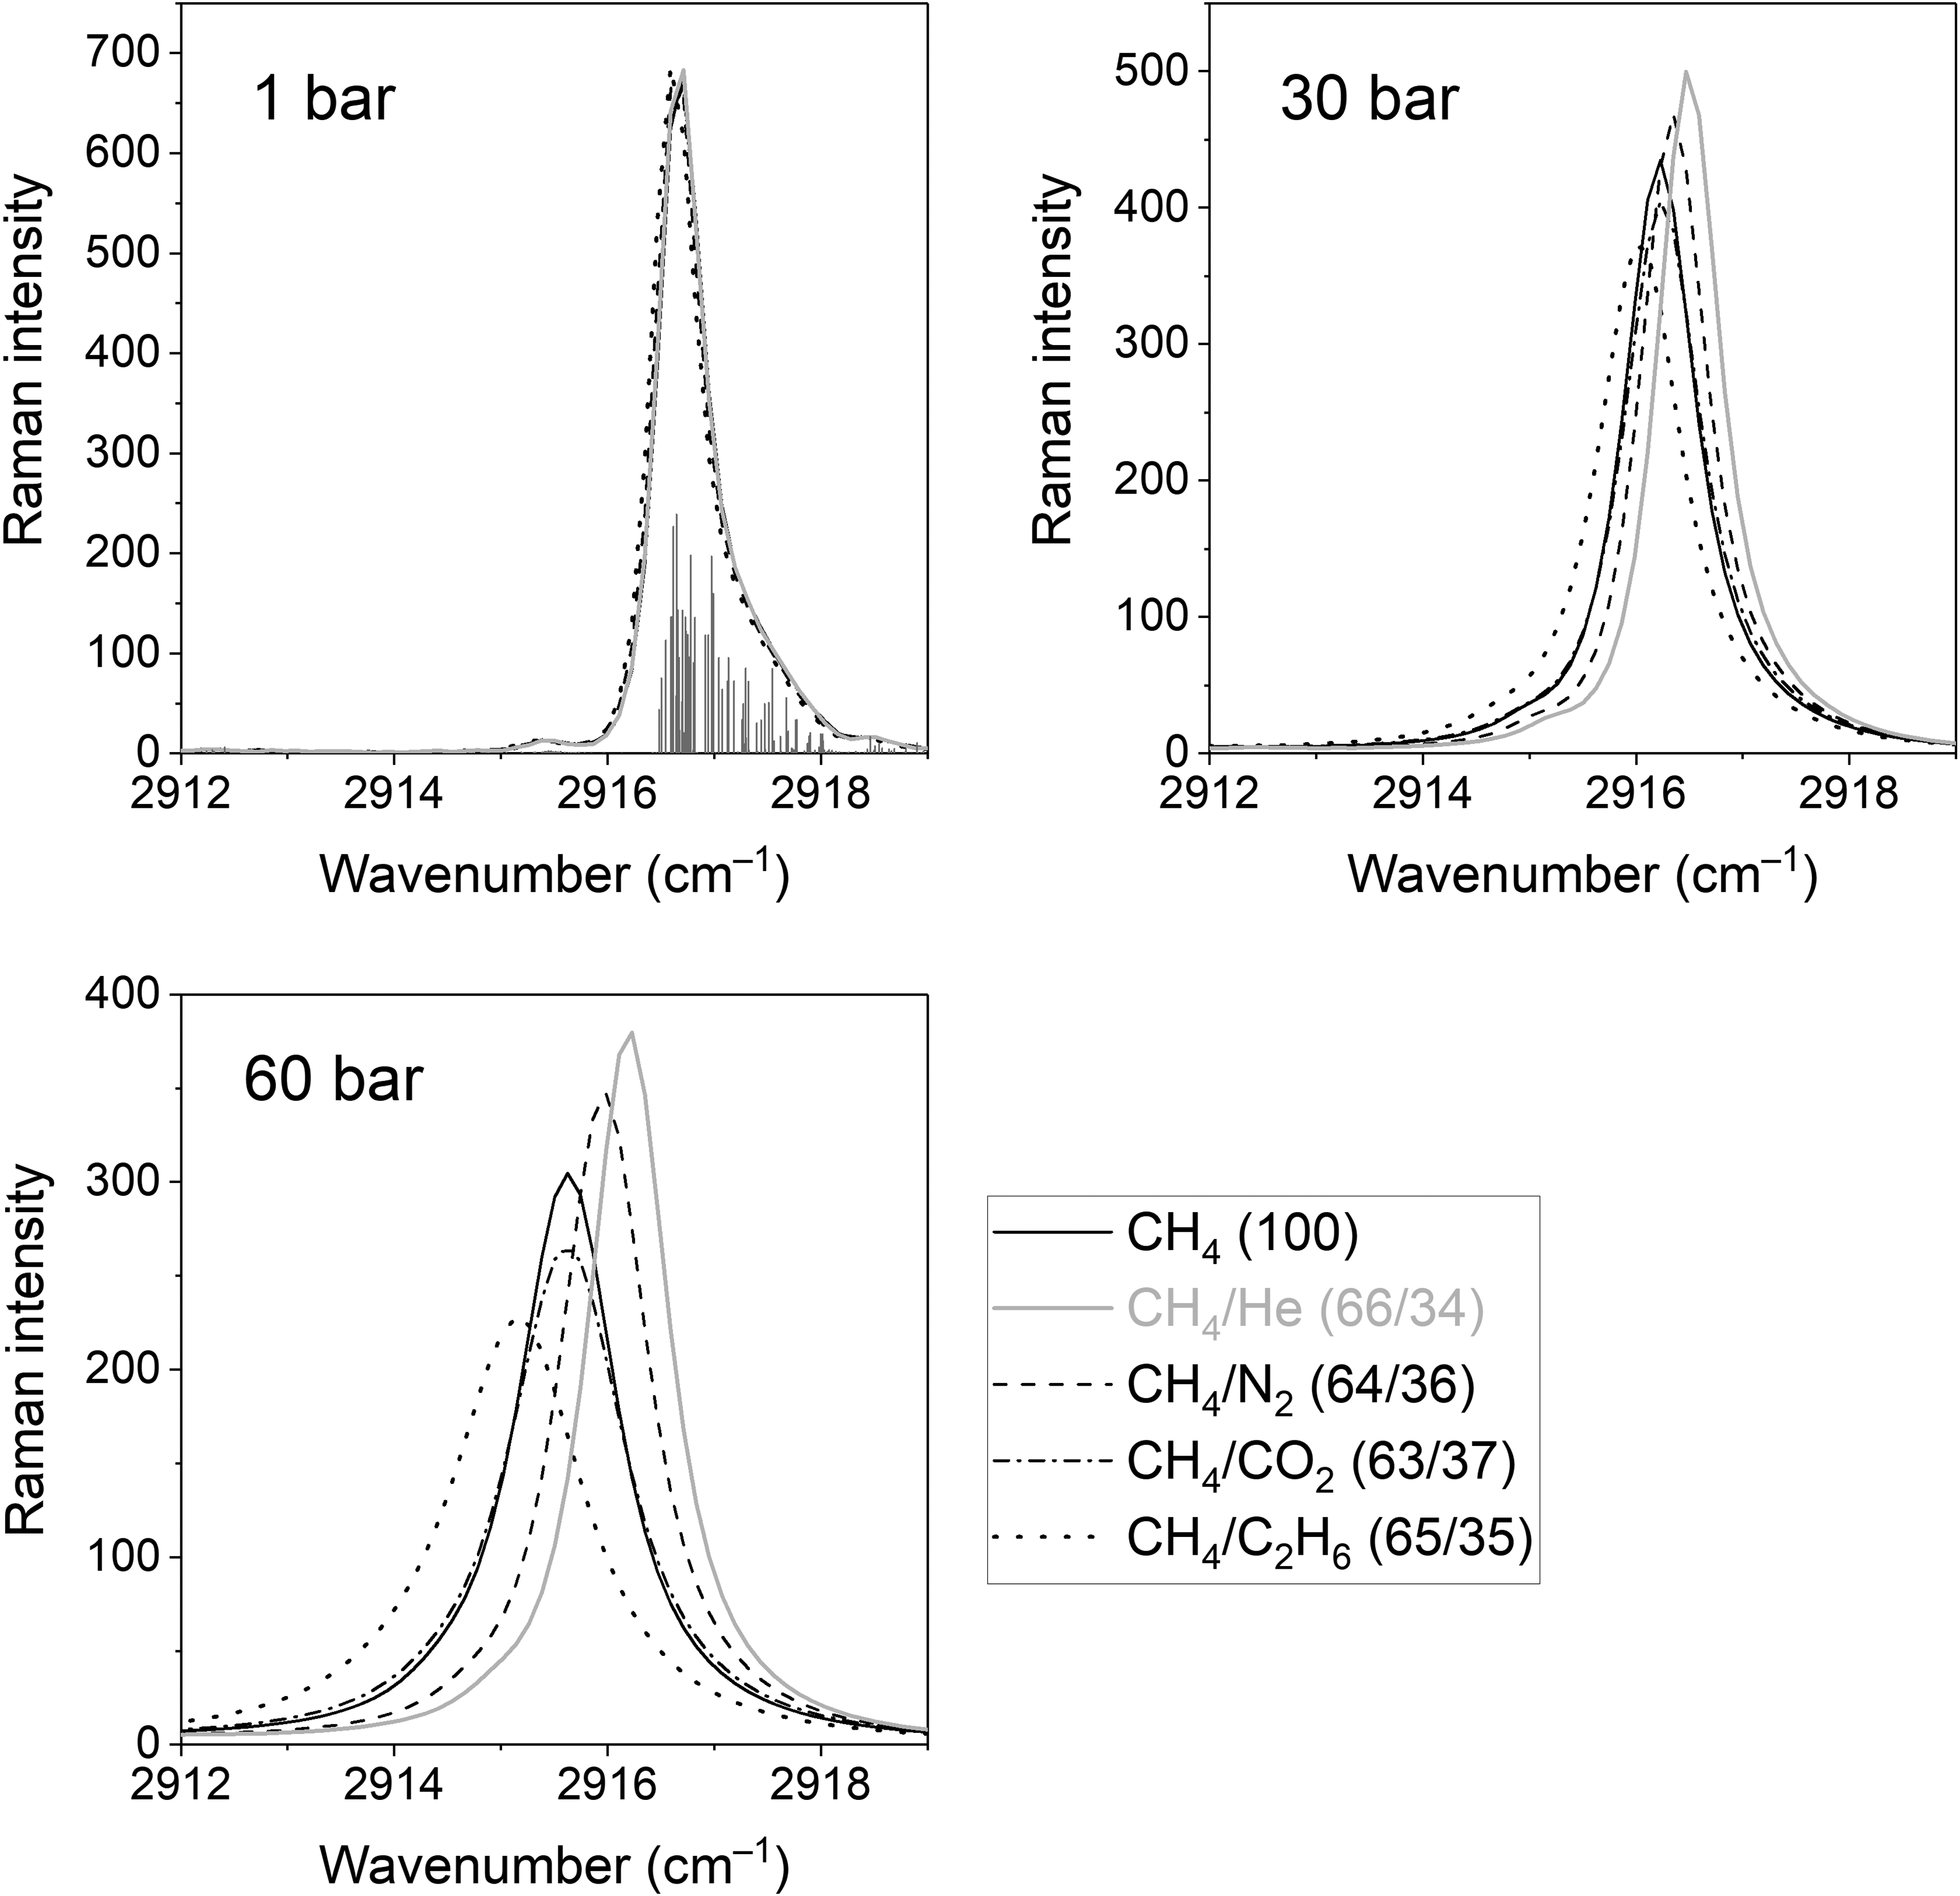
Recorded Raman spectra of pure methane and binary mixtures in the ν1 band region of methane at pressures of 1, 30, and 60 bar. Calculated rotational–vibrational lines of methane taken from the study by Ba et al. 98 are represented by stick lines.
A cluster of the ν1, ν5, ν7, ν10, 2ν8, and 2ν11 Fermi resonance bands of ethane is located in the range of 2880–2970 cm−1.99–101 As shown in Figure S2 in the Supplemental Material, the spectral characteristics of these bands are significantly affected by pressure. Their shapes become symmetrical at high pressure due to the coupling of a huge number of lines by the line-mixing effect. As noted in our previous study,
97
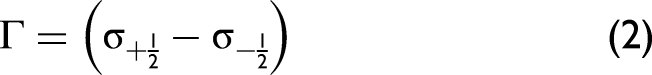
the methane medium slows down the fusion of ethane lines, and the required spectral characteristics of the ethane bands in a gas mixture can be imitated using the spectra of pure ethane at a different pressure. In this work, we found that it is necessary to subtract the spectrum of pure ethane at pressures of 1, 7.6, 13.7, 19.7, 24.2, 27.3, and 32.3 bar from the spectrum of the CH4/C2H6 (65/35 mol%) mixture at pressures of 1, 10, 20, 30, 40, 50, and 60 bar, respectively, to correctly extract the ν1 band of methane. We have determined the FWHM (Γ) and the position of the ν1 band center (υ) of methane from each spectrum. These quantities have been defined by: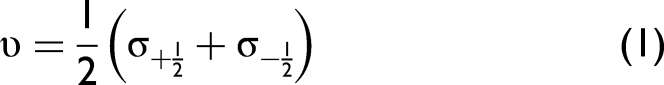
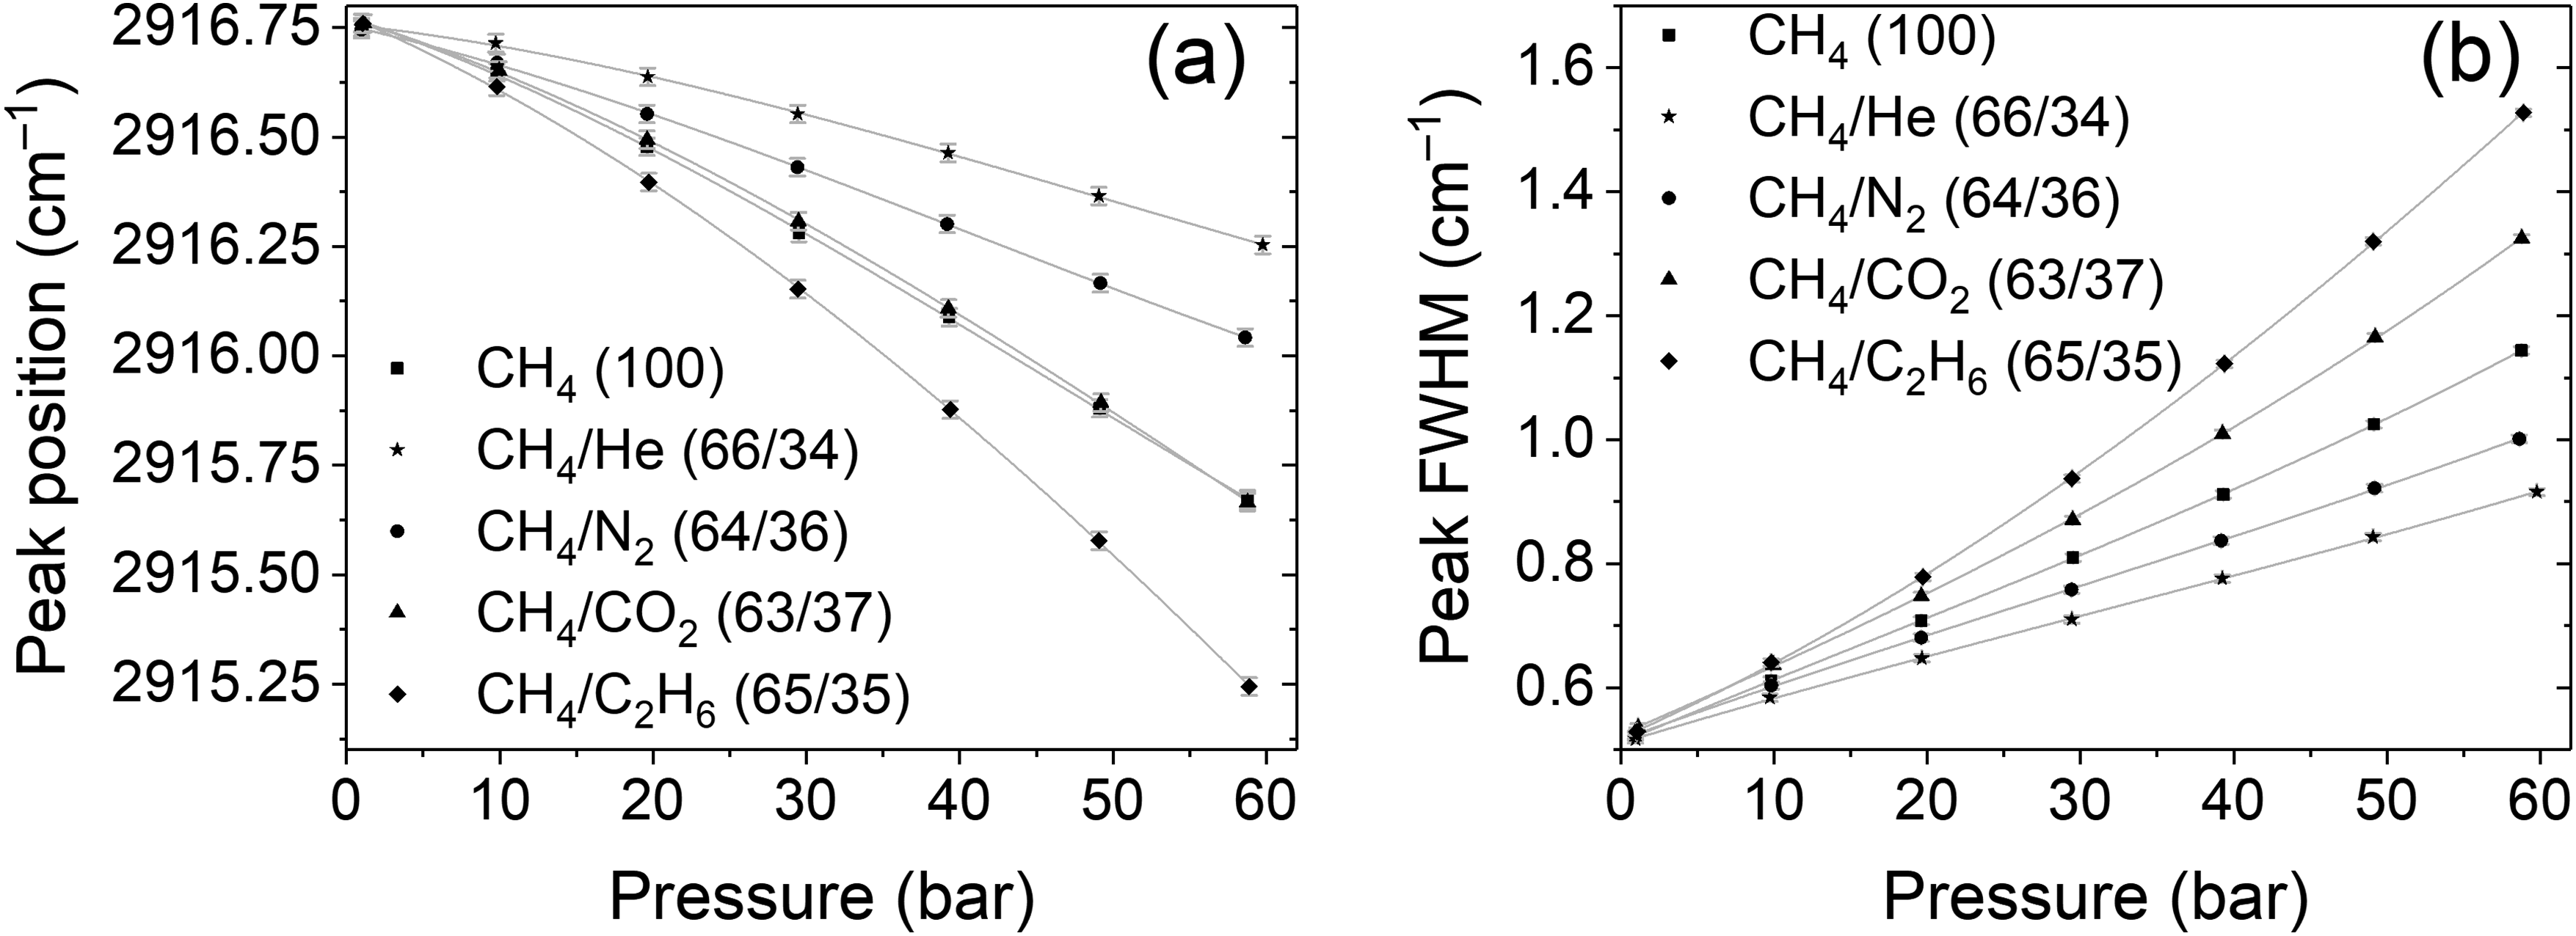
Measured (a) positions and (b) widths of the ν1 band of methane as a function of pressure in different environments. The bands of ethane have been subtracted in the CH4/C2H6 (65/35 mol%) mixture.
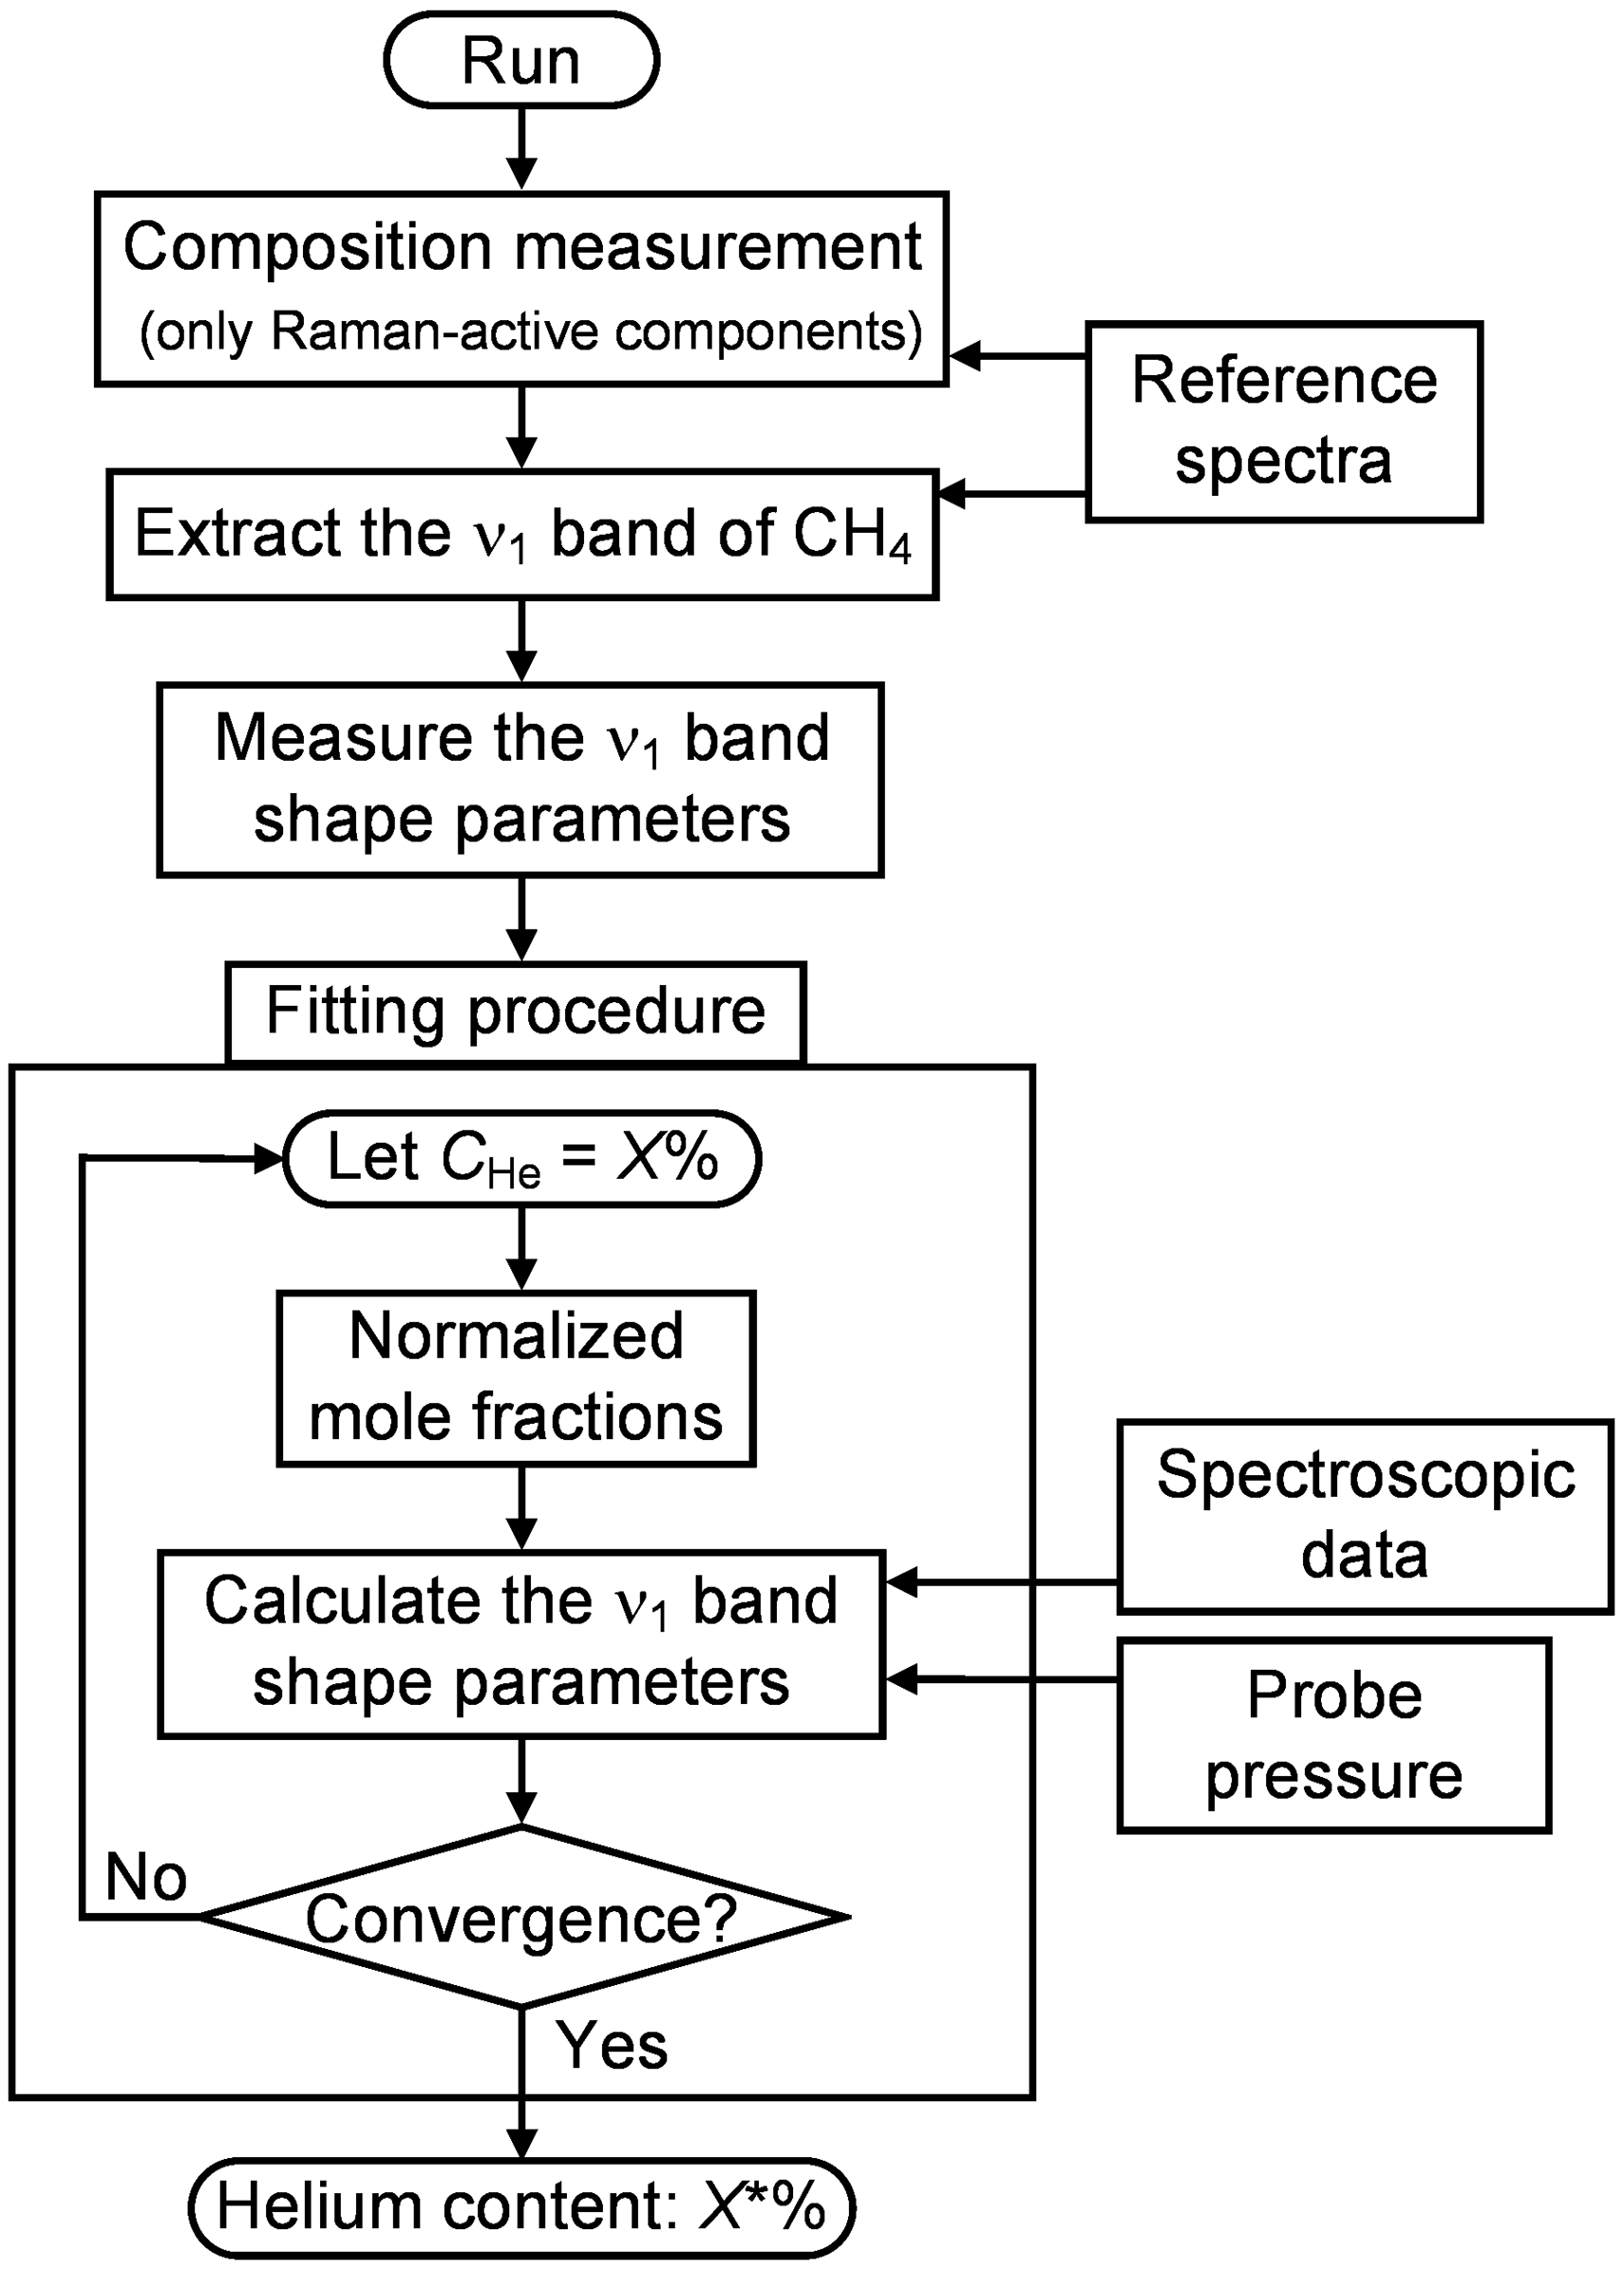
Flowchart of the helium sensing algorithm used in this work.
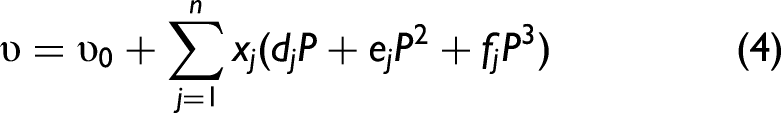
The explicit form of the function to calculate the characteristics of the observed ν1 peak at the resolution of the spectrometer used is unknown. In this regard, we used a simple expansion in powers of pressure, limited to the third order. For the sake of simplicity, the effect of each component on the ν1 band was assumed to be additive. Therefore, the expression for calculating the proposed parameters of the ν1 peak in an n-component gas mixture takes the form: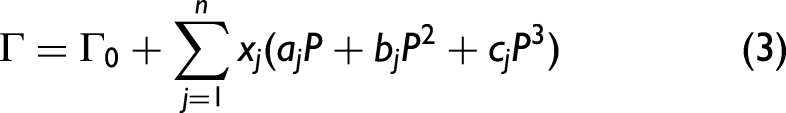
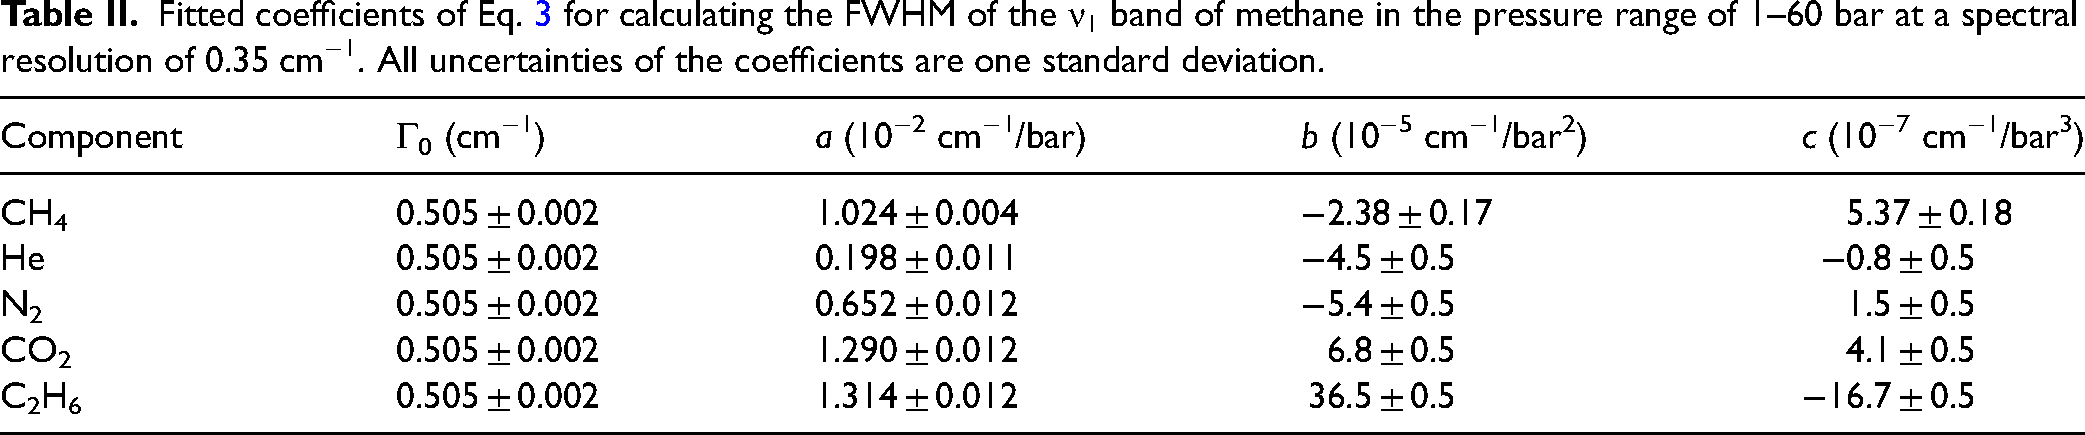
Fitted coefficients of Eq. 3 for calculating the FWHM of the ν1 band of methane in the pressure range of 1–60 bar at a spectral resolution of 0.35 cm−1. All uncertainties of the coefficients are one standard deviation.
Fitted coefficients of Eq. 4 for calculating the position of the ν1 band center of methane in the pressure range of 1–60 bar at a spectral resolution of 0.35 cm−1. All uncertainties of the coefficients are one standard deviation.
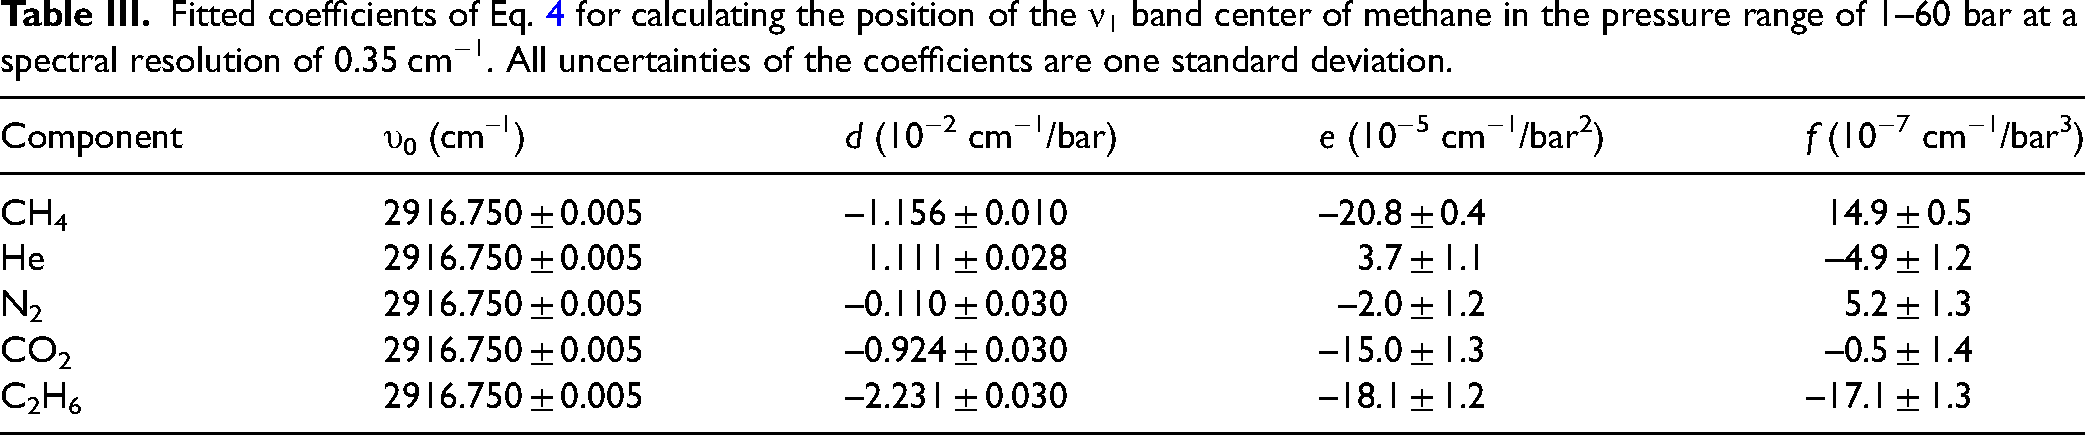
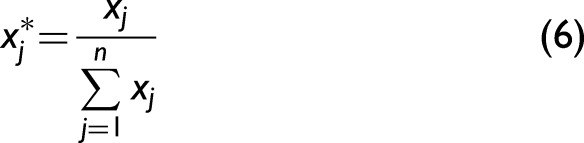
Figure 3 provides a detailed algorithm for measuring the helium content in natural gas using the ν1 Raman band of methane. Let the analyzed sample be an n-component mixture. In the first step, it is necessary to determine the molar fractions of n–1 Raman-active compounds (i.e., all except helium) from the recorded spectrum of the sample. Different techniques can be used for this purpose, but the contour fitting method is the most reliable for multicomponent gas mixtures at the moment.15,102 This approach is based on minimizing the deviation between the synthetic spectrum and the observed spectrum of the analyzed sample. The synthetic spectrum is a weighted sum of reference spectra of pure substances that are included in the mixture. Once the molar fractions of n–1 impurities have been measured, the ν1 band of methane can be extracted from the sample spectrum using the found weighting coefficients and the reference spectra. The recorded spectrum must be cleaned from impurity contributions to correctly measure the shape parameters of the ν1 band of methane (center position and FWHM in our case). The final stage is solving the inverse problem based on the chosen model for calculating the ν1 band characteristics (Eqs. 3 and 4). At this stage, it is necessary to know the pressure at which the spectrum of the sample was recorded, and the spectroscopic data characterizing the effect of all n components. The algorithm varies the helium content until the convergence of the calculated (calc) center position and FWHM of the ν1 band with the measured (exp) ones is achieved:
Results and Discussion
Model Validation
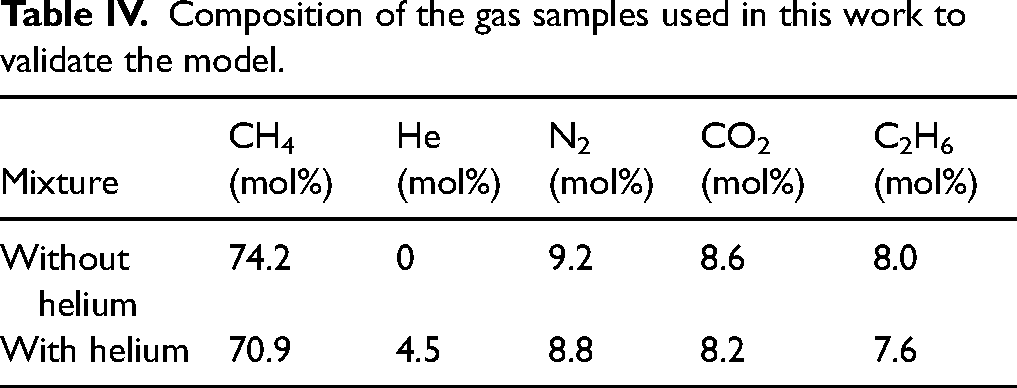
The presented idea of helium sensing was tested on two different gas samples that imitate the composition of natural gas with and without helium (Table IV). The samples were prepared by mixing pure gases of CH4 (>99.99 mol%), N2 (>99.99 mol%), CO2 (>99.99 mol%), C2H6 (>99.9 mol%), and He (>99.99 mol%) with the required partial pressures in the separate mixing chamber. The composition of the first helium-free sample (a mixture of CH4/N2/CO2/C2H6) was measured using our Raman gas analyzer. 15 The content of Raman-active impurities was measured with an uncertainty of less than 0.1 mol%. To prepare the second helium-containing sample, the first mixture without helium at a pressure of 65 bar was mixed with pure helium at a pressure of 3 bar, expecting that the helium content in the resulting mixture would be 4.4 mol%. Additional measurements were conducted to confirm this molar percentage. For this purpose, the Raman spectra of these mixtures were recorded, alternating the first and second samples to eliminate the influence of fluctuations in laser power. Ten spectra with 50 s exposure each were recorded at a pressure of 25 bar to verify the mole fraction of helium and its uncertainty. Measurements of the intensity (area under the curve) of the methane spectra in the first and second samples revealed that the helium content in the second sample was 4.5 ± 0.5 mol%. Five spectra with 50 s exposure each were recorded at each pressure in the pressure range of 1–50 bar to test the presented algorithm (Figure 3). The spectra of pure methane at a pressure of 1–60 bar and pure ethane at a pressure of 1–25 bar were used to extract the ν1 band of methane from the spectra of the samples.
Composition of the gas samples used in this work to validate the model.
As shown in Figure 4, the presented algorithm yielded about 4.5 mol% helium in the helium-containing sample in the pressure range of 20–50 bar, which agrees with the actual content. The three standard deviations of the helium content at a pressure below 20 bar exceeds 3 mol%. The uncertainty increased exponentially towards atmospheric pressure due to the smaller difference in the spectra of samples with and without helium (Figures S3 and S4, Supplemental Material). Conversely, the positive trend was observed with increasing pressure. The measurement uncertainty was 2 mol% at a pressure of 30 bar and 1 mol% at 50 bar. Based on the three standard deviations of the ν1 peak parameters in this work (±0.015 cm−1 for center position and ±0.006 cm−1 for the FWHM), we estimate that the helium content can be measured with a precision of ±0.4 mol% at a pressure of 100 bar. The algorithm yielded about 1 mol% helium in the sample without helium in the pressure range of 20–50 bar. This discrepancy is caused by fluctuations in the position of the ν1 band during the recording of the spectra series.
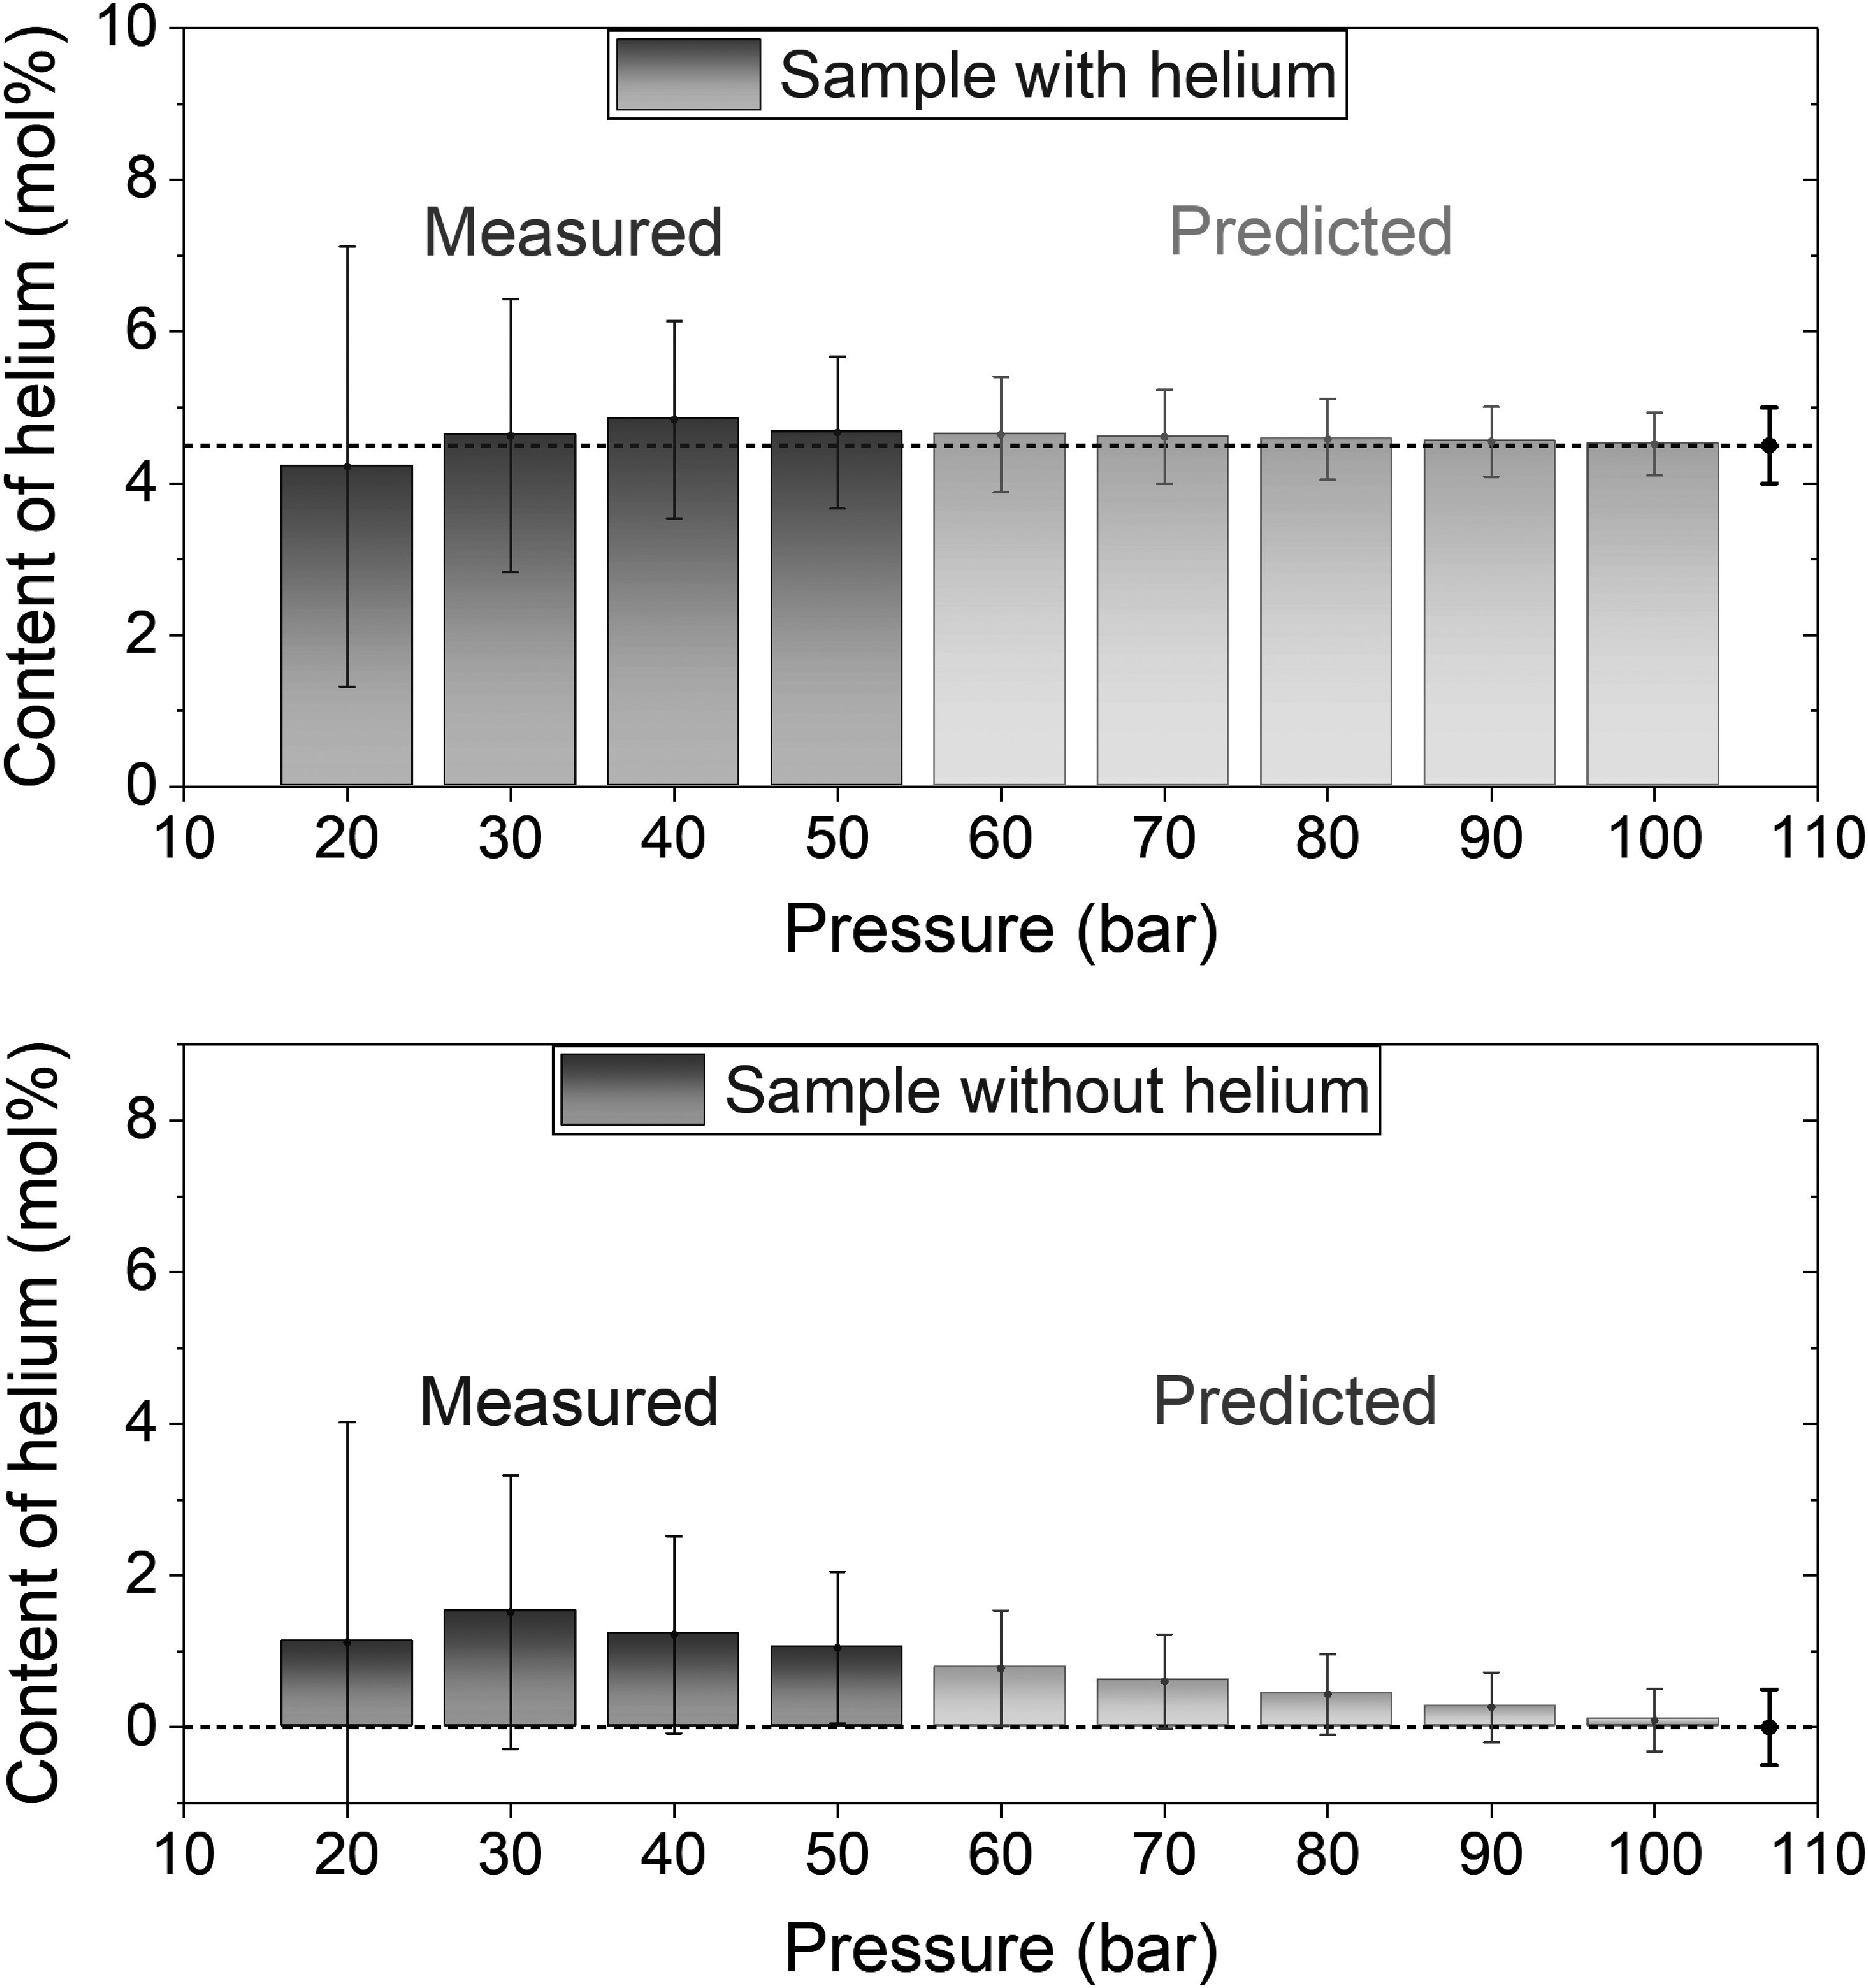
Measured (20–50 bar) and predicted (60–100 bar) content of helium in the reference mixtures using the ν1 band of methane at different pressures, where dashed lines and black error bars represent the actual helium content and its measurement uncertainty (three standard deviations), respectively.
Uncertainty Analysis
As described above, an accurate measurement of the sample pressure is necessary for the correct calculation of the half-width and position of the ν1 band of methane, from which helium concentration can be extracted. However, the Raman spectrum of methane is also sensitive to changes in gas temperature.103,104 Extensive studies of the methane spectrum in the ν1 band region have shown that not only the intensity of the hot bands52,94–96 but also the shift and half-width of the ν1 band are affected by temperature variations. A particularly strong response to temperature variation is observed at high gas pressure.58–60,63,64,66,67,70,74,76,78,83,103,105,106 In this regard, in addition to the correct measurement of the ν1 band parameters, it is necessary to stabilize the pressure and temperature of the sample for the most accurate measurements of the helium content. To measure the helium content with a precision of 1 mol% using the ν1 Raman band of methane at a sample pressure of 50 bar, it is sufficient to stabilize the pressure and temperature of the sample within ±0.4 bar and ±1.3 K (Figure S5, Supplemental Material). If the precision of 0.01 mol% is required, the pressure and temperature of the sample must be stabilized within ±4 mbar and ±13 mK.
In this study, we have only quantified the effects of CH4, He, N2, CO2, and C2H6 to calculate the characteristics of the ν1 band. However, all components of natural gas can affect the vibrational bands of methane, and the higher the impurity content, the stronger the effect. The uncertainty of measuring the content of Raman-active components in the sample can also affect the precision of the helium measurement. In this regard, we estimated the parameters of our model for unaccounted impurities (Figures S6 and S7, Supplemental Material). The results obtained show that neglecting the impact of alkanes C3–C5 leads to a measurement error of more than 1 mol% in helium (Figure S8, Supplemental Material). The ν1 peak of methane is less sensitive to the influence of C6+ hydrocarbons and other impurities, the content of which is less than 0.5 mol%. Therefore, for measurements in natural gas, the model for calculating the shape parameters of the ν1 band should be supplemented with constants a, b, …, and f characterizing at least the effect of alkanes C3–C5. To measure the helium content with a precision of 1 mol% using the ν1 Raman band of methane at a sample pressure of 50 bar, it is sufficient to measure the content of Raman-active components with a precision of 1.1 mol% (Figure S9, Supplemental Material). This level of precision is quite achievable for Raman gas analyzers.
The presented method for extracting the helium content from the methane spectrum can be used with any spectrometer and exciting laser. However, it is very important to ensure precise measurements of the ν1 band characteristics. Besides, the coefficients provided in Tables II and III ensure the highest measurement accuracy of the helium content when using a spectrometer with a resolution close to 0.35 cm−1. The measurement uncertainty of the position and half-width of the ν1 band is determined by the spectral dispersion, noise in the methane spectrum, and fluctuations of the image of an entrance slit. The latter can be caused by changes in the spectral characteristics of exciting laser radiation (fluctuation and redistribution of mode intensities within the gain) or the optical path of a spectrometer due to vibrations and temperature fluctuations. To measure the helium content with a precision of 1 mol% at a sample pressure of 50 bar, it is necessary to stabilize the laser wavelength within ±0.6 pm (± 0.015 cm−1) and the FWHM within ±0.24 pm (± 0.006 cm−1). If the precision of 0.01 mol% is required, the position and the FWHM must be stabilized within ±6 fm (± 1.5·10–4 cm−1) and ± 2.4 fm (± 6·10–5 cm−1), respectively (Figure S10, Supplemental Material). We believe that using an additional spectrometer or interferometer to control the spectral line of an exciting laser can help in measuring the helium content with high precision. The pressure dependence of the ν1 shift becomes more linear for lower spectral resolution because the wide slit function of a spectrometer masks the asymmetry of the Q-branch and its change (Figure S11, Supplemental Material). Therefore, it is necessary to remeasure the coefficients in Eqs. 3 and 4 when using a spectrometer with a significantly different width of the SF. The helium content can be derived with a precision of the order of 0.01 mol% from the Raman spectrum of methane, but a spectrometer with a resolution of 0.01 cm−1 is required for this purpose (Figure S12, Supplemental Material). Despite the low resolution of Raman gas analyzers designed for industrial applications, such a device can still detect helium by increasing the sample pressure to ≈100 bar and measuring the characteristics of the ν1 peak of methane with high precision. All computation details to estimate the measurement uncertainties are given in the Supplemental Material.
Possibilities of Helium Sensing Using Spectrum Simulation
Full simulation of a molecular spectrum based on a rotational–vibrational line list is one of the best approaches to quantify intermolecular effects. The helium content can also be determined by simulating the ν1 band of methane. In this case, fitting the simulated spectrum to the recorded one is the final stage of the algorithm presented in Figure 3. As noted above, the transitions forming the Q-branch of methane are significantly coupled by the line-mixing effect. At the moment, the relaxation matrix formalism is the most developed method for simulating such spectra at a high density of medium.34,107–110 This approach has already been tested to simulate the ν1 band in pure methane 52 and highly diluted methane in helium and argon.25,51 However, the parameters required to calculate the methane spectrum in the environment of the main components of natural gas have not yet been reported, owing to the high computational complexity for colliding polyatomic molecules.
We tested the strong collision approximation,111,112 which is a significant simplification of the relaxation formalism for the case of an unresolved Q-branch (see Supplemental Material for details). The required spectroscopic parameters were taken from literature.84,98,113 The differences between the measured and simulated spectra of pure methane in the ν1 band region do not exceed the deviation between the recorded spectra of reference mixtures with and without helium (Figure S13, Supplemental Material). However, it remains unclear how to extend this model to a multicomponent mixture. In this regard, a more sophisticated model is required to measure the helium content in natural gas using spectrum simulation. We believe that helium molar percentage can be measured with an uncertainty of about 0.1 mol% at a pressure of 50 bar using a complete relaxation formalism. Nevertheless, the strong collision approximation can be used to correct the wavenumber scale. The position of the ν1 peak can be measured with an accuracy of ±0.002 cm−1 in the spectrum of pure methane at a pressure of 1 bar. Moreover, this model can accurately restore the shape of the slit function. This function plays an important role since even a minor discrepancy between the simulated and observed shape of the ν1 band can lead to a noticeable error in helium. If the half-width of the simulated slit function is greater than the actual one, then the measured helium mole fractions will be systematically overestimated, and vice versa. The difference between the recorded and simulated Q-branch in the spectrum of pure methane at a pressure of 1 bar was less than 1%. Thus, the slit function of a spectrometer can be reconstructed from the methane spectrum with the same accuracy using the parameters provided in the Supplemental Material (Figure S13, Supplemental Material).
Conclusion
The idea of extracting the helium content from the ν1 Raman band of methane in natural gas has been demonstrated. Helium can be detected at any pressure and composition of the analyzed gas sample by measuring the position and half-width of the methane peak. In this study, we obtained the coefficients required to calculate the position and FWHM of the ν1 band of methane in the CH4/He/N2/CO2/C2H6 mixture in the pressure range of 1–60 bar. It was found that the measurement precision of the helium content increases with the sample pressure because the effects of different molecular environments become more prominent. The molar percentage of helium can be measured with a precision of ±1 mol% at a gas pressure of 50 bar and a spectral resolution of 0.35 cm−1. The measurement uncertainty of the helium content less than 0.4 mol% can be achieved if the pressure of the analyzed sample is above 100 bar. In this case, the range of applicability of polynomials for calculating the ν1 band characteristics must be expanded by considering higher powers. The accuracy of the described method can also be improved in the low-pressure range by adding other independent parameters of the ν1 peak to the model, for example, the asymmetry of its shape. Besides the compounds considered in this study, the influence of C3–C5 alkanes must be taken into account to measure helium in real natural gas samples with an accuracy of ±1 mol%. The required coefficients can be determined using a procedure similar to the present one.
The helium sensing approach is suitable for any spectrometer. However, it is necessary to ensure high resolution and high temporal stability of the spectral characteristics of a spectrometer for the most precise measurements. We have shown that the measurement precision of the helium content can be on the order of 0.01 mol% using a spectrometer with a resolution of ∼0.01 cm−1. A low-resolution gas analyzer can detect helium in natural gas using this method, provided that the parameters of the methane peak are measured with high precision and at high pressure. The pressure dependences of the position and FWHM of the ν1 band measured in the high-resolution spectra differ from those in the low-resolution spectra. In this regard, the coefficients of the model should be remeasured for a Raman gas analyzer with a different resolution.
The integration of the spectrum simulation method based on the rotational–vibrational lines into the helium sensing algorithm makes it possible to avoid the dependence on the spectral resolution of a gas analyzer. We have shown that even a simplified simulation model accounting for the line-mixing effect in the ν1 band region provides good agreement between the experimental and calculated spectra of pure methane. However, a more sophisticated model is required for helium sensing in natural gas. Furthermore, the task of extracting the helium content from the Raman spectrum of methane is ideal for machine learning due to the high intensity of the ν1 band. We believe that helium-sensitive vibrational bands can be found in the spectra of other Raman-active compounds, the use of which will improve the accuracy of helium measurement.
Supplemental Material
sj-pdf-1-asp-10.1177_00037028241282669 - Supplemental material for Helium Detection in Natural Gas Using Raman Spectroscopy
Supplemental material, sj-pdf-1-asp-10.1177_00037028241282669 for Helium Detection in Natural Gas Using Raman Spectroscopy by Aleksandr S. Tanichev and Dmitry V. Petrov in Applied Spectroscopy
Footnotes
Declaration of Conflicting Interests
The authors declared no potential conflicts of interest with respect to the research, authorship, and/or publication of this article.
Funding
The authors received no financial support for the research, authorship, and/or publication of this article.
Supplemental Material
All supplemental material mentioned in the text is available in the online version of the journal.
References
Supplementary Material
Please find the following supplemental material available below.
For Open Access articles published under a Creative Commons License, all supplemental material carries the same license as the article it is associated with.
For non-Open Access articles published, all supplemental material carries a non-exclusive license, and permission requests for re-use of supplemental material or any part of supplemental material shall be sent directly to the copyright owner as specified in the copyright notice associated with the article.