
Abstract
This study presents an optical sensor system utilizing multi-reflectance spectroscopy (MRS), specifically designed for in-line applications to enable the real-time determination of fat and protein content in milk products, simultaneously. This method employs multiple light wavelengths and various illumination-detection geometries. A field study was conducted in a milk mixing plant, where measurements were obtained from milk products with varying fat and protein concentrations, with a particular focus on recombined milk samples and a brief comparison to conventional milk products. In a first step the experimental data are compared with simulation data obtained from an analytical MRS formula. The fundamental spectroscopic characteristics, particularly the dependence of reflectance values on fat concentrations, as well as the relationship between wavelength and reflectance, remained consistent. However, some experimental bias was observed in the absolute values when comparing the analytical and experimental results. Secondly, to get reflectance models multi-linear regressions (MLR) were carried out based on the experimental and analytical data as well fat and protein content obtained from traditional wet chemical methods. To estimate the model accuracy the root mean square error (RMSE) has been used yielding around 0.1 wt% for fat and protein. A validation procedure using recombined milk results in approximately 0.1 wt% for fat and around 0.2 wt% for protein. Finally, it is shown that the process sample temperature has only a small influence on the reflectance. In contrast the homogenization pressure significantly influences the reflectance and should be considered to ensure accurate monitoring.
This is a visual representation of the abstract.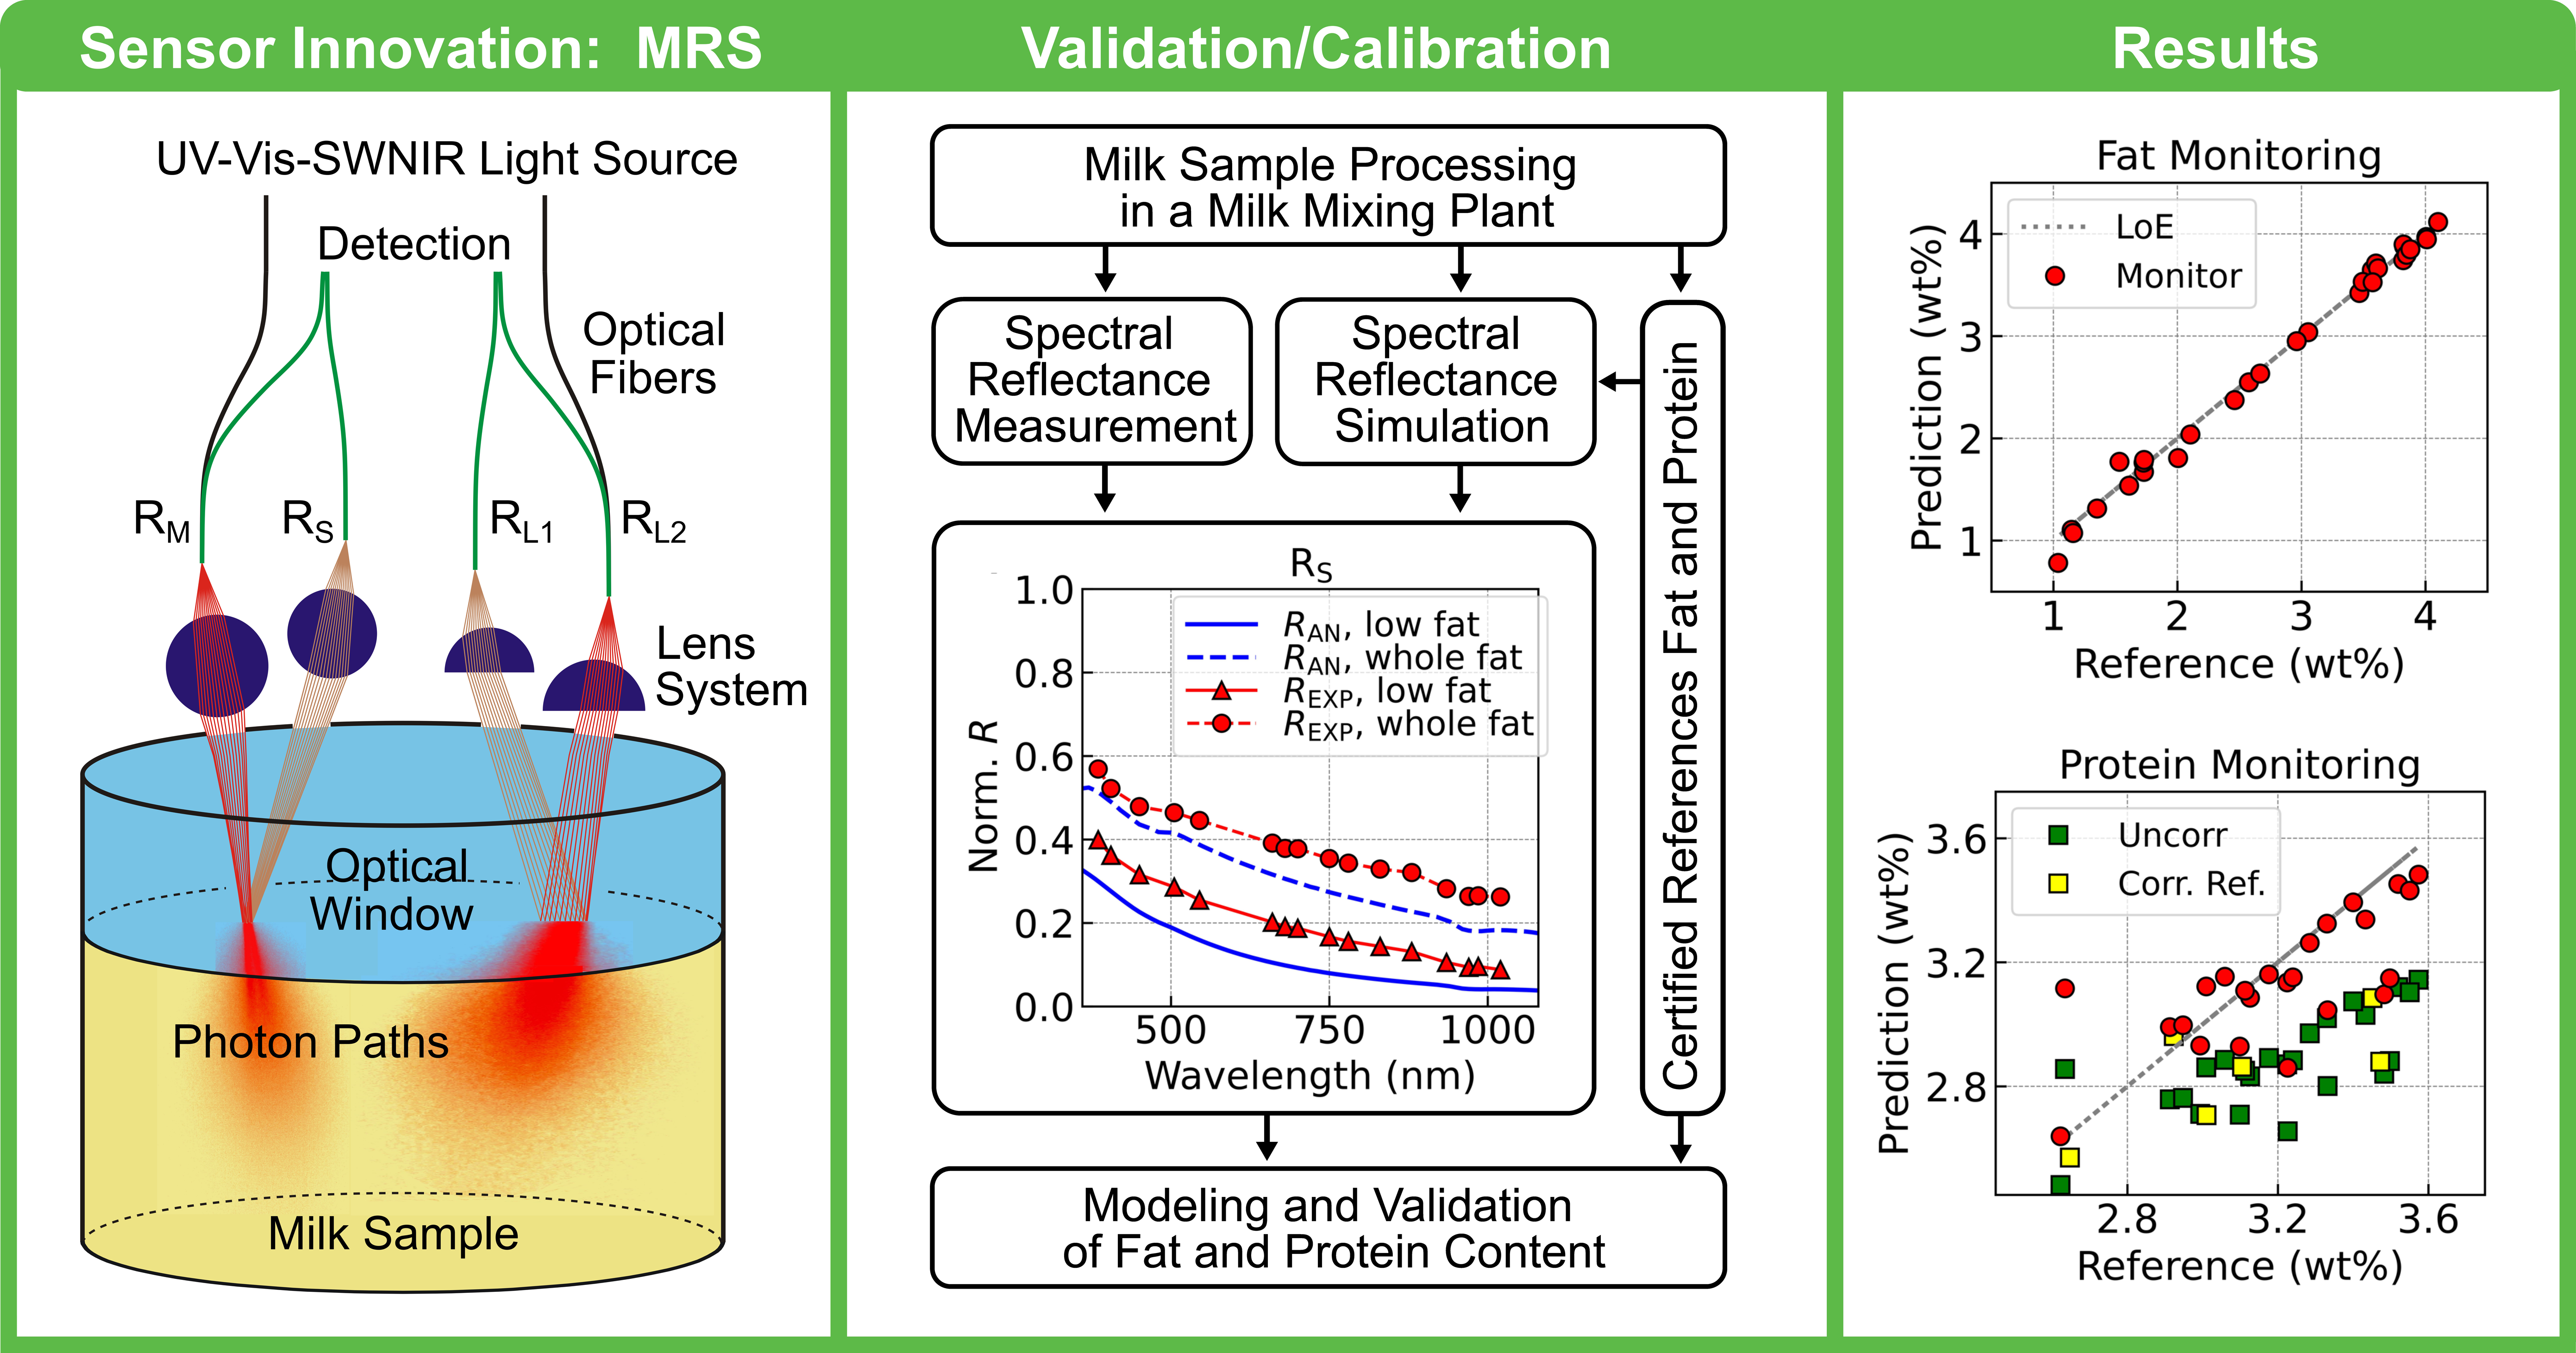
Keywords
Introduction
The advent of Industry 4.0 and the rapid advancement in smart manufacturing technologies have revolutionized the way industries approach production, quality control, and process optimization. At the core of this transformation lies the integration of real-time monitoring systems that enable the collection and analysis of data throughout the production process. In-line sensors play a crucial role in this context by providing continuous and immediate feedback on various product and process parameters, reducing the need for manual sampling and off-line analysis.1–3
In the food industry, in particular dairy production, quality control is paramount due to the sensitive nature of dairy products and the stringent regulatory standards they must meet. Milk, being a highly perishable and nutritionally complex liquid, presents unique challenges to quality assurance.4–9 Milk composition is inherently variable, influenced by factors such as cow’s diet, health, lactation stage, and environmental conditions. The two main constituents of milk that are of significant interest in quality control are fat and protein, which directly affect the nutritional value, taste, texture, and overall quality of dairy products.10–16 The fat content, for example, influences the creaminess and richness of milk, while the protein content is crucial for its nutritional profile and is a key factor in the production of various dairy products, such as cheese and yogurt. Accurate and consistent measurement of these components is essential not only for meeting regulatory standards but also for optimizing production processes and product formulations.17–19
Traditional methods of quality control in milk production typically rely on off-line techniques, where samples are taken from the production line and analyzed in a laboratory setting.20–22 Although accurate, these methods are often time-consuming, labor-intensive, and do not provide real-time feedback, which can lead to delays in detecting and addressing quality issues. Over the past few decades, several analytical techniques have been developed for the rapid determination of fat and protein content, many of them based on optical methods. This is because both fat and protein are related to the optical properties of milk products, making it possible to determine their concentrations using optical measurement techniques.23–28 Numerous optical measurement solutions are available.29–31 For example, approaches that use infrared spectroscopy to measure spectroscopic transmittance are quite common.32–36 However, different techniques, e.g., based on Raman spectroscopy, nuclear magnetic resonance (NMR) methods, imaging, or laser scatterometry, are also introduced for milk composition analysis.37–41 Most of these techniques can be integrated into the process as bypass systems and are thus considered as on-line measurements. They typically require sample dilution, temperature control, a pumping system, and sometimes the use of chemicals. However, because of the sample preparation methods (whether manual or automated), the state of the sample is altered, and it no longer accurately represents the original state of the fluid in the process.
In-line measurement techniques offer a compelling solution by enabling real-time, non-destructive analysis of milk composition as it flows through the production line. This approach not only improves the speed and accuracy of quality control. It also integrates seamlessly with automated process control systems, enhancing overall operational efficiency. To accommodate a wide range of applications and handle multiple prediction parameters for each measurement, the sensor must be capable of measuring multidimensional signals. Optical reflectance-based measurements are well suited for this purpose, as they enable continuous, non-contact assessment without changing the state of the sample.42–46 This method has also been applied to the analysis of milk samples.47–51
Milk production consists mainly of two processes. The first is conventional milk production, where raw milk is processed by separating the cream and then blending it with skim milk in a controlled manner to achieve the desired composition. The second process involves the production of recombined milk, which is created by mixing skim milk powder, water, and cream to form the final product. Recombined milk is commonly used in products such as cheese, yogurt, and ice cream, due to its versatility in formulating products with specified ingredients. It offers significant advantages in regions with limited access to fresh milk, particularly due to its extended shelf life. In contrast, conventional milk products are used mainly for traditional consumer products.
This paper introduces an innovative optical sensor for the in-line monitoring of fat and protein content in milk, leveraging advances in optical sensor technology and data analysis algorithms. Recently, a novel multi-wavelength method, known as the multi-reflectance spectroscopic (MRS) technique (MRS-Technology), has been introduced. This technique measures the quasi-continuous diffuse reflectance spectra of different light-source geometries and offers the deconvolution of fat and protein content based on one measurement. 52
To further develop the study of MRS, this contribution introduces a practical sensor system. The sensor is installed and tested in a milk mixing plant, where it is exposed to typical variations in the volume fractions of the main ingredients used for milk-based production. The detected signals from the sensor system are analyzed and compared with the analytical expectations. Based on four field studies using conventional and recombined milk processes, regression models are derived using multi-linear regression (MLR) to identify correlations between fat and protein content and multidimensional sensor signals. Lastly, we discuss the influences of milk temperature and homogenization pressure on the monitoring of fat content.
MRS Sensor
The developed sensor relies on reflectance measurement and operates as a backscattering technique, eliminating the need for mechanical components inside the sample stream that could disrupt ongoing processes. Moreover, it is well suited for in-line applications, enabling measurement of the sample material without dilution in bypass mode or the use of chemicals.
Sensor Head
Figure 1 shows a scheme of the optical parts referred to the sensor head. It consists of two ball lenses, two half-ball lenses (dark blue) as well as fibers for illumination (black) and detection (green). A window (highlighted in light blue) separates the sensor head from the sample material (yellow). The sample is illuminated by two different beams, each originating from the ball lens (far left) and the half-ball lens (far right), each coupled into an illumination fiber. The diffuse photons are collected with lenses, each coupled into the detection fibers, guiding the rays to the detection units.
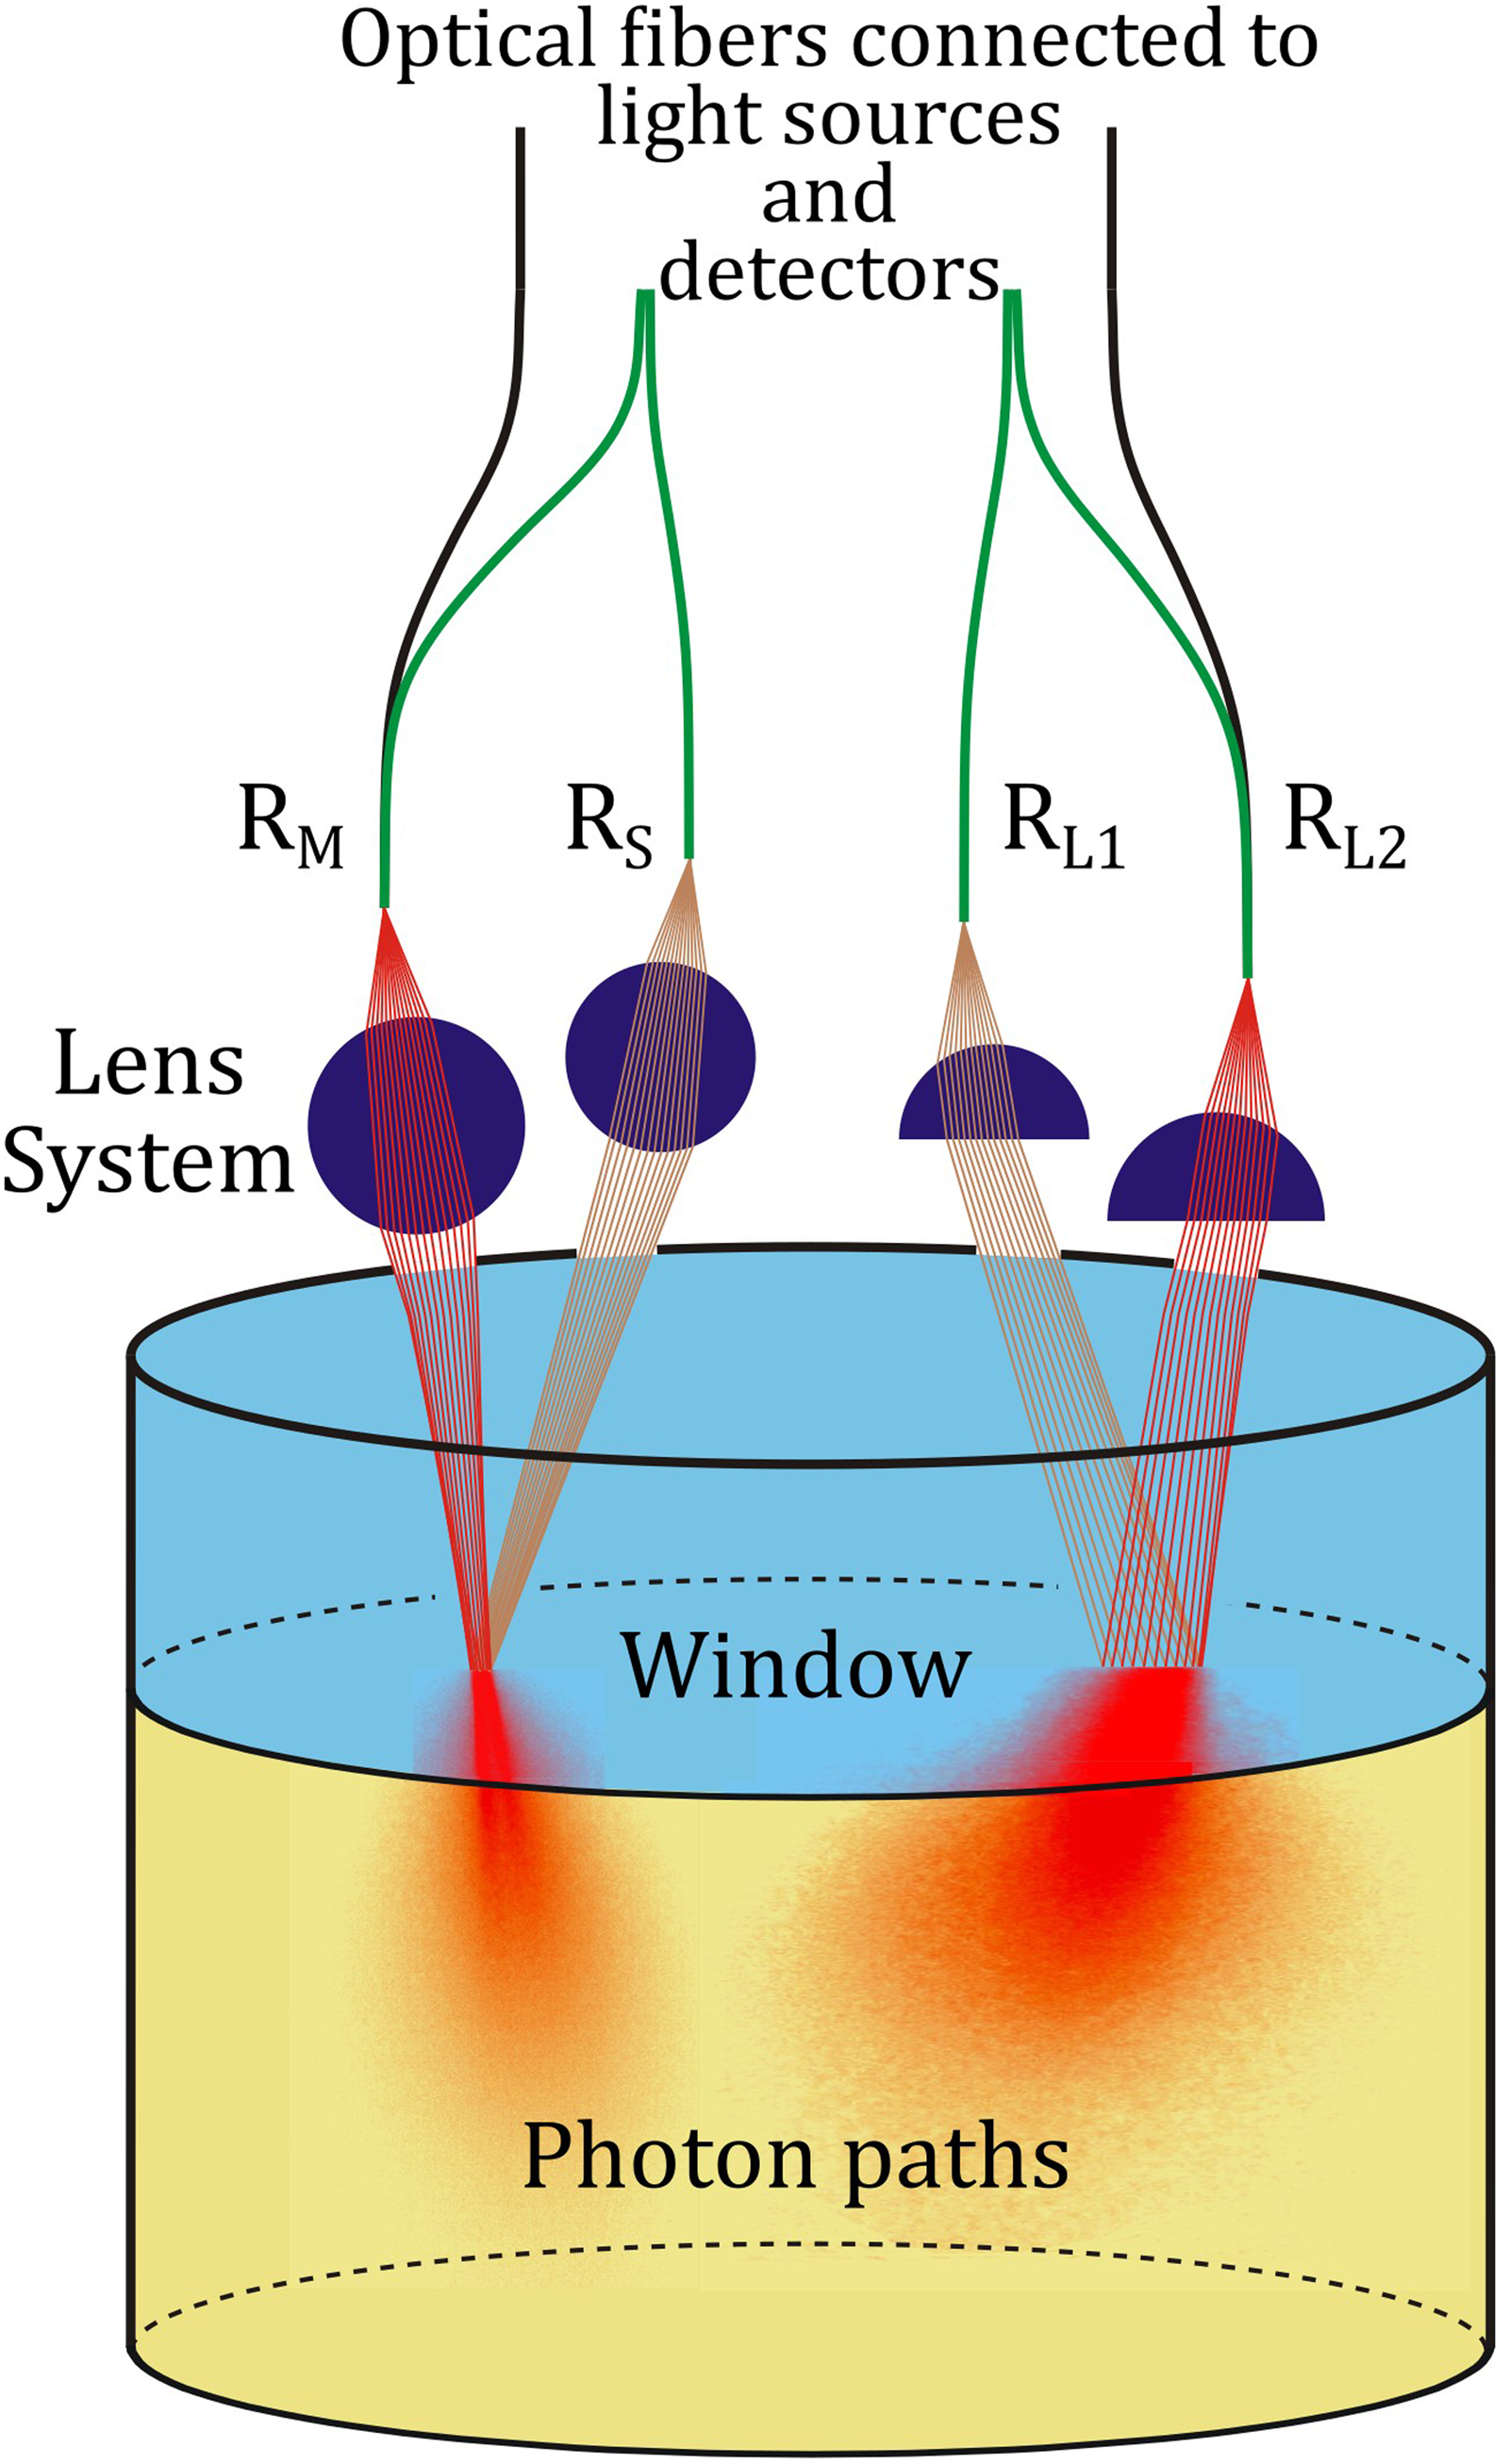
Scheme of the sensor head.
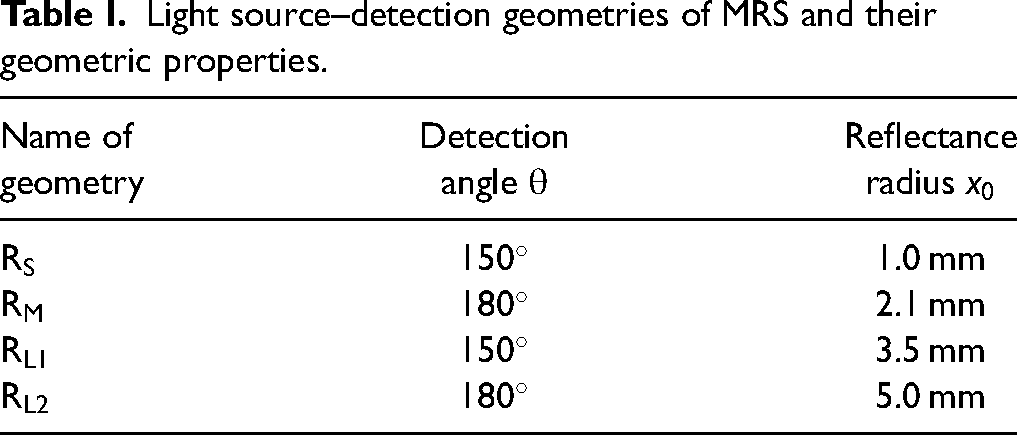
It is a main feature of the MRS sensor, that different signals of a sample are measured: the reflectance from a small (R
Light source–detection geometries of MRS and their geometric properties.
Sensor System
Figure 2 shows a schematic drawing of the sensor system, including light sources and detection units. Different wavelengths for the illumination in the ultraviolet–visible shortwave near-infrared (UV–Vis-SWNIR) spectral range are used. Light-emitting diodes (LEDs) are positioned on an electronic circuit, emitting light that is gathered through a condenser lens. This collimated light then strikes a diffuser element to ensure an even intensity distribution for subsequent guidance. An aspherical lens is used to collimate the light beam into optical fibers (highlighted in black) attached via SubMiniature version A (SMA) connectors, leading to the sensor head. The photon rays backscattered by the sample (green fibers) are directed towards an electronic circuit containing multiple photodiodes, that convert the rays into intensity signals. The opto-mechanical setup is constructed in a modular fashion, allowing it to be integrated into either a laboratory instrument or an in-line sensor. The identical setup offers the advantage of developing calibration models in the laboratory, using minimal sample material and subsequently applying these models to the in-line sensor. This flexibility is often lacking in the in-line sensor setup.
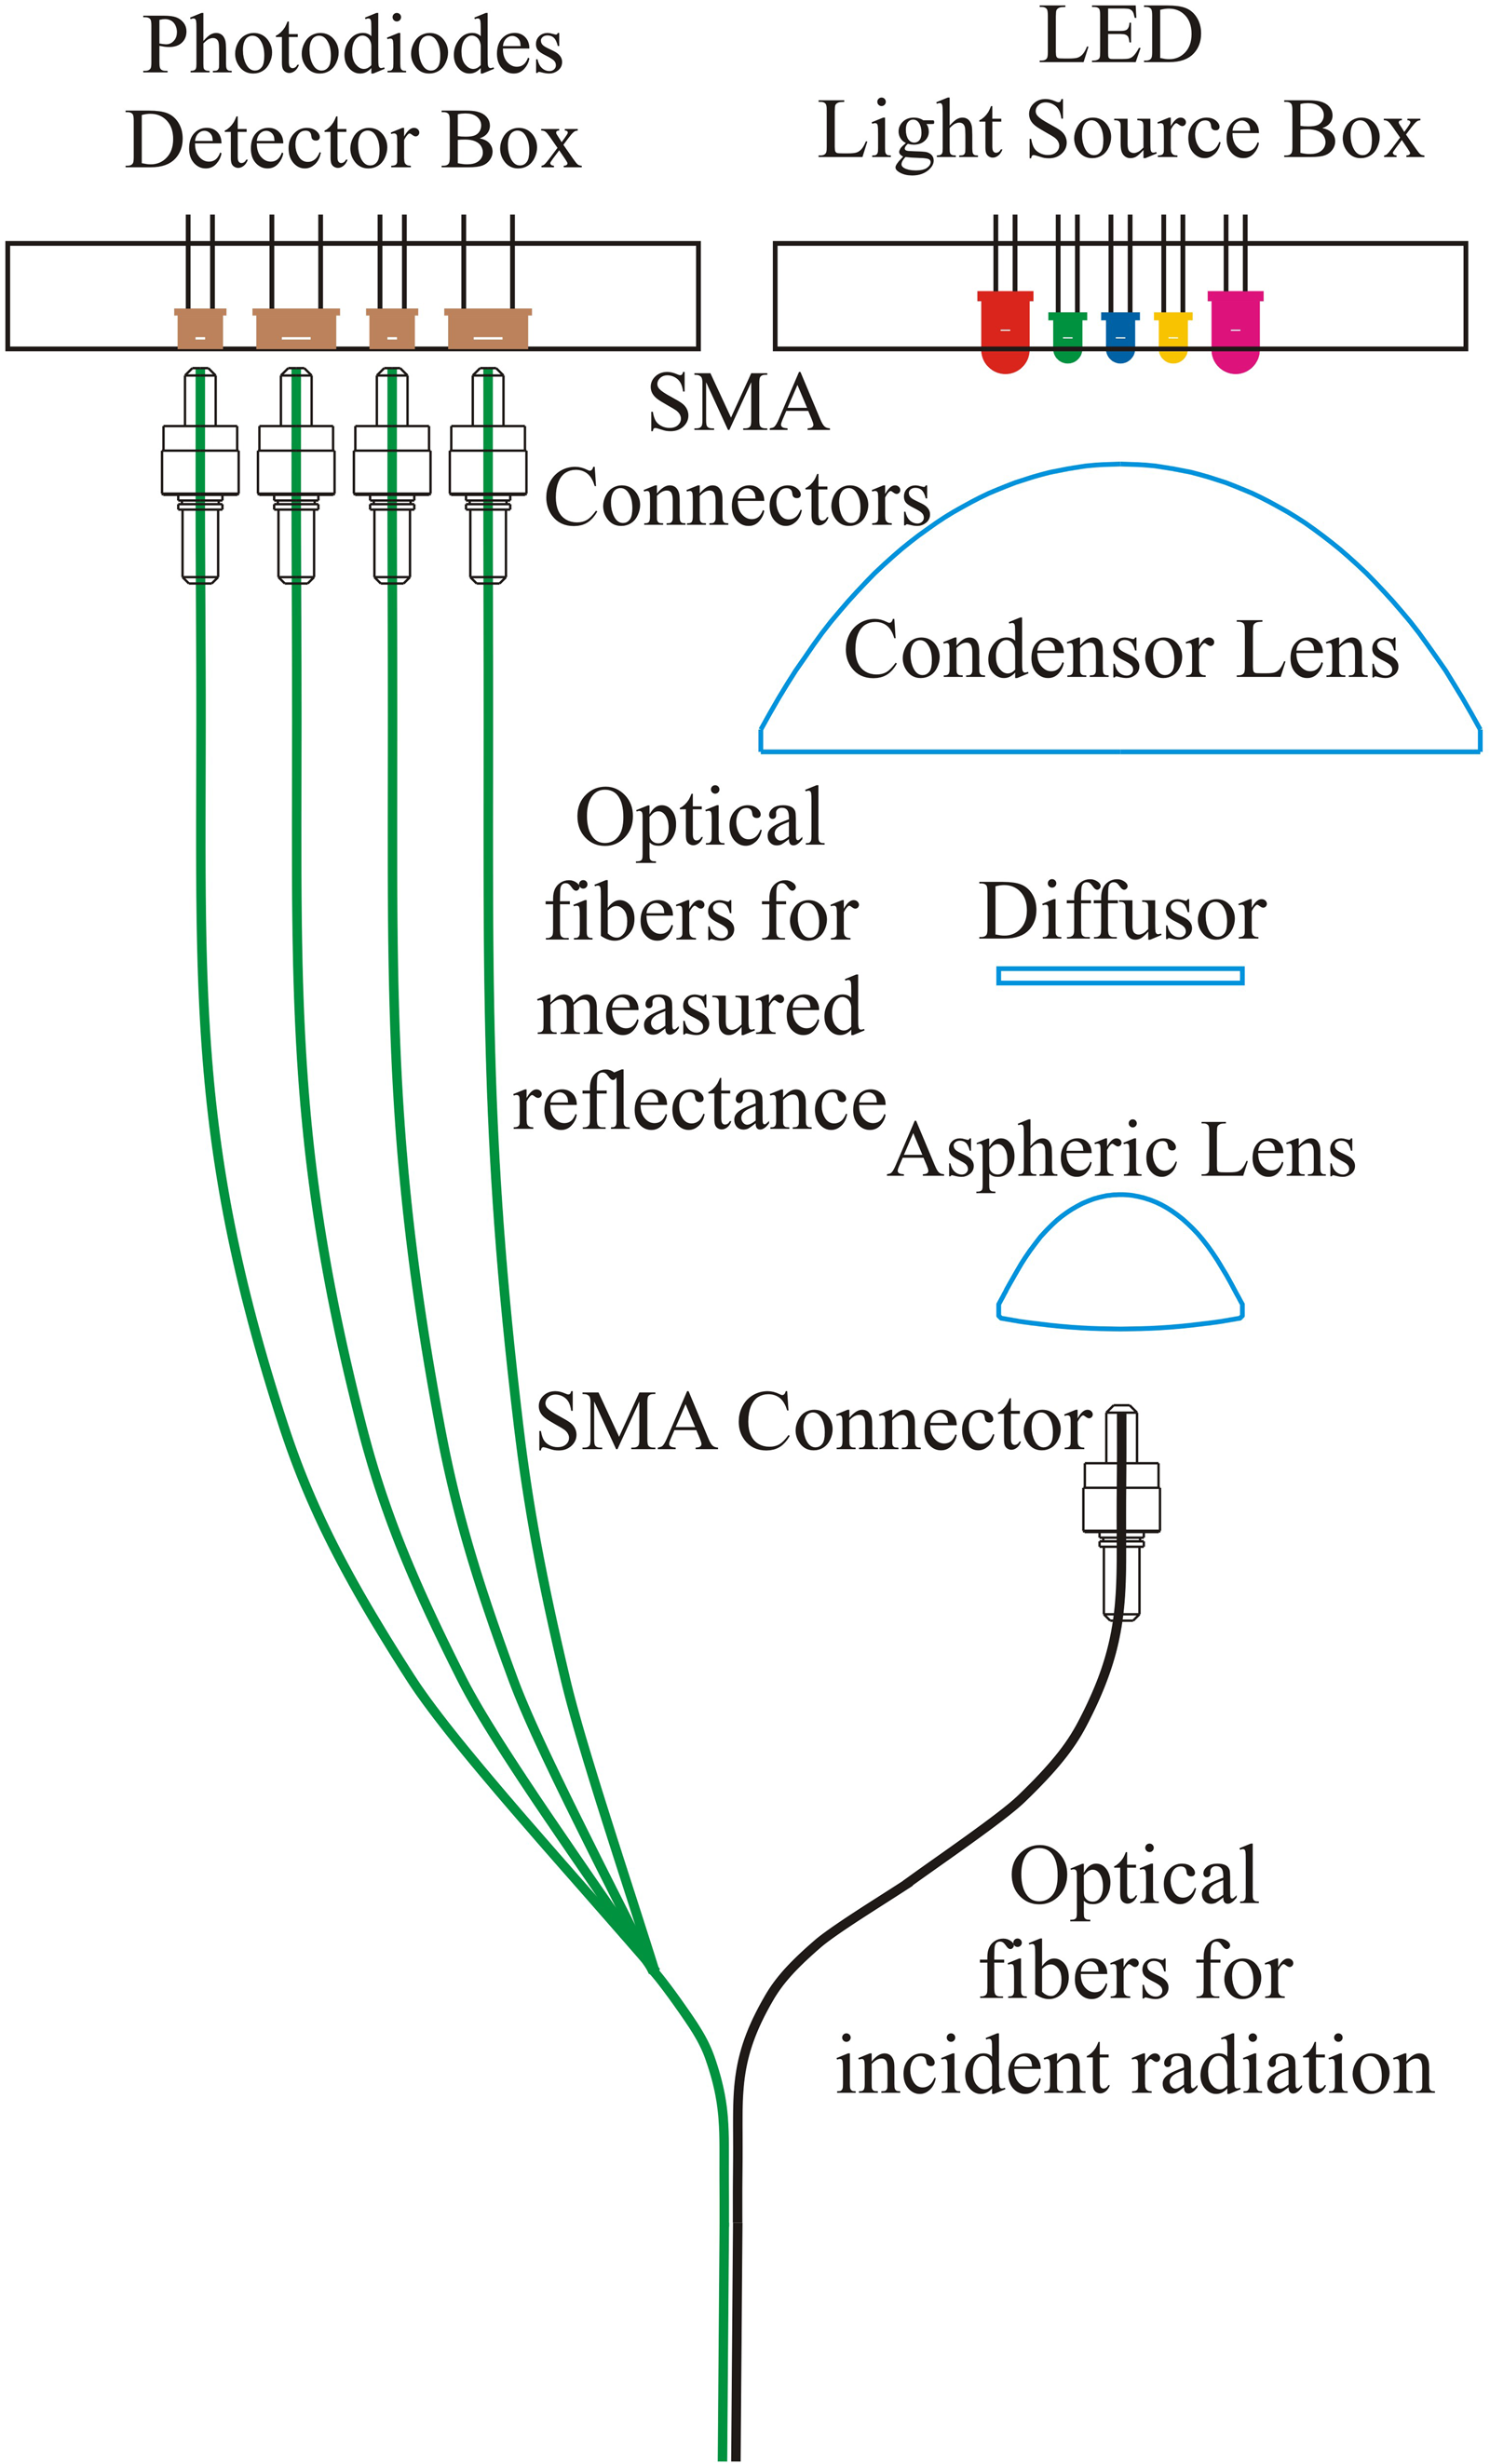
Scheme of the sensor system.
The in-line sensor system is mounted on a standardized VARINLine housing (depicted in Figure 3), chosen for its ease of integration into the process and its ample space, reducing internal reflection concerns. Within the milk mixing plant, the nominal diameter of the pipe measures 40 mm. The process configuration involves a tank equipped with a temperature control element and a stirrer. A pump transports the sample to a homogenization apparatus, where a two-stage pressure process ensures thorough homogenization of the mixture. The sensor is positioned upstream of the homogenization apparatus. The sensor head is attached to the process pipe using a clamp (see Figure 3, right side), positioned opposite the sample valve (as shown in Figure 3, left side). Upon sampling, an electronic impulse is captured and processed by the industry computer (not depicted). The sensor head itself remains obscured within a specialized air- and water-cooled multifunctional tube (MFT). It enables easy replacement, or maintenance, of the sensor head during production without interrupting operations. The light cables (optical fibers) are shielded by a flexible protective hose and connected to the detection processing unit, housed in a splash-proof metal enclosure. The industrial computer is installed with sensor software and a user interface, and is connected to the processing unit housing via electronic cables. A single measurement cycle spans approximately 20 seconds.
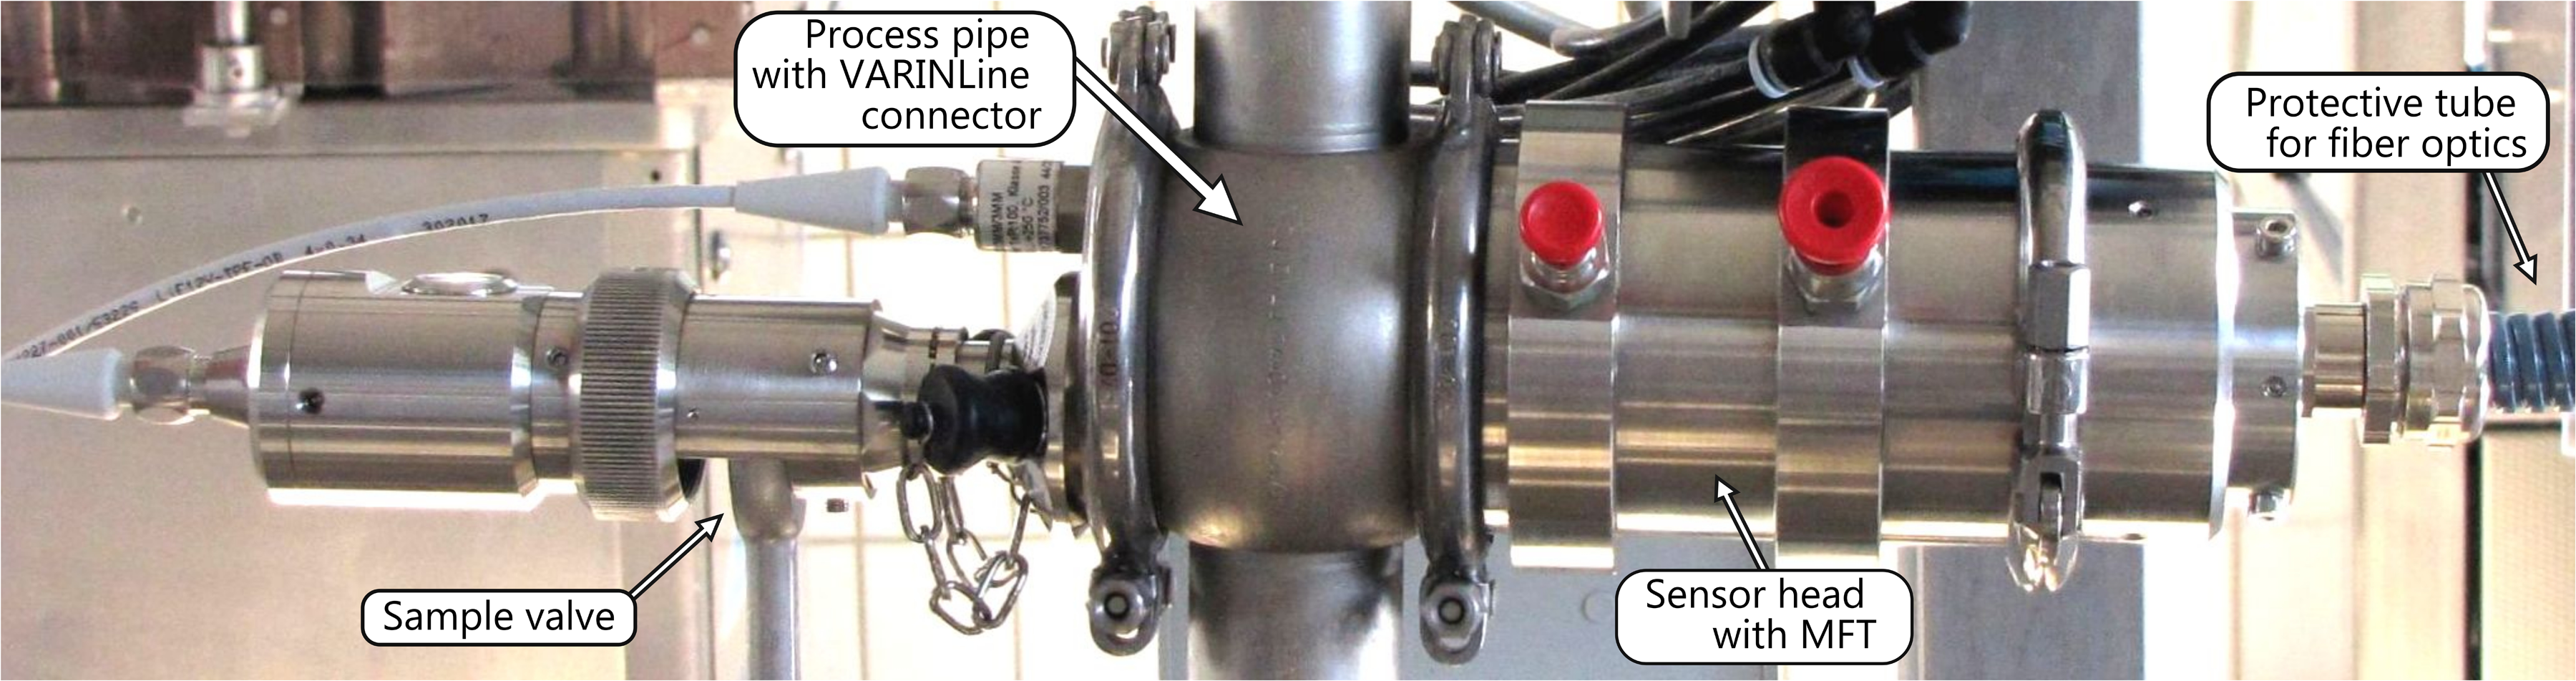
Photograph of the sensor head.
Material and Methods
The applied methodology of the study is illustrated in Figure 4. Four field studies using conventional and recombined milk, with differing concentrations of fat and protein, are processed at a milk mixing facility, adhering to standard process parameters and range of ingredient compositions. Throughout processing, the sample was continuously monitored using the MRS sensor and reflectance data. For each variation step in the concentration of fat and protein content, a sample volume is drawn through the sample valve. These samples are then subjected to laboratory analysis for reference values of fat and protein content. Using the reference values, the analytical spectra are calculated and compared with the experiments. 52 However, the reference values are mapped to the corresponding sensor data and a regression model is performed for both experimental and analytical results. Based on one obtained model, a validation is performed. The influences of the variation of the main process parameters (temperature and homogenization pressure) on the monitoring are discussed.
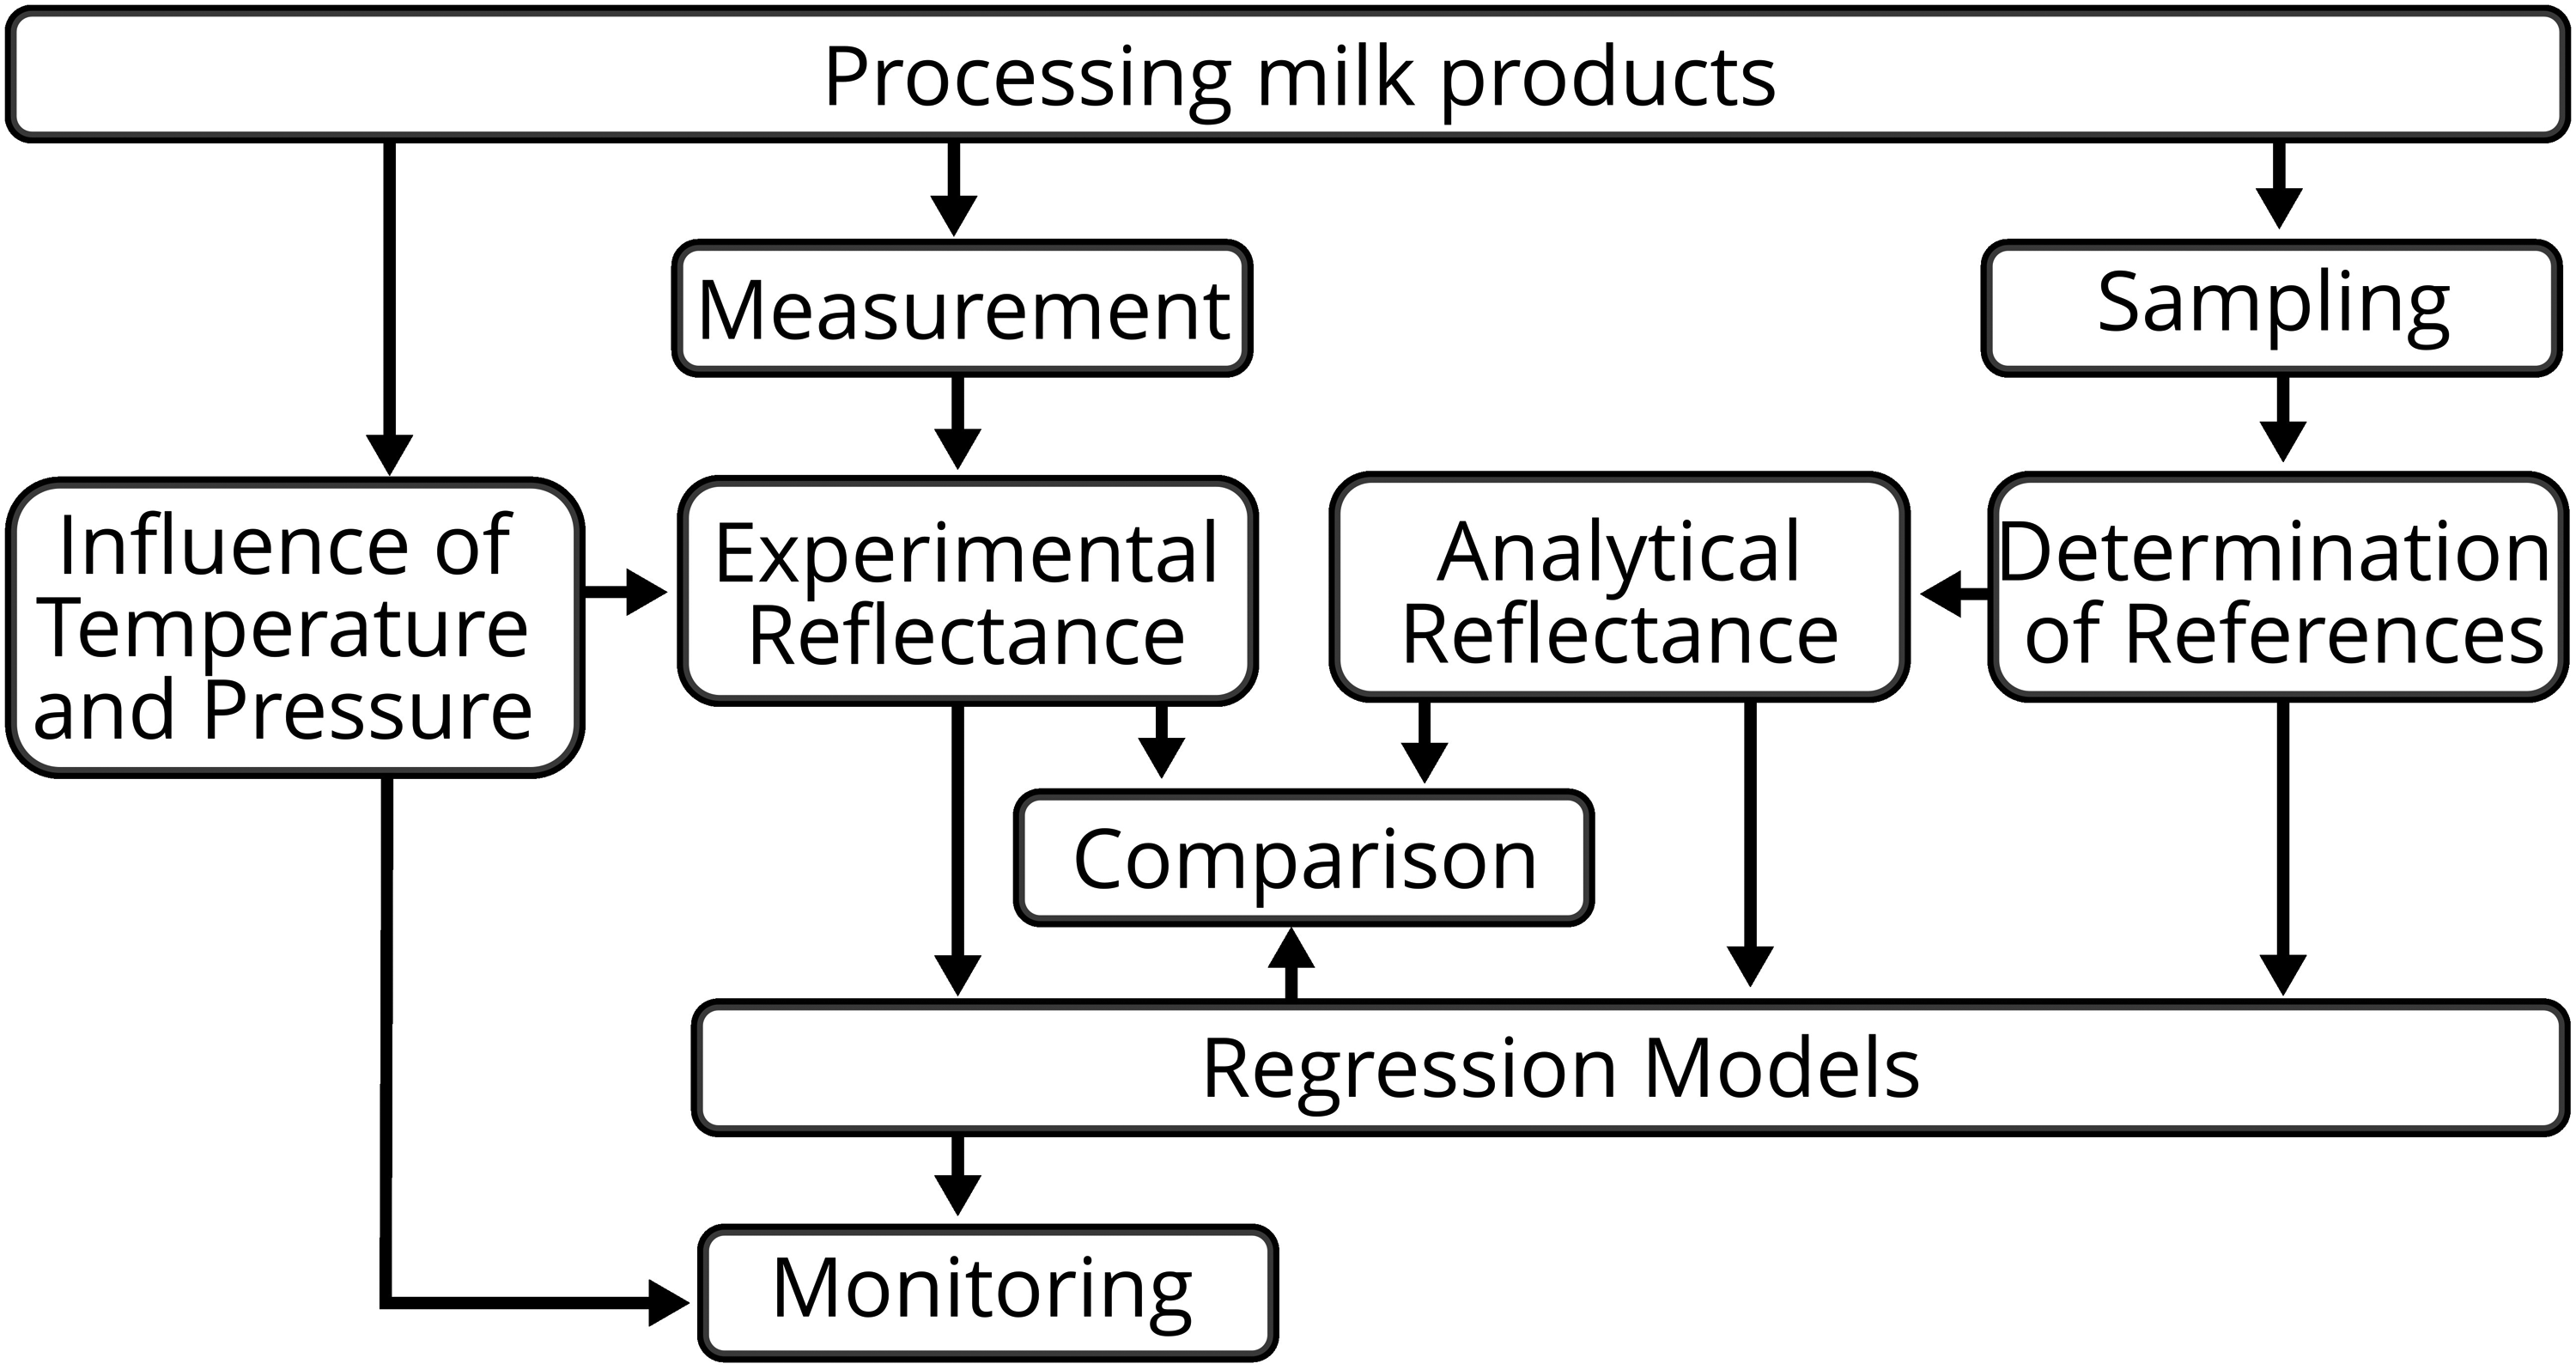
Procedure overview of the methods and their dependencies.
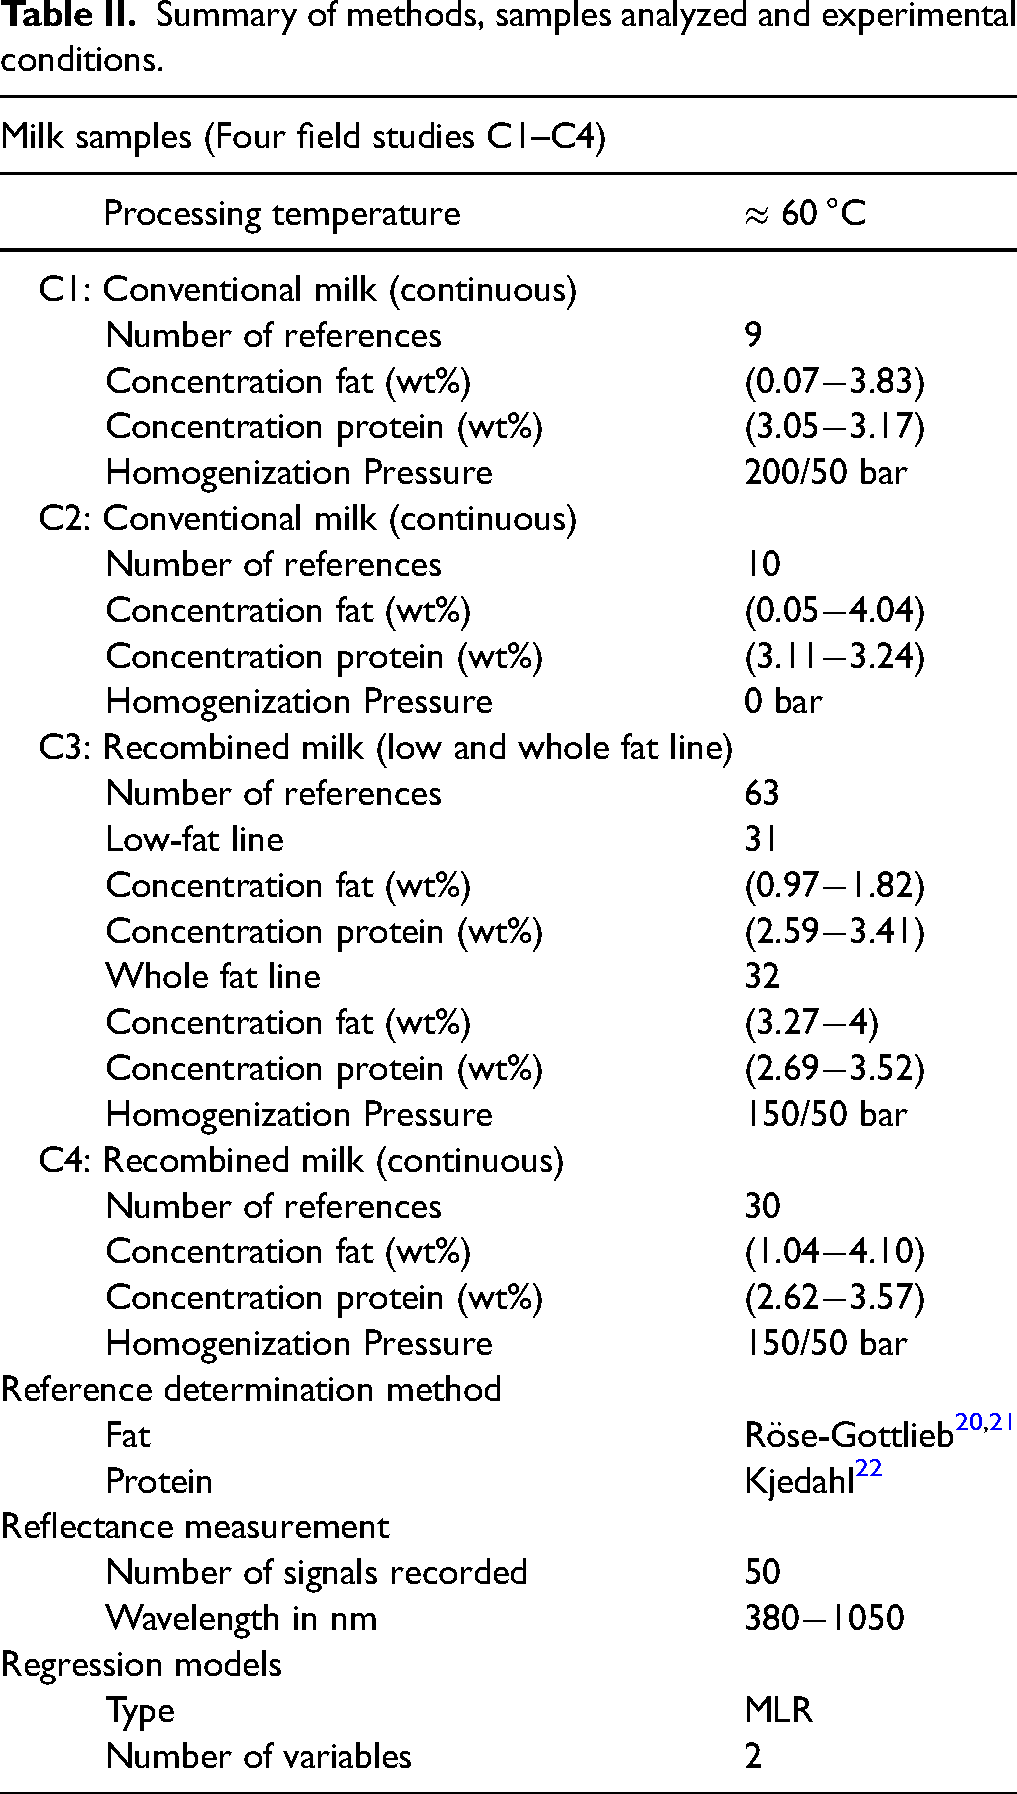
The process parameters within the milk mixing plant are set to typical values for ranges of fat and protein content, homogenization pressure, and process temperature (see Table II). Four distinct measurement studies were conducted that included the two main types of milk. The first two field studies, denoted as C1 and C2, involved the processing of conventional milk. These processes involved the mixing of skim milk and cream. C1 data comprised measurements with a two-stage homogenization, while C2 involved a non-homogenization procedure. Both C1 and C2 studies include a continuous fat range between 0 wt% and 4 wt% with nine and ten steps, respectively. The latter two field studies, identified as C3 and C4, involve the recombination of milk components. This process mixes water, cream, and skim milk powder to regulate the fat and protein content. Specifically, in C3, the focus is on the two standardized fat contents 1.5 wt% and 3.5 wt%, respectively. Each standardization line is characterized by slight variations in content matter. C4, on the other hand, covered a continuous spectrum, spanning the complete fat range from 0 wt% to 4 wt%, in a quasi-continuous fashion and, more or less, equally distributed measurement points. In regions with limited fresh milk availability, rapid demand growth, or inadequate cold storage and supply chains, recombined milk is widely used to produce liquid milk, condensed milk, yogurt bases, and frozen desserts. 53 Based on this, the field study is primarily focused on the growing market for recombined milk, with a brief comparison to conventional milk products. Each processed batch consisted of approximately 55 kg of milk, which was filled into a tank, mixed, and adjusted for temperature. Field studies C1 (1 batch) and C2 (1 batch) were carried out on the same day, with C2 processed in the morning and C1 in the afternoon, each lasting approximately three hours. Field study C3 was conducted over four measurement days, with two batches processed per day (eight batches in total, each with eight measurement points). At an interval of approximately 5 minutes, a defined mass of milk powder and cream was added to reach the next reference step, allowing homogenization and mixing before sample collection and measurement. Field study C4 took place over two days, with two batches processed on the first day and one batch on the second. C4 was carried out approximately one month after C3 to allow laboratory analysis necessary for model development. For all studies, the mixture undergoes gentle stirring by the plant machinery and is heated to a standard dairy processing temperature of approximately 60 °C. The sample is conveyed through the system through a pump to the homogenization apparatus. The two-stage homogenizer (GEA Mechanical Equipment, Niro Soavi, Parma, Italy) is set to conventional milk processing parameters (if not stated otherwise, 150/50 bar for recombined milk and 200/50 bar for conventional milk) to effectively homogenize the sample. After homogenization, the sample passes the sensor location, and the reflectance data is recorded. Approximately 200 ml of sample material is collected for each reference with the sample valve and stored in the refrigerator until the end of the day. At the end of the day, these samples are collected by the certified laboratory located at the same address. Reference data for volume fractions of fats and proteins are acquired using traditional wet chemical methods.20–22 Subsequent to each batch change, the process line is cleaned using the clean-in-place (CIP) procedure, before initiating a new field study or batch processing.
Summary of methods, samples analyzed and experimental conditions.
Data Acquisition
Continuous reflectance measurements were conducted throughout the field study and the data are automatically stored in a database. During sample drawing, a digital flag was appended to the corresponding dataset. This digitized documentation of the drawn samples enabled seamless mapping between the drawn samples and the corresponding references and their sensor data recorded at the given timestamp. In addition to the reflectance measurements of the sample, the system records both the dark signal and a reference signal for each measurement for internal control. The raw data are numerical counts scaled between 0 and 65,535.
For the purpose of modeling and sensor calibrations, before the actual field studies a temperature function of the instrument was determined. For this a high-reflective Teflon plate (Gigahertz Optics ODM98, Germany) was placed in front of the measuring window and the sensor was placed in a climatic chamber. The temperature was controlled in a range of 10 °C to 30 °C and the intensity data were recorded. On the basis of acquired data, a temperature normalization function is obtained. The recorded data from the milk samples are then normalized on the basis of the temperature correction, the internal reference signal, and the dark signals from the electronic components. In a further step, the optical background of all channels was determined by measuring the continuous phase of milk, clear water.
The raw data were subjected to the following procedure: subtraction of the dark signals from the measurement signal, application of the temperature function, normalization to the reference signals, and subtraction of the optical background. Furthermore, the obtained values are corrected on the basis of the reflective quality of the previously used teflon reference standard. The internal reference signal is measured by additional fibers within the fiber bundle used for incident radiation, directing the signal to a receiver. The sample is illuminated in flash mode, with the dark signal measured between consecutive flashes. This procedure leads to (normalized) reflectance values ranging between 0 and 1, which were then used for comparison with the analytical dataset.
Comparing Experimental with Analytical Spectra
The experimental data are compared with the results obtained from the analytical formula (Eq. 1). For simulations, Mie calculations of milk are first performed, taking into account the experimental parameters (temperature, homogenization pressure), as well as the reference values for the fat and protein content from the laboratory.
54
As a result, the macroscopic optical properties are incorporated into the analytical description of MRS.
52
The comparison begins with a qualitative evaluation by visually inspecting the spectra and identifying key spectroscopic features. This is followed by the calculation of cosine similarity between the two datasets. Cosine similarity is widely used to evaluate similarity between multidimensional datasets, including spectral analysis.55,56 It measures the cosine of the angle between two spectral vectors in a multi-dimensional space, providing a normalized similarity score between
Regression
The spectral information is correlated with the content of the fat and protein reference values. The model process employed a multi-linear least-square regression (MLR) model and was applied to both the fat and protein content, independently. This procedure is performed for both analytical and experimental results for all field studies. The resulting model accuracies are then compared and evaluated using RMSE as a quality metric and discussed. For validation, the experimental data from C3 were used for modeling. The data from field study C4 were then used for the validation of the fat and protein model. Furthermore, the effect of fluid temperature and homogenization pressure on the monitoring task is analyzed and discussed.
Results and Discussion
Comparison of Experimental and Analytical Spectra
The used approximated analytical equation of MRS is given by Eq. 1.
52

The analytical derived spectra are shown together with the experimental reflectance, using the data from the field study C1, in Figure 5. The visual evaluation of similarity based on spectroscopic features is as follows. Higher fat content corresponds to higher reflectance values. Another observation is the absence of absorption effects in the spectra obtained from the small measuring volume R
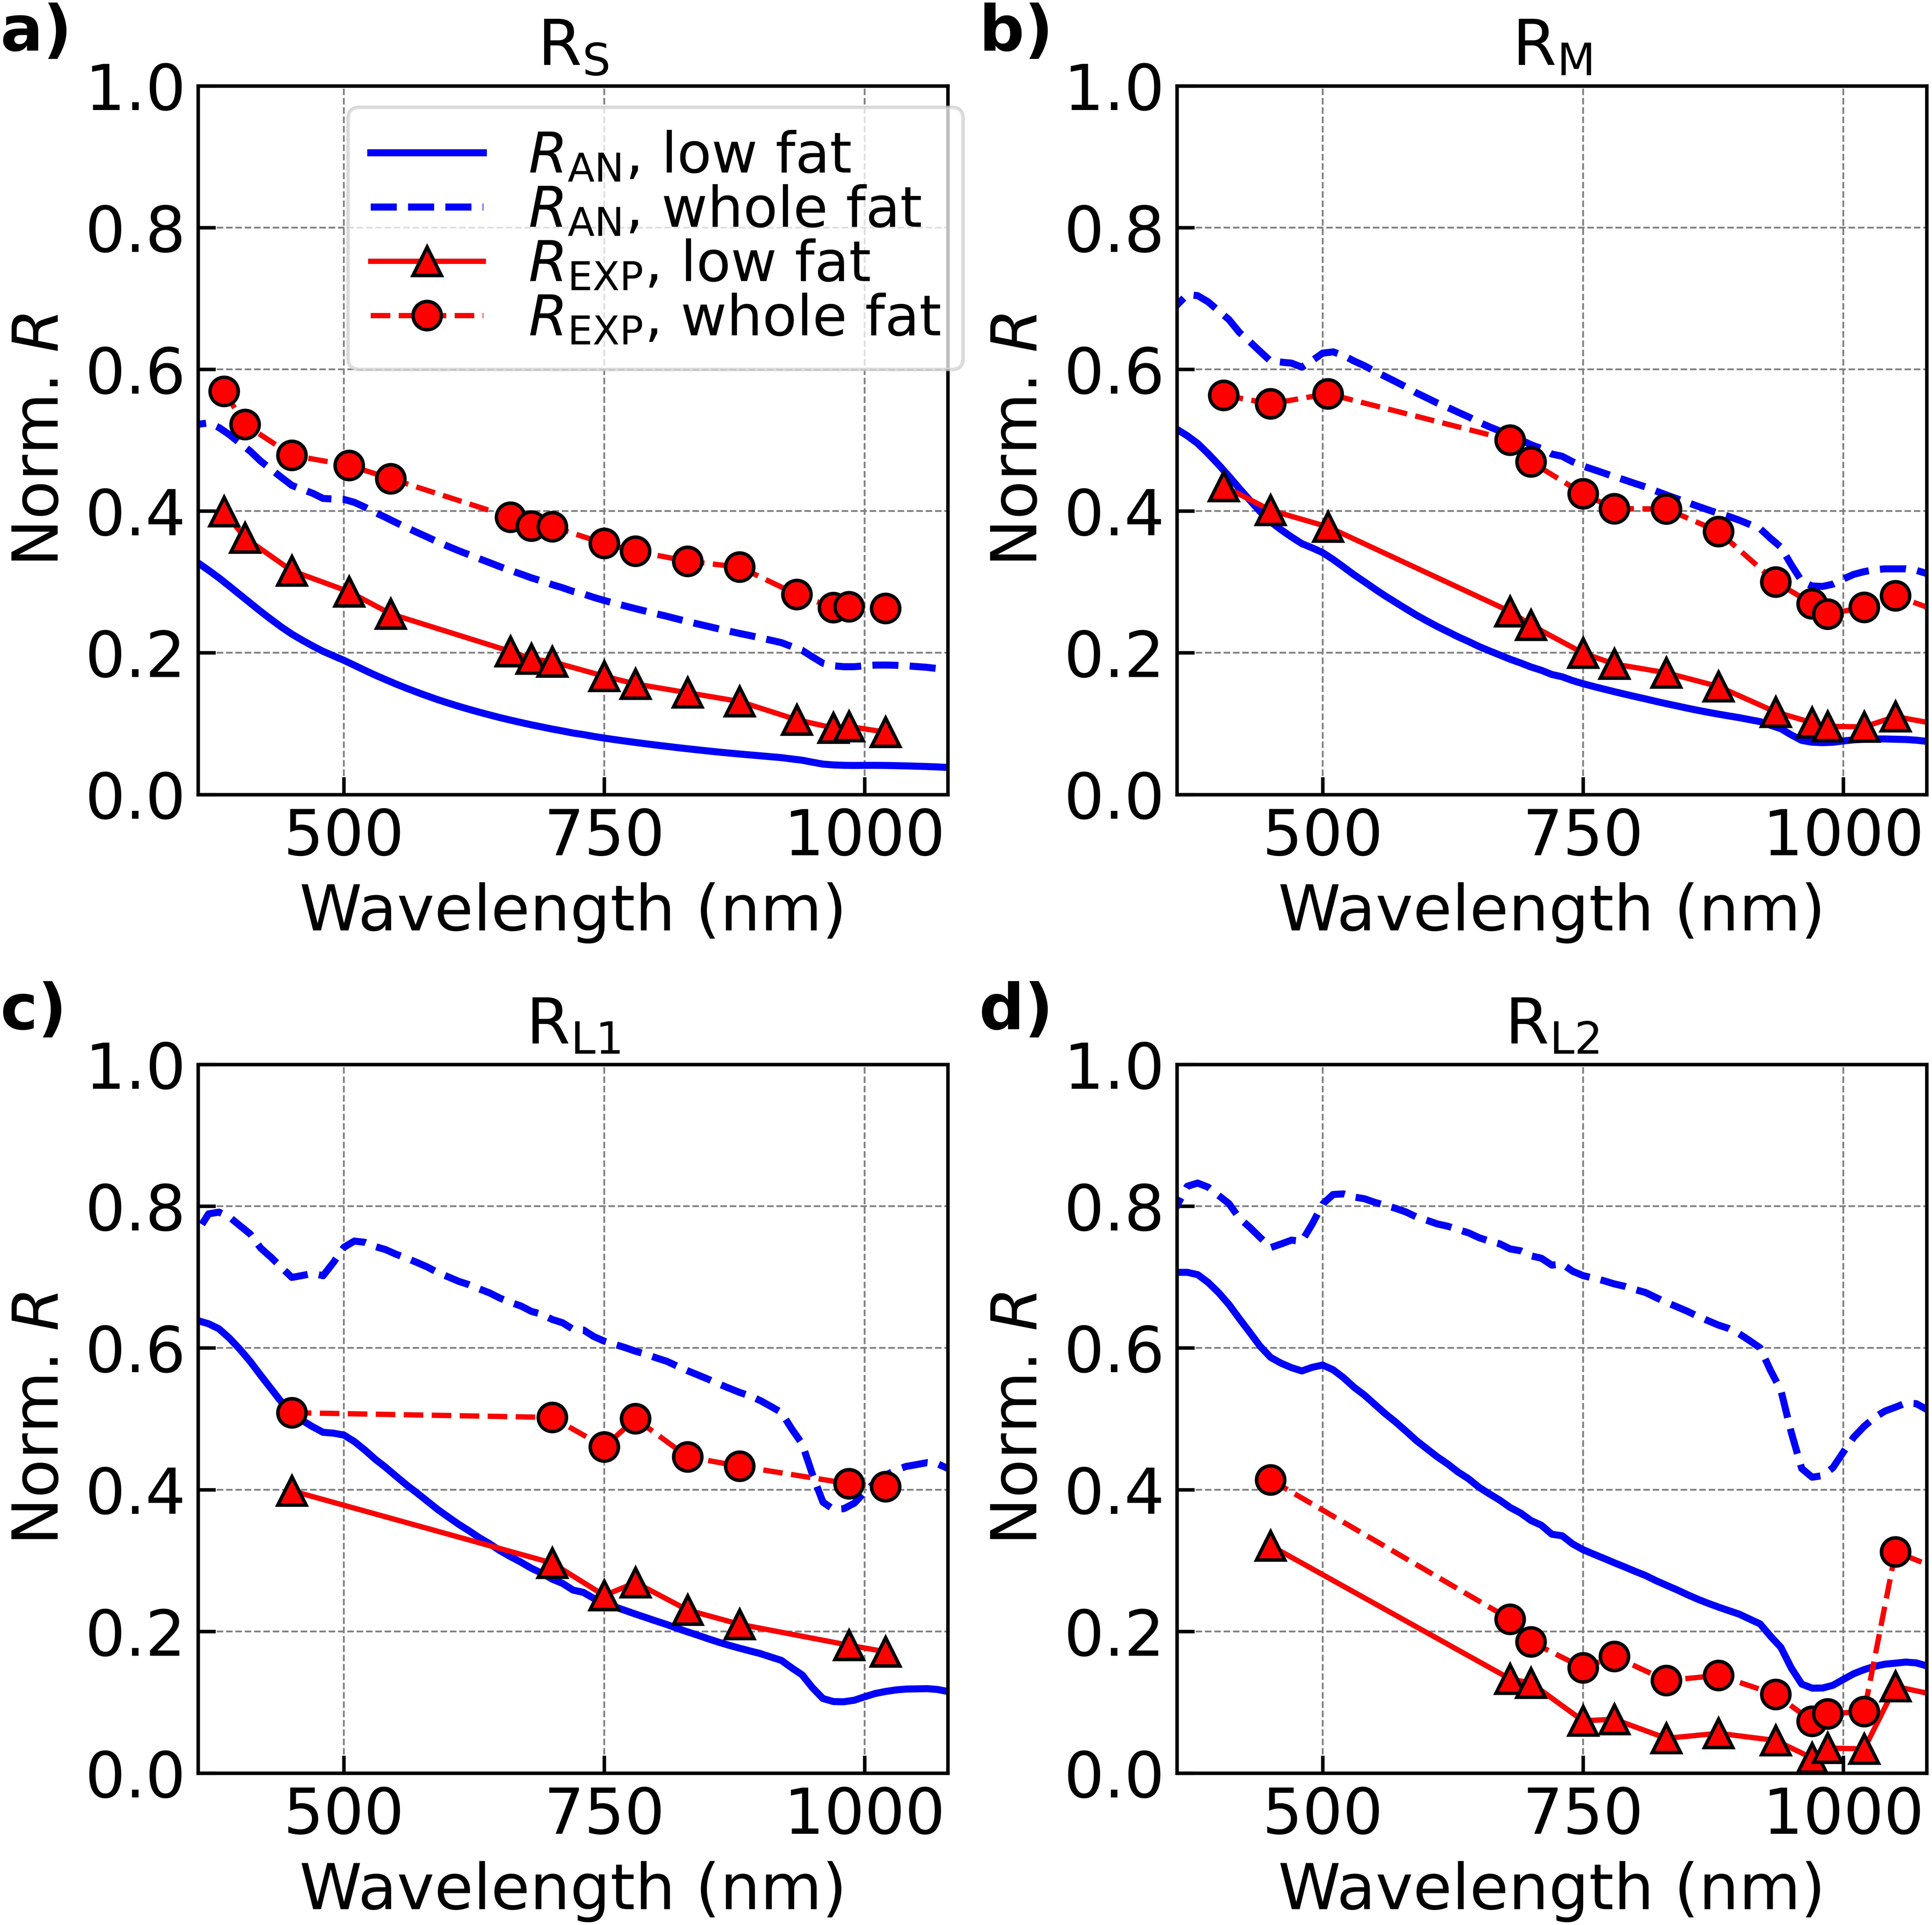
Experimental (red symbols) and analytical derived spectra (blue lines) of a low fat (solid line) and a high fat sample (dashed line) from the field study C1 (conventional processed milk) for (a) small volume reflectance, (b) medium volume reflectance, (c) larger volume reflectance and (d) far larger volume reflectance.
It appears that the fundamental features of MRS are captured in the experiment, despite an overall dynamic mismatch. In the case of the small measuring volume, the experimental reflectance is underestimated within the analyzed spectral range. In contrast, with larger measuring volumes, the experimental data tend to be overestimated. This discrepancy likely arises from the normalization procedure applied to the experimental data. In particular, the high deviation for R
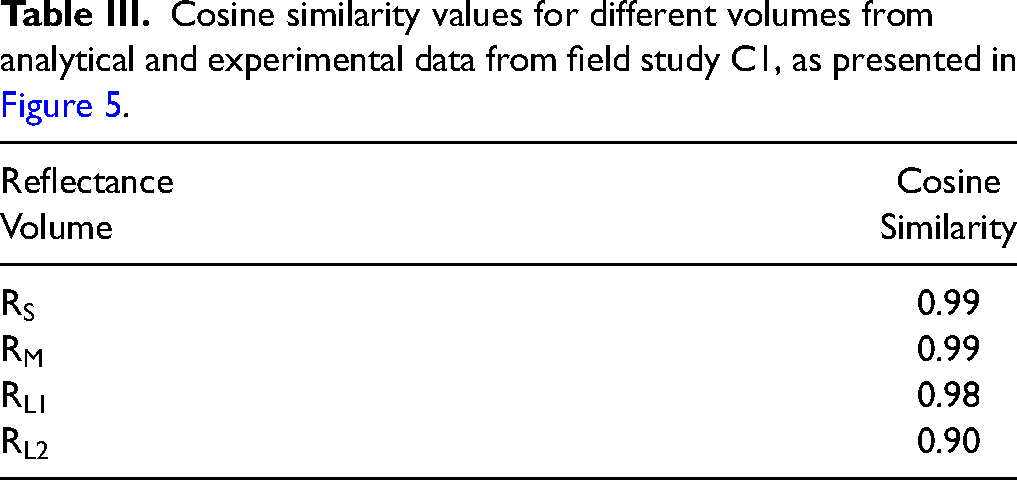
For a more objective comparison of the analytical and experimental reflectances of the field study C1, cosine similarity analysis is performed. Cosine similarity focuses more on shapes and patterns independent of the magnitude in the intensity and is therefore found to be a proper metric for analyzing and comparing the essential spectroscopic features of the datasets. The results are listed in Table III. The visual appearance of similarity correlates with the cosine similarity values, indicating good agreement. Especially the visual matching spectra in Figures 5a and 5b result in a very high similarity value. Although Figure 5c shows a visual mismatch, which is in Figure 5d even more pronounced, the similarity metric correlates with the visual appearance. However, even the lowest similarity metric (of R
Cosine similarity values for different volumes from analytical and experimental data from field study C1, as presented in Figure 5.
The discussion of the spectra comparison of C2–C4 turns out to be very similar to C1. The reflectances of C2–C4 are visualized in Figure S2, Supplemental Material. In addition, some obvious differences should be mentioned here. Compared with conventional milk, one can notice that the dynamic in all measurements and source-detector geometries in the analytical and experimental description are much lower for the non-homogenized samples (C2) in contrast to applied homogenization (C1). For the non-homogenized field study, the optical properties are calculated using a droplet size distribution of fat globules of around 3 microns. In case of homogenization, the mean droplet size is around 900 nm in diameter. Because of mass conservation, the number of droplets increases with decreasing particle size as a result of homogenization. Both parameters have a significant impact on the macroscopic optical properties. When comparing conventional with recombined experimental milk data, looking at the source-detector geometry R
Regression Analysis
For model building, both the experimental and analytical spectra of all field studies are used. For the sake of model interpretability, all regressions are conducted using a two-component MLR. All possible combinations of characteristics (spectral measurement points) are considered for the model development. After finding the model, the RMSE value between prediction and reference is calculated for each pair of components. Then the pair of components, which results in the lowest RMSE is chosen for model building. The results in Table IV represent the model characteristic using this model, for the fat and protein for each field study.
Results of 2-component MLR analysis of the analytical and experimental data of all field studies using the MLR features which leads to the best models in terms of lowest RMSE values.
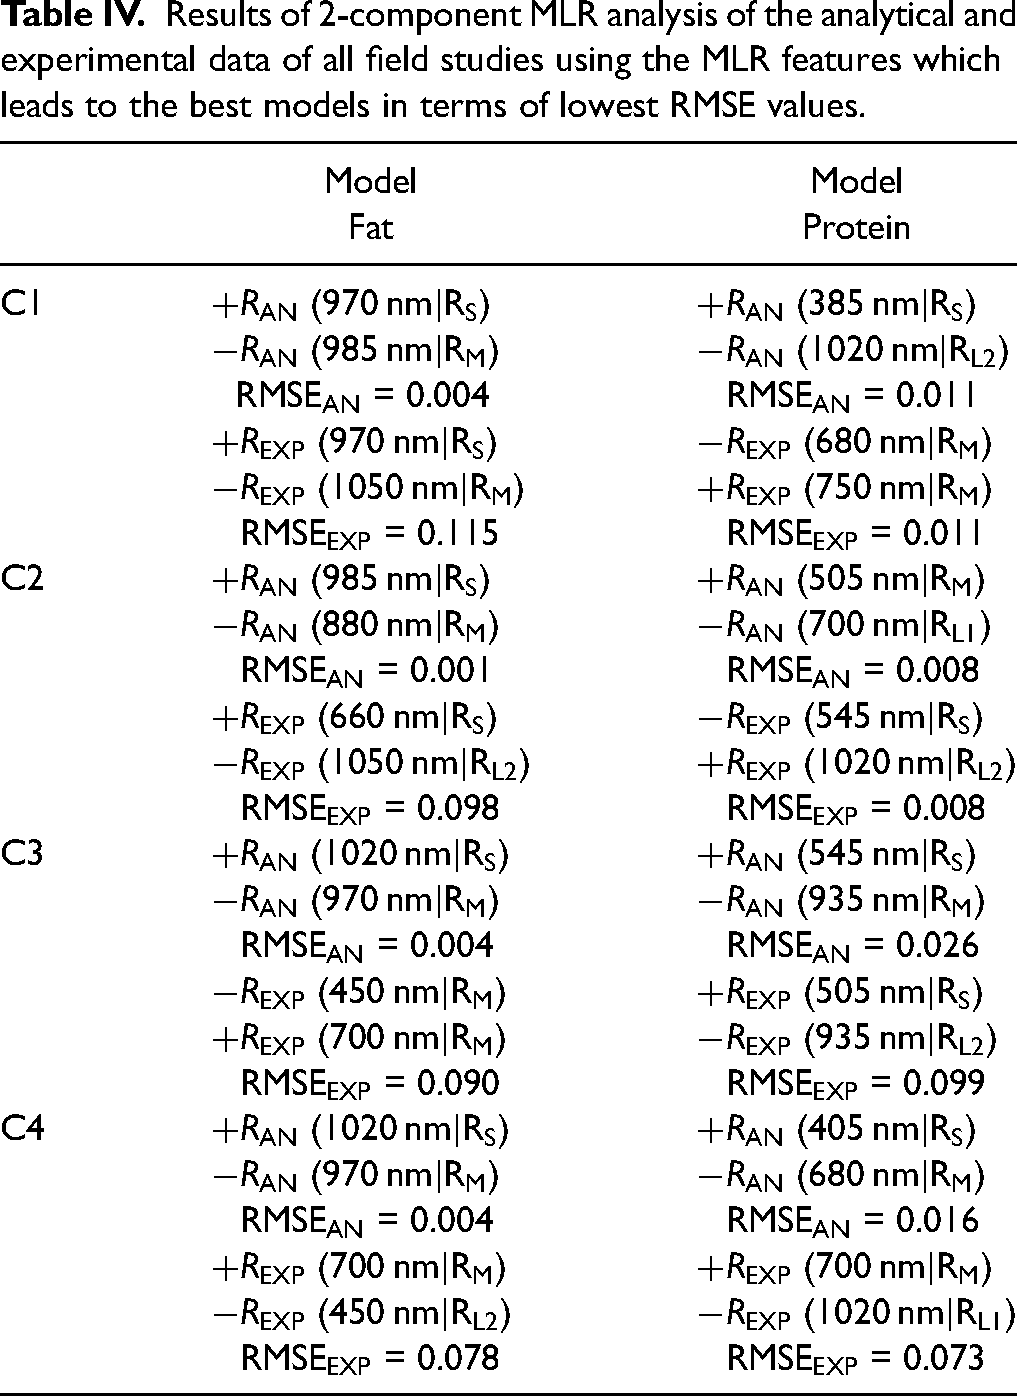
Each model consists of a negative and positive regression coefficient related to the respective reflectance channels. In most cases the positive ones denote smaller volume reflectances (R
Regarding the fat model, as already mentioned, the reflectances of larger volumes are affected by absorption effects much more than reflectances from a small volume. For example, in case of the recombined milk (C3 and C4), for the experimental reflectances, each of the fat models consists of a larger volume reflectance at 450nm. At this wavelenth, carotene bound to the fat globules absorbs the light. The fat content correlates strongly with carotene. The negative sign expresses the inverse relation between larger volume reflectance and fat content. This phenomenon cannot be observed for the analytical reflectances from C3 and C4. A reason could be that the input data for simulating the reflectances by means of Eq. 1 does not accurately represent the real world data, especially the concentration of absorbing carotene bounded at fat globules. Further, the data-driven MLR (best model mode) could be a reason. In case of the measured reflectances of C1 and C2 (conventional milk), this is due to the weaker absorption of carotene compared to C3 and C4 (recombined milk). As discussed in the previous chapter, the local minima at 450 nm is stronger for recombined milk.
Nevertheless, these considerations indicate that the absorption-influenced large volume reflectances are important for the fat models. However, besides the negative large volume reflectances the role of the positive small volume reflectances is also an important one. These reflectances act as a correction term within the models. Since the negative large volume reflectances are, besides absorption, also influenced by the scattering, solely relying on them can lead to some ambiguities. Thus, the negative large volume reflectance must be corrected with respect to the scattering without absorption. For this, the positive small volume reflectance is suitable, which is mainly a function of the scattering only, at wavelengths without absorbing influences.
In the protein model, there is a lack of absorbing substances bounded at protein considering the wavelength range used. The scattering (fat globules and casein micelles) dominate the reflectance and the protein models, respectively. The spectral scattering behavior of fat and casein is different. Both decrease with increasing wavelength, but are different with respect to the slope. This is an important feature to consider when creating models for practical use. A further important feature is the use of small and large volumes, as shown in the Table IV. Therefore, it appears that accurate modeling is possible even in the absence of absorption effects.
Principally, these considerations with respect to fat and protein indicate that the MRS technology can be well suited for milk applications. The simple physical interpretation of the MLR models is a special feature. Each model shows that best results will be achieved by using reflectances at sample-specific wavelengths and the usage of a small and large volume.
The resulting prediction values of the analytical and experimental data from C1 to C4 using the MLR model presented in Table IV are visualized in Figure 6. The fat predictions are in good agreement with the reference values for all field studies. However, larger fluctuations for recombined milk (C3 and C4), particularly in protein monitoring, arise due to the reasons discussed in the previous subsection (spectra comparison).
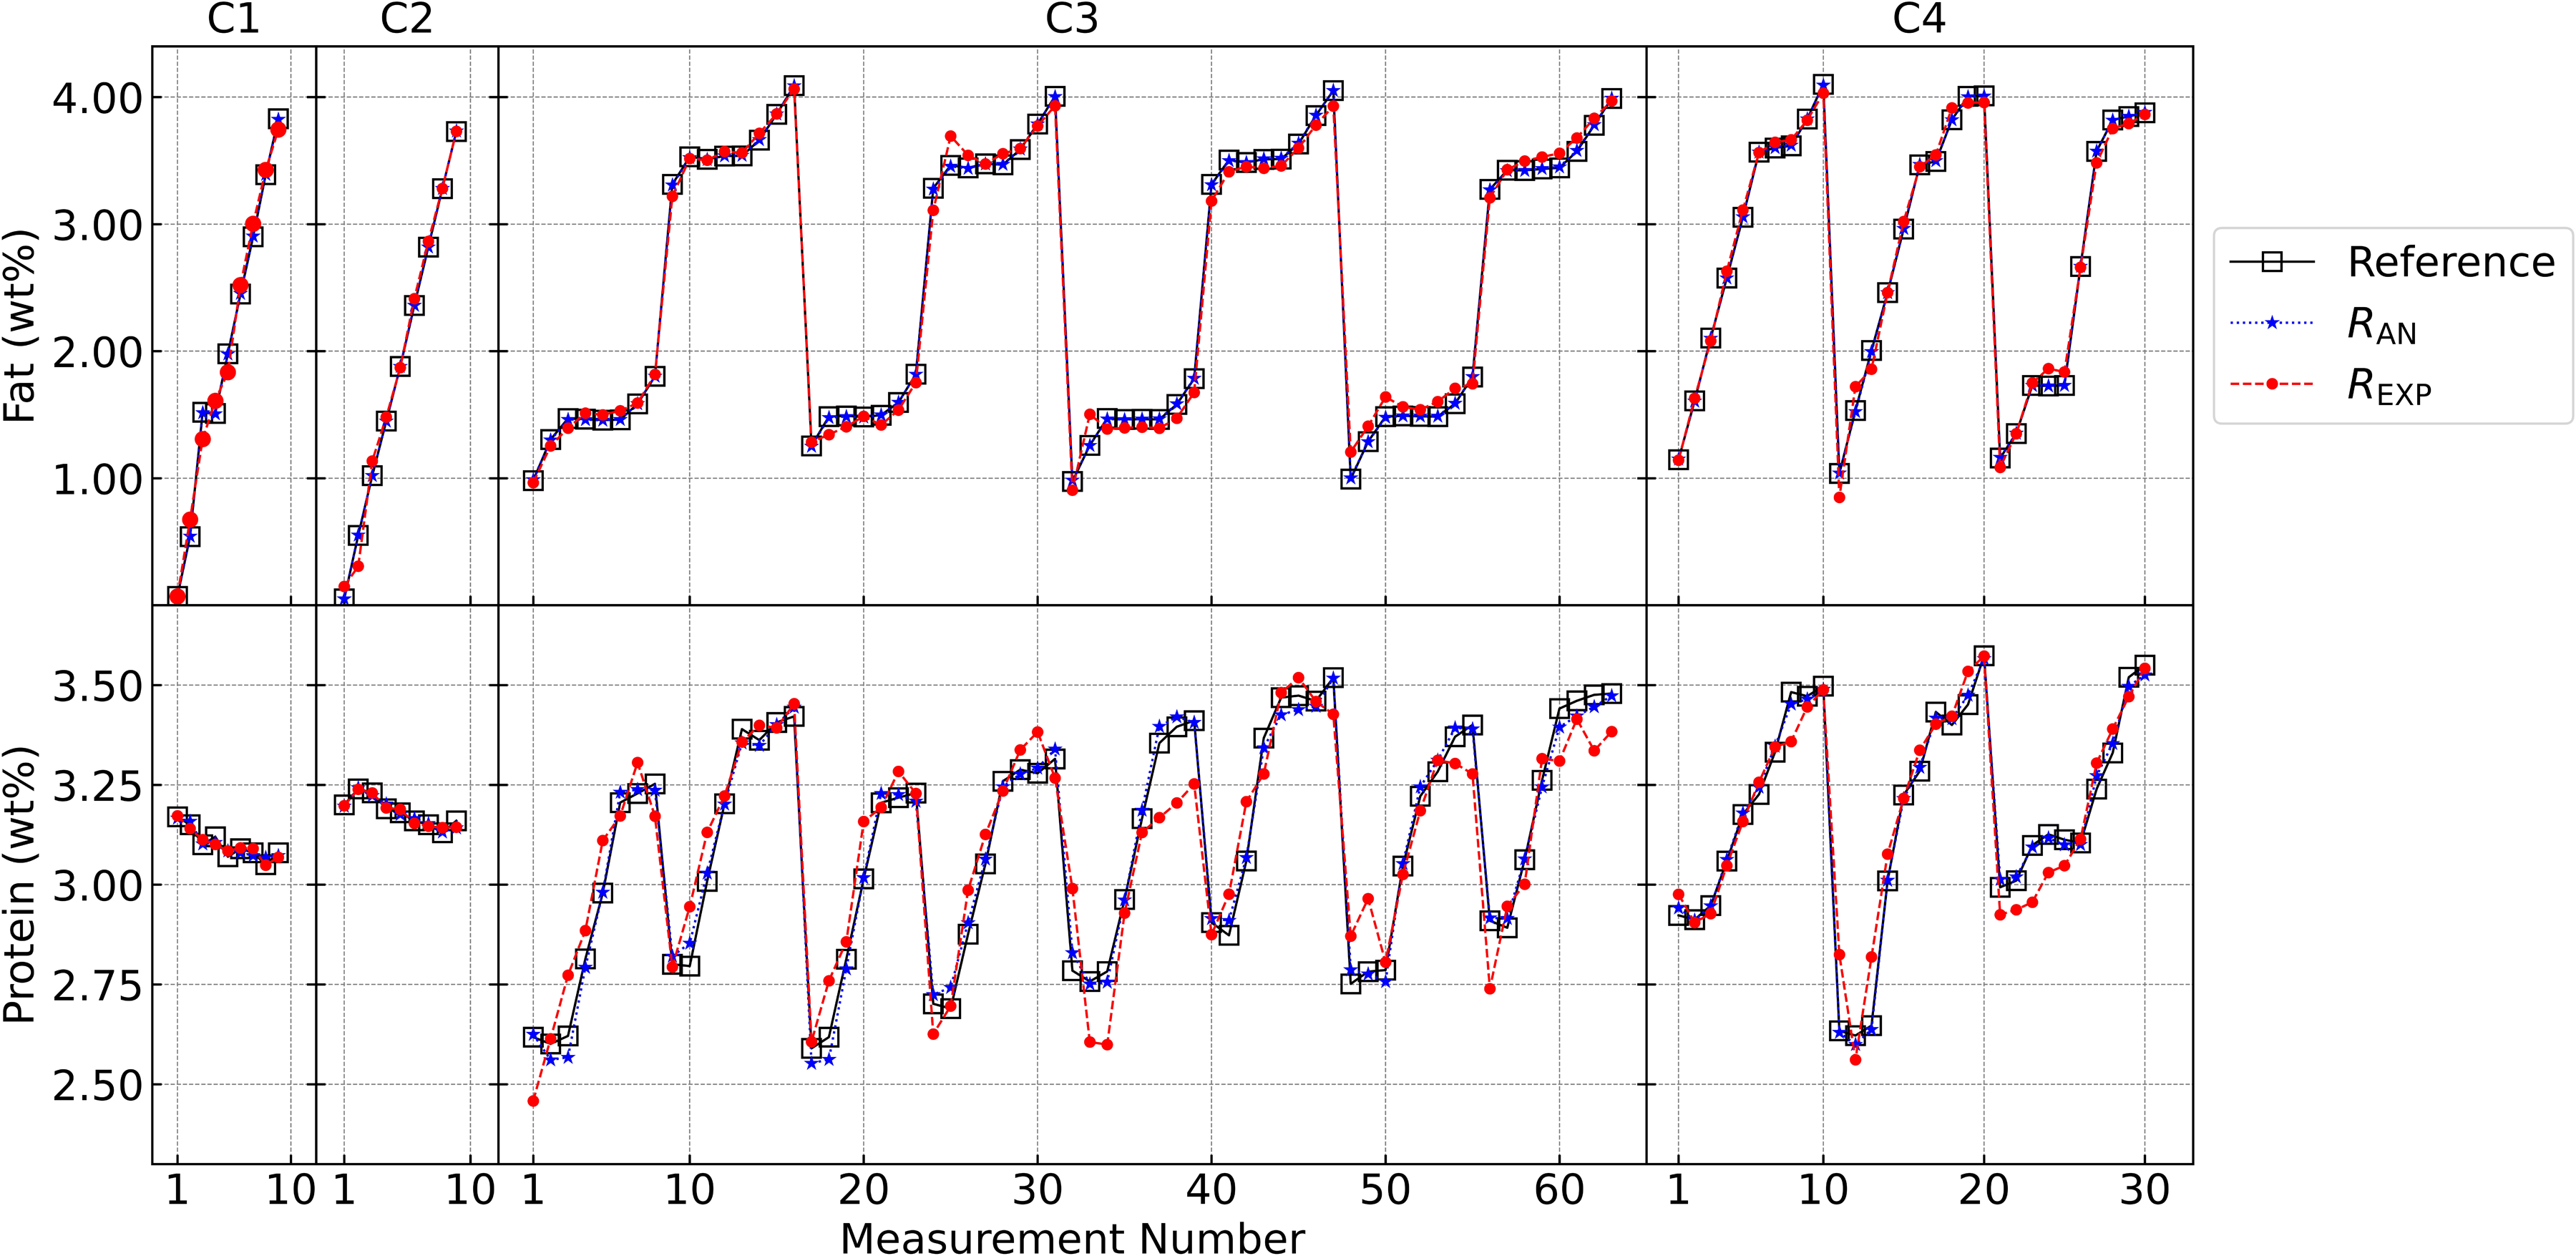
Experimental model (red circles), analytical model (blue stars) and reference values (black squares) of fat and protein content of the field studies C1 to C4.
All data analyzed so far have been processed for the purpose of analyzing analytical and experimental datasets, finding similarities, and demonstration of the model performance.
Validation
The model from C3 (see Table IV) is used and validated with the experimental data of C4. For this purpose, the MLR coefficients derived from the model using C3 data are stored in the instrument software. The model equation is then applied to the measured spectra during C4, and the monitored values are displayed on the monitor user interface. A summary of the results is presented in Figure 7. Based on the model used, the validation leads to an RMSE of 0.09 wt% for fat and 0.36 wt% for protein. Based on the data in C3, which focus only on a low fat and high fat line, this is a satisfactory result, especially for the fat monitoring (Figure 7a). For protein, in addition to the larger fluctuation of the values, there is a mean displacement (Figure 7b, squares) from the line of equality (LoE). This may be due to the time gap of several weeks between these two studies and the use of a different batch of raw material. In order to address the observed mean displacement of the validation data relative to the LoE, a subset of 20 % (six measurement points, see Figure 7b, yellow squares) was used to derive a linear correction model. This correction accounts for systematic bias by adjusting the predicted values based on a linear regression fit to the selected validation subset. The correction is applied using the following equation:
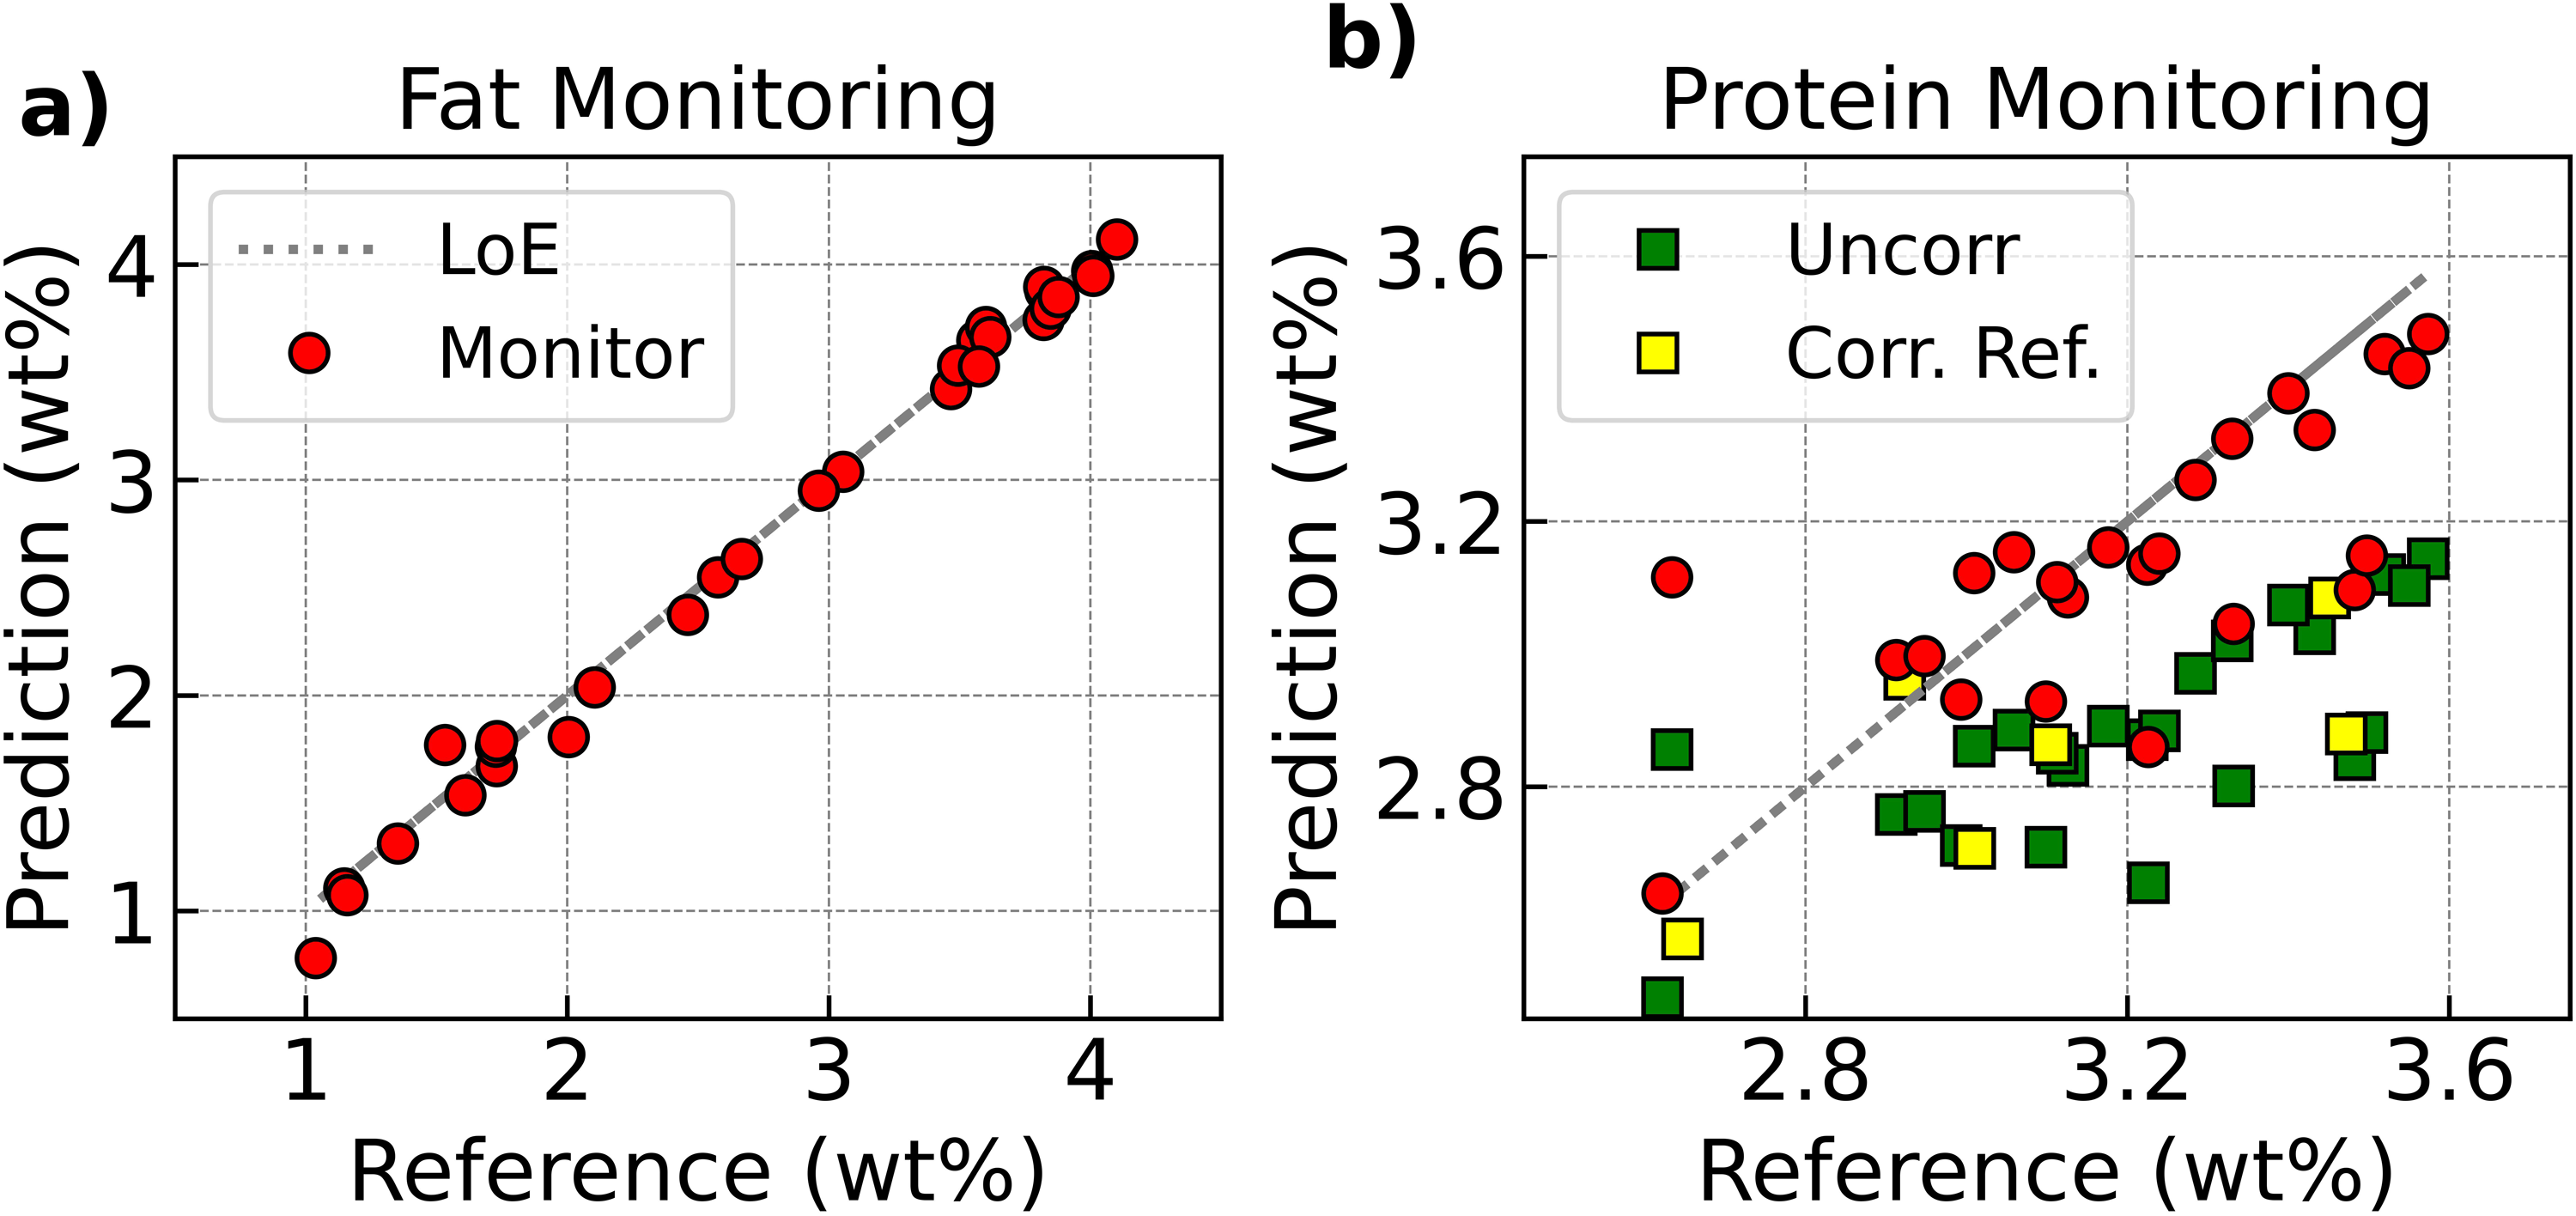
(a) Monitoring results for fat using the model derived from C3; (b) monitoring of the protein content using the model derived from C3 without correction (green squares), 20% from C4 data used for linear offset correction (yellow squares) and corrected monitoring value (red circles).
Influence of Homogenization Pressure and Liquid Temperature on the Monitoring Task
An essential aspect of milk production is the homogenization process, to ensure a well homogenized product. In a milk mixing plant, usually a two-stage homogenizer is utilized. Homogenization aims to evenly disperse fat droplets within the milk product, enhancing its overall stability. The size distribution of these fat droplets depends on the pressure applied during homogenization. To investigate how the homogenization pressure and therefore the droplet size (number-) distribution affect the recorded reflectances and the final monitoring, various pressures are applied. The sample of interest here is conventional milk. Furthermore, we investigate the influence of fluid temperature on the reflectances, as well as on the final monitoring value. A PT-100 sensor positioned in-line measures the fluid temperature near the illuminated area. To investigate how temperature affects the signal detected, we recorded reflectances during a wide temperature range during fluid heating.
The effect of temperature and homogenization pressure on the reflectance spectra of the small volume R
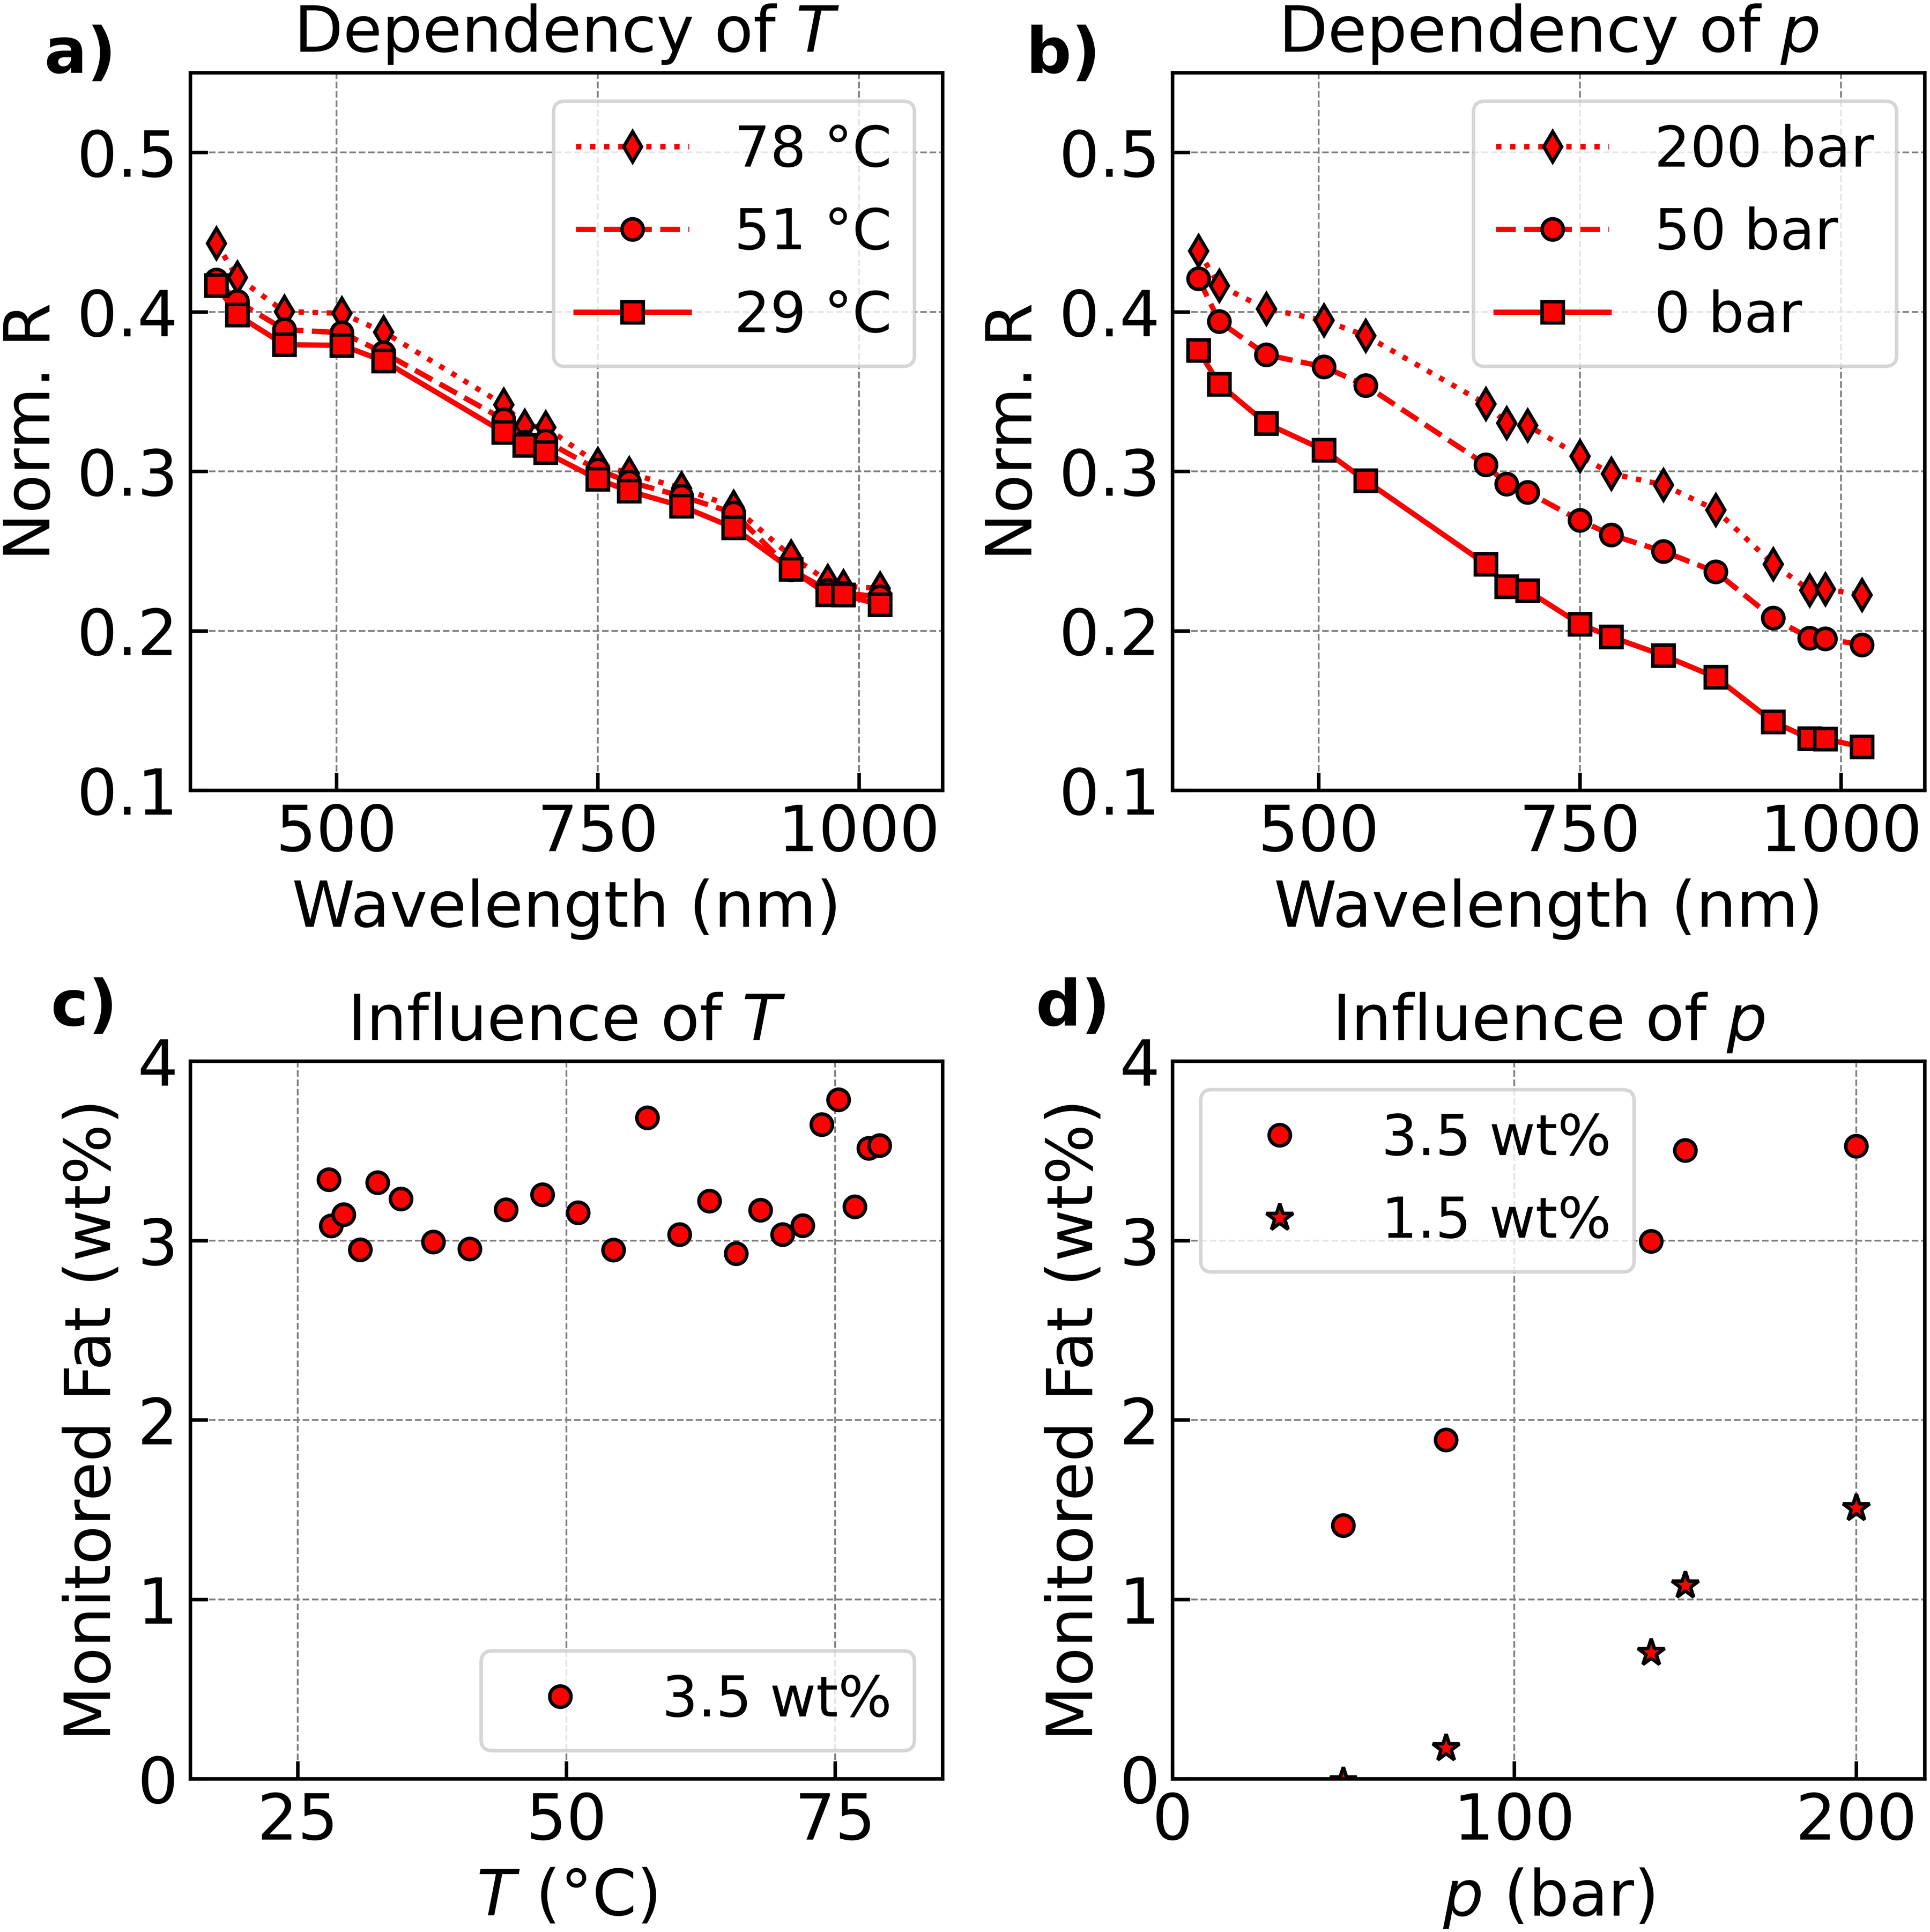
Spectral reflectances (exemplary shown for a small volume reflectance R
Conclusion
The introduced novel optical measurement system for monitoring fat and protein content in milk represents a significant advancement in process control and quality assurance, as well as automated processes. By providing real-time, measurements with minimal sample handling, this system addresses many of the limitations associated with traditional methods. Using the multi-reflectance spectra together with a simple interpretative calibration procedure enables precise monitoring of fat and protein content in milk product formulations, within one measurement. The ability of the system to deliver continuous, non-invasive measurements in real-time, not only improves process efficiency, but also enhances product quality and safety. As industries increasingly adopt automated and intelligent monitoring solutions, this optical measurement system stands out as a reliable and innovative tool that can contribute to more sustainable and efficient operations.
Future advancements will focus on enhancing the capabilities of the system, broadening its applications, and integrating it with larger process control systems to fully unlock its potential for industrial monitoring. To fully leverage the potential, modern statistical methods may be applicable, enabling multi-target estimation of critical process quality parameters and their underlying microscopic properties, e.g., particle or droplet size distributions. Many process sectors still lack an effective in-line solution for in-situ parameter estimation and deconvolution of multiple properties with a single measurement technology. In addition to the milk samples presented, this technique is promising in the usage of a broad application of fields including pharma, food, and drug processing, to name a few. Lastly, it is widely acknowledged that data-driven approaches, especially machine and deep learning techniques, excel with large datasets. Physics-informed machine learning addresses this issue by making advanced techniques accessible even with limited experimental data, providing greater transparency and rationale for inference and monitoring tasks.
Supplemental Material
sj-pdf-1-asp-10.1177_00037028251338316 - Supplemental material for Multi-Reflectance-Spectroscopy, Part II: Optical Sensor for In-Line Monitoring of Fat and Protein in Milk-Based Products
Supplemental material, sj-pdf-1-asp-10.1177_00037028251338316 for Multi-Reflectance-Spectroscopy, Part II: Optical Sensor for In-Line Monitoring of Fat and Protein in Milk-Based Products by Sebastian Boldt, Gert Sinn, Klaus-Henrik Mittenzwey, Ouwen Zhai, Henry Mittenzwey, Dietmar Lerche, Marco Gleiß, and Hermann Nirschl in Applied Spectroscopy
Footnotes
Declaration of Conflicting Interests
The author(s) declared no potential conflicts of interest with respect to the research, authorship, and/or publication of this article.
Funding
The author(s) disclosed receipt of the following financial support for the research, authorship, and/or publication of this article: This work was financially supported by the Senate Department for Economic Affairs, Energy and Public Enterprises within the program ‘Transfer BONUS’ under the code TB3061/2022 and the Federal Ministry for Education & Research, grant number 01
Supplemental Material
All supplemental material mentioned in the text is available in the online version of the journal.
References
Supplementary Material
Please find the following supplemental material available below.
For Open Access articles published under a Creative Commons License, all supplemental material carries the same license as the article it is associated with.
For non-Open Access articles published, all supplemental material carries a non-exclusive license, and permission requests for re-use of supplemental material or any part of supplemental material shall be sent directly to the copyright owner as specified in the copyright notice associated with the article.