
Abstract
The waxy gene of maize is a high value breeding target, but it is time consuming to separate waxy and wild-type kernels. A common method involves staining the endosperm with iodine. Near-infrared reflectance (NIR) spectroscopy has been used in several species including maize with success. A custom-built single kernel NIR spectroscopy instrument was used to scan 2880 individual kernels from 60 samples with a diversity of pedigrees, with both waxy, wild type, and heterozygous kernels represented. Chemical analysis was performed to classify the kernels with the waxy or wild type phenotypes. Linear discriminant analysis (LDA) was conducted to develop a prediction equation for single kernel NIR spectroscopy. The discriminant results showed that there was an 88% accuracy in predicting waxy kernels as waxy, and a 96% accuracy in predicting wild type kernels as wild type. A receiver operating characteristic (ROC) curve was determined to allow threshold adjustment to meet desired true positive or false negative rates. Thus, the prediction equation can be used in breeding programs to select for waxy kernels in an efficient and effective manner using a single kernel NIR instrument. This approach will benefit breeders of waxy corn by providing a rapid, automated non-destructive method for identification of waxy kernels in segregating breeding populations.
This is a visual representation of the abstract.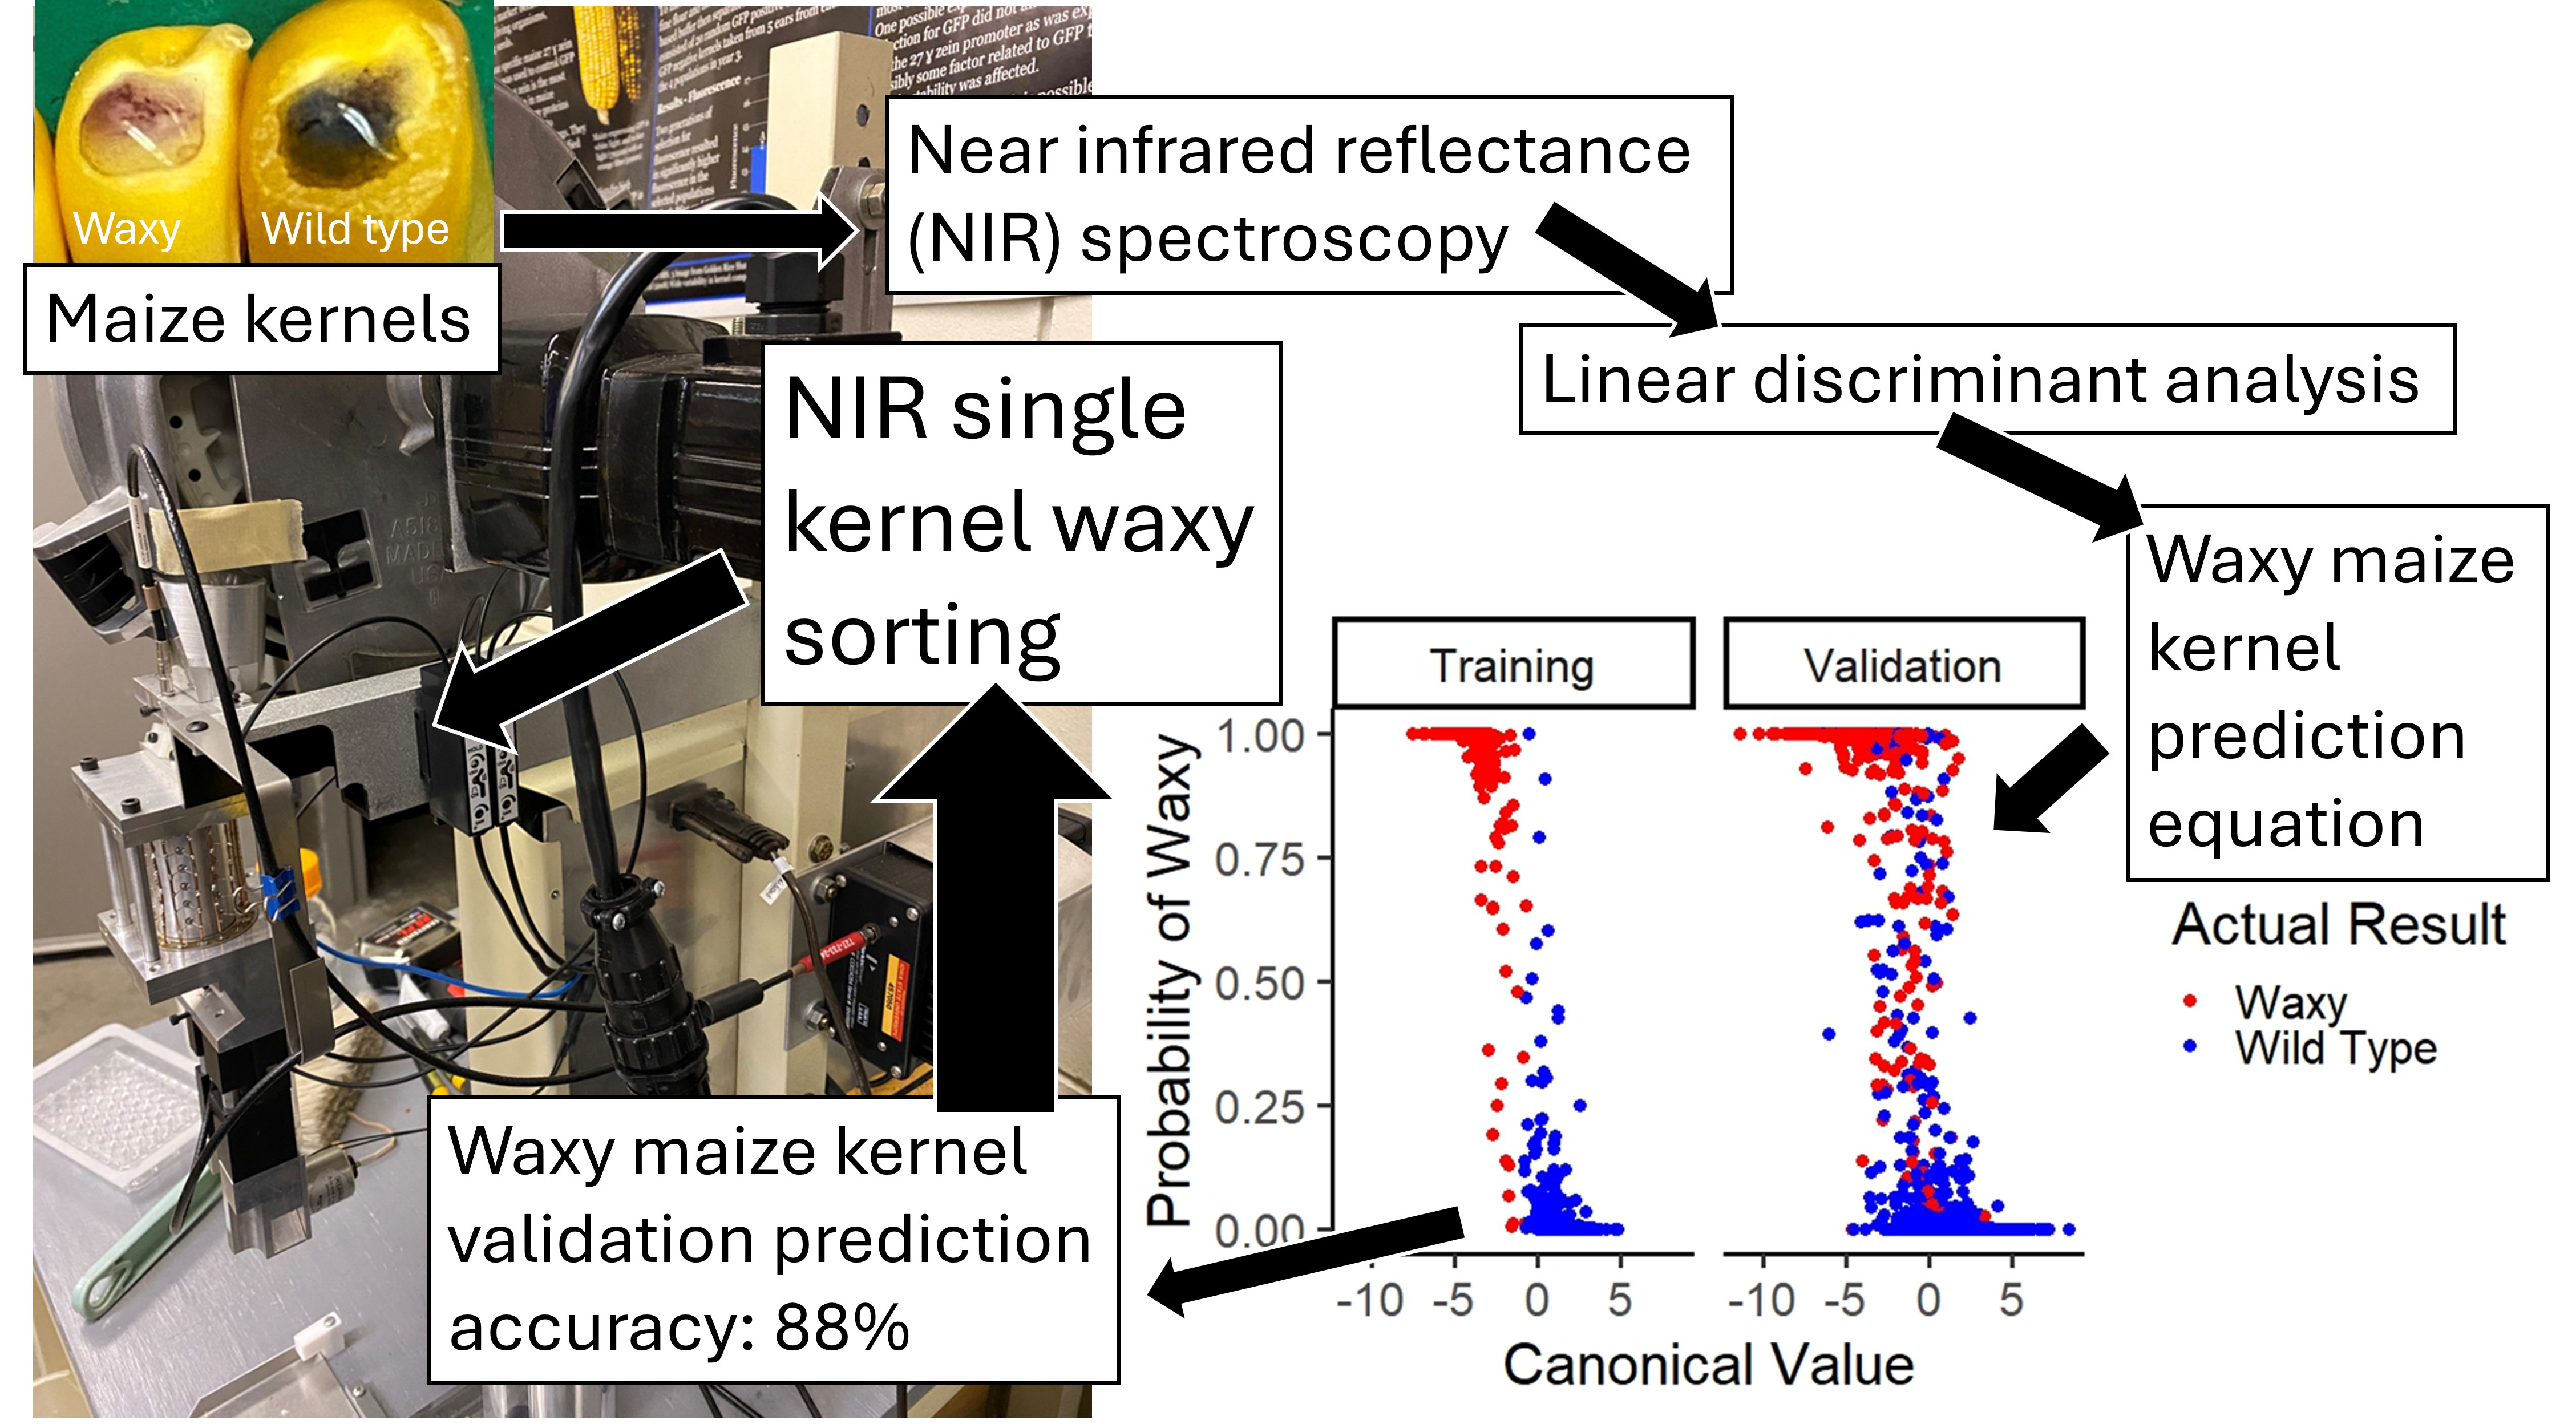
Introduction
Waxy maize (Zea mays L.) was first documented in the early 1900s in China. 1 Waxy kernels are characterized by starch that is composed of almost entirely amylopectin with very little amylose.2,3 This phenotype is caused by a variety of mutations in the Wx1 locus, which encodes a granule bound starch synthase on chromosome 9.4–7 The waxy phenotype is given by the wx1/wx1 genotype. Heterozygous (Wx1/wx1) or homozygous wild type (Wx1/Wx1) kernels have the wild type phenotype. 4 Amylose and amylopectin have different physical properties that create functional differences between waxy and wild type maize starch, such as differences in hydrogen bonding, different viscosities, and different gel firmness.3,8,9 Waxy maize starch is an industrial raw material that is used for the production of processed foods, paper and textiles, and animal feed, primarily for cattle and poultry. 10
Because of its high value to end users, maize breeders continue to develop new varieties of waxy maize with improved agronomic properties. A significant challenge in this endeavor is the identification of waxy kernels in ears that are segregating for the trait. This is typically done by iodine staining of extracted starch or in situ staining of individual kernels.11,12
Near-infrared reflectance (NIR) spectroscopy is widely used to make quantitative predictions of grain or seed composition. NIR spectroscopy is capable of analyzing grain or foodstuffs to predict protein, oil, moisture, and other parameters of interest. 13 Protein, lysine, and tryptophan in maize can be quantified with NIR spectroscopy calibrations; 14 automated assessment with NIR spectroscopy on combine harvesters can measure dry matter, crude protein, and starch content in maize; 15 NIR spectroscopy calibrations have been successfully developed to measure protein content in barley grain; 16 carotenoid content in ground maize grain can be determined with NIR spectroscopy. 17 Additionally, protein, starch, and oil content can be measured in single kernels of maize with NIR spectroscopy, 18 and NIR spectroscopy calibrations can predict amylose content in single maize kernels. 19 It is used less frequently to classify samples based on qualitative traits. Examples of classification of grain traits using NIR spectroscopy include distinguishing between oat and groat kernels. 20 Maize haploids can be distinguished with cross-specific NIR spectroscopy classification models. 21 Spectroscopic analysis is particularly valuable for breeding programs because it allows non-destructive determination of desirable compositional characters of seeds, allowing them to be both analyzed and planted to advance a generation in the breeding program.
Near-infrared reflectance spectroscopy has been used to classify waxy kernels in several cereal crop grains. NIR spectroscopy was used to create a prediction model to quantify the starch and amylose composition in waxy and nonwaxy whole grain sorghum. 22 Both single kernel and bulk NIR spectroscopy calibrations were developed for milled rice varieties (both waxy and non-waxy accessions) for classifying gelatinization temperature (GT) score between intermediate alkali spreading value (ASV) (2–5) and low ASV (6–7) scores.23 Both single kernel and bulk showed similar rates of correct classification. 23 A single kernel NIR spectrometer was used to create a calibration to distinguish between the wild type, waxy, Wx-1A null, and Wx-1B null genotypes in durum wheat. 24 This calibration was successful at distinguishing the waxy genotype from the other three genotypes while the other genotypes were mostly indistinguishable from each other. 24
There is value in the ability to classify bulk grain samples, for example as an identity preservation method for specialty grain supply chains. Waxy maize has also been included in studies of starch mutants with bulk grain NIR spectroscopy calibrations. A calibration in maize via NIR transmittance spectroscopy was done to predict grain amylose content; this calibration was capable of discriminating between high amylose and waxy maize grain samples. 25 A study with single gene and multi gene combinations of the starch mutants “amylose extender”, “dull”, “sugary-2”, “waxy1”, and “wild type” maize found that NIR spectroscopy could distinguish these mutants in bulk samples of grain except in cases where the mutants had similar levels of amylose. 26 A study on single kernel NIR spectroscopy in 2009 found that oil, protein, starch calibrations were effective on the single kernel level comparable to bulk calibration results; this study also found that qualitative mutants could be distinguished by spectral analysis, including “shrunken2”, “sugary1”, and “waxy1”, although prediction equations for these traits were not reported. 27
To our knowledge, no prediction equation has been reported for classifying individual kernels of waxy maize. Plant breeders frequently need to classify single kernels from segregating ears, making a single kernel classification method particularly useful. Iodine staining can be used for this process, but it is time consuming and may reduce the viability of the kernels that are tested. A single kernel NIR spectroscopy classification method would eliminate the need for iodine staining, increasing the efficiency of breeding waxy maize varieties. The objective of this work is to develop a single kernel NIR spectroscopy method to classify maize kernels on the basis of their waxy phenotype.
Experimental
Materials and Methods
A total of 60 different maize samples were selected for this study. These samples included individual ears and bulks of ears, which included kernels that were homozygous waxy (wx1/wx1), heterozygous waxy (Wx1/wx1), and homozygous wild type (Wx1/Wx1). Each sample has a pedigree showing what maize lines were crossed to develop the sample; the pedigree shows genetic relationships, as samples with pedigrees containing the same maize line (i.e., Oh43 or B73) are likely to have genetic and compositional similarities. Including different pedigrees in the dataset increases the likelihood of accurate predictions across diverse sample sets. In addition, predictions made on samples with pedigrees that are not included in the calibration are less likely to be accurate than predictions made on samples with pedigrees included in the calibration. Thus, the pedigrees of the samples used in calibration development establishes the scope of utility of the calibration. Information about these samples is presented in Table S1 (Supplemental Material). Kernels were dried to approximately 12% moisture and allowed to equilibrate to room temperature prior to scanning. Furthermore, kernels were produced in different environments in order to ensure the general applicability of the method. Some maize samples were sampled with repetition, to ensure enough waxy and wild type materials for model development. Each round of sampling involved random selection of 48 kernels from a sample to form a plate.
NIR Spectroscopy
A custom-built single kernel near-infrared reflectance spectroscopy instrument was used in this study. 21 This instrument produces an NIR spectrum with 782 data points ranging in wavelength from 904 to 1685 nm for an individual kernel dropped through the scanning chamber, with the spectra being an average of several kernel orientations as the kernel tumbles through the chamber. The randomly selected 48 kernels from each grain sample were scanned one time and placed in a 48-well microtiter plate for chemical analysis. Occasional scanning errors were corrected as they occurred; some kernels failed to trigger a scan, and others would be scanned twice. Kernels with scanning errors were rescanned. Midway through data collection, we updated the instrument software, and kept track of which spectra were collected before and after the update by creating two data sets. We could not identify differences that could be attributed to the update between the two data sets.
Chemical Analysis
Each kernel was then screened for the waxy phenotype using an iodine staining procedure (reviewed by Brust et al.). The top of each kernel was sanded down to expose the endosperm. Then about 0.5 μl of diluted Lugol’s solution (one part Lugol to nine parts double distilled H2O) was dropped onto the exposed endosperm to produce distinct coloration on the exposed endosperm. A blue-black coloration indicates a wild-type phenotype (Wx1/Wx1 or Wx1/wx1), while a red-brown coloration indicates a waxy phenotype (wx1/wx1).
Statistical Analysis
While chemometric methods are frequently used to predict quantitative trait values, the Wx phenotype is a qualitative trait, so development of a prediction equation requires a statistical approach for classification. Spectral and phenotype data were used in the statistical analysis. Spectra were first trimmed to avoid highly variable ends (from 904–1685 to 925–1630). Spectra were then normalized using multiplicative scatter correction in R using the PLS package which contains several tools related to partial least squares regression. The reference spectrum was the mean of all spectra used in the study. The spectral differences between the mean spectra of the two phenotypic groups are shown in Figure 1. Data were analyzed in JMP Pro v.17 (JMP Statistical Discovery LLC, USA) using principal component analysis (PCA) on correlations to visualize composition and structure of the spectral data. The top four principal components were graphed, and the waxy and wild type components on each of these PCs were compared. To develop a prediction equation independent of the PCA, a separate linear discriminant analysis (LDA) was performed using the same statistical software to examine genotype effects and to develop an equation for classification of the waxy phenotype from spectral data. The LDA analysis first produced canonical values, which are linear combinations of wavelength values to separate data on a single axis, usually centered around 0. These can be calculated with an equation in the form of:
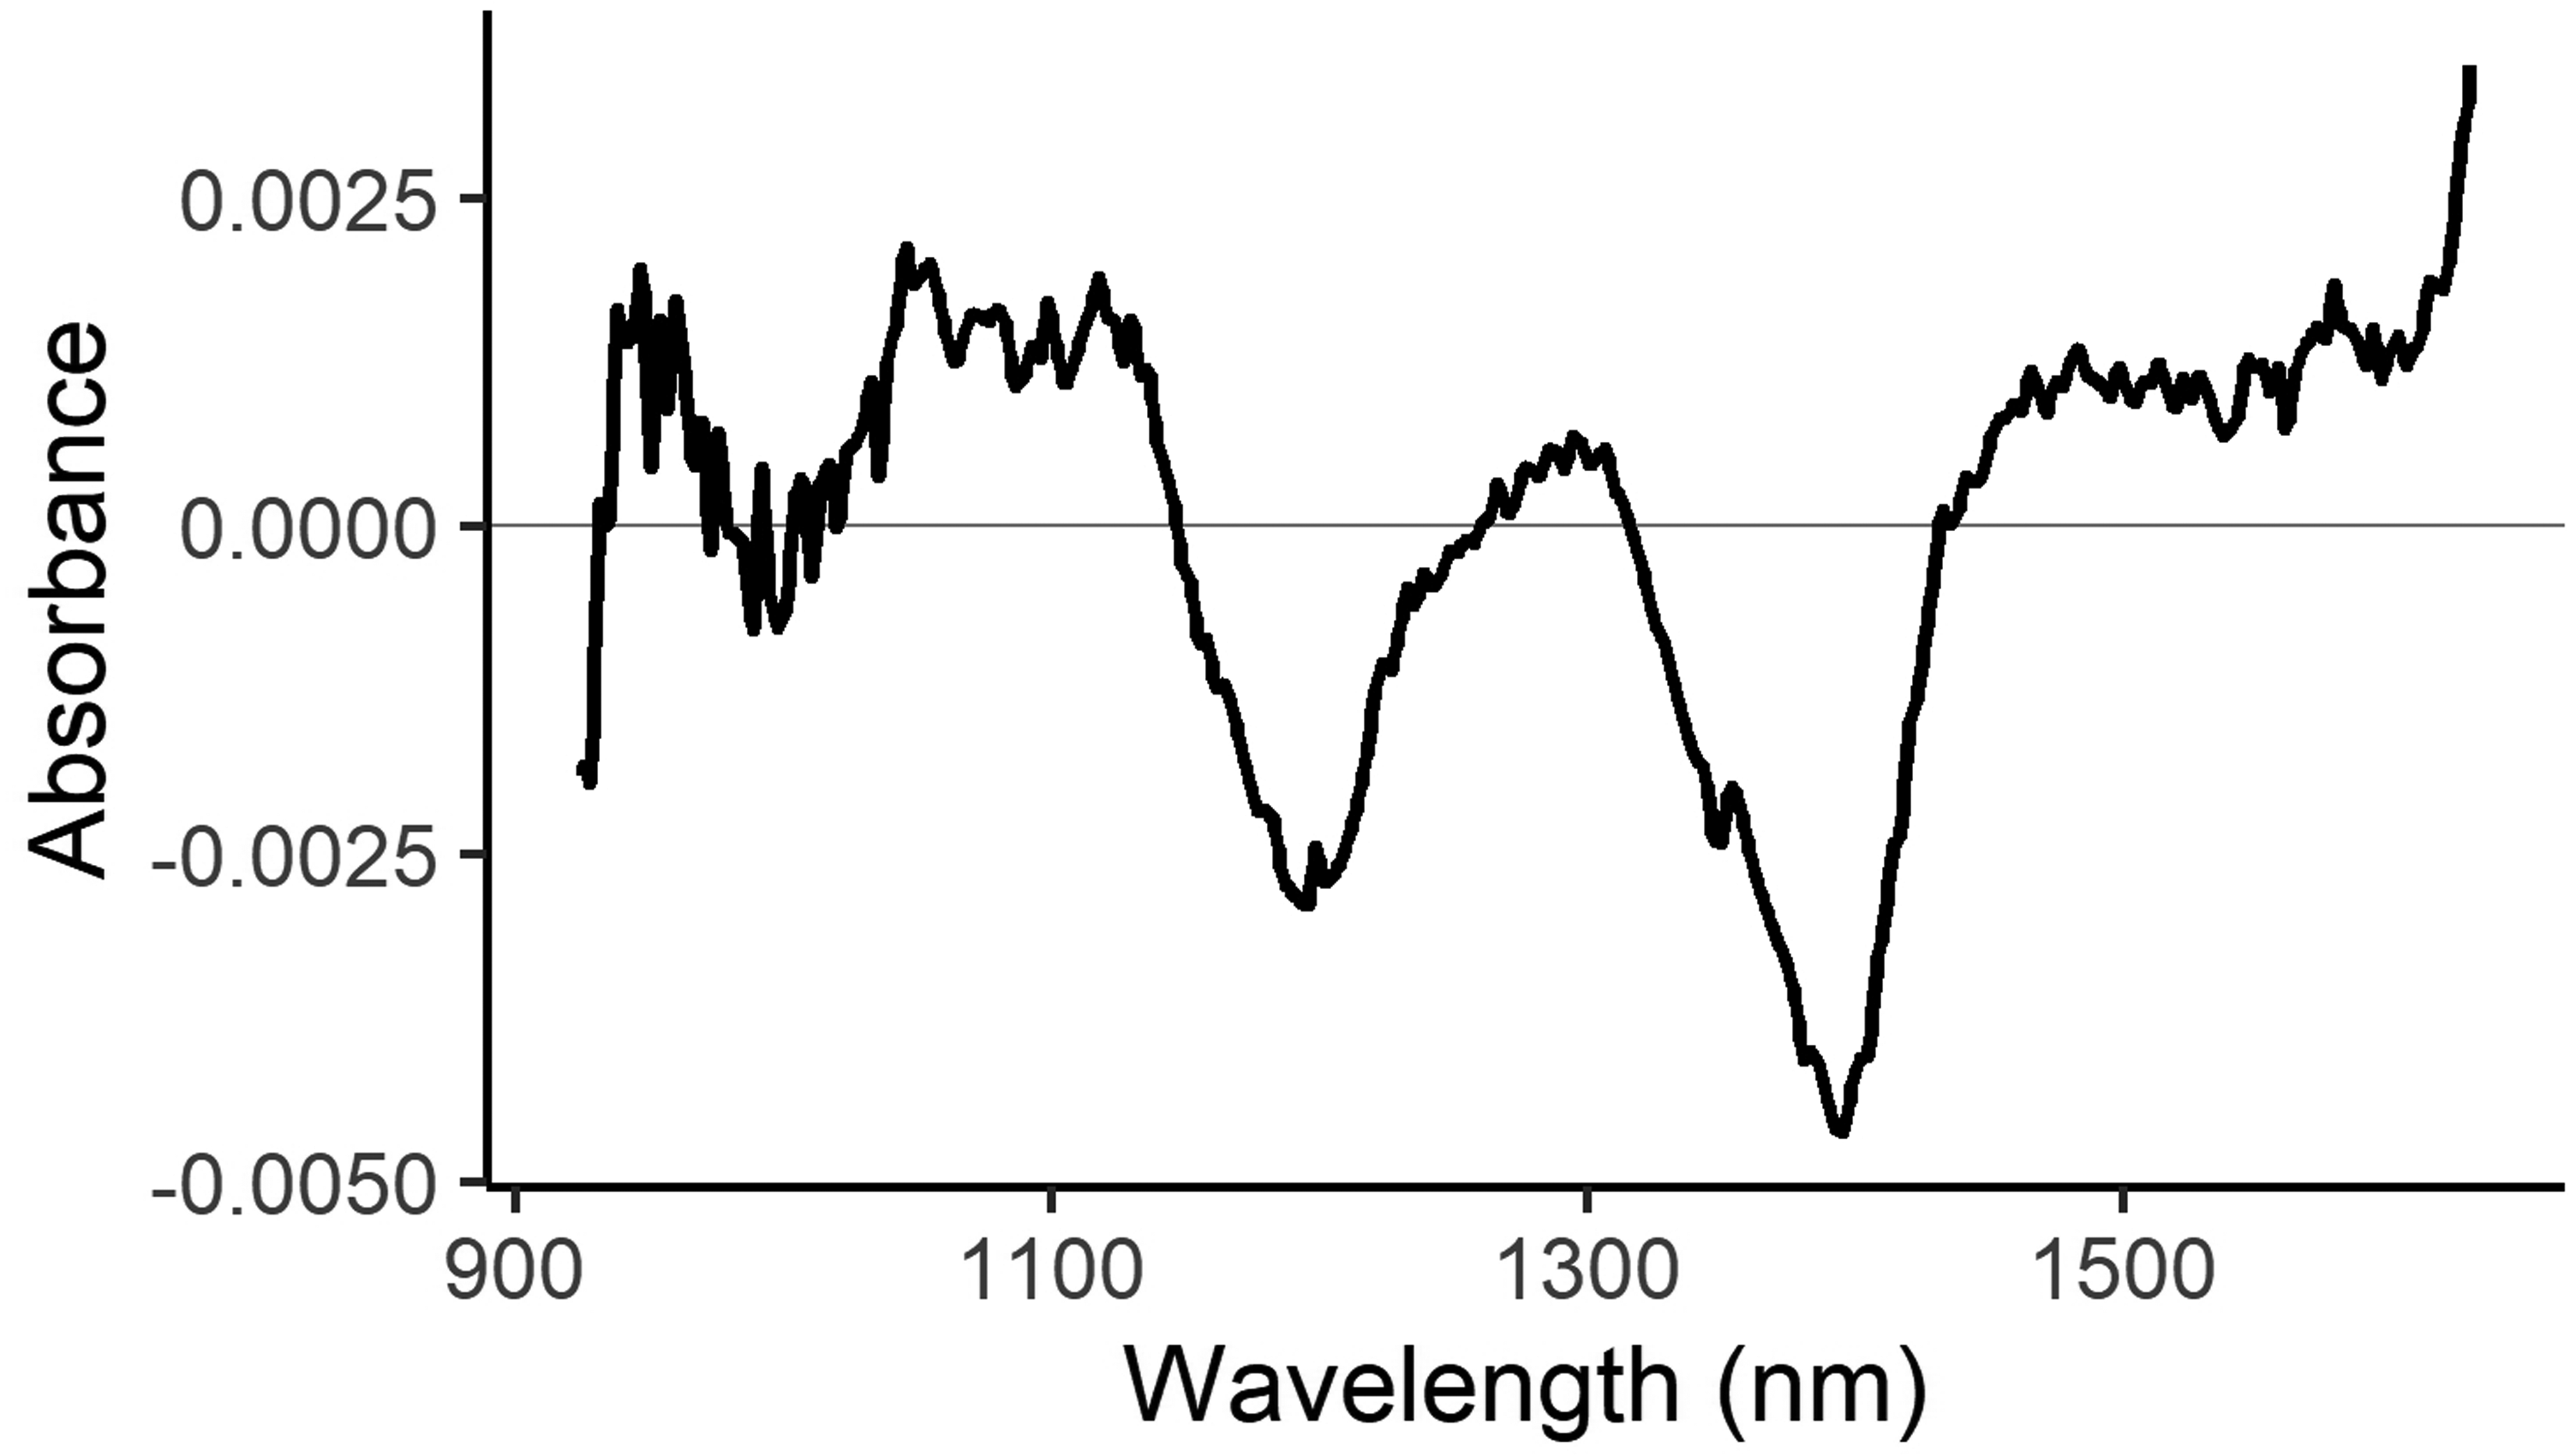
Mean difference between waxy and wild type spectra. The black line shows the mean waxy spectrum minus the mean wild-type spectrum.
The canonical values generated by discriminant analysis were useful in establishing the ability to differentiate between waxy and wild-type kernels. Breeders selecting among a mixture of waxy and wild-type kernels would benefit greatly from knowing the probability that a given kernel is waxy. This probability can be predicted from the loadings extracted from the canonical structure. Two sets of loading values serve as weighting factors for each wavelength. One set is used to determine the probability that a given kernel has the waxy phenotype, and the other set is used to determine the probability that the kernel has the wild-type phenotype. The weighted sum of the absorbance values of each wavelength produces distance values that are related to the probability that a given kernel is waxy or wild type. Another equation can be developed to create a model to predict the probability of a given kernel to be waxy based on wavelength information. This equation uses a different set of coefficients based on these linear discriminant square distance values to calculate a probability equation in the form of:
In order to validate the prediction equation in the discriminant analysis, a random selection of 1/3 of the data was used in model development and 2/3 of the data was used in validation, with equal percentages of waxy and wild type kernels and equal percentages of each plate in both groups. The prediction equations were extracted from the discriminant analysis. There was a total of 45 misclassified kernels from the samples collected before the software update, 3% of the kernels in dataset 1, and 91 misclassified kernels from those collected after the software update, 7% of the kernels in dataset 2 (Table S2, Supplemental Material). It is unlikely that the software update had a significant effect upon the model development.
Results and Discussion
Sample Information
The experiment consisted of 60 maize samples (Table S1, Supplemental Material). The chemical analysis of all plates resulted in 12 plates of only waxy kernels, 18 plates of only wild type kernels, and 30 plates with segregating kernels. There were a total of 865 waxy kernels and 2015 wild type kernels in the study; 289 waxy kernels and 671 kernels were included in the training set, with 576 waxy kernels and 1344 wild type kernels in the validation set. Sample types included inbred lines, randomly mated populations, and the segregating progeny of F2 crosses. Samples were from a variety of genetic backgrounds, and one included the starch mutant ae1. To determine the impact of grain color on classification, samples with red, white, or blue grain were tested.
Spectral Analysis
We first confirmed that kernels with a waxy phenotype produce different spectra than wild type kernels. Figure 1 shows the difference between the mean of all (865) waxy spectra minus the mean of all (2015) wild type spectra. Given the difference in the spectra, it should be possible to develop an equation to classify kernels based on their phenotype.
Principal Component Analysis
The PCA on correlations among spectral data points found the first four principal components explained 95.5%% of the total variance (Table I). PC1 accounts for 55.415% of the total variance, PC2 accounts for 21.432% of the variance, and the waxy component is located at coords (PC1 = 6.62, PC2 = 6.03) with the wild-type component being located at coords (PC1 = –2.84, PC2 = –2.59) (Figure 2a). PC3 accounts for 15.572% of the variance, PC4 accounts for 3.053% of the variance, and the waxy component is located at coords (PC3 = 4.11, PC4 = 0.40) with the wild-type component being located at coords (PC3 = –1.76, PC4 = –0.17) (Figure 2b). Other principal components show different groupings, some being highly separated from the overall groupings (Figure 2). Compositional qualities not examined in this study are likely to be highly variable among the kernels, accounting for the majority of the variance. The population structure that is likely due to compositional traits not examined in the study is a potential source of bias in the classification model.
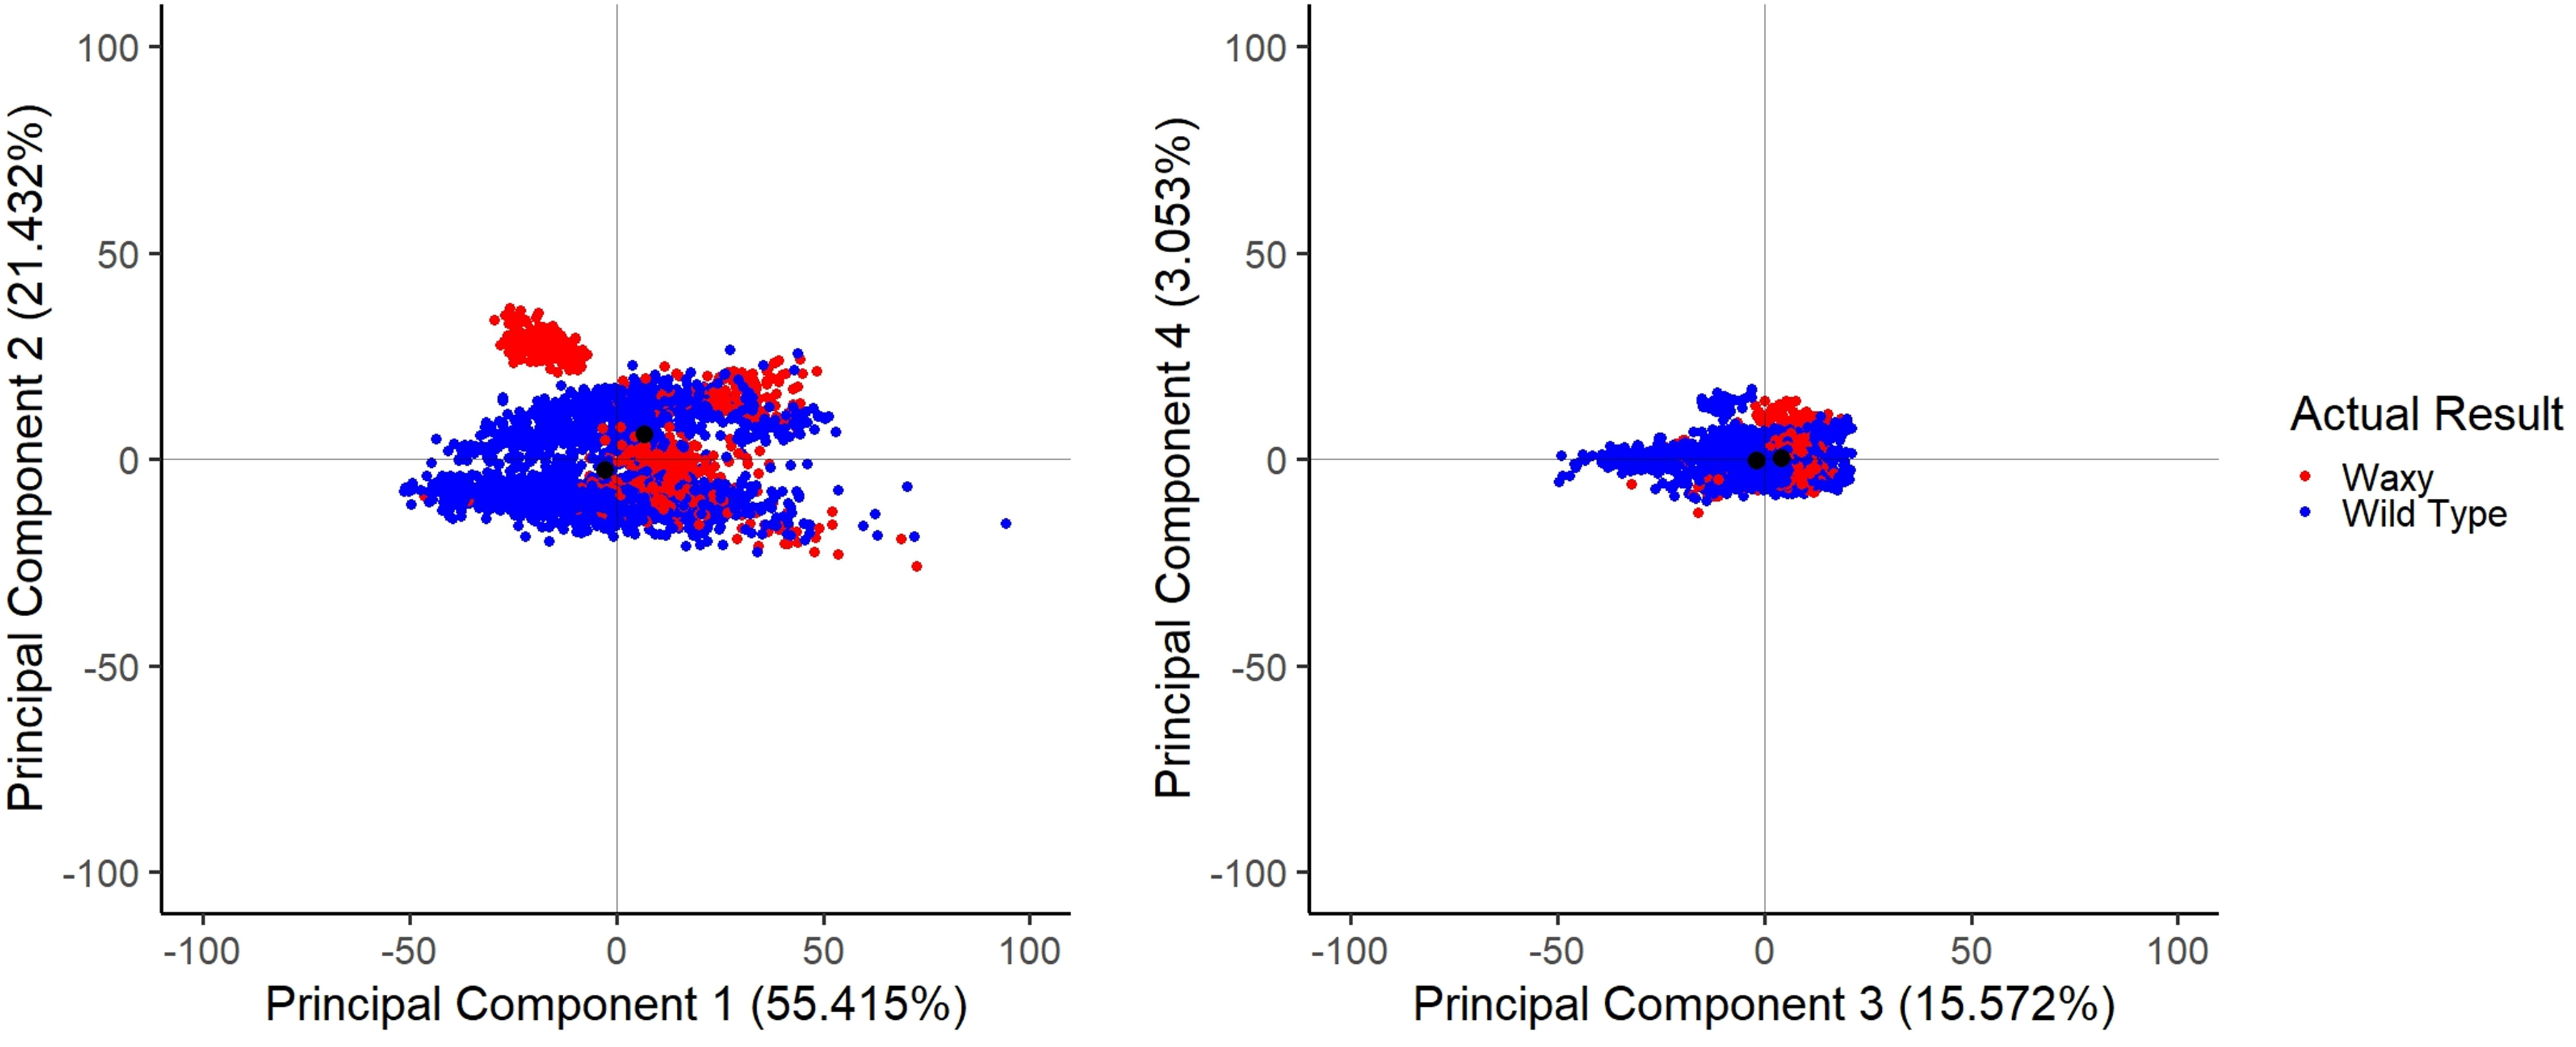
Principal component graphs. Comparisons between principal components 1–4 are shown, as well as the distribution of eigenvalues. Figure 2a shows components 1 and 2; the waxy component is located at coords (6.62, 6.03) and the wild-type component at coords (–2.84, –2.59). Figure 2b shows components 3 and 4; the waxy component is located at coords (4.11, 0.40) and the wild-type component is located at coords (–1.76, –0.17).
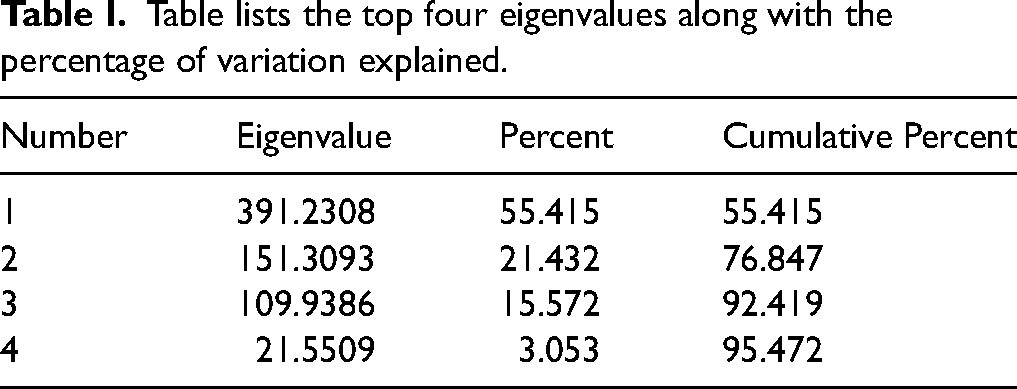
Table lists the top four eigenvalues along with the percentage of variation explained.
Validation
More wild type kernels than waxy were present in the study, but this variation was accounted for by including equal percentages of both waxy and wild type groups in the training and validation sets. Additionally, to account for a potential plate effect, equal percentages of each plate were included in both training and validation sets. Furthermore, the data was split into 1/3 for the training set and 2/3 for the validation set. Thus, there were 960 kernels in the training set, with 671 wild-type and 289 waxy kernels; there were 1920 kernels in the validation set, with 1344 wild-type and 576 waxy kernels.
Table II shows a confusion matrix resulting from LDA. Out of 289 waxy kernels in the training set, 276 were accurately predicted. There were 671 wild type kernels in the training set, 665 of which were accurately predicted. Out of 576 waxy kernels in the validation set, 511 were accurately predicted. There were 1344 wild type kernels in the validation set, 1292 of which were accurately predicted. In the validation set, there is an 88.7% accuracy rate for correctly identifying the waxy kernels, and a 96.1% accuracy rate for identifying wild type kernels. It follows that there is a 90.8% (true waxy out of the total predicted waxy) rate of a predicted waxy kernel being truly waxy, and a 95.2% (true wild type out of the total predicted wild type) rate of a predicted wild-type kernel being truly wild type. This results in a false positive rate of 3.9% and a false negative rate of 11.3%. Additionally, there is an 11% misclassification rate for segregating kernels in the validation set, and a 2% misclassification rate for non-segregating kernels in the validation set. Out of the misclassified kernels in the training and validation sets, 119 were from segregating plates and 17 were from non-segregating plates; 18 segregating plate kernels were misclassified in the training set, with one non-segregating plate kernel misclassified; 101 segregating plate kernels were misclassified in the validation set, with 16 non-segregating plate kernels misclassified in the validation set. Segregating material appears to be misclassified more frequently than non-segregating material (Table S3, Supplemental Material). This is likely because segregating kernels are produced on the same ear and are therefore more similar to each other in composition than non-segregating kernels that are produced on separate ears. In total, 78 waxy kernels were misclassified, with 13 in the training set and 65 in the validation set. A total of 58 wild type kernels were misclassified, with six in the training set and 52 in the validation set. Slightly more waxy kernels were misclassified than wild type kernels. Of the misclassified kernels, 125 were from pedigrees containing Oh43 lineage, and only 11 were not from Oh43 containing pedigrees. The entire dataset contains 1872 kernels with Oh43 within the pedigree, and 1008 kernels without Oh43 in the pedigree. This indicates that there is a 1.1% misclassification of non-Oh43 related material, and a 6.7% misclassification of Oh43 related material. Additional information about kernel misclassification are found in Tables S2 and S3 (Supplemental Material).
Table lists the set (training or validation), the true result (waxy or wild type), and the predicted results and rate from linear discriminant analysis.
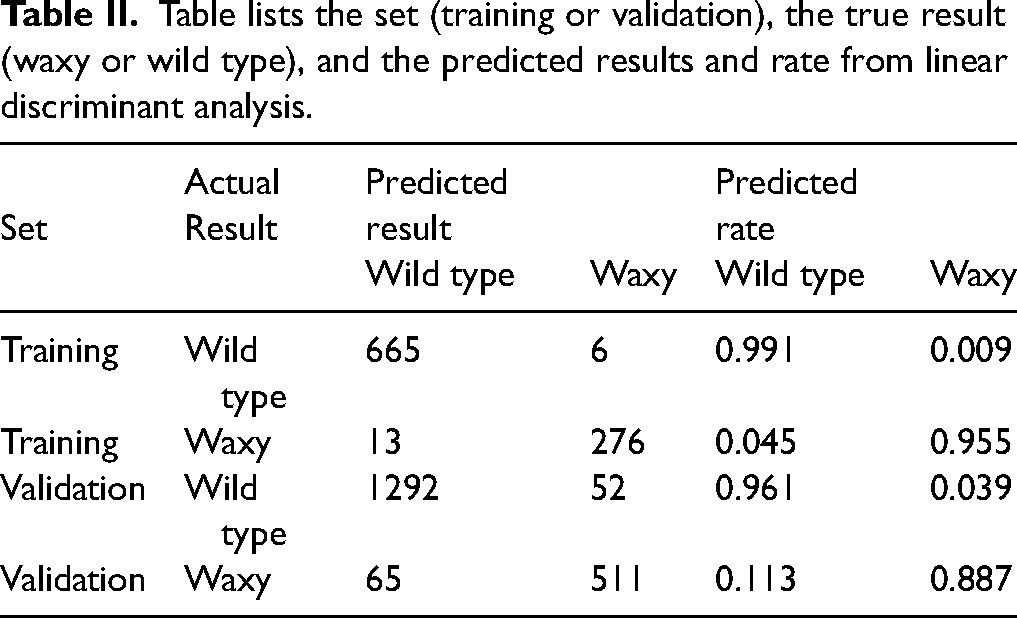
Figure 3 shows the relation between the canonical value and the probability of waxiness. A low canonical score indicates high probability for waxiness, while a high canonical score indicates low probability for waxiness. The training set has a clearer separation at 0 for canonical scores and true waxy or true wild type results, with the probability values having overlap around 0. The validation set has a less clear separation at 0 for canonical scores and true waxy or true wild type results, likely related to some kernels being less easily classified. This matches the overlap in probability shown for the validation set.

Canonical value versus waxy probability. Training and validation sets are shown, with true waxy kernels in red and true wild-type kernels in blue. Higher probability correlates to more positive canonical values, and lower probability with more negative canonical values.
Figure 4 shows the receiver operating characteristic curve of the validation data, based on the LDA predicted probabilities of being waxy. By shifting the threshold, the desired prediction needs can be met. If identifying the waxy kernels is the priority, the threshold can be changed to ensure that more waxy kernels are correctly identified, but this will increase the rate of false positives. However, if having the minimum number of false positives is the priority, the threshold can be adjusted to have minimal false positives, but a higher rate of false negatives.
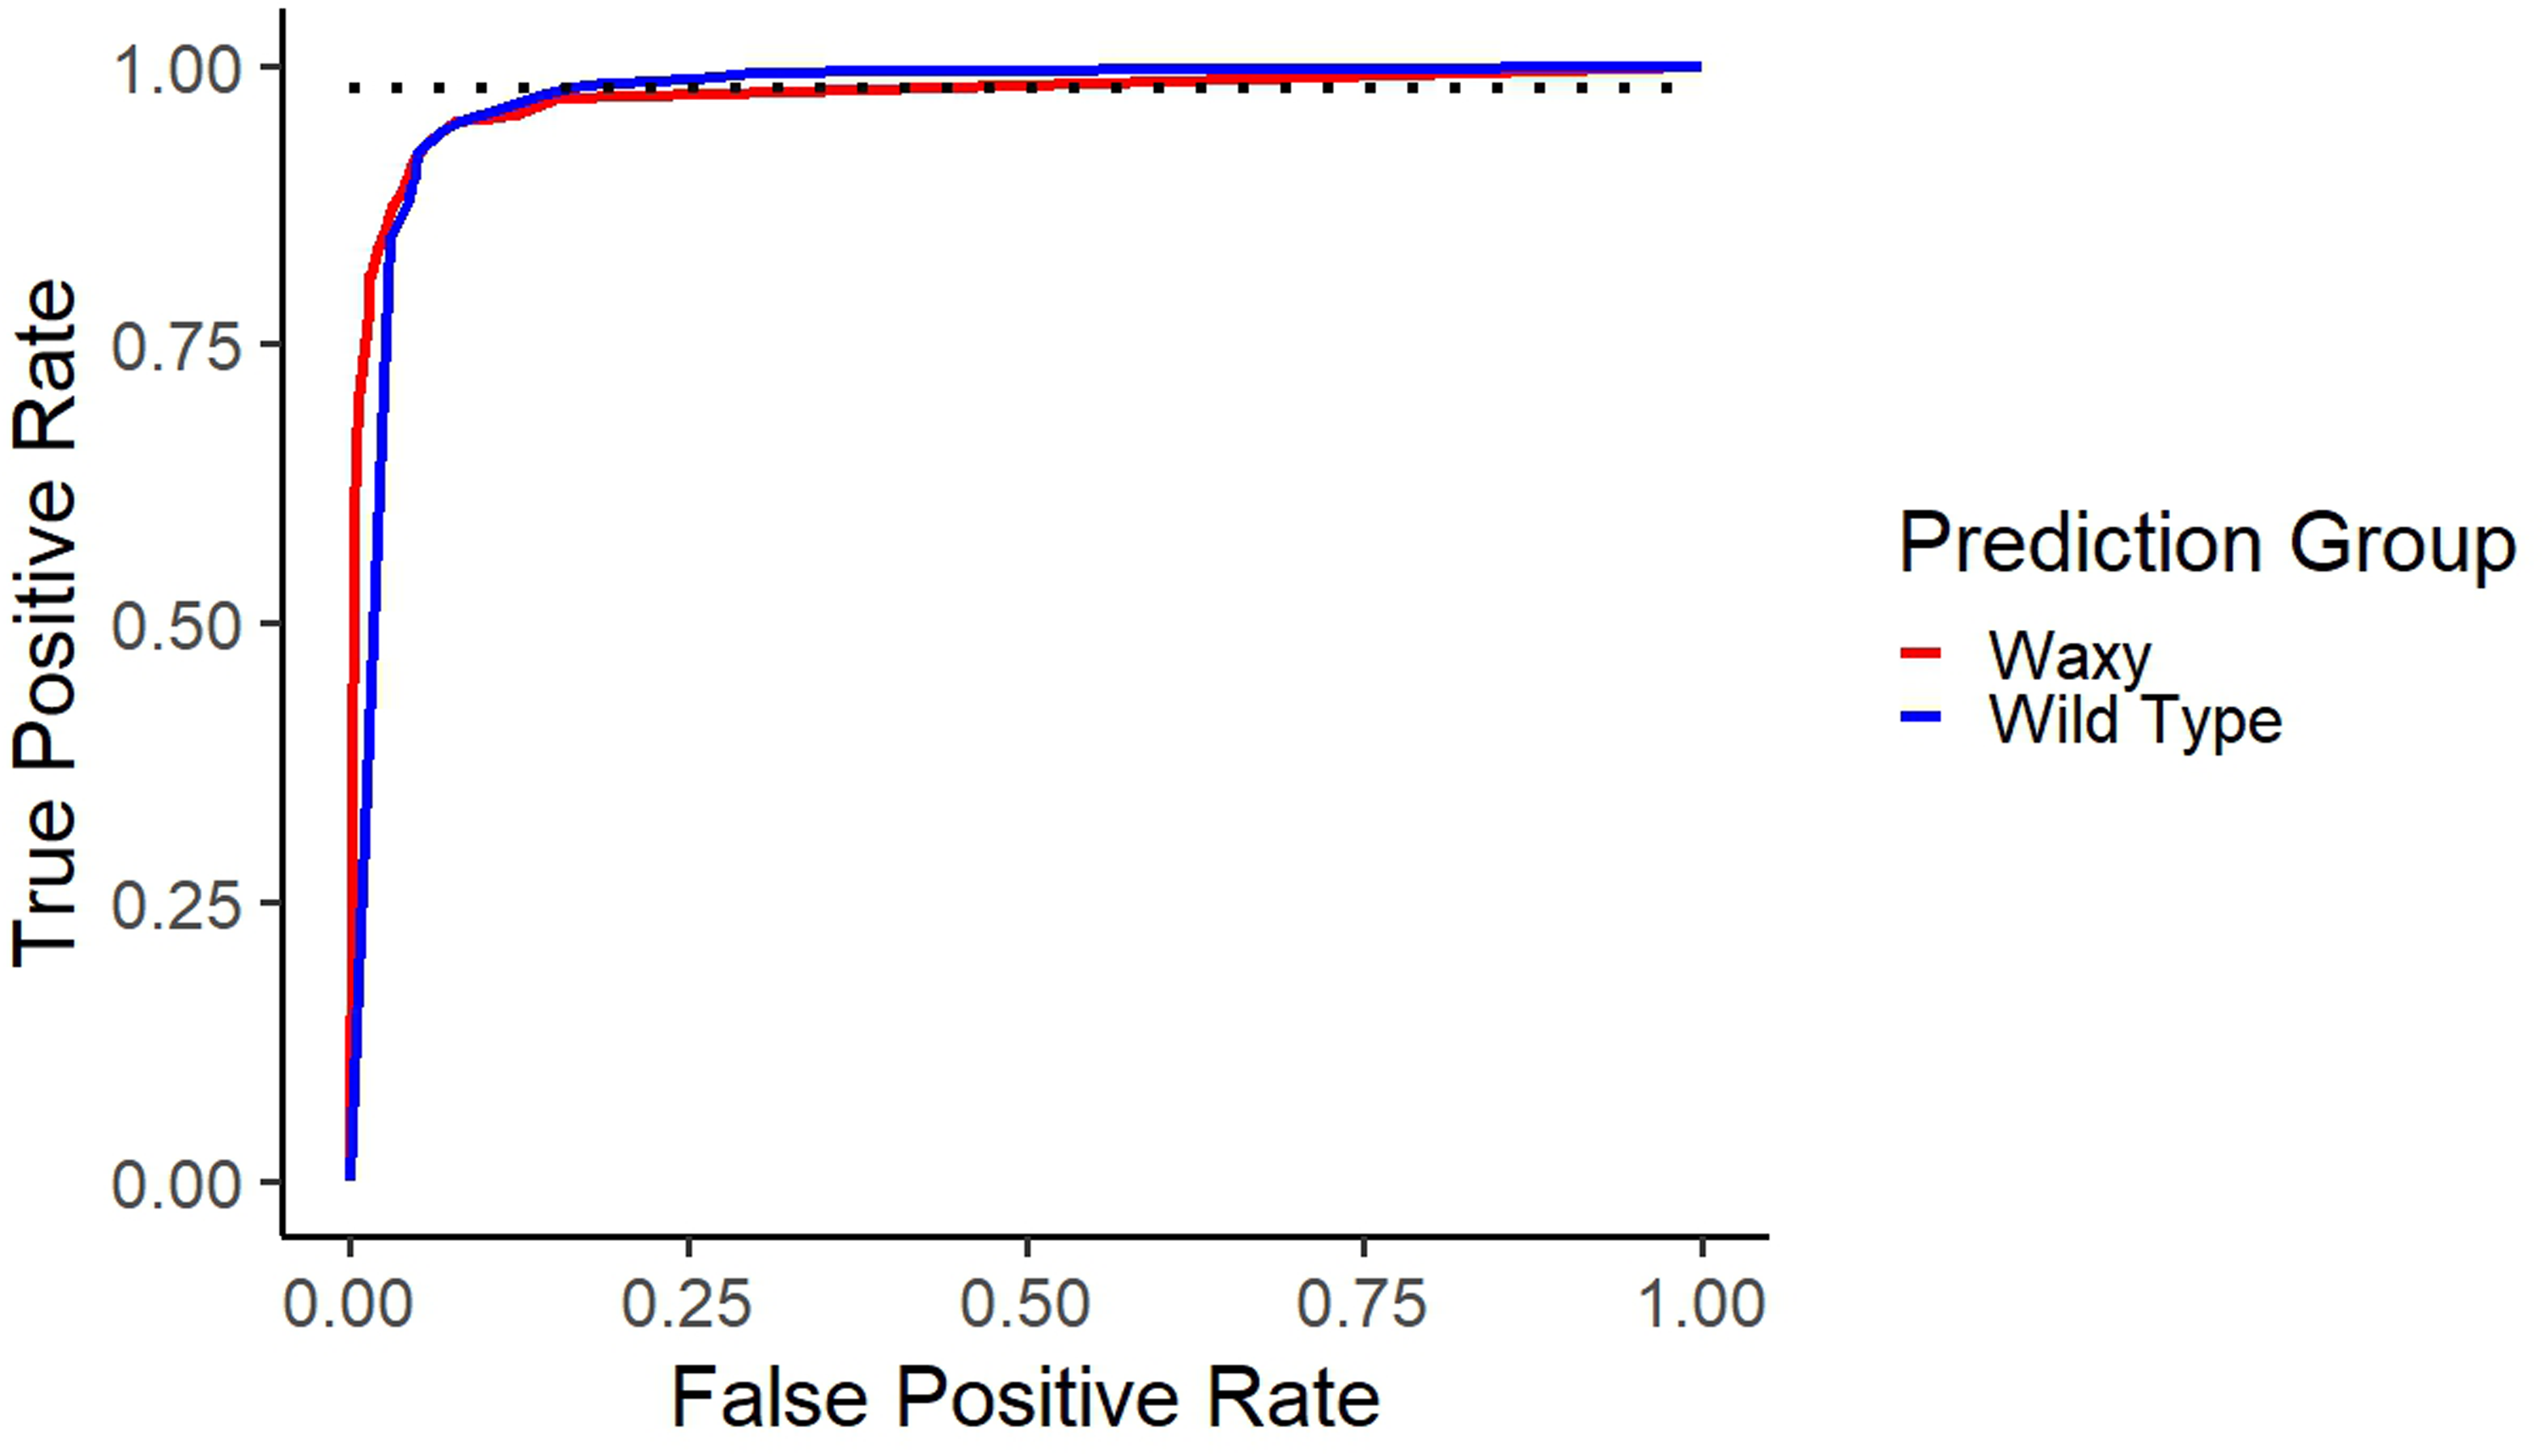
Receiver operating characteristic curve. Shows the true positive rate versus the false positive rate for both waxy and wild type within the validation data set. The dotted line shows the true positive rate at 98%.
Discussion
The ability to separate waxy kernels from wild type kernels is particularly valuable to plant breeders, who frequently need to identify the waxy kernels on an ear that is segregating for the waxy phenotype. Using NIR spectroscopy would be a non-labor intensive and efficient means of predicting the waxy trait in scanned kernels. From our initial analyses of our NIR spectroscopy data, the spectral differences between waxy and wild type phenotypes illustrated in Figure 1 allowed us to develop a classification equation for differentiation of waxy and wild type maize kernels (Table II).
Kernel composition is known to vary extensively among different genotypes. This variation is evident in the PCA illustrated in Figure 2. Principal component 1 had the greatest difference between the waxy and wild type components (waxy located at PC1 coordinate 6.62, and wild type located at PC1 coordinate –2.84), and this component accounted for 55.415% of the total variation. However, we conclude that a large portion of the variation in the spectral data is unrelated to the waxy trait. This makes sense in light of compositional similarity between amylose and amylopectin. Both are glucose polymers that only differ in the frequency of α 1–4 branched linkages. The misclassification rates we have received in our prediction model are partially due to the observed population structure in the PCA. The fact that we were able to generate an effective calibration illustrates the power of this method to extract meaningful variation from a data set containing a large amount of data that is unrelated to trait of interest.
The ROC graph in Figure 4 shows how different model thresholds can be useful for breeders. By adjusting the threshold, a breeder can optimize the level of true positives to false positives. In this model’s validation set, a threshold requiring 90% probability of being waxy gives an 81% true positive rate and a 1% false positive rate, while a threshold of 1.4% probability of being waxy gives a 97% true positive rate and a 15% false positive rate. Thus, if selection for waxy kernels is required to be stringent with minimal false positives, choosing a higher threshold can be used to attain this, allowing flexibility in a breeder’s selection process. The prediction equation has a high accuracy at predicting true wild type to be wild type (96.1% of true wild type are predicted wild type). This indicates that the rate of false positives is likely to be low, since only around 3.9% of the true wild type kernels were predicted to be waxy. In contrast, true waxy kernels are predicted as waxy only 88.7% of the time, with 11.3% of true waxy kernels predicted to be wild type. This means that there is a higher rate of false negatives. This is where changing a threshold can be important to breeders; a higher threshold can lower the rate of false positives but increase the rate of false negatives. If a breeder wishes to identify as many of the waxy kernels as possible, lowering the threshold would lower the rate of false negatives (waxy predicted as wild type) but increase the rate of false positives (wild type predicted as waxy).
Conclusion
We used single kernel NIR spectroscopy with linear discriminant analysis to develop a prediction model capable of classifying maize kernels based on their waxy phenotype with 88% accuracy or higher. This method will benefit plant breeders who are developing new waxy maize varieties by reducing the time and cost required to identify waxy kernels in segregating ears.
This project focused on using a single kernel NIR instrument, which was custom built. The power of this instrument in being able to sort single kernels on traits such as waxy implies that this could be a robust tool for plant breeders to select on several kernel traits at the individual kernel level. More development in single kernel NIR technology would give plant breeders an advantage in allowing the selection of single kernels, data collection on a specific kernel instead of bulk averages, and exclusion of undesired kernels.
Kernel numbers needed to develop a new prediction equation will likely vary based on the specific needs of the experiment; the scope of the prediction equation will likely require different types of kernel genetic backgrounds, depending on whether the equation is specific to segregating material or not, and whether the equation will be limited to within a specific breeding program or intended for widespread utilization.
Supplemental Material
sj-docx-1-asp-10.1177_00037028251349556 - Supplemental material for Classification of Waxy Maize Kernels Using Single Kernel Near-Infrared Reflectance Spectroscopy
Supplemental material, sj-docx-1-asp-10.1177_00037028251349556 for Classification of Waxy Maize Kernels Using Single Kernel Near-Infrared Reflectance Spectroscopy by Shelly Kinney, Tae-Chun Park, Hannah Clubb, Paul Armstrong, Thomas Lübberstedt and M. Paul Scott in Applied Spectroscopy
Footnotes
Acknowledgments
The findings and conclusions in this publication are those of the authors and should not be construed to represent any official USDA or U.S. Government determination or policy. Mention of trade names or commercial products in this article is solely for the purpose of providing specific information and does not imply recommendation or endorsement by the U.S. Department of Agriculture. USDA is an equal opportunity provider and employer. Special thanks to Iowa State University statisticians Dr. Phil Dixon and Keara Schmitt for statistical advice.
CRediT Author Statement
Shelly Kinney: Formal analysis, investigation, writing-original draft. Tae-Chun Park: Investigation, writing-review and editing. Hannah Clubb: Investigation, writing-review and editing. Paul Armstrong: Methodology, software, writing-review and editing. Thomas Lübberstedt: Conceptualization, writing-review and editing, funding acquisition. M. Paul Scott: Conceptualization, writing-review and editing, funding acquisition, project administration.
Funding
The author(s) disclosed receipt of the following financial support for the research, authorship, and/or publication of this article: This research was supported in part by the U.S. Department of Agriculture, Agricultural Research Service (project number 5030-21000-073-000-D) and by grants from the U.S. Department of Agriculture, National Institute of Food and Agriculture, OREI program (award numbers 2020-51300-32180 and 2021-51300-34896).
Declaration of Conflicting Interest
The authors declared no potential conflicts of interest with respect to the research, authorship, and/or publication of this article.
Ethical Considerations
This article does not contain any studies with human or animal participants.
Supplemental Material
All supplemental material mentioned in the text is available in the online version of the journal.
References
Supplementary Material
Please find the following supplemental material available below.
For Open Access articles published under a Creative Commons License, all supplemental material carries the same license as the article it is associated with.
For non-Open Access articles published, all supplemental material carries a non-exclusive license, and permission requests for re-use of supplemental material or any part of supplemental material shall be sent directly to the copyright owner as specified in the copyright notice associated with the article.