
Abstract
In this paper, a lanthanide complex-based fluorescent sensor Tb(4-MBA) was developed for the selective recognition of diabetic ketoacidosis (DKA) and the diabetes biomarker β-hydroxybutyric (β-Hb). β-Hb significantly enhanced the fluorescence emission of the Tb(4-MBA) complex at 539 nm. Based on the analysis of the surface electrostatic potential distribution and time-resolved spectra, we speculate that in the reaction system of β-Hb with Tb(4-MBA), β-Hb and Tb(4-MBA) may form a complex through hydrogen bonding interactions, which brings β-Hb closer to Tb3+ and thus reduces the non-radiative energy loss of the solvent molecules to Tb3+ and significantly enhances the Tb(4-MBA) fluorescence intensity. The linear range of Tb(4-MBA) for β-Hb was 2–55 μM, and the limit of detection (LOD) was 50.6 nM. This sensor has high sensitivity and selectivity and shows great potential in the field of screening and diagnosis of diabetes mellitus and DKA.
This is a visual representation of the abstract.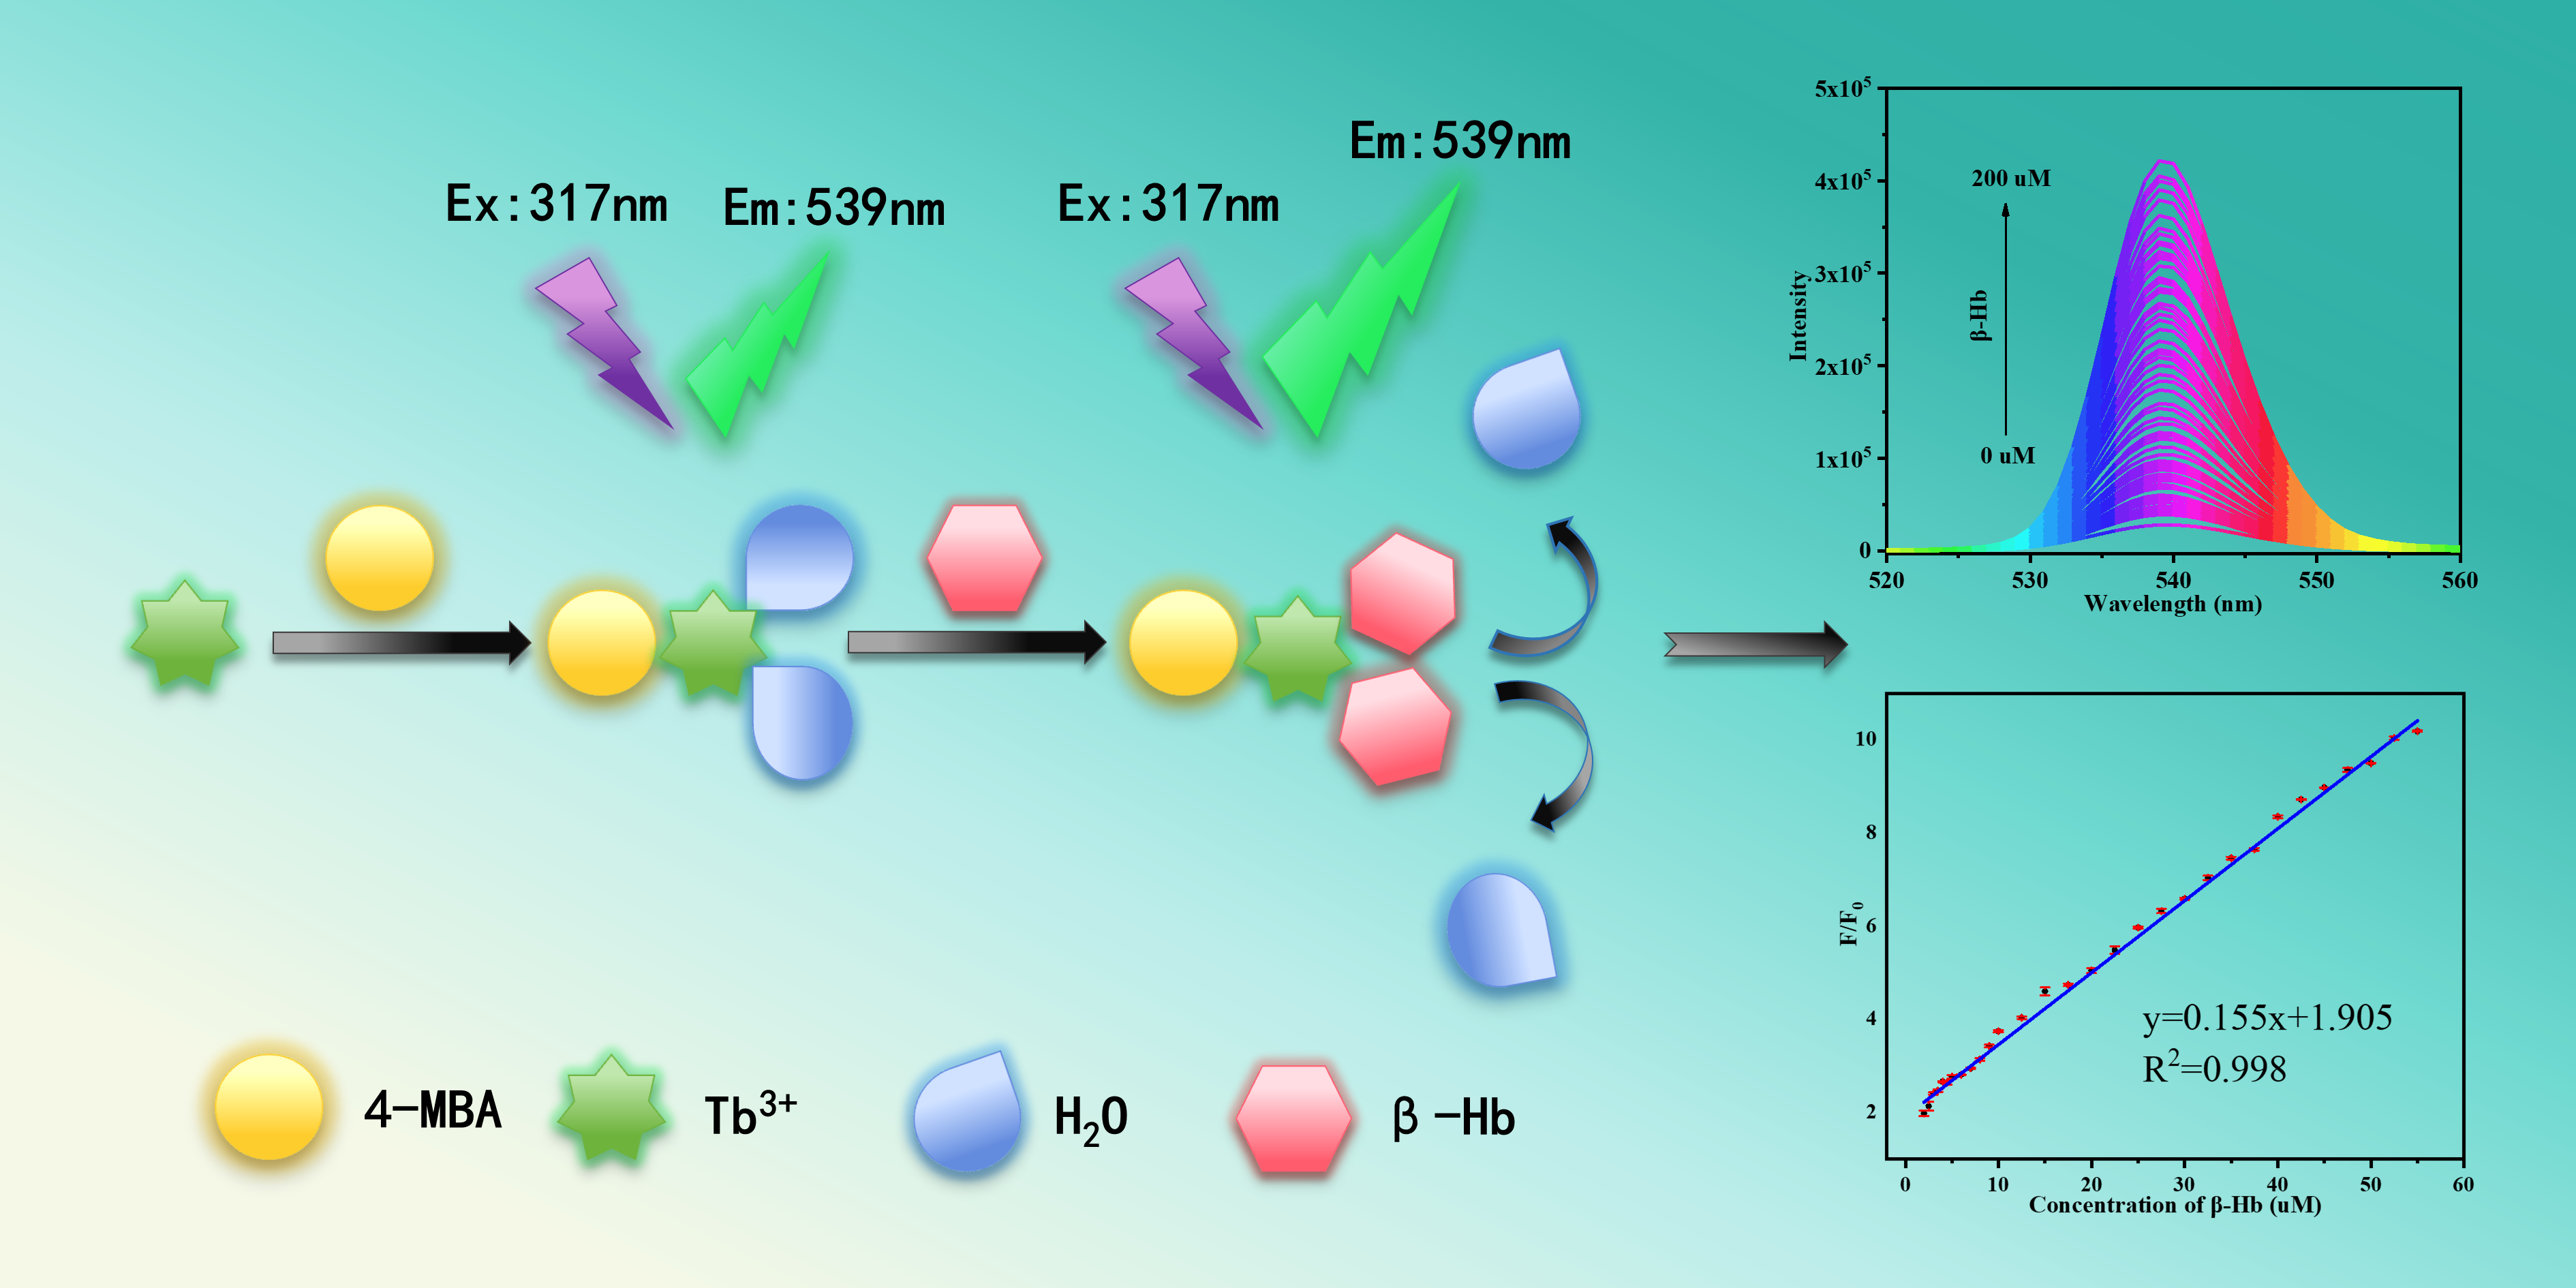
Introduction
Diabetes is a globally prevalent chronic disease that poses a major threat to human health. 1 Diabetic ketoacidosis (DKA) is an acute complication of diabetes. 2 DKA occurs when insulin levels are insufficient or blood glucose levels are too high, resulting in the body's inability to use glucose as a source of energy and instead breaks down fat to produce ketone bodie.3–7
Ketone bodies are intermediates of hepatic fatty acid metabolism and consist mainly of acetoacetic acid, β-hydroxybutyric acid (β-HB), and acetone.8,9 Among them, β-hydroxybutyric acid is the main component, accounting for about 78% of the total ketone body content. 10 In healthy individuals, the concentration of β-hydroxybutyrate is usually low, typically less than 1 mmol/L, and ketoacidosis is diagnosed when it is higher than 3 mmol/L. 11 Therefore, β-hydroxybutyrate is one of the key biomarkers for the diagnosis and monitoring of DKA. 12 Its concentration is crucial for the diagnosis, treatment monitoring and efficacy assessment of DKA. 13
To date, conventional methods for the detection of β-hydroxybutyric acid include amperometric methods, 14 enzyme-coupled assays, 15 flow injection systems, 16 and headspace gas chromatography. 17 Conventional β-hydroxybutyric acid detection methods mainly rely on enzyme catalysis, but these methods suffer from the disadvantages of high cost, complexity of operation and easy inactivation of the enzyme. Therefore, the development of a simple and rapid β-hydroxybutyric acid assay with high sensitivity and specificity is important for the diagnosis and therapeutic monitoring of DKA. 18 The results of this study are summarized in the following table. In recent years, fluorescence detection technology has received widespread attention in the biomedical field because of its rapid response, easy operation, high sensitivity, and high selectivity.19,20
In this study, a lanthanide complex fluorescent probe with green fluorescence was successfully synthesized using Tb3+ as the luminescent center and 4-mercaptobenzoic acid (4-MBA) as the ligand. By introducing β-hydroxybutyric, the solvent molecule originally coordinated to Tb3+ can be replaced, thus suppressing the non-radiative energy jump of the center ion caused by the –OH vibration of the water molecule, which in turn significantly enhances the fluorescence emission of Tb(4-MBA) at 539 nm. The β-HB exhibited a good linear response with a limit of detection (LOD) of 50.6 nM in the range of 2–55 μM. The experimental results demonstrated that the fluorescence sensing system possessed high sensitivity and selectivity. Therefore, the Tb(4-MBA) complex showed good application prospects in the diagnosis of DKA (Figure S1, Supplemental Material).
Experimental
Materials and Methods
Thiobenzoic acid 4-MBA was purchased from Aladdin (Shanghai, China). Terbium trichloride hexahydrate (TbCl3·6H2O) was provided by Tianlang Technology Co. Sodium 3-hydroxybutyrate (β-HB) was purchased from Myriad (Shanghai, China). The rest of urea (His), anhydrous glucose (C6H12O6), creatinine (Cre), acetone (AC), glutathione (GSH), lysine (Lys), L-phenylalanine (Phe), sodium iodide (NaI), sodium nitrate (NaNO3), magnesium chloride (MgCl2), calcium chloride (CaCl2), sodium chloride (NaCl), potassium bromide (KBr), iron(III) chloride (FeCl3), and barium sulfate (BaSO4) were purchased from Sinopharm Chemical Reagent Co., Ltd. (Beijing, China). All the reagents used in the experiments were analytically pure without further purification. Deionized water was obtained from Labonova ultrapure water system (Think Lab, Germany). Human urine samples were obtained from one of the investigators in our laboratory.
Experimental Instrument
Fluorescence spectra were measured from a FS5 fluorescence spectrometer (Edinburgh Instruments, UK) and ultraviolet–visible absorption spectra (UV–Vis) were collected from a UV-2600 ultraviolet spectrophotometer (Shimadzu, Japan). Time-resolved spectra of the system after addition of different concentrations of sodium 3-hydroxybutyrate were measured using a FLS980 fluorescence spectrometer (Edinburgh Instruments, UK). Fourier transform infrared spectroscopy was performed with Frontier infrared spectrometer (Perkin Elmer, USA). The elemental contents of C, H, O, and S in the probes were determined using a German Elementar elemental analyzer. The 1H NMR and 13C NMR probes were analyzed using a 400 MHz nuclear magnetic resonance spectrometer (Bruker, Switzerland), and all solid reagents were weighed using a Mettler Toledo microelectronic balance (Zurich, Switzerland). Gaussian 09 was used to calculate the molecular surface electrostatic potential. X-ray photoelectron spectroscopy (XPS) was carried out using an Escalab 250Xi photoelectron spectrometer (Thermo Fisher Scientific, USA).
Synthesis of Fluorescent Probe
The Tb(4-MBA) complexes were synthesized based on earlier reports.21,22 Added to 0.308 g of 4-MBA (2 mM) and 0.373 g of TbCl3·6H2O (1 mM) to 10 mL of ethanol, respectively, and the 4-MBA ethanol solution was slowly dripped into the TbCl3·6H2O ethanol solution, and the resulting solution was refluxed for 4 h at 80°C under constant stirring to obtain a yellowish solid, which was washed with ethanol and methanol, respectively, and dried in vacuum to give a powdered Sample. Infrared spectra (cm–1): 3348 (v, O–H), 2678, 2599 (v, S–H), 1677, 1589, 1629 (v, C=C), 1170, 1086 (v, C–O), 1426, 1329, 747, 923, 839 (v, C–H). 13C NMR (151 MHz, methanol-d4) δ 192.31, 126.00, 125.93, 100.08, 73.91, 7.66, 7.59. 1H NMR (600 MHz, methanol-d4) δ 9.24 (d, J = 1.6 Hz, 3H), 7.60 (s, 2H), 6.17 (s, 1H), 3.10 (s, 3H), –0.67 (s, 1H), –2.32 (s, 3H).
Fluorescence Lifetime Analysis
The average fluorescence lifetime of the samples was calculated using a double exponential decay model with the following equation:

General Procedures for Fluorescence Spectroscopy and UV–Vis Spectroscopy Detection
To detect the UV–Vis spectra, 40 μL of probe solution (1 × 10⁻² M) was added to a 5 mL quartz cell, 2 mL of β-Hb aqueous solution (2 × 10⁻⁴ M) was added, and methanol–water solution (v:v, 6:1) was used to volume up to 4 mL, and the scanning range was set to be from 200 to 500 nm.
Similarly, the steps for detecting fluorescence spectra were as follows, 40 μL of probe solution (1 × 10⁻³ M) was added to a 5 mL quartz cell, 2 mL of aqueous β-Hb solution with a concentration of 0–500 mM was added, and methanol–water solution (v:v, 6:1) was used to volume the sample to 4 mL, the sample was vortexed for 5 min, and the obtained complex was used for fluorescence spectroscopic measurements after being allowed to rest for 30 min in the dark under room temperature conditions. The emission wavelength range was set to 520–560 nm with a step size of 1 nm, the excitation wavelength was 317 nm, and the slit width was set to 2.0/5.0 nm (excitation/emission). All results were measured three times, and the mean values were taken and analyzed.
Preparation of Actual Samples
To assess the effectiveness of the sensing system, we used a standard addition method to detect the presence of β-Hb in human urine samples. We centrifuged the samples at 10 000 rpm for 10 min, filtered them through a 0.22 μM membrane, and the resulting supernatant was filtered using a 0.22 μM membrane to eliminate any macromolecules present, and the resulting filtrate was diluted 100-fold.
Results and Discussion
Spectral Characterisation of Probes
The structure of Tb(4-MBA) was characterized using nuclear magnetic resonance (NMR), X-ray photoelectron spectroscopy (XPS), and infrared (IR) spectra (Figures S2–S4, Supplemental Material), and subsequently the spectral response of Tb(4-MBA) complexes to β-Hb was investigated using absorption and fluorescence spectroscopy.
The fluorescence emission spectra of Tb(4-MBA) complexes at different excitation wavelengths were scanned as shown in Figure 1a. When the excitation wavelength was increased from 250 nm to 400 nm, the emission peak positions were not affected by the excitation wavelength.
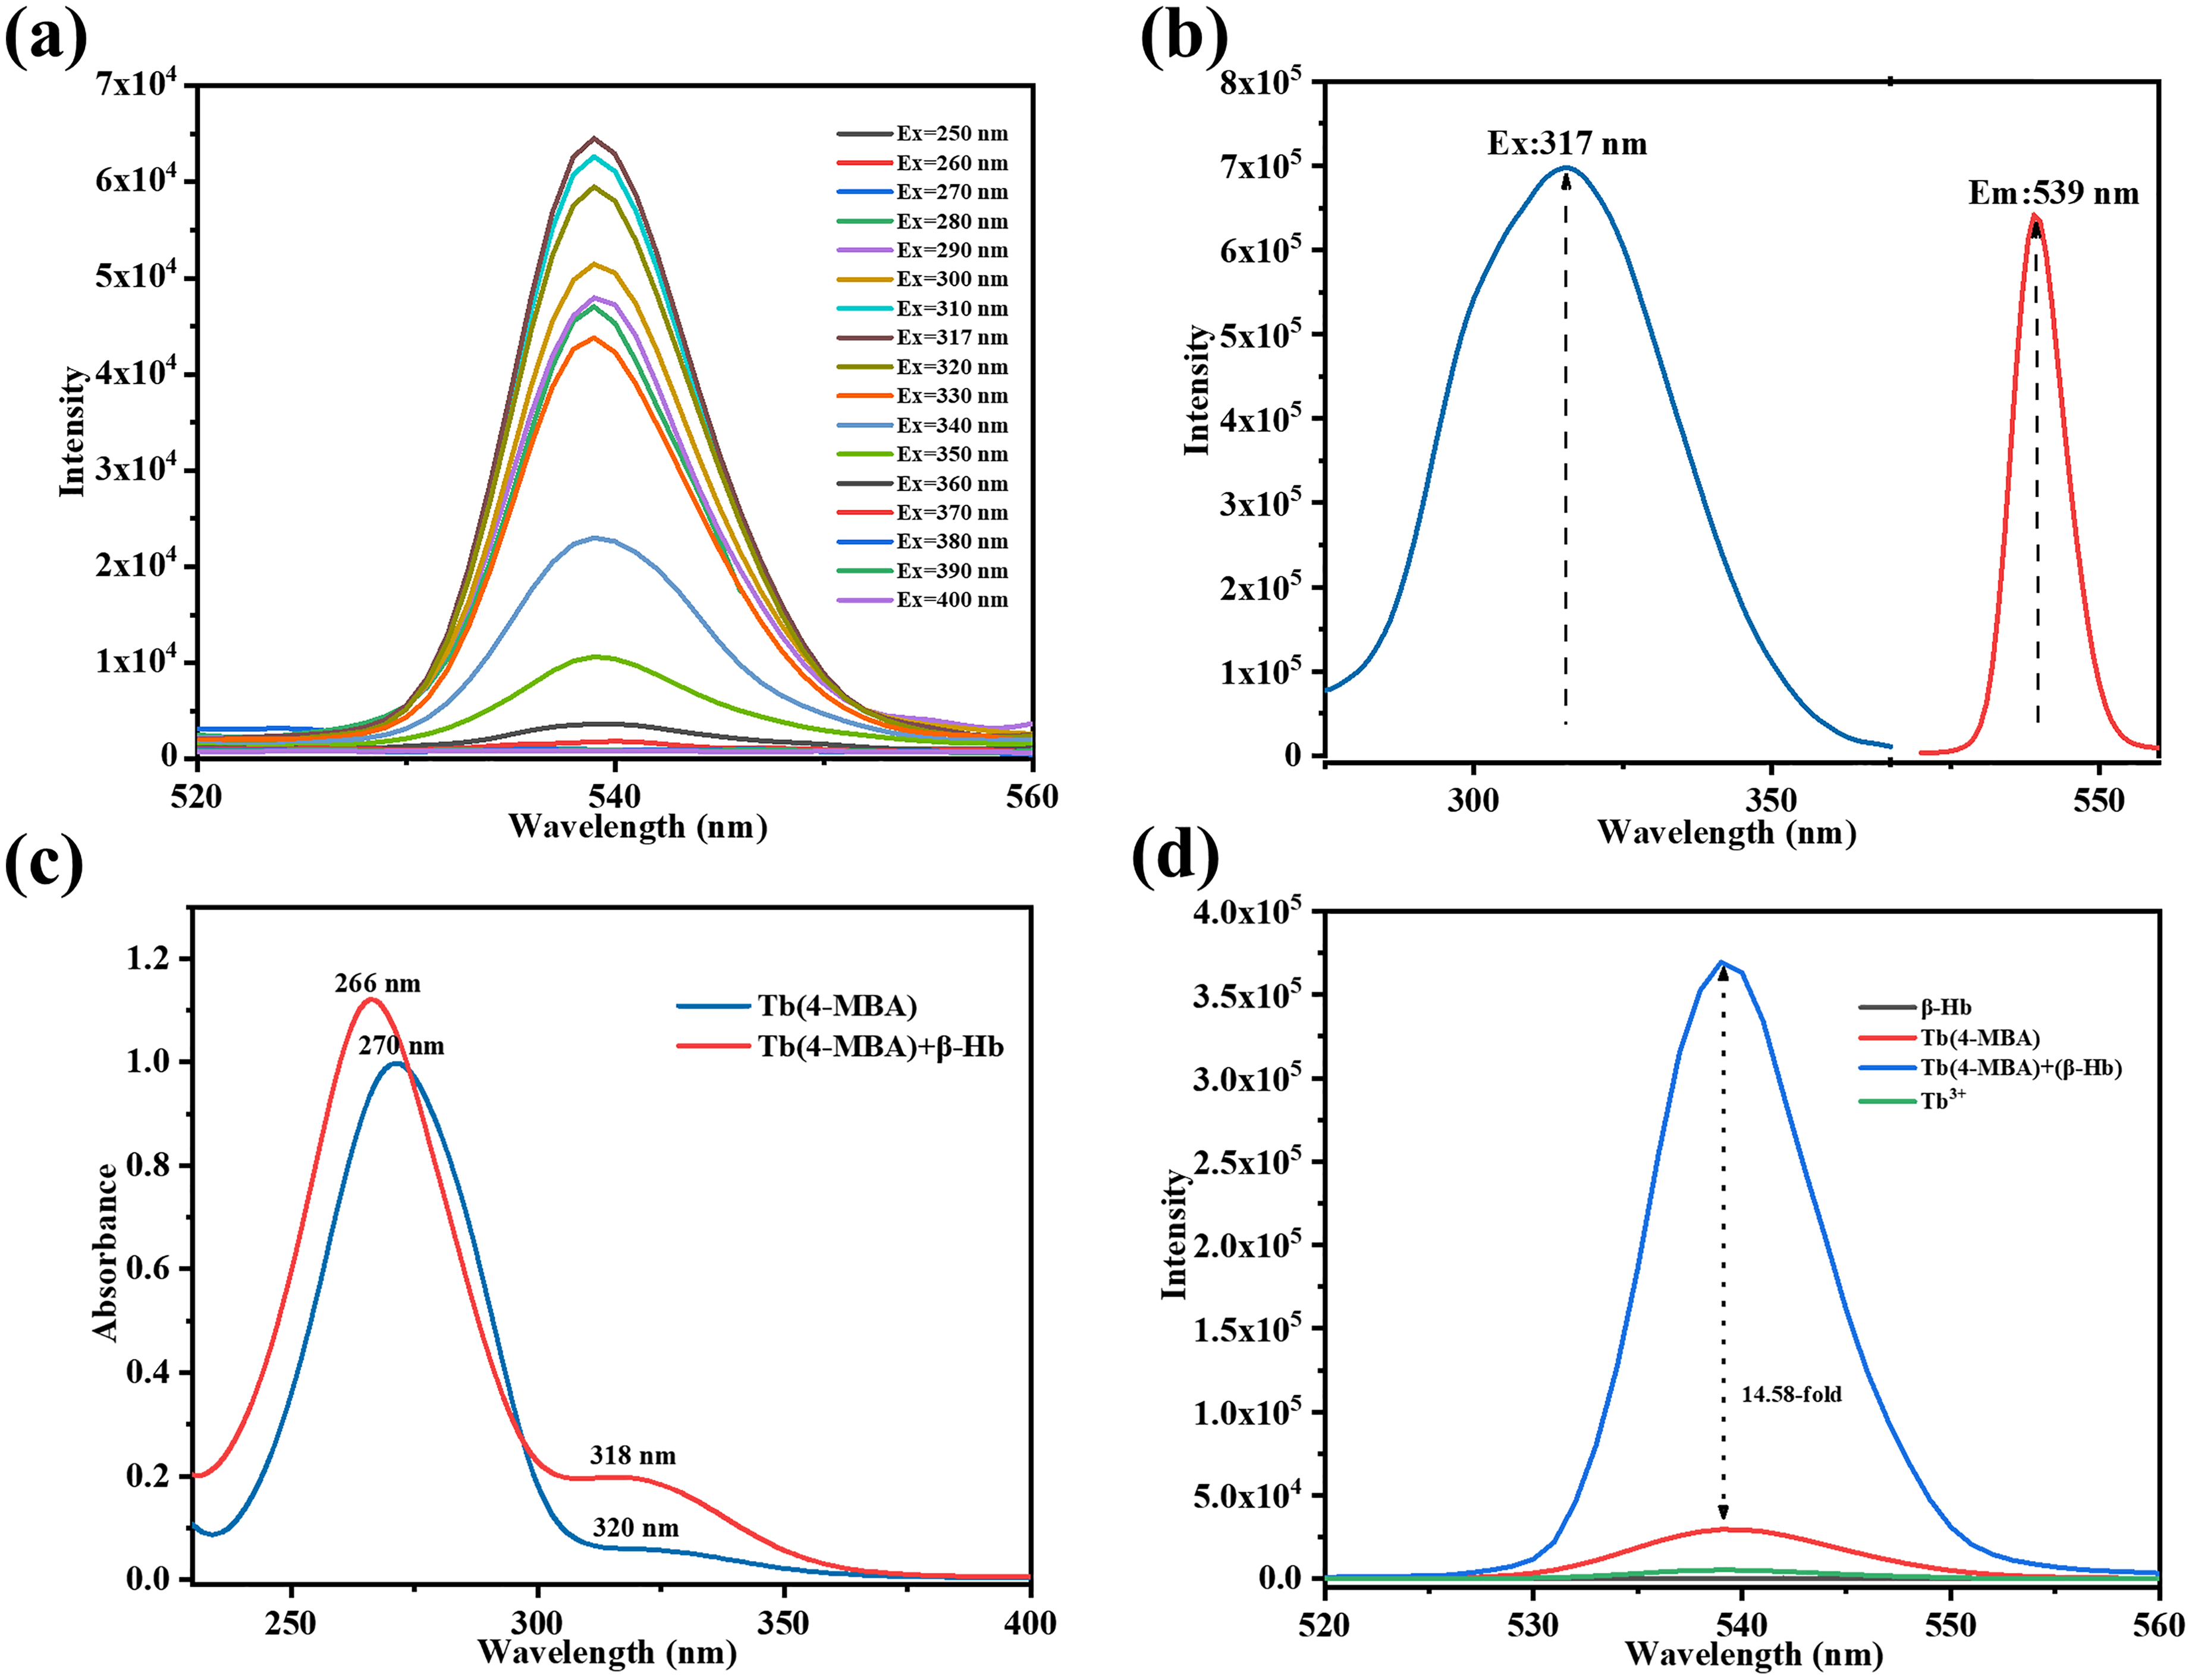
(a) Fluorescence spectra of Tb(4-MBA) at different excitation wavelengths. (b) Excitation spectra (blue line) and fluorescence spectra (red line) of Tb(4-MBA). (c) Absorption spectra of Tb(4-MBA), (Tb(4-MBA) + (β-Hb)). (d) Fluorescence spectra of β-Hb, Tb3+, Tb(4-MBA), and (Tb(4-MBA) + (β-Hb)).
As shown in Figure 1b, the peak wavelengths of the excitation spectrum (black line) and emission spectrum (red line) of the Tb(4-MBA) complex are located at 317 nm and 539 nm, respectively, and its emission wavelength is located in the green light band.
Figure 1c shows the absorption spectra before and after the addition of β-Hb, as shown, the probe has a strong absorption at 270 nm and a weak absorption at 320 nm, respectively, and it is attributed to the π–π* jump in 4-thiobenzoic acid. These two absorption bands are in the UV region and are attributed to the E- and B-band absorption of the benzene ring, respectively. Upon addition of β-Hb, both absorption peaks showed significant blue shift and hyperchromism, indicating that β-Hb coordinated with the probe to form a new compound. We believe that β-Hb, as the second ligand of Tb3+, forms a more stable conjugate system with 4-thiobenzoic acid, which promotes the transfer of energy to Tb3+.
Figure 1d shows, the fluorescence spectra of β-Hb, Tb3+, Tb(4-MBA), and (Tb(4-MBA) + (β-Hb)) systems under 317 nm excitation. It can be seen that β-Hb methanol-aqueous solution does not emit light in the 520–560 bands, and terbium 4-thiobenzoate alone emits weakly in methanol-aqueous solution, which shows the characteristic fluorescence peak of Tb3+ at its 539 nm. The 4-thiobenzoic acid ligands Tb3+ through the coordination of O atoms acts as a ligand by transferring the energy to Tb3+ through intramolecular energy transfer, which promotes the ultrasensitive Tb3+ from D54 to F75 jump, resulting in a characteristic fluorescence peak at 539 nm.
After the addition of β-Hb, the position of the fluorescence emission peak of the system remained unchanged at 539 nm, indicating that the luminescence center was still Tb3+, and the luminescence intensity of the system was significantly enhanced. After the addition of 200 μM of β-Hb to the terbium methanol–water solution of 4-thiobenzoic acid, the fluorescence enhancement of the system could reach 14.58-fold, which indicated that β-Hb could act as the second ligand of Tb3+ and promote the transfer of energy to Tb3+. The methanol or water molecules in the solvent can coordinate with Tb3+, but the O–H vibration in the solvent will lead to an increase in the probability of the non-radiative energy jump of Tb3+, which will reduce the fluorescence intensity of the syste. 24 The ability of β-Hb to displace solvent molecules from coordinating with Tb3+ inhibits this bursting effect, thus enhancing the fluorescence intensity of the system.
Detection Mechanism of β-Hb
In order to investigate the detection mechanism of β-Hb, we used Gaussian 09 software and set the basal group condition as B3LYP/6-31G + (d) to optimize the molecular structures of 4-thiobenzoic acid and β-Hb. 25 On the basis of the optimization, we calculated the surface electrostatic potential distribution of 4-thiobenzoic acid and β-Hb, and the results are shown in Figure 2a. The figure shows that the part near the blue colour carries a positive potential and the part near the red colour carries a negative potential. Gaussian calculations show that the carbonyl oxygen on the carboxyl group of thiobenzoic acid is significantly close to –OH on β-Hb, which is easy to form O–H…O form of hydrogen bonding, thus allowing the two to form a more stable structure.26,27
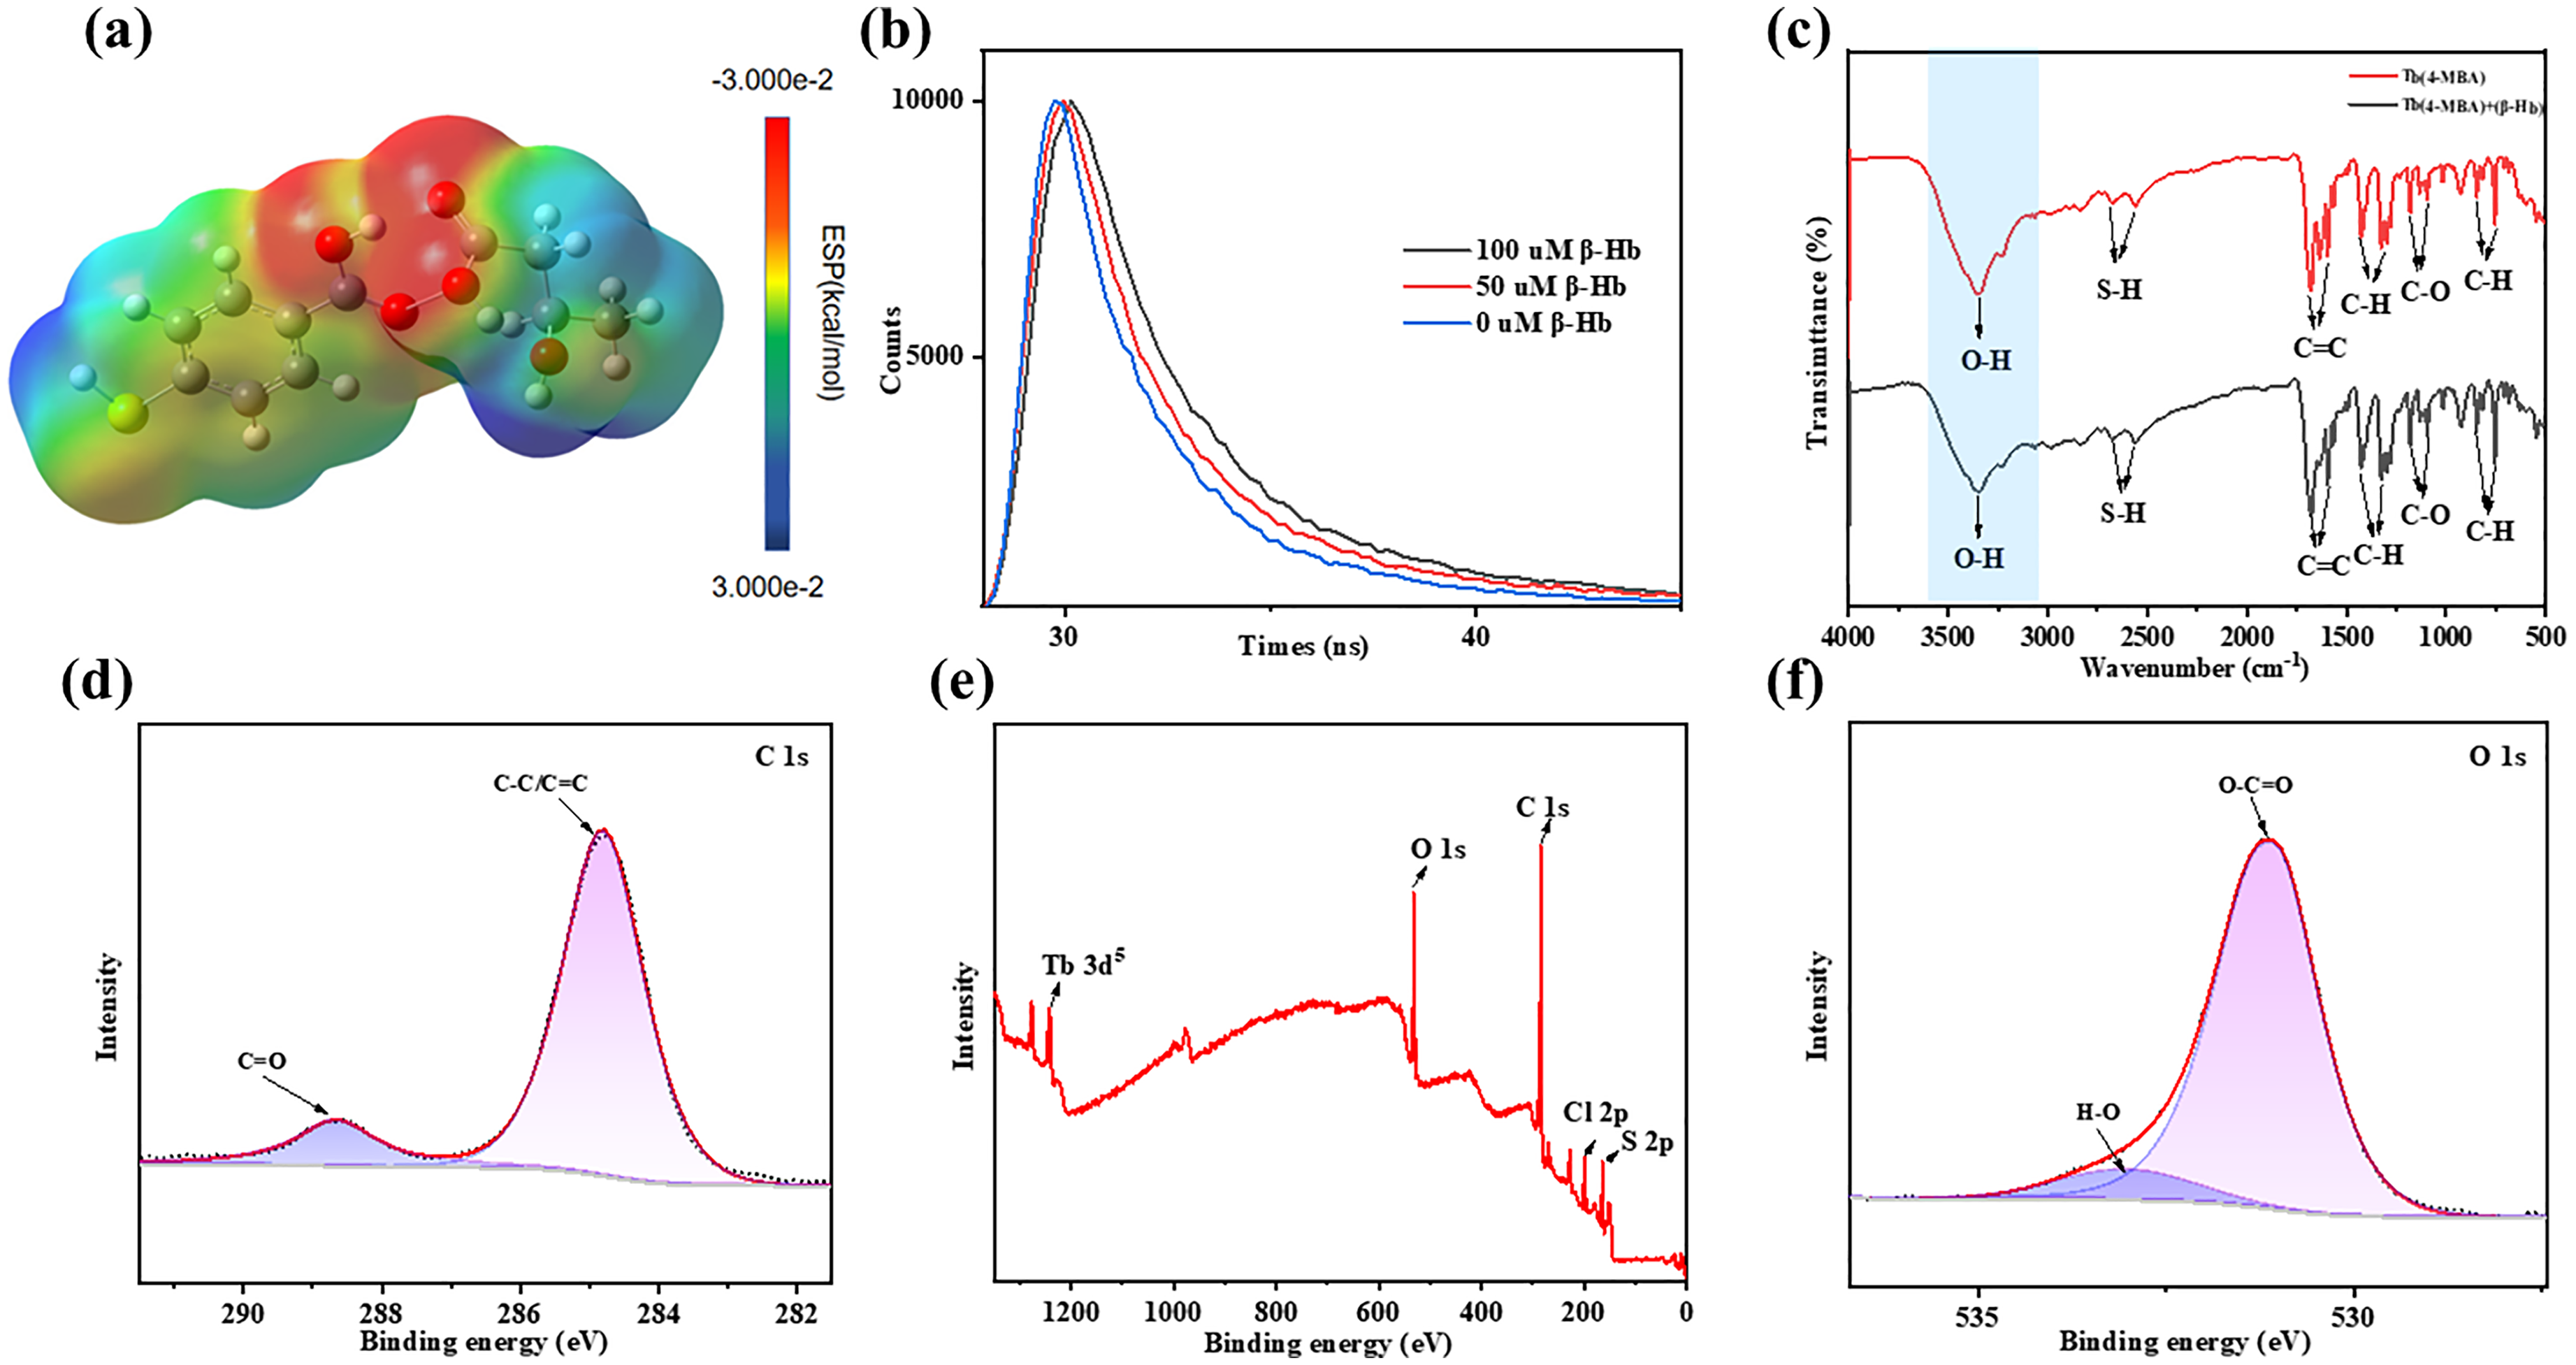
(a) Electrostatic potentials on the molecule surfaces of β-Hb and Tb(4-MBA). (b) Fluorescence lifetime of Tb(4-MBA) and (Tb(4-MBA) + (β-Hb)). (c) Infrared spectra of Tb(4-MBA) and (Tb(4-MBA) + (β-Hb)). (d) The survey XPS spectrum of Tb(4-MBA). (e) High-resolution XPS spectra of C 1 s of Tb(4-MBA). (f) High-resolution XPS spectra of O 1 s of Tb(4-MBA).
To clarify the mechanism of hydrogen bonding, we characterized the infrared spectra and X-ray photoelectron spectroscopy (XPS) of the Tb (4-MBA) complex before and after the addition of β-Hb. As shown in Figure 2c, the infrared spectra of the Tb(4-MBA) system show multiple characteristic vibration modes: The strong absorption peak at 3348 cm–1 corresponds to the tensile vibration of O–H; the peaks at 2678 and 2599 cm–1 can be attributed to the tensile vibration of the S–H bond in the ligand. The vibrations at 1677, 1589, and 1629 cm–1 are attributed to the C=C conjugate vibration of the benzene ring skeleton. The characteristic peaks in the 1170 and 1086 cm–1 regions correspond to the tensile vibration of the C–O bond, and the characteristic peaks in the 1426, 1329, 747, 923, and 839 cm–1 regions belong to the out-of-plane bending vibration mode of the aromatic ring C–H. 22 It is notable that after the introduction of β-Hb, the positions of the characteristic peaks of the infrared spectra of the system did not change significantly, indicating that the basic framework structure of the main complex remained stable. In the 3200–3600 cm–1 broadband area, the O–H tensile vibration band shows an obvious widening phenomenon. It is speculated that a hydrogen bond was formed between the carboxyl oxygen of 4-thiobenzoic acid and the hydroxyl group of β-Hb.28,29
The XPS characterization (Figure 2d) shows that the full XPS spectrum of the Tb(4-MBA) complex presents characteristic peaks at 284 eV (C 1 s), 530 eV (O 1 s), and 1243 eV (Tb 3d5), confirming the presence of carbon, oxygen, and terbium elements in the material. The high-resolution C 1 s spectrum (Figure 2e) shows double peaks at 284.8 eV (C–C/C=C) and 288.34 eV (C=O), and the O 1 s spectrum (Figure 2f) shows signals at 531.06 eV (C=O) and 533 eV (O–H). Consistent with the infrared spectra results, it indicates that the material surface is rich in carboxylic acid and hydroxyl functional groups.30,31
After the introduction of β-Hb, a new Na 1 s signal appeared in the full spectrum of XPS (Figure S3a, Supplemental Material) at 1072 eV, and the main peak positions of the remaining elements remained stable. The binding energy of the C = O bond in the C 1S spectrum shifted positively from 288.34 eV to 288.41 eV (Figure S3b, Supplemental Material), and the peaks of C=O and O–H in the O 1 s spectrum shifted to 531.82 eV and 533.15 eV respectively (Figure S3c, Supplemental Material). Moreover, the relative intensity of the O–H peak was significantly enhanced, and a new peak appeared at 535.64 eV at the same time (possibly attributed to surface adsorbed oxygen or enrichment of functional groups). The positive shift of binding energy and the change in the proportion of oxygen-containing groups indicate that the carboxyl oxygen of the 4-MBA ligand may form intermolecular hydrogen bonds with the hydroxyl group on the surface of β-Hb.32–34 This interfacial interaction reduces the electron cloud density of oxygen atoms, which may lead to the transfer of binding energy.
The fluorescence intensity of the terbium 4-thiobenzoate system is susceptible to the O–H high intensity vibrations in the solvent molecules. Upon addition of β-Hb, β-Hb and 4-thiobenzoic acid form a more stable complex through hydrogen bonding. At the same time, the hydrogen bonding effect may lead to further proximity of the oxygen atom of β-Hb to Tb3+, which makes it easier for β-Hb to displace the solvent molecule coordinated to the Tb3+ ion and promotes the transfer of energy to Tb3+.
To demonstrate that the addition of β-Hb can reduce the non-radiative energy loss of the system, we measured the time-resolved spectra of terbium 4-thiobenzoate. The results are shown in Figure 2b and Table S1 (Supplemental Material), where the fluorescence decay rate of the system slows down as the added β-Hb concentration increases from 0 to 100 μM. The fluorescence lifetime of the system increased from 10.15 ns to 16.58 ns with the increase of β-Hb concentration, which indicated that the presence of β-Hb reduced the non-radiative energy loss of terbium 4-thiobenzoate, thus prolonging the radiative transition lifetime. It indicates that β-Hb can replace water molecules to coordinate with Tb3+ ions and act as a second ligand to transfer energy to Tb3+ ions.24,26,35
Condition Optimisation and Stability
In order to determine the optimal reaction conditions and stability of the experiment, we explored the Tb(4-MBA) complex concentration, ratio, reaction time and ionic strength, respectively.
As shown in Figure 3a, the fluorescence intensity ratio F / F0 of the system before and after the addition of β-Hb showed a tendency of increasing and then decreasing as the concentration of terbium 4-thiobenzoate increased from 4 μM to 250 μM. When the concentration of terbium 4-thiobenzoate was in the range of 10–30 μM, the response sensitivity of Tb(4-MBA) complex to β-Hb was better, so the concentration of the fluorescent probe used in this experiment was 10 μM.
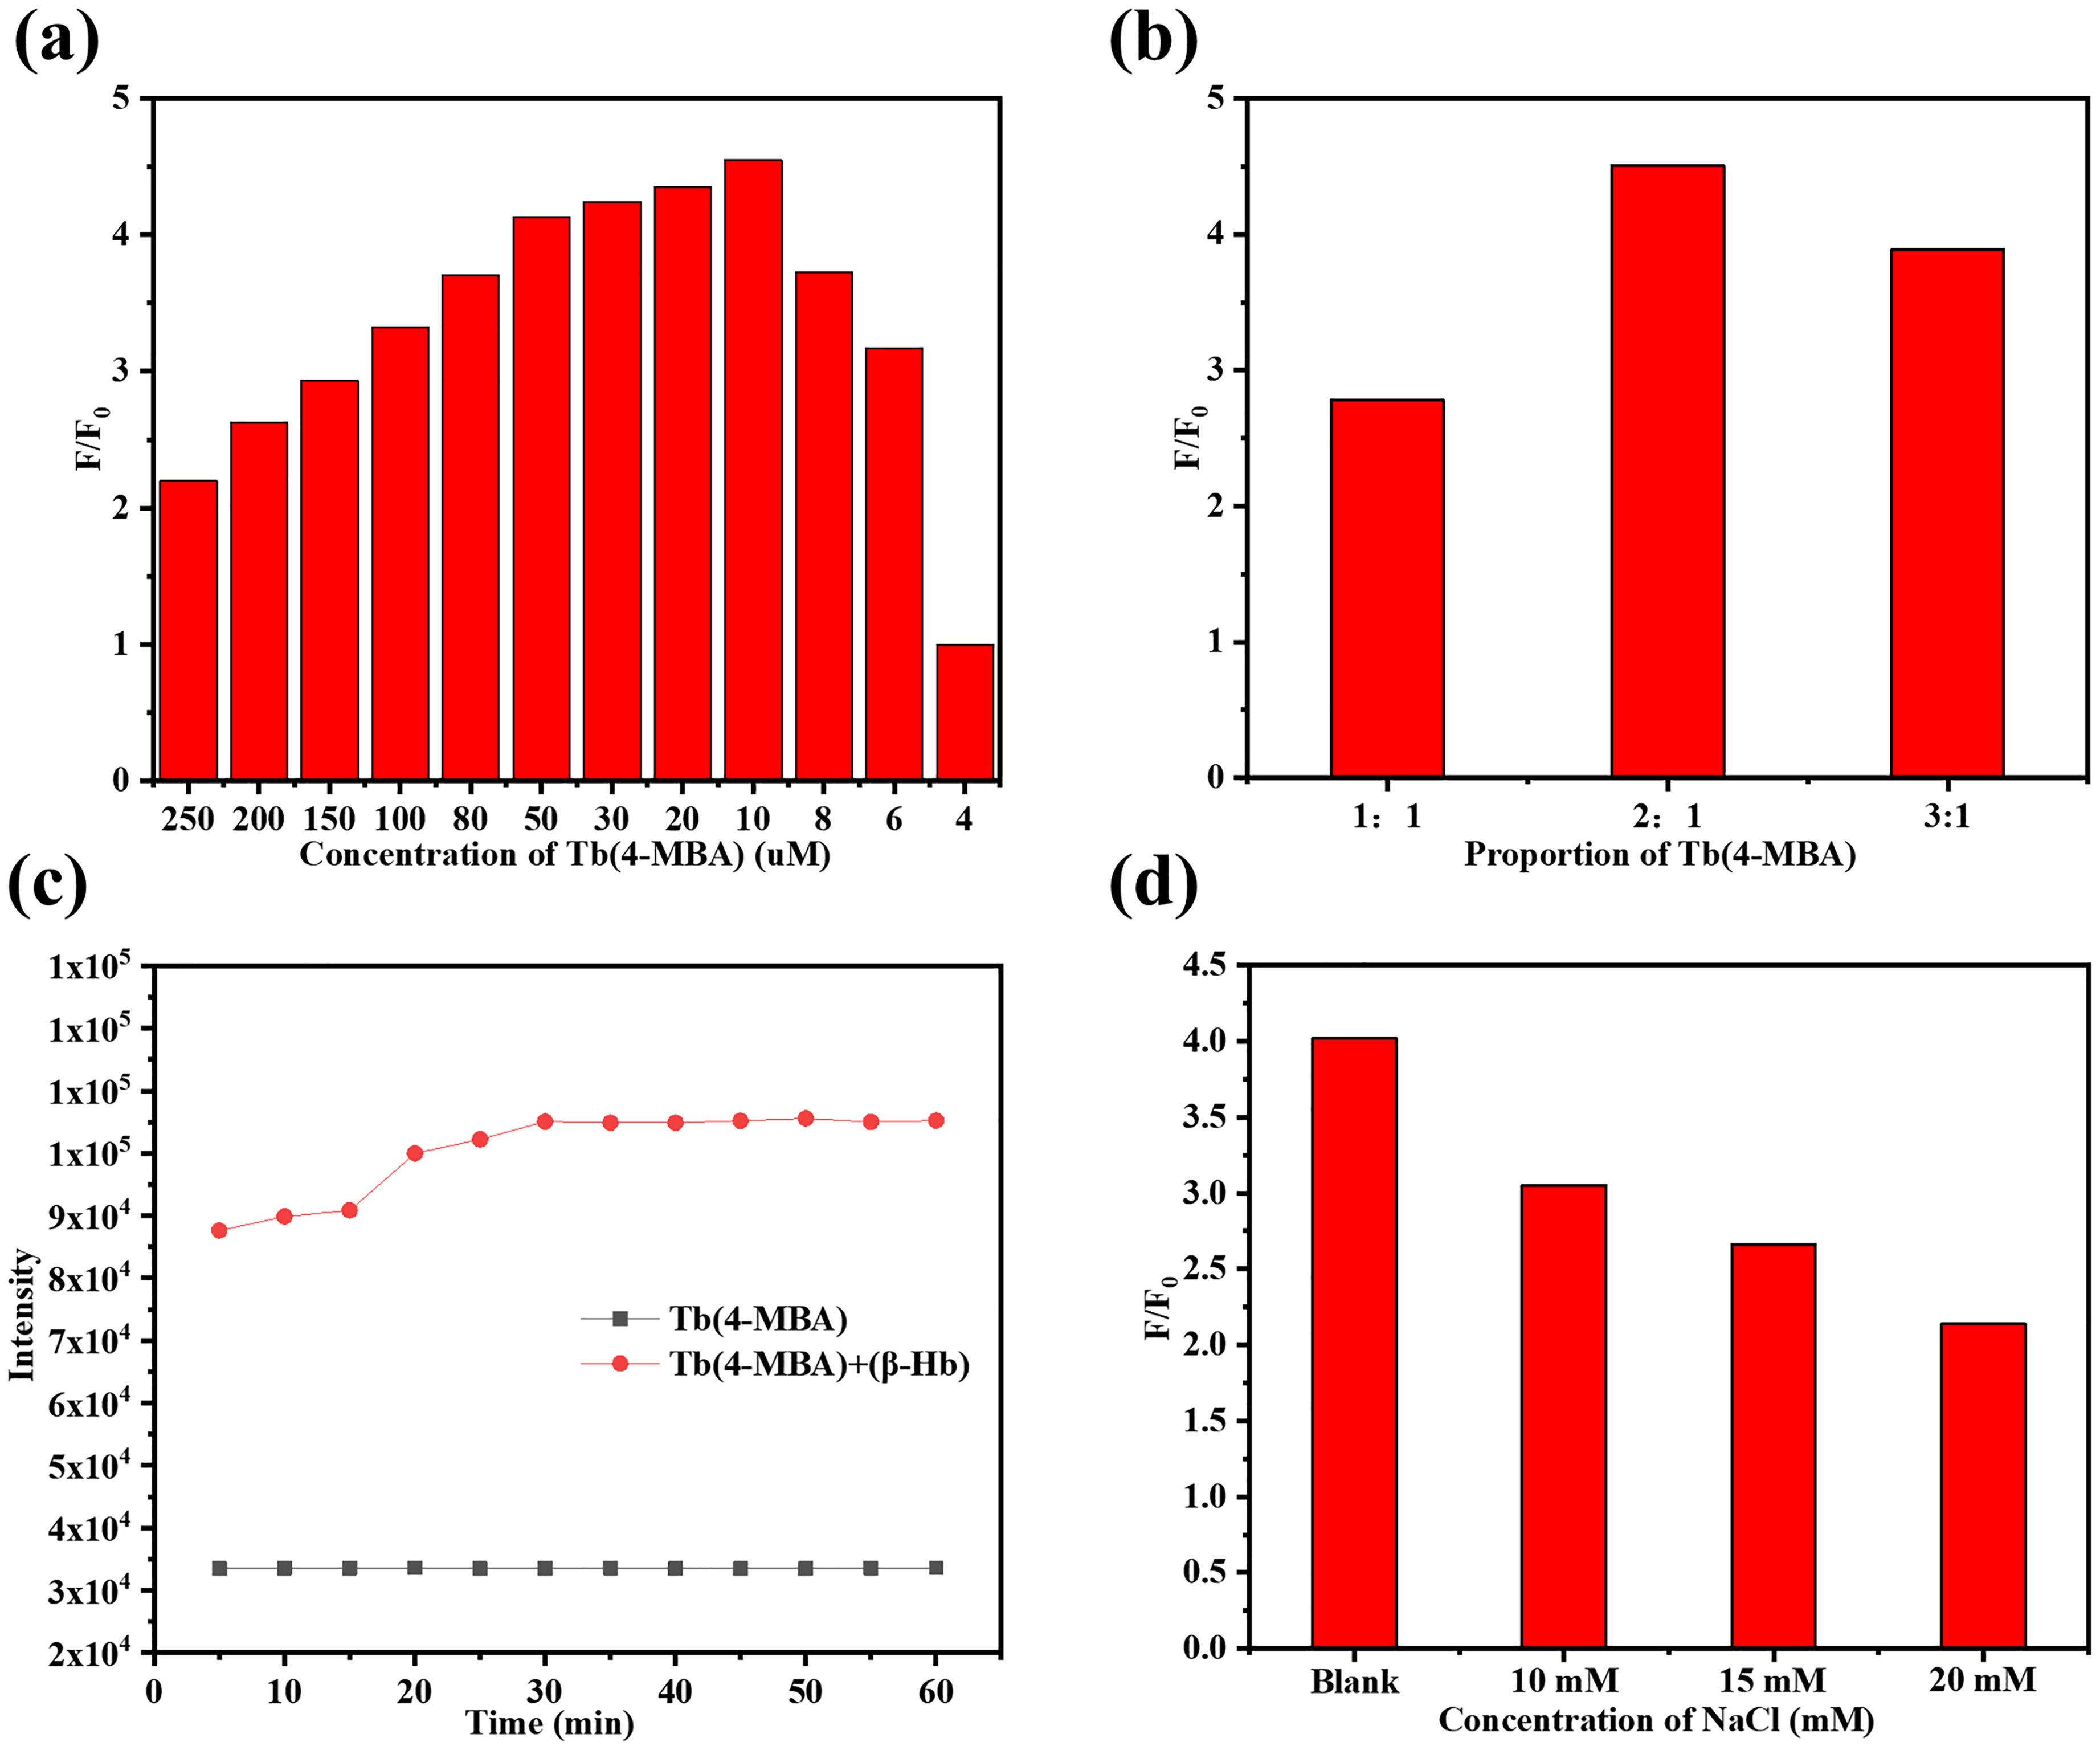
(a) Relationship between different concentrations of Tb(4-MBA) and fluorescence intensity ratio (F/F0). (b) Relationship between different concentrations of Tb3+ and fluorescence intensity ratio (F/F0). (c) Reaction time of Tb(4-MBA) and (Tb(4-MBA) + (β-Hb)) systems. (d) Effect of different concentrations of NaCl on the fluorescence intensity ratio of the system (F/F0).
We synthesized Tb(4-MBA) complexes of 4-thiobenzoic acid and terbium chloride hexahydrate with molar ratios of 1:1, 2:1 and 3:1, respectively. As shown in Figure 3b, the Tb(4-MBA) complex with a molar ratio of 2:1 showed the highest sensitivity to the response of β-Hb after the addition of β-Hb, and the worst enhancement effect was achieved with a molar ratio of 1:1.
As shown in Figure 3c, the fluorescence intensity of the Tb(4-MBA) complex was basically unchanged within 60 min, indicating that the stability of the probe was good. After the addition of β-Hb, the fluorescence intensity of the system basically reached stability after 30 min and remained basically unchanged within 30–60 min. Therefore, all the samples to be tested in this experiment were left to stand for 30 min before detection.
In order to prove the stability of the reaction system, the effect of ionic strength on the reaction system was experimentally investigated. As shown in Figure 3d, we chose a certain concentration of sodium chloride solution as the object of study for the ionic strength experiment. As can be seen from Figure, the fluorescence intensity of the reaction system decreased as the concentration of sodium chloride in the reaction system increased from 0 mM to 20 mM, but it was still within the acceptable range.
Specific selectivity
To demonstrate the selectivity of the Tb(4-MBA) complex for β-Hb and the immunity of the (Tb(4-MBA) + (β-Hb)) system to interference, we used a variety of cations (Mg2+, Ca2+, K+, Ba2+, Fe3+), anions (Cl–, I–, NO3–, Br–, SO42–) and common amino acids in urine (glutathione, phenylalanine, lysine), and common small molecule markers of diabetes (urea, creatinine, glucose, acetone) in urine were used as interferences.
The results are shown in Figures 4a and 4b The fluorescence intensity of the Tb(4-MBA) complex (1 × 10⁻⁵ M) did not enhance significantly after the addition of various interferences (6 × 10⁻⁵ M) to the Tb(4-MBA) complex (1 × 10⁻⁵ M), whereas the fluorescence intensity of the probe was enhanced by about 11-fold with the addition of β-Hb (6 × 10⁻⁵M), and the experimental results indicated that the selectivity of the probe for β-Hb recognition was better. We next explored the anti-interference ability of the system, as shown in Figures 4c and 4d. β-Hb and various interfering substances were added into the fluorescent probe together, respectively, and the results showed that the recognition effect of the fluorescent probe on β-Hb was affected to an acceptable extent, indicating that the system has good anti-interference ability.
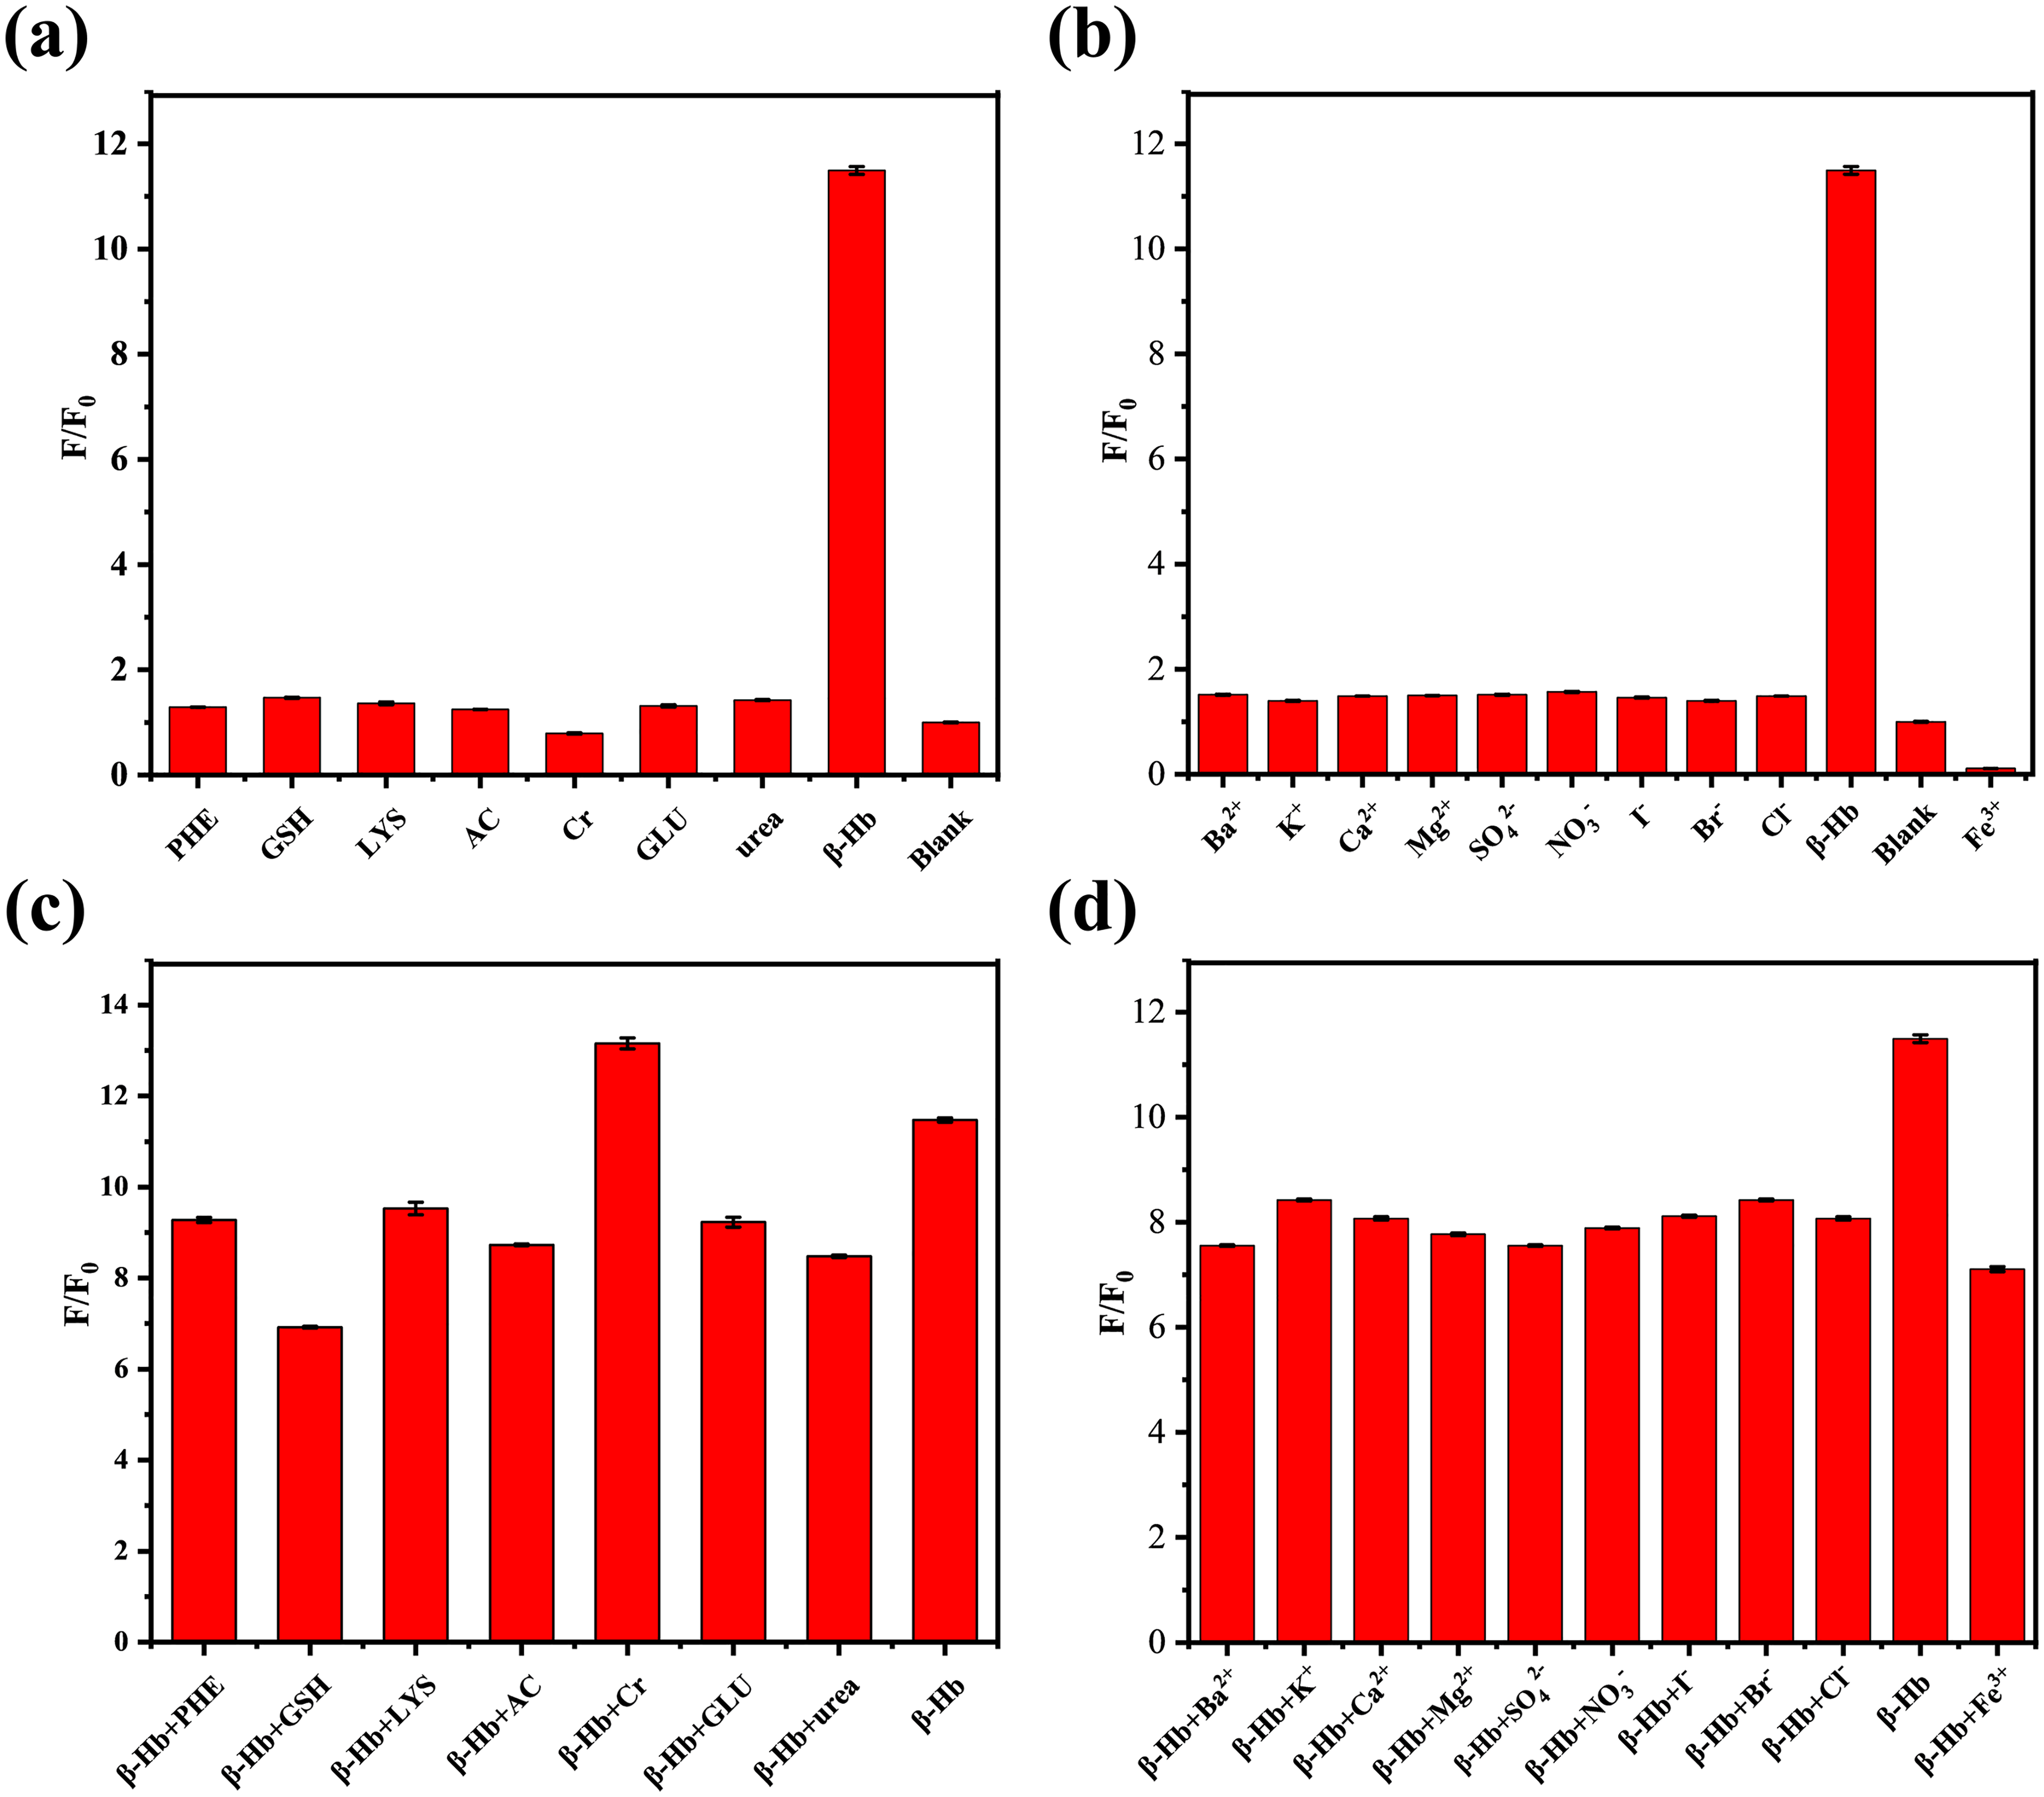
(a) Effect of various amino acids and common diabetic small molecule markers in urine on Tb(4-MBA) complexes. (b) Effect of various cations and anions on Tb(4-MBA) complexes. (c) Effect of various amino acids and common diabetic small molecule markers in urine on the (Tb(4-MBA) + (β-Hb)) system. (d) Effect of various cations and anions on the (Tb(4-MBA) + (β-Hb)) system.
Determination of β-Hb
The experimental results showed that the fluorescence intensity of the fluorescent probe had a significant enhancement effect after the addition of β-Hb. Figure 5a shows the fluorescence spectra of the fluorescent probe mixed with different concentrations of β-Hb (0–200 μM) after being placed in the dark room at room temperature for 30 min. It can be seen that the fluorescence intensity of the reaction system at 539 nm was gradually enhanced with the increase of β-Hb concentration.
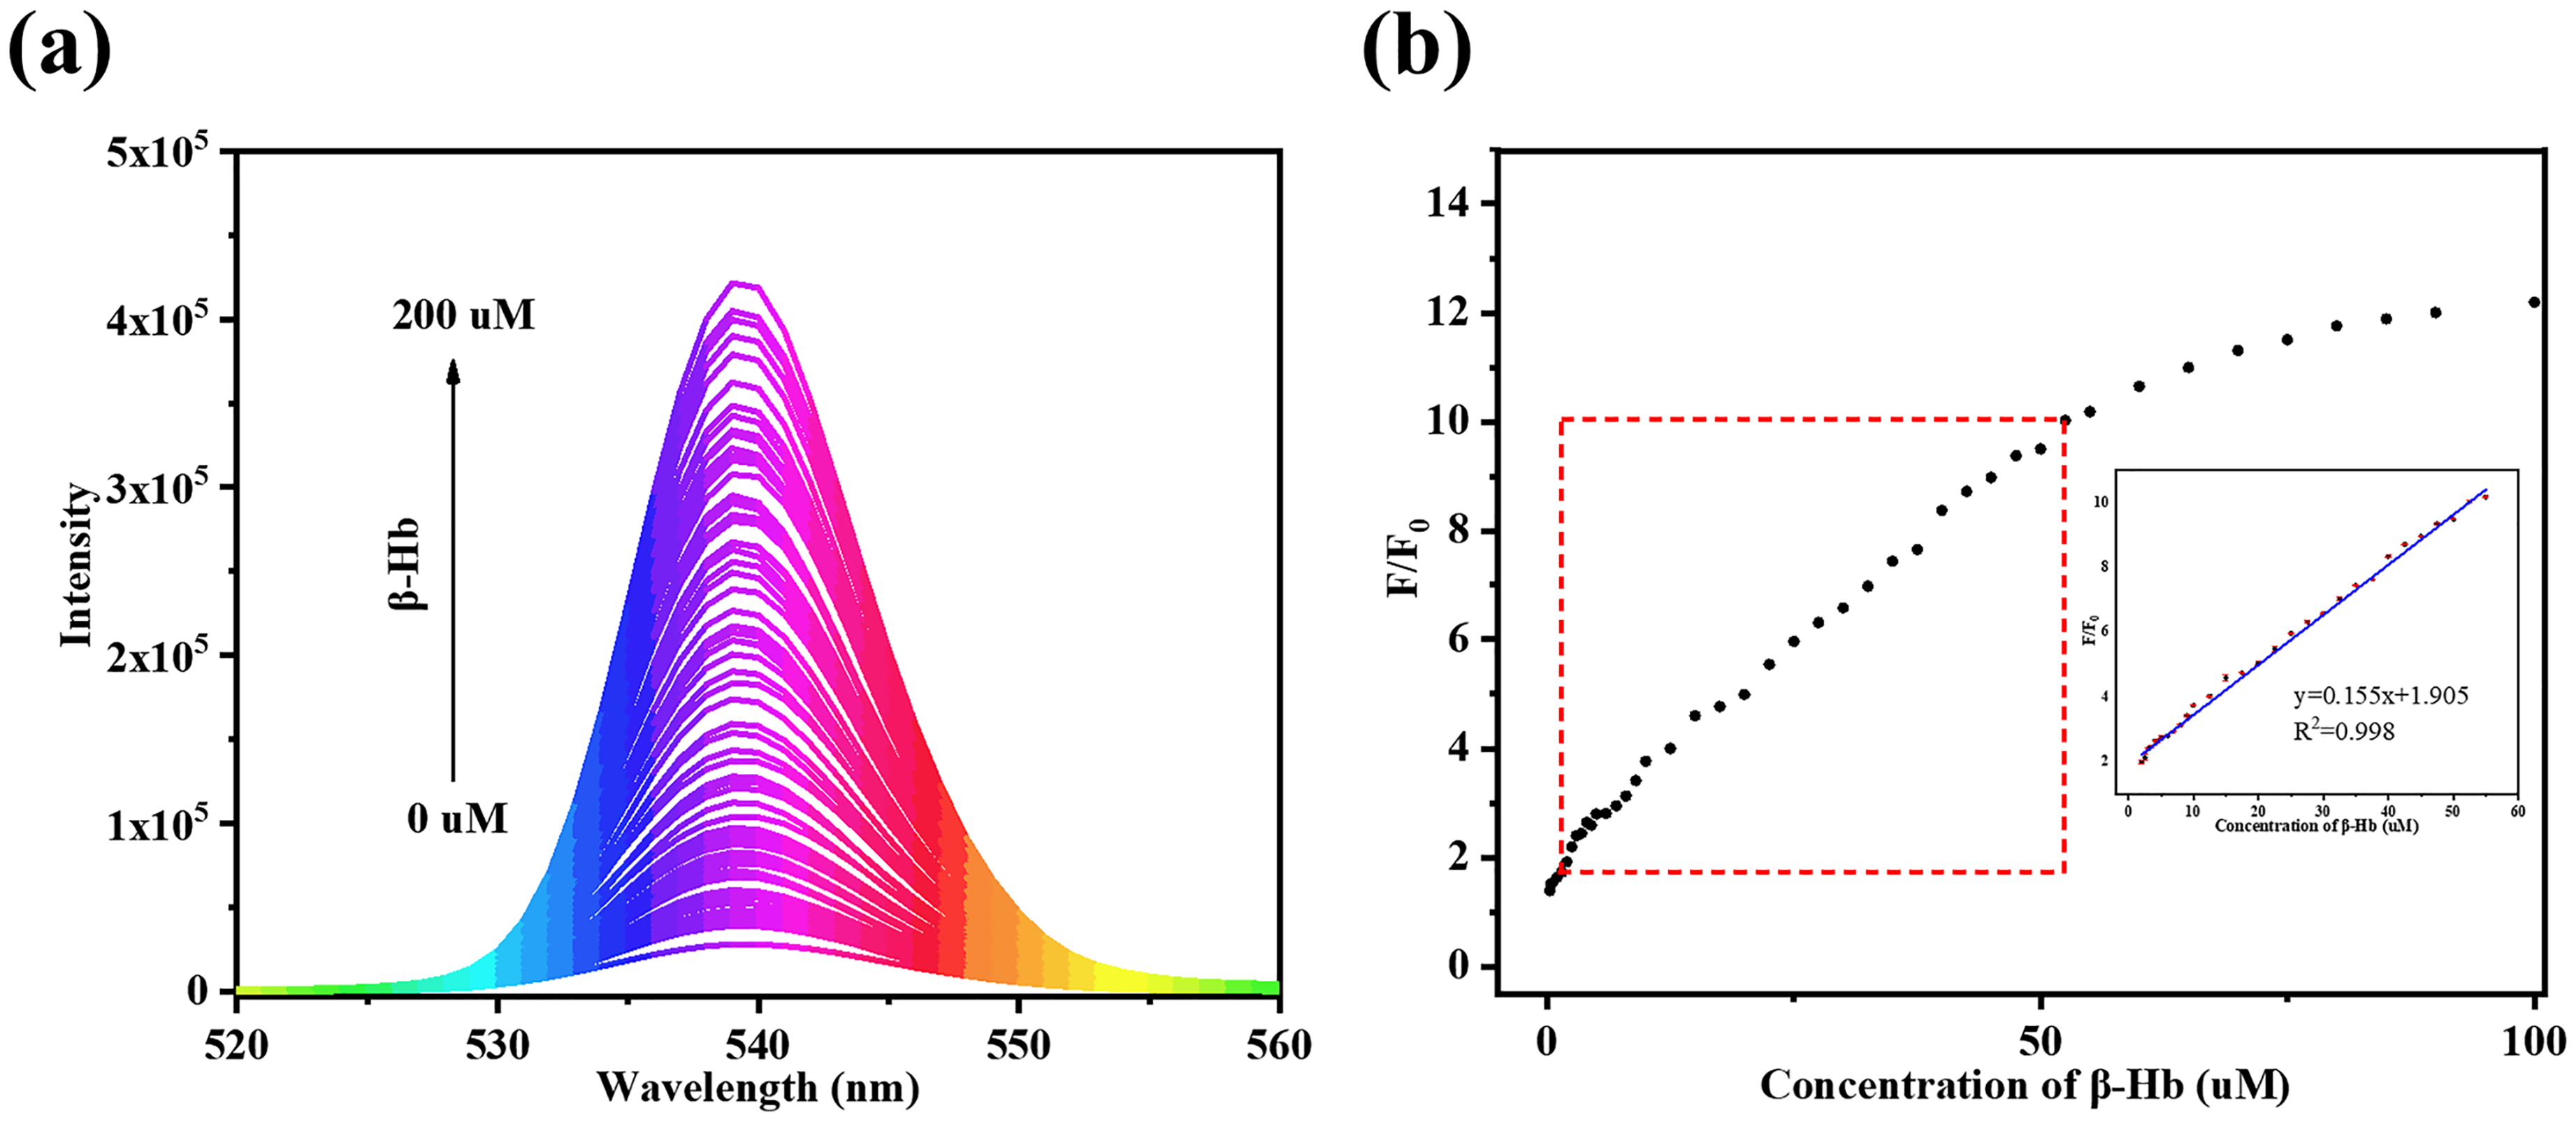
(a) Fluorescence spectra of Tb(4-MBA) complexes at different concentrations of β-Hb (0-200 μM). (b) Relationship between β-Hb concentration and fluorescence intensity ratio (inset: the fluorescence intensity ratio, F/F0, linear with the β-Hb concentration in the range of 2–55 μM).
Based on the fluorescence spectra of the reaction system, the relationship curve of the fluorescence intensity ratio (F/F0) (in which F is fluorescence intensity of the system after the addition of β-Hb and F0 fluorescence intensity of the system before the addition of β-Hb) of the system was established. As shown in Figure 5b, the fluorescence intensity ratio F/F0 had a good linear relationship with the concentration of β-Hb in the range of 2–55 μM. The linear regression equation was F/ F0 = 0.155C + 1.905, and the corrected correlation coefficient R2 was 0.998 with the detection limit:

In order to confirm the accuracy and reliability of β-Hb detection, the standard addition method was used to calculate the predicted concentration of β-Hb in urine, as shown in Table I, the recoveries of β-Hb were β-Hb, and all the data in the table were the mean values of three measurements, which indicated that the method was accurate and reliable for the detection of β-Hb.
Detection of β-Hb in urine.
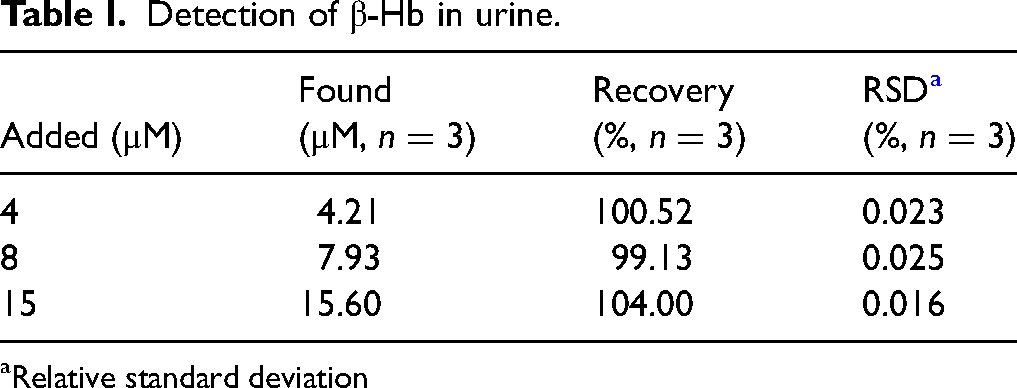
Relative standard deviation
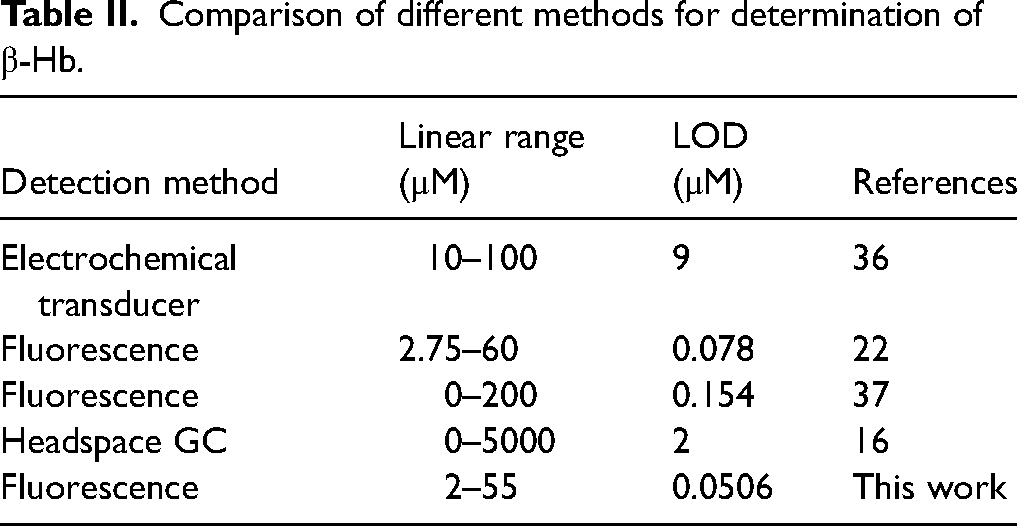
Compared with several existing β-Hb detection methods, as shown in Table II, the present work provides higher accuracy and sensitivity for β-Hb detection with a larger detection range. The sensor has a better application prospect for the detection of β-Hb.
Comparison of different methods for determination of β-Hb.
Conclusion
In summary, we successfully synthesized a highly sensitive fluorescent probe of rare earth complexes for the detection of β-Hb concentration in urine. The fluorescent probe showed a weak response to common amino acids and common small molecule markers of diabetes in urine, but high selectivity for β-Hb. We proposed a possible detection mechanism for β-Hb and validated it by Gaussian calculations and time-resolved spectroscopy. It was shown that β-Hb forms a more stable complex with 4-thiobenzoic acid through hydrogen bonding, which helps β-Hb to displace solvent molecules coordinated to Tb3+ ions, thus reducing the non-radiative energy loss of the fluorescent probe and enhancing the fluorescence intensity of the system. The fluorescence intensity ratio F/F0 showed a good linear relationship with β-Hb concentration, with a linear range of 2–55 μM and a detection limit of 50.6 nM, this method had a good recovery rate (99.13%–104.00%) in urine samples. We established a lanthanide complex fluorescent probe with higher sensitivity and better selectivity for the detection of β-Hb concentration in urine. The assay provides an important diagnostic tool and information for the screening of diabetes and the diagnosis of diabetic ketoacidosis (DKA).
Supplemental Material
sj-docx-1-asp-10.1177_00037028251365665 - Supplemental material for Detection of β-Hydroxybutyric Acid Based on a Fluorescent Probe of Lanthanide Complexes
Supplemental material, sj-docx-1-asp-10.1177_00037028251365665 for Detection of β-Hydroxybutyric Acid Based on a Fluorescent Probe of Lanthanide Complexes by XingYi Guo, Chun Zhu, Guoqing Chen, Lei Li, Chaoqun Ma, Taiqun Yang, Anqi Hu, WenHui Yang and YaLi Qian in Applied Spectroscopy
Footnotes
CRediT Author Statement
Xing Guo: Conceptualization, methodology and writing–original draft. Guoqing Chen: Project administration, funding acquisition. Taiqun Yang: Supervision, validation. Lei Li: Formal analysis. Chaoqun Ma: Formal analysis. Anqi Hu: Visualization. Wenhui Yang: Visualization.Yali Qian: Visualization. Chun Zhu: Contributed to project administration and Writing–review and editing.
Declaration of Conflicting Interests
The author(s) declared no potential conflicts of interest with respect to the research, authorship, and/or publication of this article.
Funding
The author(s) disclosed receipt of the following financial support for the research, authorship, and/or publication of this article: This work was supported by the National Natural Science Foundation of China [62375112].
Supplemental Material
All supplemental material mentioned in the text is available in the online version of the journal.
References
Supplementary Material
Please find the following supplemental material available below.
For Open Access articles published under a Creative Commons License, all supplemental material carries the same license as the article it is associated with.
For non-Open Access articles published, all supplemental material carries a non-exclusive license, and permission requests for re-use of supplemental material or any part of supplemental material shall be sent directly to the copyright owner as specified in the copyright notice associated with the article.