
Abstract
Hydroxyl-terminated polybutadiene (HTPB) is used in a variety of formulations, particularly for military and aerospace applications as a binder for energetic materials. This work investigates details of its curing process when formulated with isophorone diisocyanate (IPDI). Raman spectroscopy was used as a fast, sensitive, non-destructive technique to monitor the curing process of HTPB-IPDI. A significant feature at 777 cm–1 was shown to grow over the course of the curing process. Ab initio calculations of the normal modes of the HTPB-IPDI dimer indicate that this feature is most likely connected to the urethane bond, which suggests that the feature at 777 cm–1 is associated with formation of the urethane linkage as the formulation cures. Raman spectroscopy thus has potential to be used for quality assurance and other material state awareness measurements for HTPB-IPDI materials.
This is a visual representation of the abstract.
Keywords
Introduction
Hydroxyl-terminated polybutadiene (HTPB) is a versatile elastomeric material used in a wide variety of applications including sealants, coatings, structural binders, and, in combination with energetic materials, as plastic explosives and solid rocket propellants.1–3 Since its development in the 1960s, HTPB-based polyurethanes have become essential materials in military and aerospace applications due to their mechanical resilience, thermal stability, and tunable chemical properties.4–6 These characteristics arise from the curing process, in which polybutadiene chains terminated by hydroxyl groups react with di- or poly-isocyanates to form crosslinked urethane networks. Common HTPB resins, such as R-45 M and R-45HTLO, contain an average of 45 butadiene units per chain, and their mechanical properties depend on both the chain architecture and the density of crosslinks.7–9 Scheme 1 shows the curing mechanism for HTPB resin with isophorone diisocyanate (IPDI), which is the formulation used in this study. 10
Formulation of HTPB with IPDI.
The HTPB formulations can be further tailored through additives such as fillers, catalysts, antioxidants, stabilizers, and plasticizers to modulate performance characteristics, including strength, resistance to aging, and combustion performance.4,11–14 This versatility has created a $140.4 million industry as of 2022 that is projected to reach $202.4 million by 2031. 7 Despite its extensive use, however, fundamental questions remain about the relevant curing and aging mechanisms of HTPB-based materials.1,15–18
Vibrational spectroscopy has great potential to investigate the molecular properties of formulated HTPB. 19 Raman spectroscopy is a particularly effective technique to investigate the polymer network in situ. In addition to its uses for identifying compositions, Raman spectroscopy is now widely used to monitor chemical conversion, structural ordering, and the evolution of physical properties such as glass transition temperature, shear and Young’s modulus, and density of hydrogen bonding.20–33 Recent studies have shown that low-frequency Raman bands, particularly between 7 to 85 cm–1, correlate with conformational entropy and network rigidity as the polymer transitions from a liquid to a solid.34,35 These vibrational features have been used to characterize resin curing kinetics in epoxies, methacrylates, and interpenetrating polymer network systems, offering complimentary insights into dielectric, calorimetric, and rheological methods. 36
In this work, Raman spectroscopy was used to monitor the curing of HTPB with IPDI, with a focus on identifying a primary spectral signature of the formation of urethane linkages. Such a spectral signature will allow Raman spectroscopy to be used to assess the curing of HTPB formulations in a non-invasive and non-destructive manner. Our results may lay the groundwork for future studies on the aging and degradation of HTPB materials and suggest potential applications for Raman-based monitoring in industrial settings for quality assurance and material-state awareness measurements.
Experimental
Materials and Methods
The HTPB resin was obtained from CRS Chemicals (USA), and IPDI, used as a curing agent, was purchased from TCI (USA) and Aldrich (USA). Dibutyltin dilaurate (DBTDL) was used as a catalyst and 2 2’-methylenebis (6-tert-butyl-4-methylphenol) was used as an antioxidant; both reagents were purchased from Aldrich (USA).
Formulation of HTPB Samples
The HTPB resin (30 mL) was heated in the oven for 10 min at 65 °C before mixing with 3.75 mL of IPDI to make an 8:1 ratio of HTPB to IPDI by volume. The mixture was placed under vacuum for 15 min to remove air bubbles. If antioxidant was used, 0.25 grams of 2 2’-methylenebis (6-tert-butyl-4-methylphenol) was slowly added while stirring until homogeneous, and the mixture was again placed under vacuum for 15 min to remove bubbles. For samples that used catalyst, one drop of DBTDL catalyst was gently mixed in. To help identify the effects of IPDI on the formulated material, other ratios of HTPB:IPDI by volume were made, including 12:1, 10:1, 6:1, and 4:1.
Experimental Setup
For the Raman investigations, uncured mixtures were prepared and poured over a stainless-steel mirror, which was kept in a watch glass. Stainless steel mirrors were used to increase the detection of Raman signal by reflecting more signal towards the detector. Also, metal minimized Raman signal from the substrate compared to what is produced by glass. Raman measurements were performed using a Renishaw InVia Raman Microscope equipped with a 785 nm laser and a 1200 lines/mm grating. A 20×/0.40 NA objective lens was used to focus the laser onto the samples and collect the Raman signal. Spectra were acquired with three accumulations of 20 seconds each at a laser power of 30 mW. Spectral resolution was approximately 1 cm–1. These parameters were chosen to maximize signal intensity without saturating the strongest Raman peaks. Samples were scanned prior to curing, then scanned intermittently during curing; samples were removed from the oven at various time intervals, scanned on the Raman microscope, then replaced in the oven for additional curing. The 4:1 and 8:1 mixtures of HTPB:IPDI were cured at 65 °C for a total of 74 and 354 hours, respectively. HTPB resin with no IPDI was also investigated.
Due to variability in the surface of the HTPB formulation, the Raman signal was not always consistent over the entire surface of the sample. To address this issue, two Raman scans were taken of the flat, reflective parts of the sample surface, and two more were taken of regions with cracks and imperfections. Care was taken when handling the samples to keep the surface as flat as possible, but some rippling did occur, due to handling, as the curing progressed. The time out of the oven was minimized as much as possible.
Raman Spectral Analysis
Raman spectra for this study were collected over several days, introducing the potential for instrument drift between measurements. To mitigate this, internal standards within each spectrum were used as references. The centroid of each peak was found using a Gaussian–Lorentzian function included with the Renishaw software; spectra were baseline-corrected in truncated segments for the most reproducible signal, and both the height and Raman shift for each peak were extracted. Peak deconvolution was not used because spectral noise became more prominent with curing of the samples. Similarly, peak integration was not used as it does not provide Raman shift information, and the extra analysis seemed unnecessary.
The tallest Raman peak in the range of interest was selected as a reference to simplify ratio calculations and for its association with molecular vibrations corresponding to the HTPB backbone, which seemed to remain relatively unaffected during the curing process. Peak heights were normalized to this reference, hereafter termed a signal ratio, as depicted in Figure 1. Relative Raman shifts were determined by calculating the difference in position between the reference and target peaks, as also shown in Figure 1.
Example Raman spectrum showing determination of a signal ratio and relative shift. The signal ratio is the height for a peak of interest (left) divided by the height of a reference peak (right), each measured relative to their own baseline. The relative shift is the difference in position between the two peaks, which can be used to calibrate the position of the weaker peak.
Error bars for the curing process are reported as a standard deviation. Because measurements were taken during the curing process, it was important to minimize the time the samples were out of the oven. For this reason, not enough replicate scans were collected for a full 95% confidence test.
Computational Modeling of HTPB Vibrational Modes
Vibrational modes of HTPB with and without bound IPDI were modeled using density functional theory (DFT) calculations at a 6-31G* B3LYP level of theory. Computations were performed using the NWChem package. 37 Isolated chains of HTPB with one, two, or three (n = 1, 2, 3) monomers were modeled. Calculations were also performed on isolated cis and trans IPDI and eight total stereoisomers of IPDI bound to HTPB dimers. When bound, a single HTPB chain was modeled at each of the cyanate groups. Vibrational mode calculations were used to assign the most likely molecular vibration to each Raman peak in the measured HTPB-IPDI spectra.
Results and Discussion
Identification of Significant Raman Features Indicative of Curing
Figure 2 shows Raman spectra for neat HTPB resin and HTPB cured with IPDI. A comparison of the spectra shows two small but noticeable peaks that form with curing at 777 and 1152 cm–1, with the first being the most prominent. The 777 cm–1 peak appears to be related to the 762 cm–1 vibration observed in Raman spectra of unreacted IPDI. 38
(a) Raman spectra for HTPB resin with and without IPDI. The Raman traces were offset on the intensity axis for comparison. Two apparent changes in the spectra were the formation of peaks at 777 and 1152 cm–1, indicated with red dotted lines. (b) Expanded region of the spectrum to better see the peaks that exhibit changes upon curing.
To discern the effect of IPDI on cured HTPB, the 777 cm–1 peak was monitored for four different concentrations of IPDI in the HTPB formulation; the ratios by volume of HTPB:IPDI were 4:1, 6:1, 10:1, and 12:1. Spectra of formulated HTPB at these ratios for HTPB:IPDI are shown in Figure 3. The growth of the peak at 777 cm–1 with the relative amount of IPDI indicates that the peak height directly relates to the concentration of IPDI. This connection matched physical observations for the samples; samples were firmer with higher concentrations of IPDI and more viscous with less IPDI.
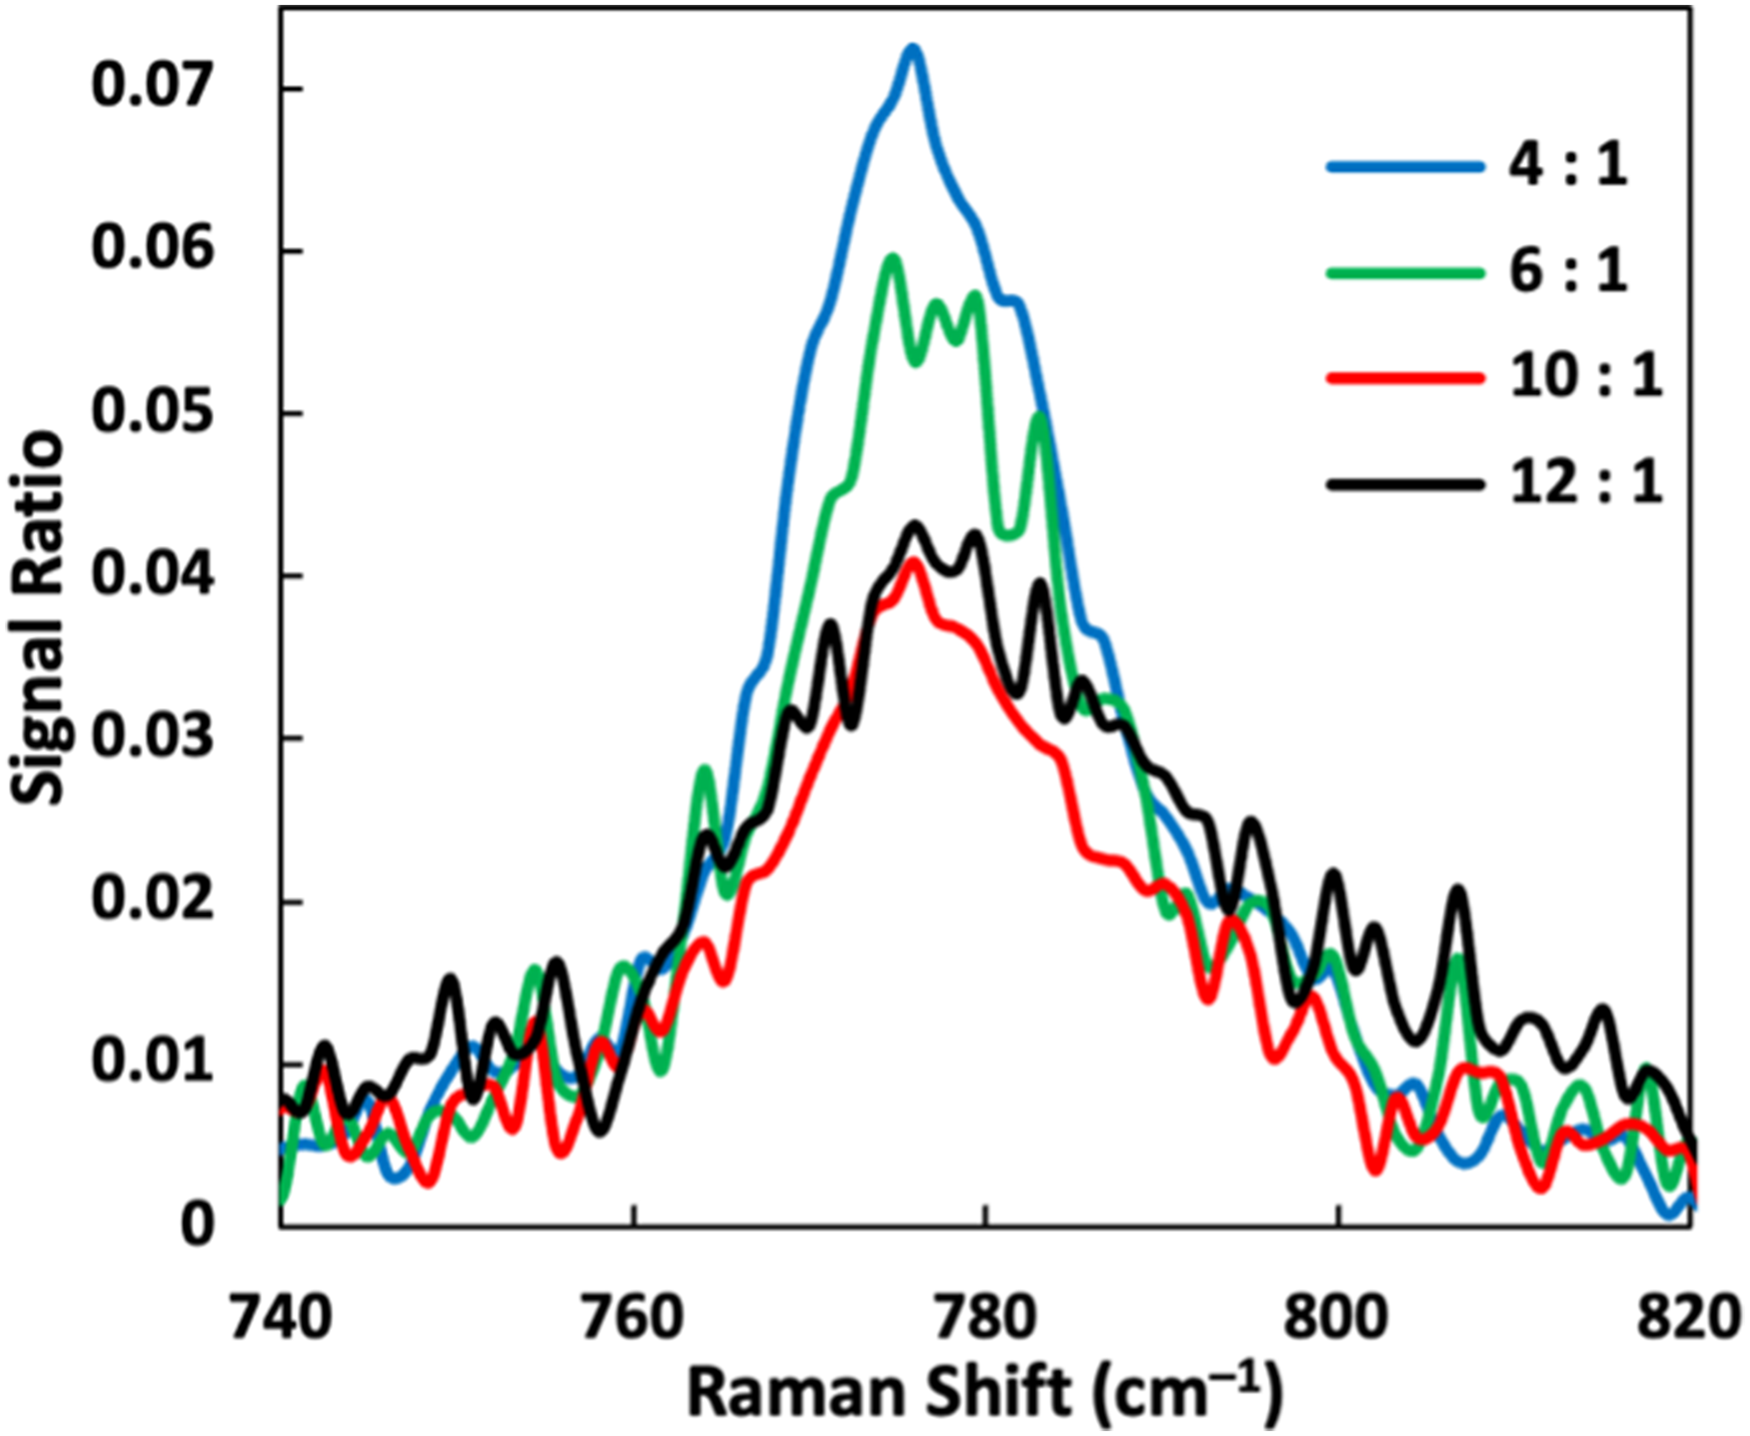
Raman traces of the peak at 777 cm–1 for different concentration ratios by volume of HTPB:IPDI. The signal for 10:1 and 12:1 was similar due to <1 mL difference in IPDI that made formulation difficult.
The samples shown in Figure 3 contained a catalyst to promote curing. Without a catalyst, HTPB could take weeks to cure, especially those with a low IPDI ratio, like the 10:1 and 12:1 formulation. Antioxidant was added to the formulations to prevent oxidation during the curing process. Both the catalyst and the antioxidant were necessary but, unfortunately, added significant background signal to the spectra, which caused some HTPB peaks to be less defined. Despite the background interference, Figure 3 shows a correlation between peak height and IPDI concentration for the peak at 777 cm–1. However, there was no indication whether IPDI was bound or unbound to HTPB. For this reason, further investigations were conducted to determine if the formation of urethane linkages between HTPB and IPDI could be observed.
It is standard practice to include a catalyst in HTPB formulations, but to monitor the curing process the catalyst was left out to slow the rate of curing and eliminate any secondary processes, such as unforeseen catalytic reactions and changes in kinetics. 39 For this curing study, two sets of samples were prepared with different ratios by volume of HTPB:IPDI. Samples 1 and 2 were prepared with a 4:1 and 8:1 ratio of HTPB to IPDI, respectively. These two ratios were chosen to provide a reasonable time frame for the HTPB to cure while the curing process was monitored with Raman spectroscopy.
Figure 4 shows spectra of Sample 1, prepared with a 4:1 ratio of HTPB:IPDI, taken at various points in the curing process. The spectrum of HTPB resin, prior to the addition of IPDI, shows a broad feature around 750 cm–1. Upon addition of IPDI, but before curing can begin, a sharp Raman peak appeared for IPDI at 762 cm–1. 38 Once curing began, a new peak appeared at about 775 cm–1, which shifted over the course of the curing process to the 777 cm–1 position, that of fully cured HTPB. The behavior of this feature suggests that it can be used to monitor the formation of HTPB–IPDI linkages as the material cures and also as the basis for material-state-awareness (MSA) measurements.
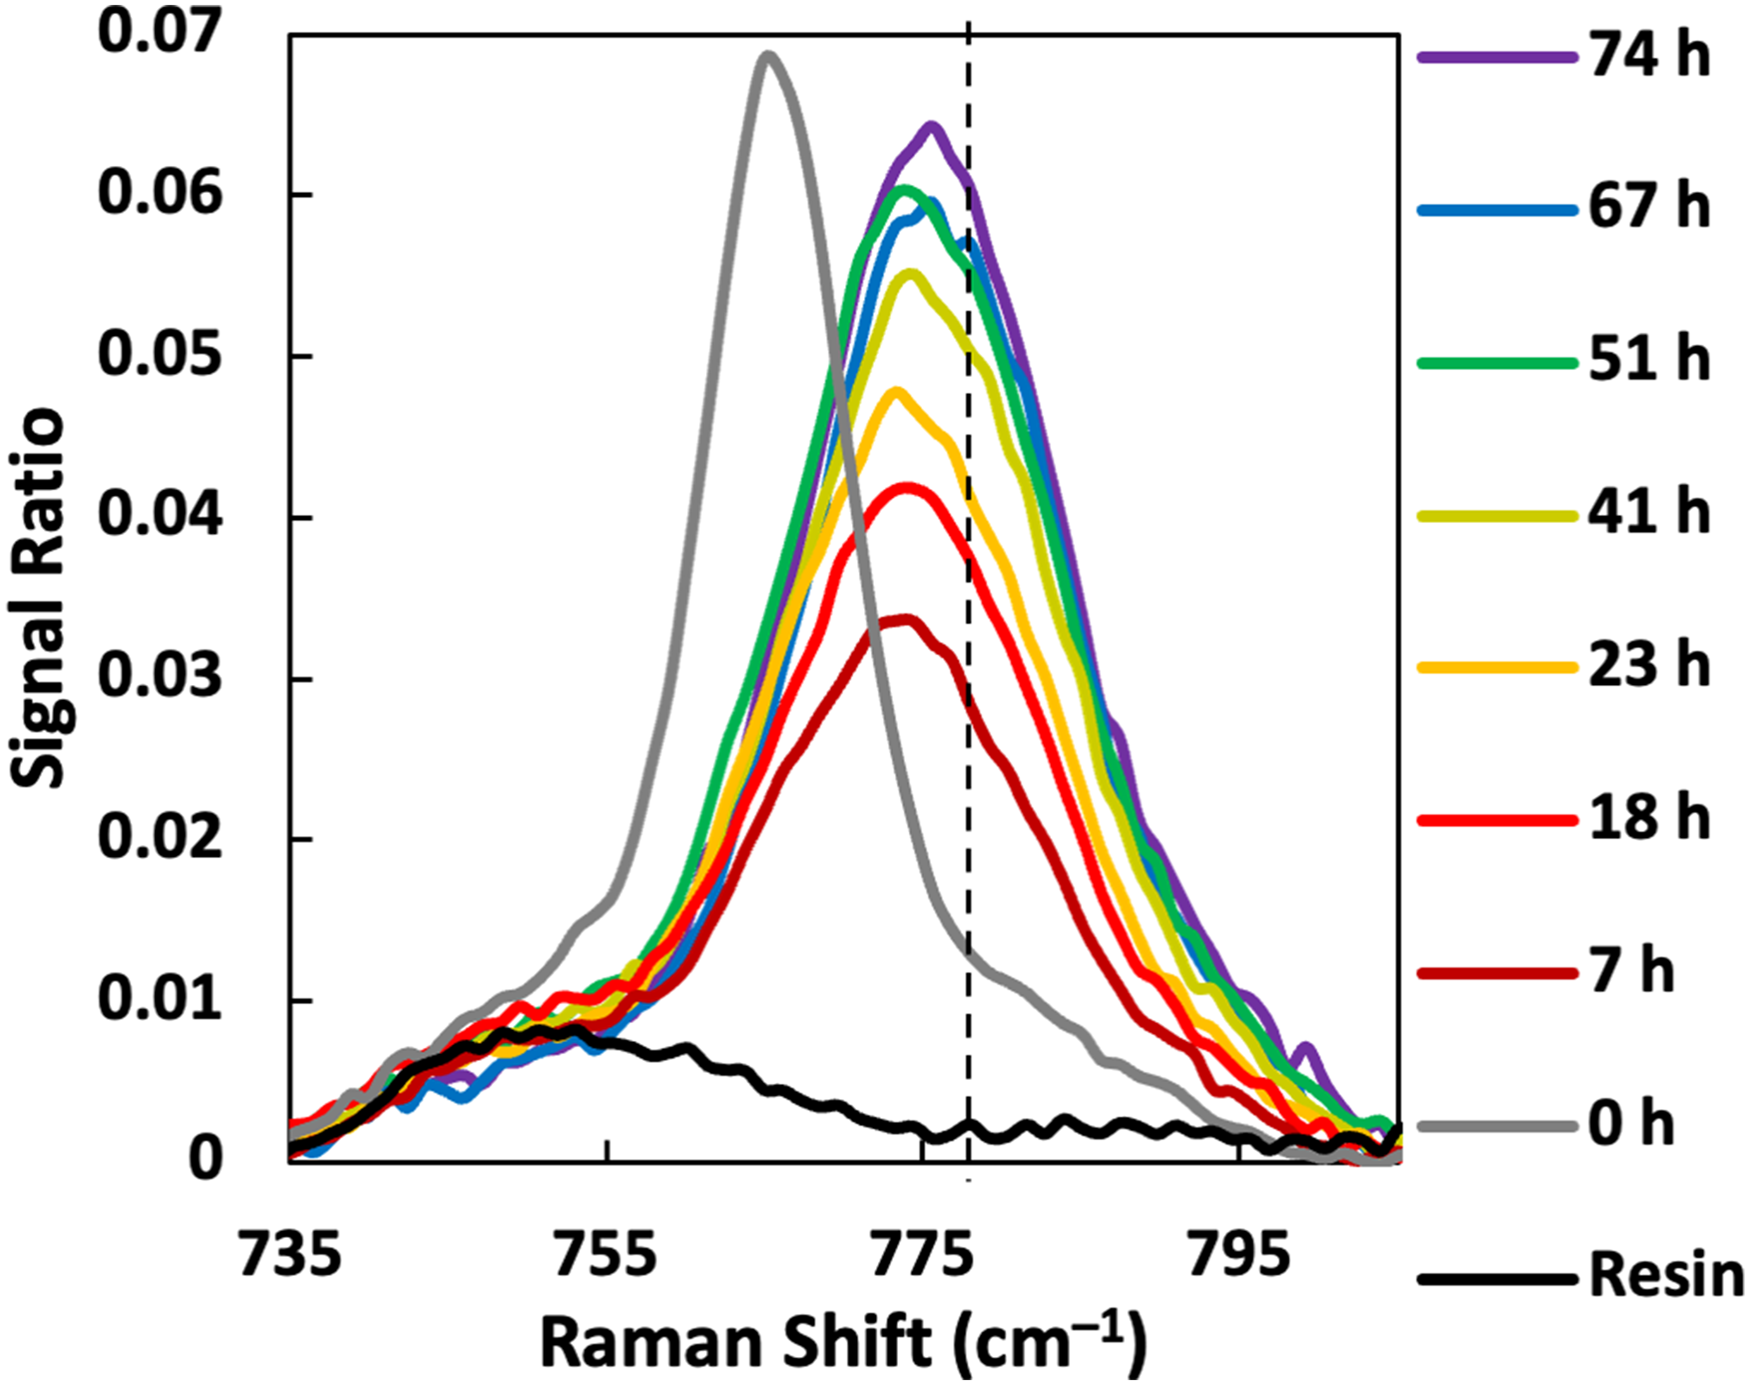
Progression of the Raman feature between 750 and 777 cm–1 for HTPB resin and Sample 1 (4:1 HTPB:IPDI formulation) during the first 74 hours of curing for Sample 1. The dotted vertical line at 777 cm–1 represents the center of the Raman peak for fully cured HTPB.
Characterization of HTPB Curing Process
After 74 h of curing time, Sample 1 could not be investigated further because small agitations from moving the sample between measurements had caused ripples to form in the unset elastomer. These ripples changed the shape of the material and led to poor reproducibility of the Raman signal. Sample 2 was prepared with an 8:1 ratio by volume of HTPB:IPDI to monitor the later stages of the curing process. Monitoring of Sample 2 began at 69 h of curing, which allowed the elastomer time to set, and finished at 354 h, after it was fully cured. As shown in Figure 5a, the two data sets have a large difference in peak height due to the different IPDI concentrations. The extra IPDI in Sample 1 made peaks associated with IPDI more prominent with better signal-to-noise than in Sample 2.
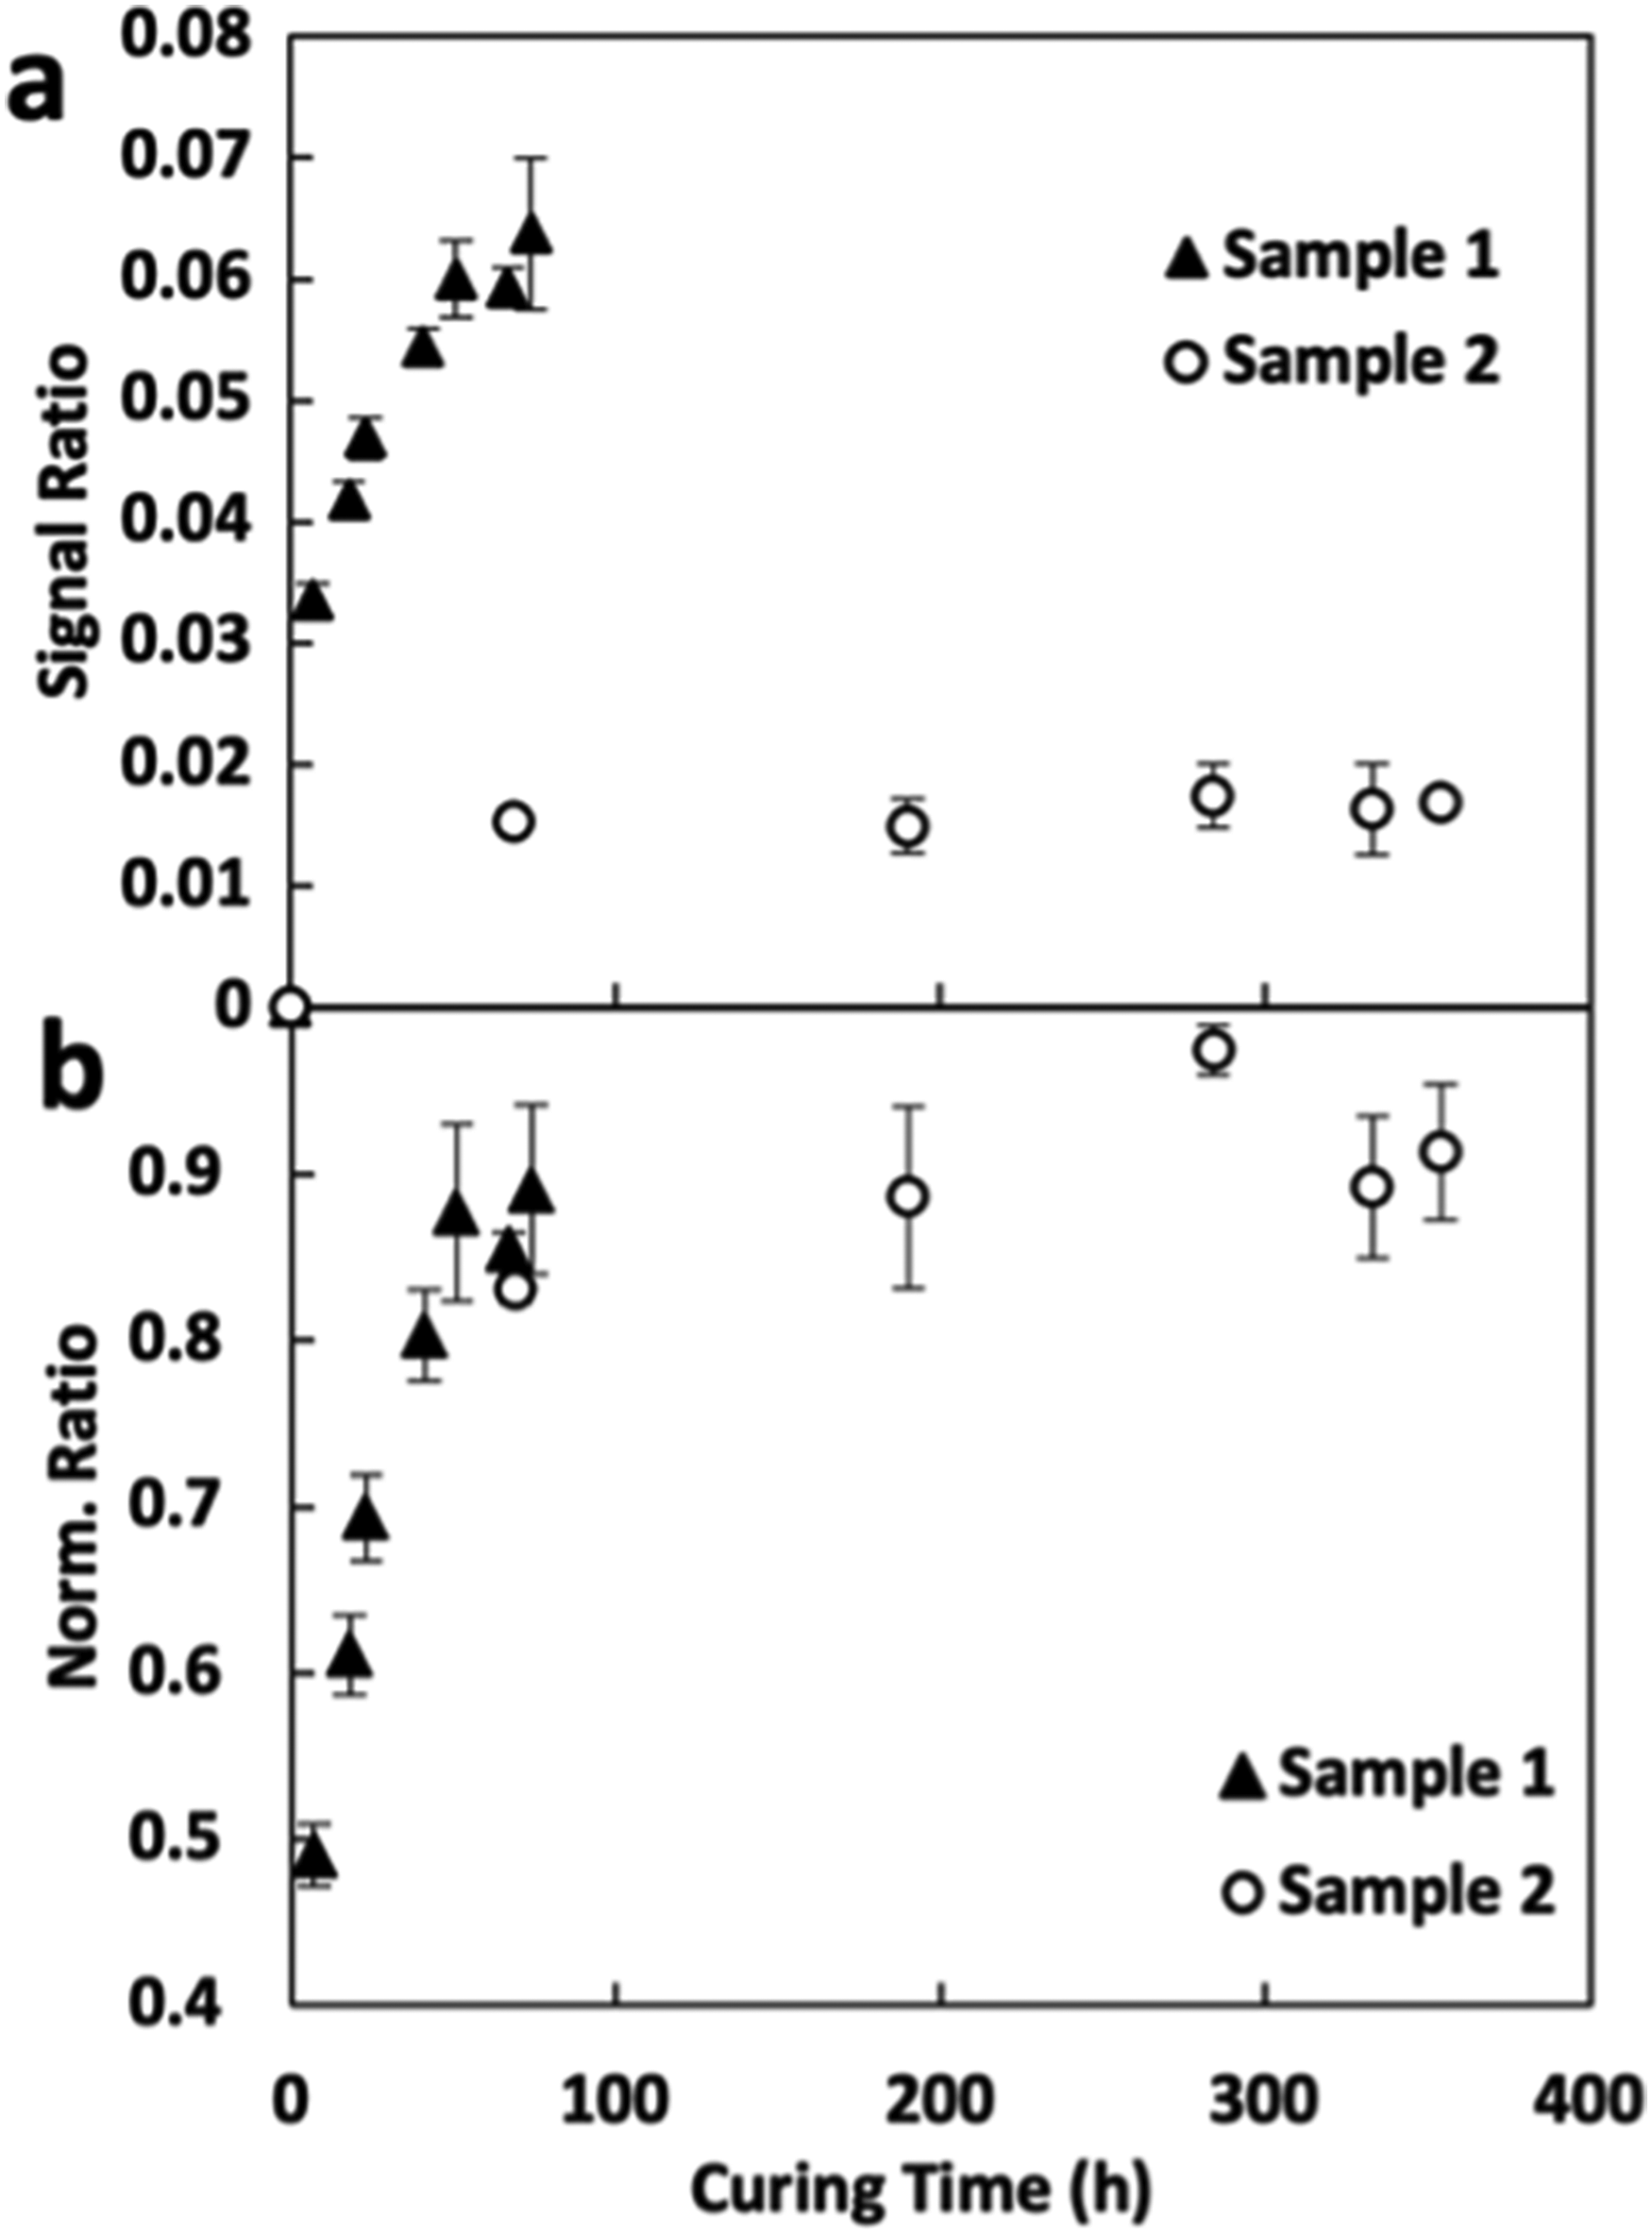
(a) Signal ratio of peaks at 777 cm–1 to 1668 cm–1 for Sample 1 and Sample 2 as a function of curing time. (b) Normalized results from Sample 1 and Sample 2.
To allow for better comparison of the data for Samples 1 and 2, the height of the peak at each time point was normalized to the signal at time zero. The time-zero reference was the peak that formed at 762 cm–1 when IPDI was first added; the signal ratios of this peak were 0.069 and 0.018 for Samples 1 and 2, respectively. The signals at time zero were not included in the graphs for the sake of clarity. Figure 5b shows the normalized results and indicates that the relative intensity of the 777 cm–1 peak is a good indicator of the extent of cure.
Figure 6 makes similar comparisons for the position of the Raman peak that indicates the curing of HTPB-IPDI. As shown in Figure 4, this peak begins at ∼762 cm–1 and shifts to 777 cm–1 for the fully cured material. The absolute position of this peak for Sample 1 and Sample 2 is plotted as a function of curing time in Figure 6a. To account for the variation between the samples, the relative position of the peak was determined by referencing the dominant peak at 1668 cm–1, the same feature used to reference peak height. Figure 6b shows how this relative position changes with curing time.
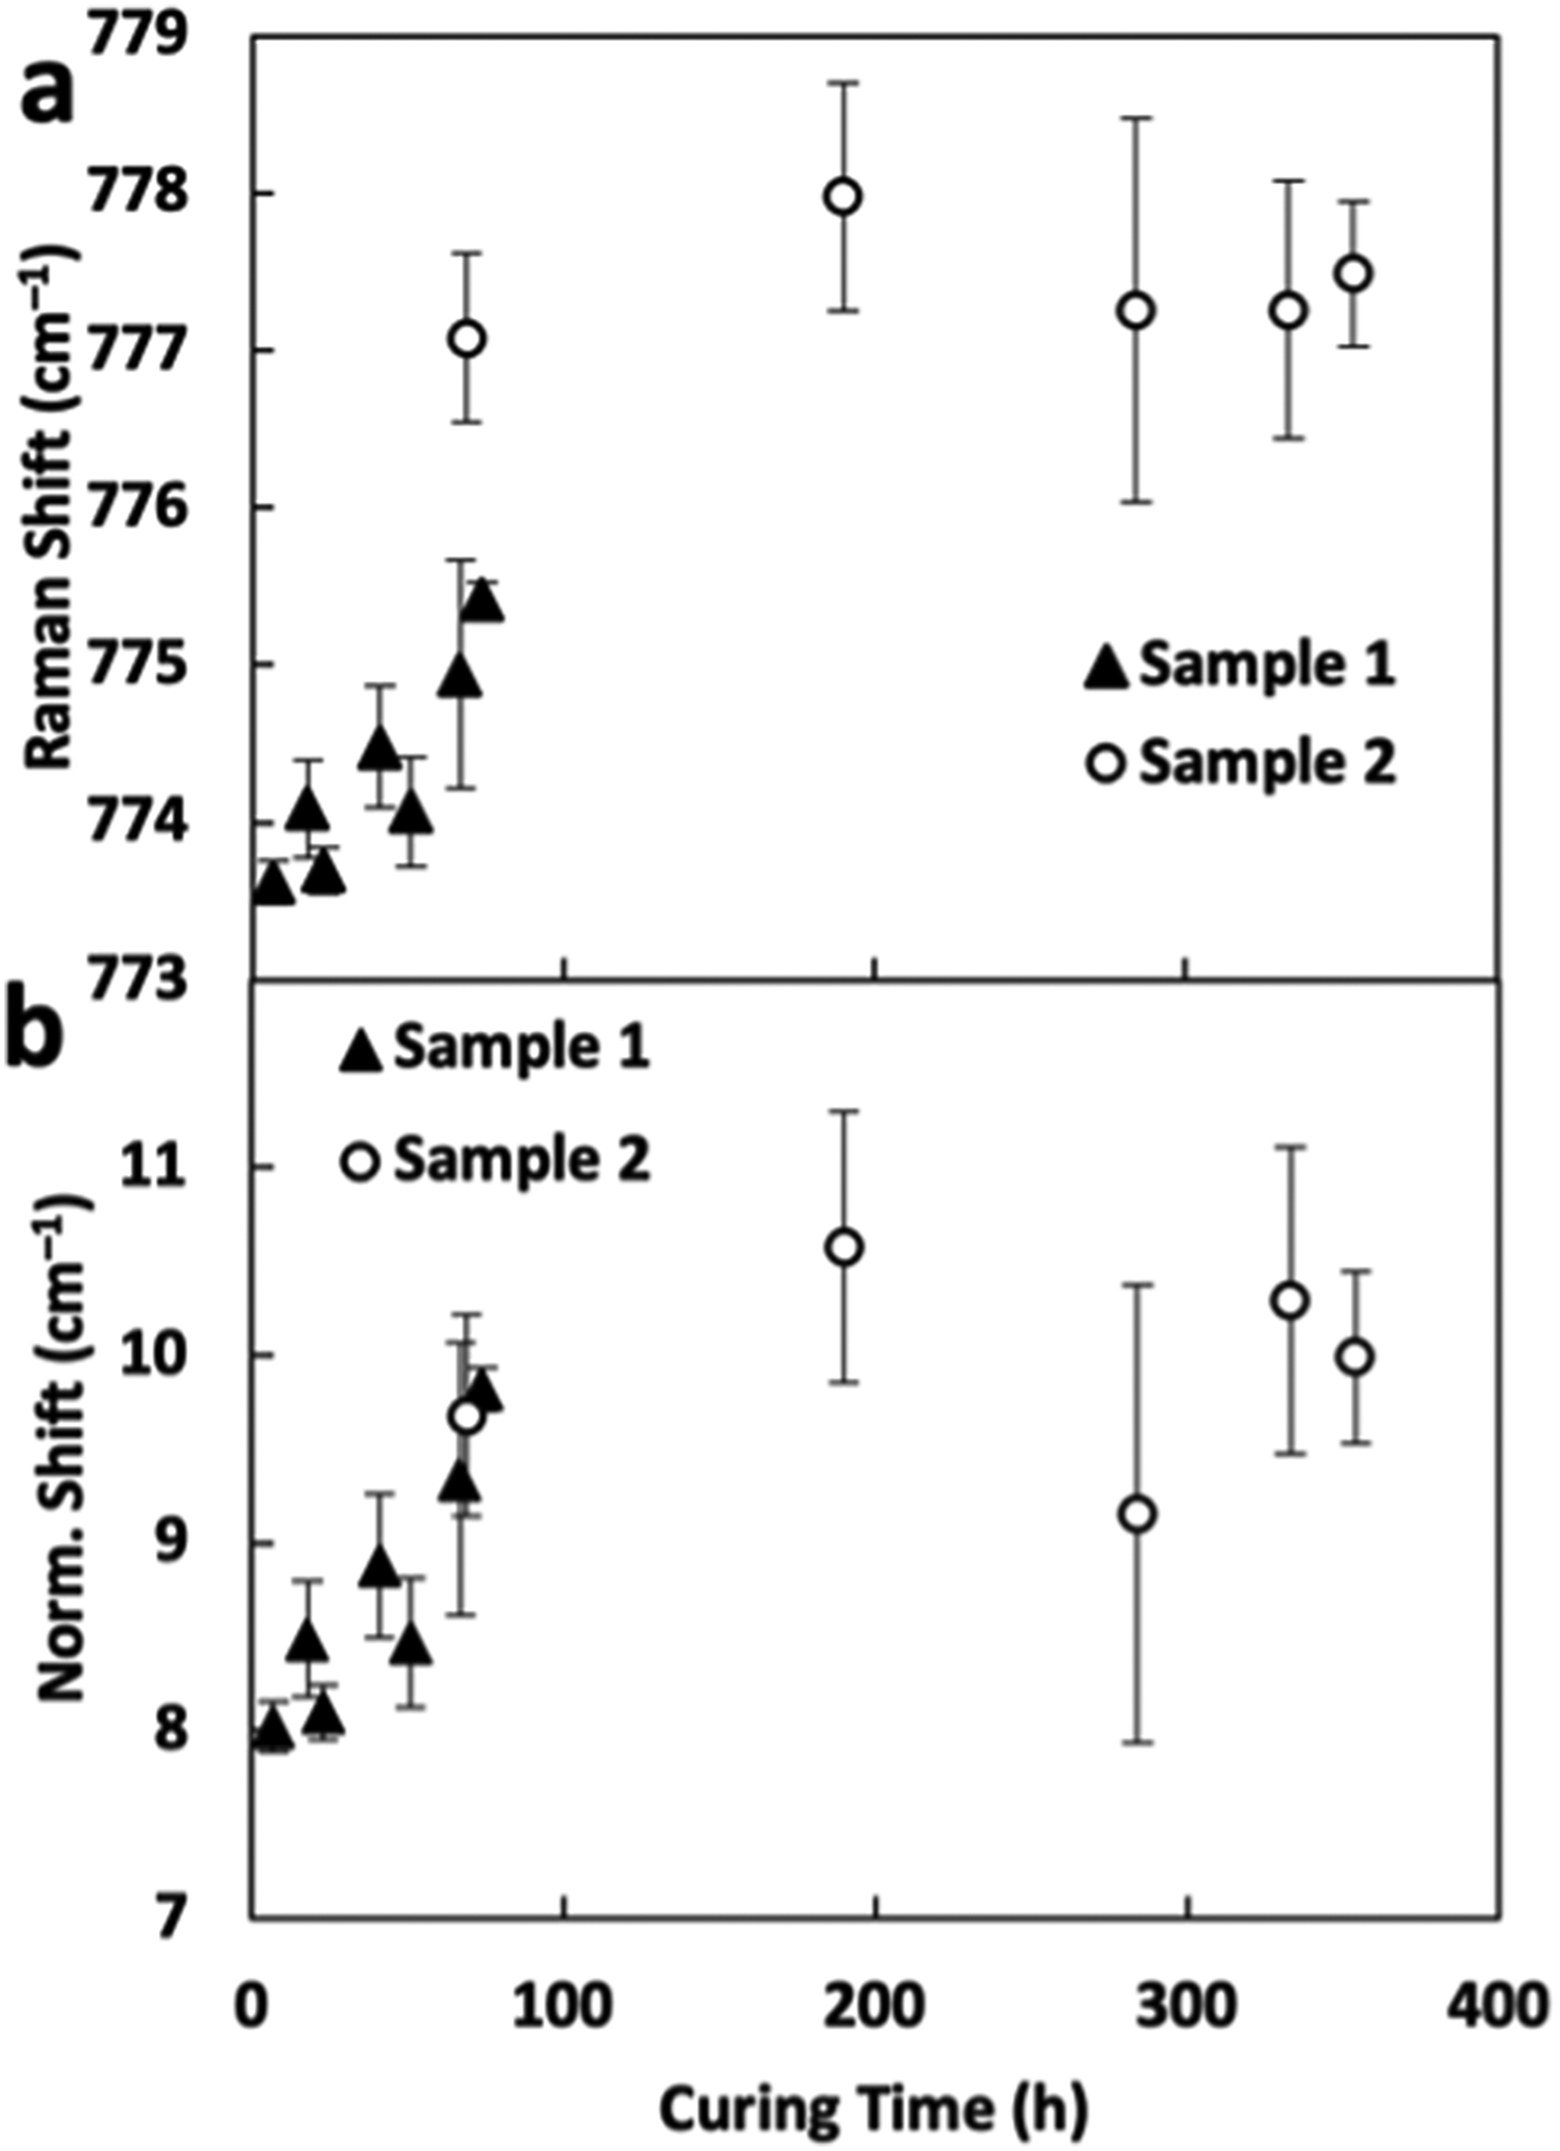
Position of the Raman peak indicative of curing, 777 cm–1 when fully cured, shown as (a) absolute position and (b) normalized (relative) position as referenced to the backbone (1668 cm–1) peak. See Figure 1 for the depiction of relative shift.
Measurement of the initial 762 cm–1 peak must be done carefully because the curing reaction starts immediately after mixing. Taking the Raman measurement almost immediately after mixing ensures that the signal is directly proportional to IPDI concentration. The normalized data fall within the error of each other as the elastomer sets and enters the final curing process, as seen at 69 h in both Figure 5 and Figure 6. The results of Figures 5 and 6 show that Raman spectroscopy may be used to differentiate batch formulations and to monitor the curing process. Both the intensity of the 777 cm–1 peak and its position can be used for this purpose. These results illustrate how Raman spectroscopy may be used for quality assurance, potentially providing another tool as a complement or alternative for the standard methods of titration and nuclear magnetic resonance. 4
Extended Spectral Analysis for the HTPB Curing Process
The trends seen for the peak at 777 cm–1 were not the only changes in the Raman spectrum for HTPB. The Raman spectrum of Sample 1 had 16 distinctive peaks between 400–3200 cm–1, 12 of which are indicated in Figure 7. Figure 8 shows the comparative growth of the 1152 cm–1 peak with that of the peak at 1083 cm–1, which had the greatest decrease in signal. The height of 1083 cm–1 peak decreased inversely to the peaks at 777 and 1152 cm–1.
Raman spectra of Sample 1 with 12 of the 16 most prominent peaks labeled. The other four peaks were found between 2800–3400 cm–1. Colored highlights correlate the vibrational modes of the HTPB-IPDI formulation to their respective Raman peaks as determined by DFT modeling and summarized in Table I.
Curing trends of height ratios for the peaks at 1083 and 1152 cm–1 to the peak at 1668 cm–1 over the first 72 hours of curing for Sample 1.
Curing influenced all observed peaks to some degree, either from the additive signal of IPDI and the HTPB resin, or perturbation of vibrational modes from the formation of urethane linkages. Effects of curing were assessed by calculating the total change in peak height. This was done by measuring the peak height after 72 h of curing and subtracting the peak height found in the resin spectrum before adding IPDI. These changes were listed in Table I as a percent change in height. Table I was sorted from the highest to lowest change in signal, starting with the 777 cm–1 peak that grew 6%. Colored highlights correlate each peak (Figure 7 and Table I) to molecular vibrations in the depicted HTPB molecule included in Table I. These vibration assignments were determined through computational modeling, as discussed in the next section.
Total change in height for each peak during curing. All peaks were normalized as a percentage of the 1668 cm–1 peak before subtracting the HTPB resin signal from that of the fully cured elastomer. Color coordination associates Raman peaks to molecular vibrations in the depicted HTPB-IPDI molecule
Computational Modeling of Cured HTPB
Ab initio calculations were used to understand the molecular structures that led to changes in the Raman spectra, as detailed in Table I. The 777 cm–1 peak was connected to stretching modes of the IPDI ring and an out-of-plane bend of the NCO carbon (red) of the urethane linkage. Results from modeling seemed to indicate that ring modes were the main contributors to the 777 cm–1 Raman signal, but strong vibrations for the 470, 1207, 1152, and 1083 cm–1 peaks were also localized on the IPDI ring and its methyl groups. Other than the feature at 470 cm–1; however, these peaks did not change very much during the curing process. If the main source of peak growth for the 777 cm–1 peak was from the IPDI ring, the changes associated with these other peaks would likely have been more significant. Thus, we associate the 777 cm–1 peak primarily with the urethane linkage.
The 777 cm–1 peak grew 100 times more than the 1439 cm–1 peak, which had the second largest change. According to the modeling, the peak at 1439 cm–1 also had connections to the IPDI ring, but the strongest link was to hydrogen motion on the terminal oxygen (pink) and first carbon of the butadiene chain (green). By forming a urethane linkage, the terminal oxygen of HTPB loses a hydrogen, which would presumably lead to a decrease of the peak at 1439 cm–1. However, formation of the urethane linkage will also perturb the vibrational mode associated with the neighboring atoms, which we find to be the reason for the increase in intensity of the 1439 cm–1 with formation of the linkage.
Working down the list in Table I, a smaller magnitude of peak growth seems to correlate with the distance of the vibration from the center of the urethane linkage. The farther away from the linkage, the less impact on peak height. The 1439 cm–1 peak was associated with motion close to the urethane linkage, whereas the peak at 1643 cm–1 was associated with significant motion on the first butadiene group (gold) next to the linkage. Two additional modes were associated with the hydrogen atoms connected to the butadiene, with peaks at 2912 (green) and 1303 (dark green) cm–1. On the other side of the urethane linkage were hydrogen modes connected with the 470 and 1207 cm–1 peaks (blue), and a C–N stretch for the 1152 cm–1 peak (purple). Most of the remaining peaks showed much smaller changes, and calculations showed that these modes were associated with atoms further away from the urethane linkage. The increase in peak growth for peaks associated with atoms closer to the urethane linkage is a strong indication that changes in the Raman response were due to the formation of urethane linkages.
The one exception is the 1083 cm–1 peak (gray). This seemed to be an O–C stretch next to the urethane linkage, but the peak did not grow enough for this position. Another atom associated with this peak was the hydrogen on the IPDI arm. The pattern followed the decrease in signal according to distance from the urethane linkage, however, the change in peak height was negative. The 1083 cm–1 peak was one of two peaks that decreased with curing, the other being at 1013 cm–1. One similarity between these two features was that both had vibrations on the butadiene chain, close to the carbon double-bond vibration of the 1668 cm–1 reference peak. It is likely that the 1668 cm–1 peak grew some during curing, maybe from coupling with the 1643 cm–1 mode. If the 1668 cm–1 peak growth was greater than the 1083 and 1013 cm–1 peaks, this would be perceived as a negative change in those two peaks after normalization to the 1668 cm–1 peak.
Future Work for Better Understanding HTPB Curing
The primary purpose of this work was to identify spectral signatures that could be used to monitor the curing process of HTPB-IPDI formulations. Additional work could be done to monitor the early-stage kinetics more closely, particularly by varying the curing temperature. Such an investigation should allow for determination of activation energies for the formation of the initial linkages during the first stage of curing. The 762 and 777 cm–1 features would need to be closely monitored with as high a spectral resolution and signal to noise ratio as possible for such an investigation. An external probe that would allow the samples to remain in the oven during the entire process would also be desirable.
The HTPB elastomer is formed by linking chains of resin to both cyanate arms of IPDI, but the IPDI arms are not symmetric, as seen in Figure 9. One arm is connected directly to the IPDI ring and the other connects to the ring via a methylene group. This asymmetry may be one way to differentiate the binding state of the cyanate arms. If a Raman signal can be found that is specific to one cyanate arm of IPDI, the binding state may be deduced as a ratio of this signal with the signal of the 777 or 1439 cm–1 peak.
Asymmetry of the IPDI molecule.
Additional modeling and better spectral resolution would be needed for such an analysis. The modeling in the previous section was done with only one cyanate arm bound. Since both arms of IPDI must be bound to form the elastomer, future research should include modeling for large oligomers of HTPB bound on both ends with IPDI, and this should be compared with singly bound and unbound IPDI. Butadiene chains should be at least five monomers long to create distinct regions of interest at the center, and both ends of the chain, although longer chains may be necessary since HTPB chains often exist in longer units, such as the resin used for this report (∼45 monomers).
Spectral clarity for future Raman measurements may be improved by increasing the signal-to-noise ratio of the smaller peaks. This may result in saturation of the 1668 cm–1 feature we used as a reference peak but would give greater detail for smaller peaks and potentially bring new peaks within the limit of detection. On close inspection, many tiny peaks were found throughout the HTPB spectrum that could also be useful for additional study. One such peak was at 3304 cm–1 and was included in Table I. The peak was ∼0.5% the height of the peak at 1668 cm–1, an order of magnitude less than the peak at 777 cm–1. Modeling showed that an OH peak may appear above 3000 cm–1, but the peak at 3304 cm–1 was likely not such an OH-related feature because it had 0.00081% growth. Changes in the signal from –OH groups should be more significant, and probably result in a decrease, because the hydroxyl group is altered during the formation of urethane linkages.
No other peaks were found in this spectral region, but some may exist at a higher frequency closer to 4000 cm–1. 40 If found, a ratio of this signal with a signal connected to urethanes linkage, like the 777 or 1439 cm–1 peaks, may show the volume of OH peaks decreasing as the urethane linkages increase. If observed, an –OH peak may be useful in understanding the early aging of the HTPB elastomer to monitor the formation of hydroxyl groups and hydroxyl saturation for long term aging. 41
Conclusion
Formulated HTPB has been used in a variety of applications because of its physical resistance to harsh treatment and its utility as a solid-state polyurethane fuel. Development of specific formulations has often been done through trial and error rather than by rational design of the formulations. In this work, Raman spectroscopy was used to monitor the curing process of HTPB with IPDI to characterize the curing mechanism. Computational modeling was used to confirm that the patterns seen in Raman measurements were a direct consequence of the formation of urethane linkages. Specifically, the disappearance of the 762 cm–1 peak with the gradual shift and changes in amplitude for the 777 cm–1 peak showed the progression of curing. This simple, non-destructive process may be applied to state-of-the-material measurements, as well as quality assurance. This approach worked well for the two formulations presented here, and it is hoped that this or another spectral feature will be indicative of curing in other formulations as well, although additional work will be required to verify that premise.
Footnotes
Declaration of Conflicting Interests
The author(s) declared no potential conflicts of interest with respect to the research, authorship, and/or publication of this article.
Funding
The author(s) disclosed receipt of the following financial support for the research, authorship, and/or publication of this article: This work was supported in part by funding from the Naval Engineering Education Consortium, through Naval Surface Warfare Center Indian Head. Grant number N00174-19-1-0021.