
Abstract
Poly(3-hydrxybutyrate-co-3-hydroxyhexanoate) (PHBHx) is a biopolymer that is produced and degraded by microbes. Because of the potential to replace polymers derived from petrochemicals with these materials, there is a high level of expectation for its commercial uses if its physical and chemical properties can be understood and controlled. Among other things these properties are determined by the polymer’s morphology – that is its crystallinity, and orientation of both crystalline and amorphous phases. The focus on the Raman characteristics of the crystalline phase enables elucidation of the characteristics of the polymer experiencing dynamic crystallization under various conditions. In this article we will start by reviewing the changes in the Raman spectrum from an amorphous to a crystalline material in an isothermal crystallization study. In that study a correlation field splitting between a CH stretching band that interacts with the carbonyl group on the opposite chain in the unit cell was identified. Then we will show the polarized Raman spectra of single crystals which enable an explanation of the residual amorphous material seen in the spectra of single crystals. Using the information from the single crystal measurements we can then study the Raman behavior of spherulites and confirm the model that proposes an explanation for the appearance of rings in the polarized light microscope (PLM) images of some spherulites. The polarized Raman studies confirm that the crystal ribbons that grow along the radii are twisting about the growth direction. The two-dimensional correlation spectroscopy (2D-COS) analysis of the polarized spectra of spherulites suggest the presence of strain that has been proposed to induce the twisting.
This is a visual representation of the abstract.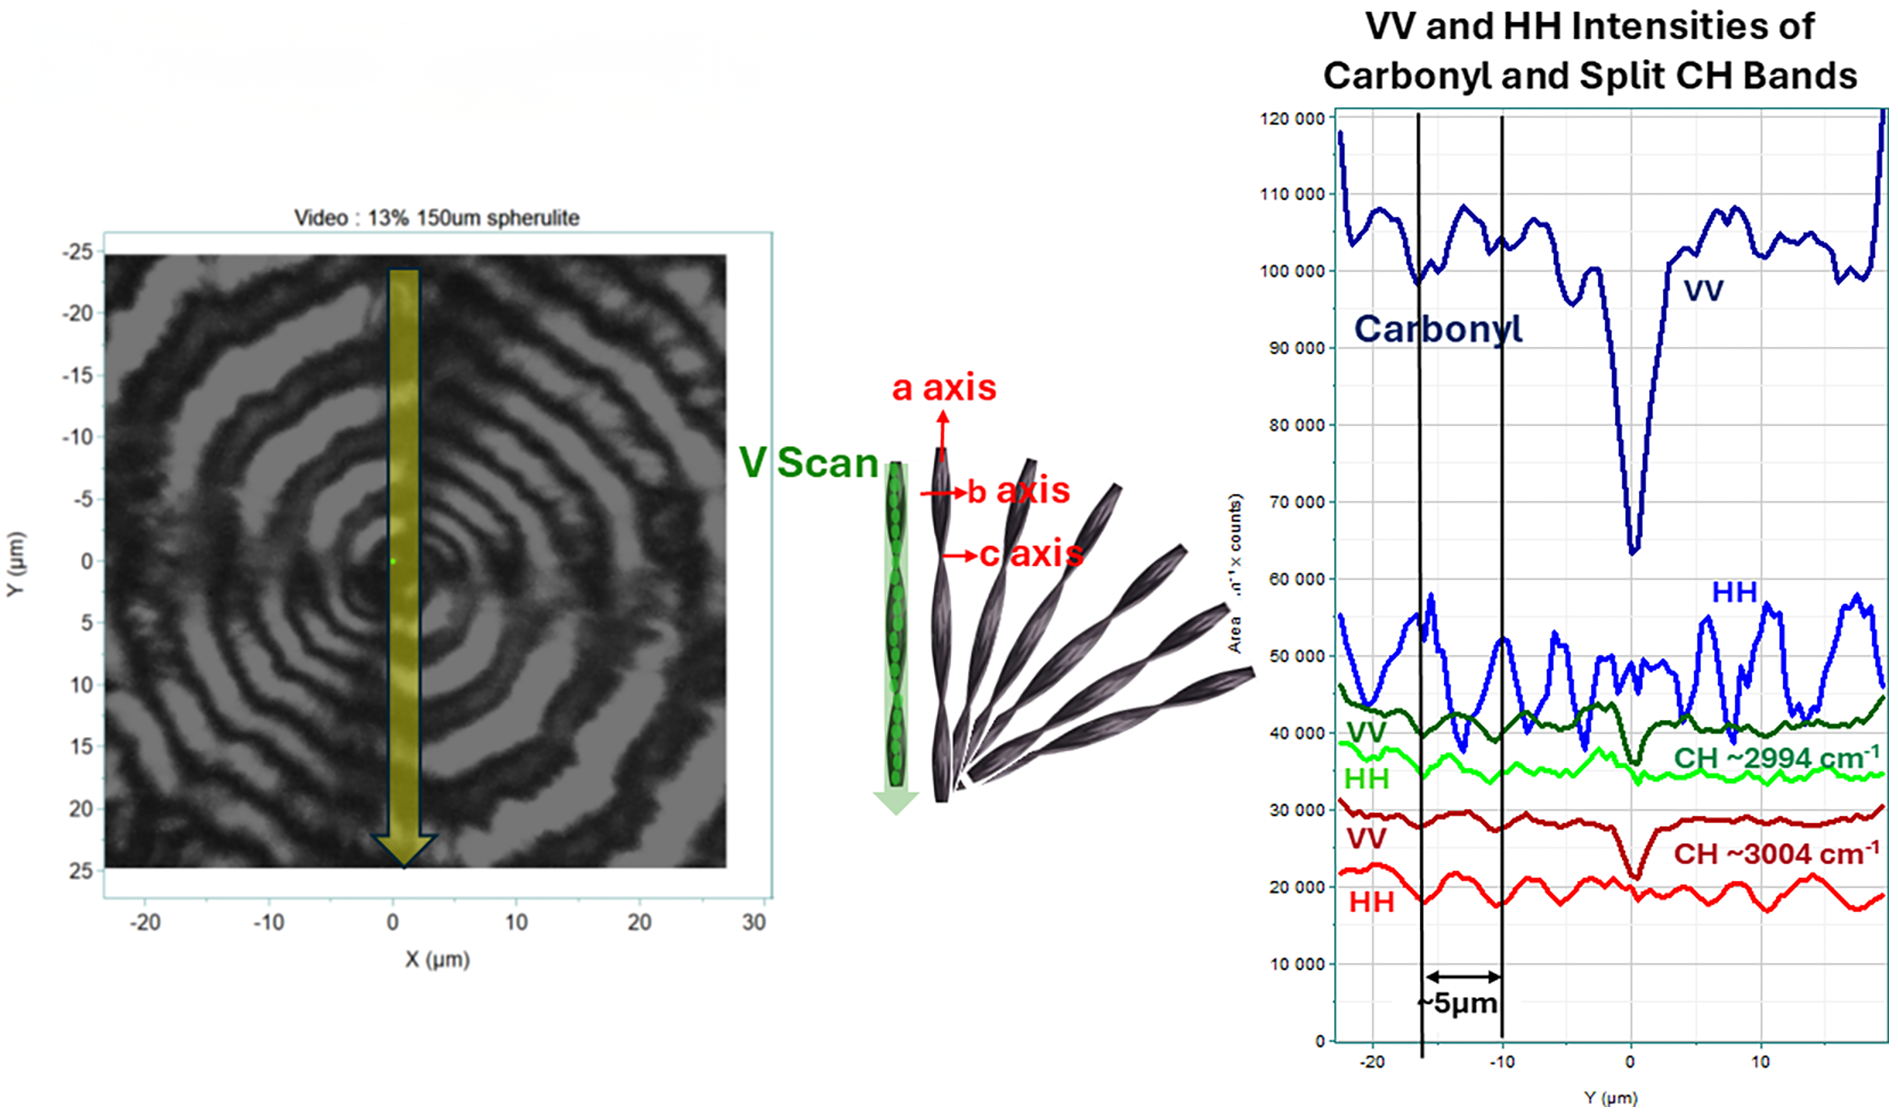
Introduction
Polymer engineers have been experimenting how to control polymer properties for more than 50 years. Polymers undergo dynamic crystallization which can depend on extrusion conditions, temperature, cooling rate, applied stress, etc. Examples of polymer morphology and their accompanying properties include fibers that are strong in one direction, materials with large spherulitic crystals that will be brittle, and materials with crystals that are small (smaller than visible wavelengths) that will be transparent. When nucleating agents are added to produce a final material that is transparent, it is known that that additive is a super nucleating agent.
Poly(3-hydroxybutyrate-co-3-hydroxyhexanoate) (PHBHx) is a bio-based co-polymer; 1 the samples used here were synthesized by fermentation of palm kernel oil by the bacterium Aeromonas caviae in the laboratory of the Procter & Gamble Company. The weight averaged molecular weight (Mw) determined by gas phase chromatography (GPC) was 792 000. Since the material was a product of biosynthesis, the optical purity was 100% [R], with no [S] enantiomer content.
Because of the potential to replace polymers derived from petrochemicals with these materials, there is a high level of expectation for its commercial uses if its physical and chemical properties can be understood and controlled. Among other things these properties are determined by the polymer’s morphology, i.e., its crystallinity and orientation of both crystalline and amorphous phases. We will discuss the results of an isothermal crystallization, show polarized Raman measurements of single crystals, and then polarized Raman measurements of spherulites.
When measuring the spherulites, the goal is not to determine the orientation quantitatively, (which is difficult because it requires the spectrum of an isotropic sample with the same degree of crystallinity as the measured sample which is essentially unattainable), but to determine the trends. Note that there are other physical methods to measure crystallinity and orientation in polymers. X-ray diffraction (XRD) is quite well known for measuring crystallinity and orientation. But XRD will only detect the crystalline phase, and microscopic resolution is limited. Spectroscopic methods are an alternative which enable detecting both the crystalline and amorphous phases. The polarized Raman studies will confirm that the crystal ribbons that grow along the radii are twisting about the growth direction. Two-dimensional correlation (2D-COS) analysis of the polarized spectra of spherulites suggest the presence of strain that has been proposed to induce the twisting.2–5
Experimental
Materials and Methods
The materials came from the Department of Materials Science and Engineering at the University of Delaware, and is material that had originally been donated by the Procter & Gamble Company. Similar material is currently manufactured by Danimer Scientific LLC. Methods to grow and characterize single crystals 6 were reported in 2018.
All measurements were done by exciting the spectra with the 532 nm line of a frequency-doubled neodymium-doped yttrium aluminum garnet (Nd:YAG) laser. For the isothermal crystallization study, a small piece of a thin film of PHBHx with 3-hydroxyhexanoate content of 13.9% was mounted on a stainless steel microscope slide, melted on a hotplate and then quenched in liquid nitrogen. The isothermal crystallization measurements of the film were performed at room temperature, which is just above the glass transition temperature Tg, on the LabRAM Evolution (Horiba) with an 1800 g/mm grating that was scanned to acquire full spectra from 50 to 3200 cm–1 over a period of close to 12 hours.
The 2D-COS analysis was performed separately on three temporal regions defined by the changes seen in the intensities of the phonon, the carbonyl and the methyl CH that is interacting with the carbonyl. In preparation for 2D-COS analysis the baselines were flattened and then the spectra were normalized to unit vector in LabSpec (Horiba) in order to compensate for any change in focus or sample thickness during the measurement. Three temporal regions were then stored separately and prepared for analysis in 2D Shige, software that is available on the web. 6 In LabSpec the spectra were stored in TXT format, then imported into Excel, transposed, and stored in CSV format for importation into 2D Shige.
Polarization measurements of the spherulites and single crystals were done using the LabRAM XploRA (Horiba, Ltd.) and the Evolution. Normally the laser is polarized vertically. For horizontal polarization of the laser excitation, a polarization rotator was introduced. In order to compare spectra recorded with the analyzer set for vertically (V) or horizontally (H) polarized light, the spectra were corrected for the wavelength-dependent polarization response of the instrument which is due mostly to the polarization-dependent reflectivity of the grating. This was done by illuminating the instrument with white light from the substage condenser aligned for Kohler illumination, collecting the instrument’s response over the full range of the Raman spectrum for the two polarizations in order to normalize the Raman spectra by these functions. The largest signal was identified, and both lamp files were divided by this number. These white light responses were then divided into the Raman signals.
Because neither the samples themselves nor the laser focus were changing during the analysis of the single crystal or spherulite samples it was not necessary to perform vector normalization although baseline subtraction was performed when necessary.
Results and Discussion
Isothermal Crystallization of 13% 3-Hydroxyhexanoate in Polyhydroxyalkanoate (PHBHx 13.9%)
Spectra of the starting amorphous material and the final crystalline material are shown in Figure 1 in the Supplemental Material. The high groove density 1800 g/mm grating was used for high-spectral resolution, and the spectra were scanned. Previous measurements on the Stokes and anti-Stokes side of the laser line using the ultra-low frequency (ULF) accessory proved that spectral features as low as 50 cm–1 from the exciting line 8 are good Raman lines. The bottom of Figure S1 (Supplemental Material) shows the full spectra recorded at the beginning before the material had crystallized and at the end when it was most crystalline. In order to compensate for any sample movement during the long crystallization, these spectra have been normalized to the unit vector and then normalized so that the integrated intensities of the carbonyl band above the baseline in all spectra were set equal. Using brackets to capture the intensity of bands that indicate crystallinity at 80, 1725, and 2995–3010 cm–1, the intensities of those bands are plotted on the top of the figure as a function of time over the course of the crystallization. The time sequence was split into three periods based on the top of the figure. The first 5000 seconds indicates the initial period, the next 10 000 seconds indicates the period when most of the change is occurring, and the last 25 000 seconds were seen as a consolidation of the changes. The spectra in these three time intervals were analyzed separately using 2D-COS 8 and from these plots it was possible to determine the order in which particular bands appeared in the spectra. This previous publication 8 proved most importantly that the two high frequency CH bands near 3000 and 3010 cm–1 represent a correlation field splitting in the crystalline form during the second phase of the crystallization. This was shown unequivocally by plotting the asynchronous correlation in the CH region during the middle time period which is shown in Figure S2 in the Supplemental Material. In Figure S2 the vertical and horizontal lines at about 3000 and 3010 cm–1 intersect at points that have measured intensity in the synchronous plot, but zero intensity in the asynchronous plot. A simple rule of 2D-COS is that if two bands that appear in the synchronous plot are totally absent in the asynchronous plot, then those two bands appear precisely simultaneously, which is what would be expected from correlation-field split bands.
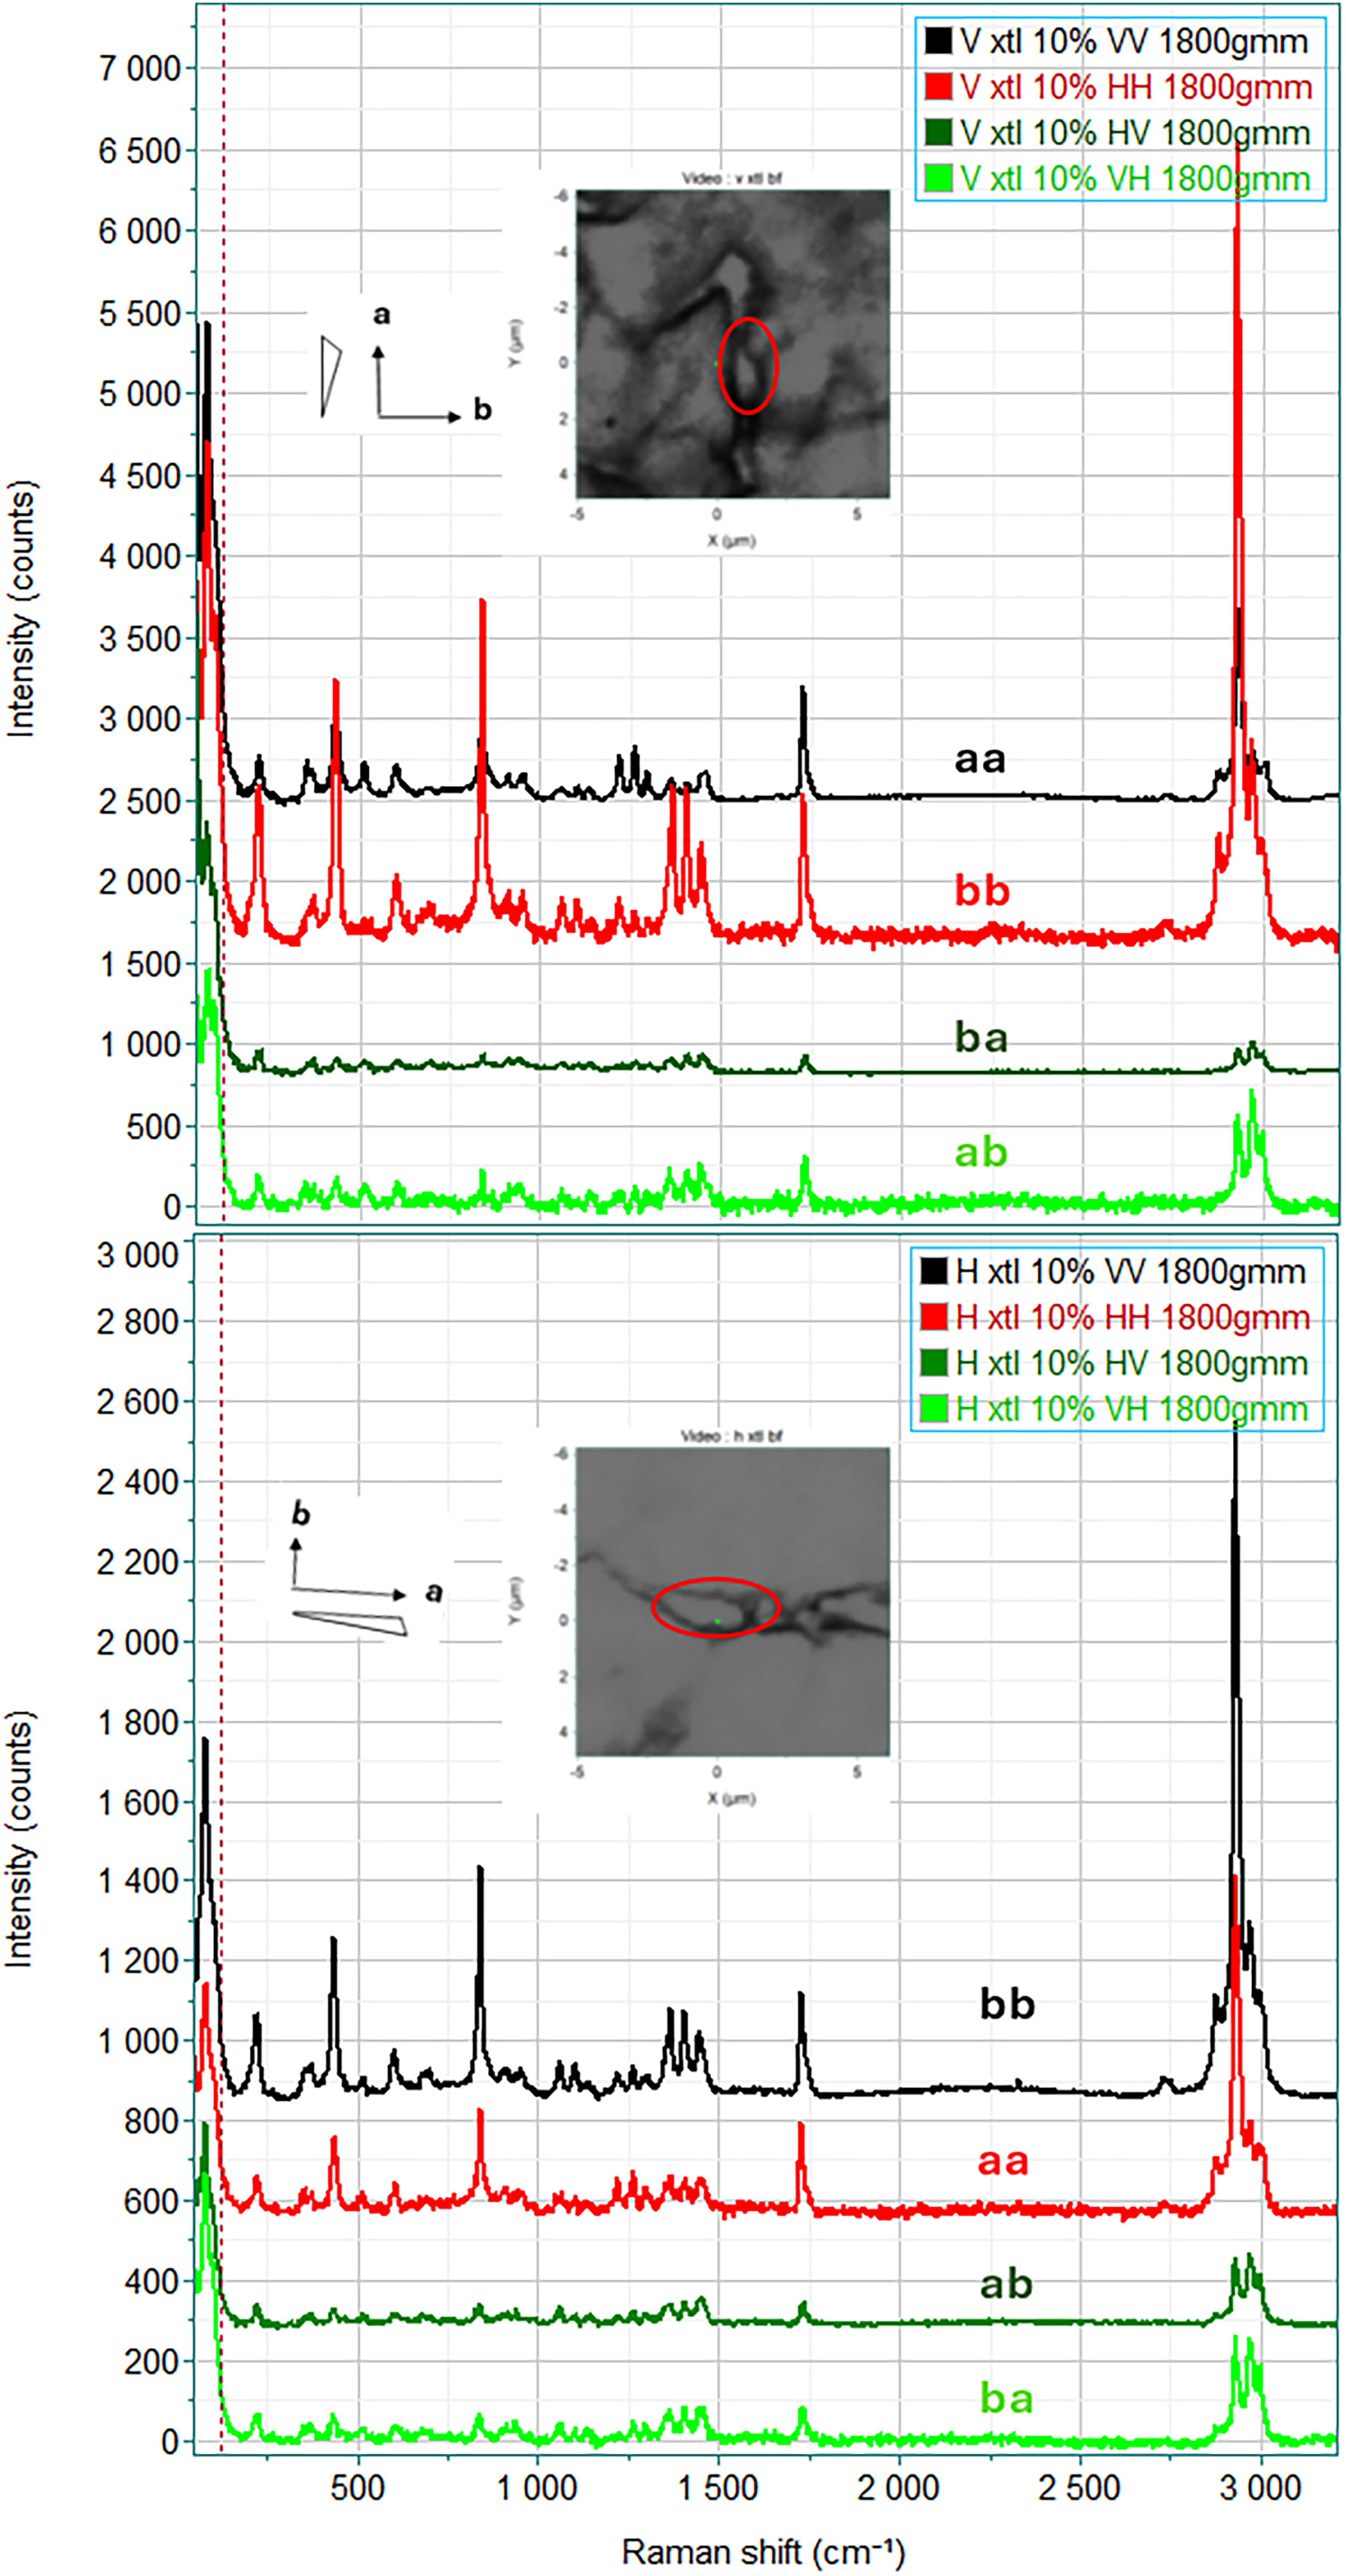
Polarized Raman spectra of vertically (top) and horizontally (bottom) oriented single crystals of 3.9% hexanoate in PHBHx; a and b refer to the crystal axes; a, the long, needle axis, is the crystalline axis that grows most rapidly; b will be ┴ to a in the plane. The c-axis is perpendicular to the figure; c polarization is inaccessible for these measurements. The color-coding reflects the polarization orientation in the lab axis system. For both crystals, the bb spectra are stronger than the aa spectra. And the off-diagonal ba and ab spectra are much weaker than either diagonal spectrum and are similar to each other.
These results tell us which bands are sensitive to crystallinity. In addition to the high frequency CH bands which have no analog in the amorphous spectrum, we will be focusing on the amorphous band at ∼1732cm–1 in the spectra of the single crystals and the polarization properties of the spherulites.
Single Crystal PHBHx 3.9%
Polymers are only rarely 100% crystalline, but we had the fortune to measure polarized Raman spectra of thin single crystals that were grown by one of us (CL) at the University of Delaware. Because the propyl side groups of the 3HHx (3-hexanoate) cannot be incorporated into the crystalline lattice, every 3HHx unit will force the polymer chain to fold, resulting in lowered crystallinity and very thin lamellae structures. Figure S3 in the Supplemental Material illustrates the model. This situation is quite different from the normal chain folding of straight polymers. It is expected that the lamellae deposit flat on the slide and will have dimensions commensurate with optical microscopy. Figure 1 shows micrographs of two crystals, one vertically and one horizontally oriented, and the full polarized spectra of these crystals. In the top part of the figure the selected crystal is oriented vertically while in the bottom part of the figure the crystal is oriented horizontally.
It is known that the rapid growth direction of the polyhydroxyalknoates (PHAs) is along the a-axis, which is close to vertical in the top part of the figure and close to horizontal in the bottom part of the figure. The spectra are color-coded to reflect the instrument polarization directions. For the diagonally polarized spectra, i.e., the laser polarization is parallel to the Raman analyzed polarization, black represents vertical polarization and red represents horizontal polarization. Inspection of the spectra indicated that the bb spectra are qualitatively more intense than the aa spectra for both crystals’ orientations and the weaker bands exhibit similar intensity patterns in the two sets of spectra. The off-diagonal spectra (ab versus ba) should be equivalent for a given crystal. The ba and ab polarization combinations are labelled either in dark green or light green. In all the off-diagonal spectra the intensities in all bands are lower than the intensities in the same bands in the diagonal spectra. Any deviations from polarization expectations are attributed to the orientations that are not exactly horizontal or vertical. All of this behavior is consistent with what would be expected for single crystals.
The left side of Figure 2 shows the CH stetching region of the polarized spectra for the horizontally oriented crystal together with the results of band fitting. In the mid 2900 cm–1 region the sharper band at 2925 cm–1 is much stronger in the bb spectrum than in the aa spectrum (integrated intensity ratio 5.7) whereas the ratio of the bb to aa amorphous component at about 2832 cm–1 is much lower (1.8). The isothermal crystallization measurement showed that the lower frequency band is that of the crystalline phase; this band is showing polarization dependent intensity while the intensity ratio of the broader amorphous band above ∼2930 cm–1 does not; this is what one would expect for non–oriented amorphous material situated at the lamellar surfaces. Note that it is difficult to be quantitative in these measurements because the a axis orientation is not precisely horizontal. The high frequency correlation field split CH stretching bands at about 2994 and 3004 cm–1 have comparable intensities in the aa and bb spectra, but the off diagonal ab and ba spectra are dominated by the 2994 cm–1 component which indicates a difference in symmetry character of the two bands which is expected for a correlation split doublet.
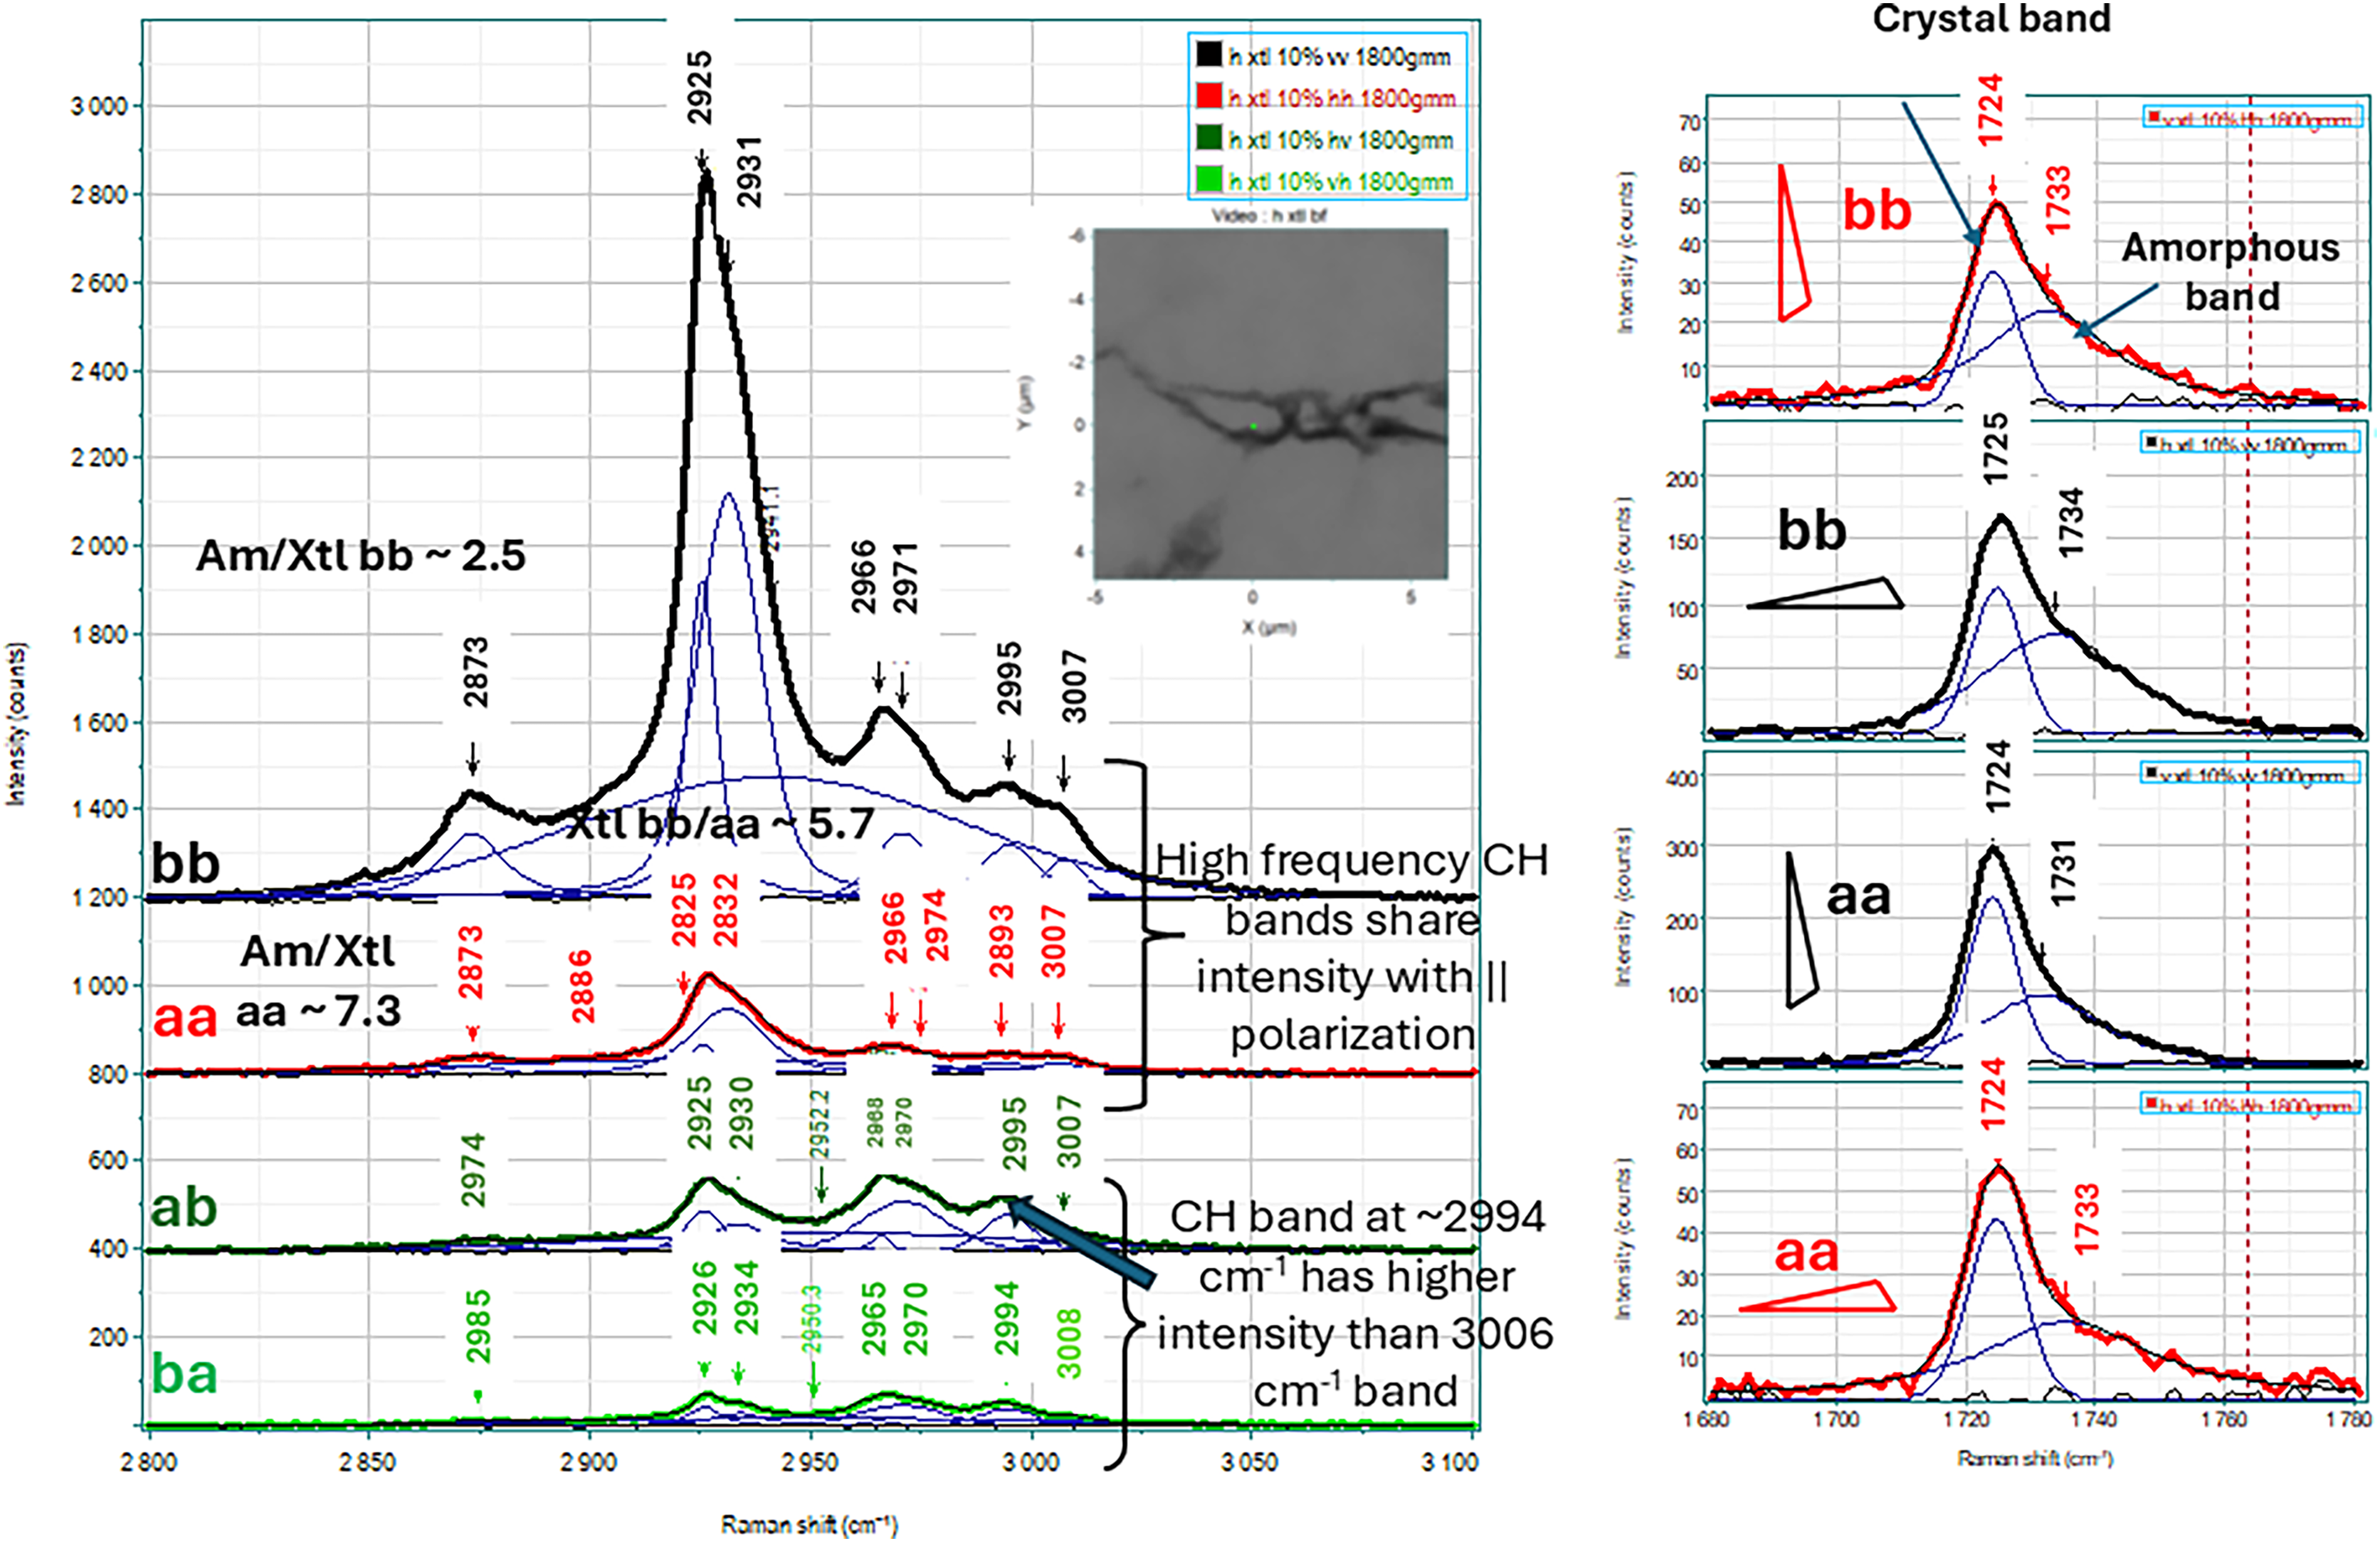
Left panel: Polarized spectra in the CH stretching region of the horizontally oriented crystal of PHB 3.9% H, showing the band fits to the bands. The mid 2900 cm–1 region shows the bands at about 2925 and 2932 cm–1 that have been assigned to the crystalline and amorphous phase while the bands at ∼2994 and 3005 cm–1 are assigned to the correlation field-split CH stretching band of the methyl CH pointing towards the carbonyl in the crystalline phase. Right panel: Polarized single crystal Raman spectra in the carbonyl region. Note that in addition to the crystal band at 1725 cm–1 there is a clear amorphous band at ∼1732 cm–1.
The right side of Figure 2 shows the parallel polarized spectra in the carbonyl region for the two crystals measured. These spectra are also band fitted and show a fairly narrow crystal band at 1725 cm–1 and a broader band above 1732 cm–1 which has been assigned to non-crystalline material. This surprising presence of amorphous material will be explained in the Discussion section. The ratio of the peak heights of the crystal to amorphous bands in the two aa spectra for the two crystals are quite similar to each other as they are in the two bb spectra. However, in the aa spectra the ratio is about 2:1, but in the bb spectra the ratio is about 1.2:1.
Polarized Spectra of Spherulites
Figure 3 shows our polarized light microscope (PLM) images of spherulites of samples of PHA with 3HHx composition of 0, 3.9, and 13% hexanoate. Note that all micrographs show the Maltese cross as well as banding. For the 0% sample the rings are irregular but are spaced at about 8–10 µm whereas the rings are about 5 µm apart in the 3.9 and 13% samples. The right side of the figure illustrates the model where a crystalline ribbon grows from the nucleation point but twists around the growth axis. Polarized Raman spectra should enable confirmation of this proposal.
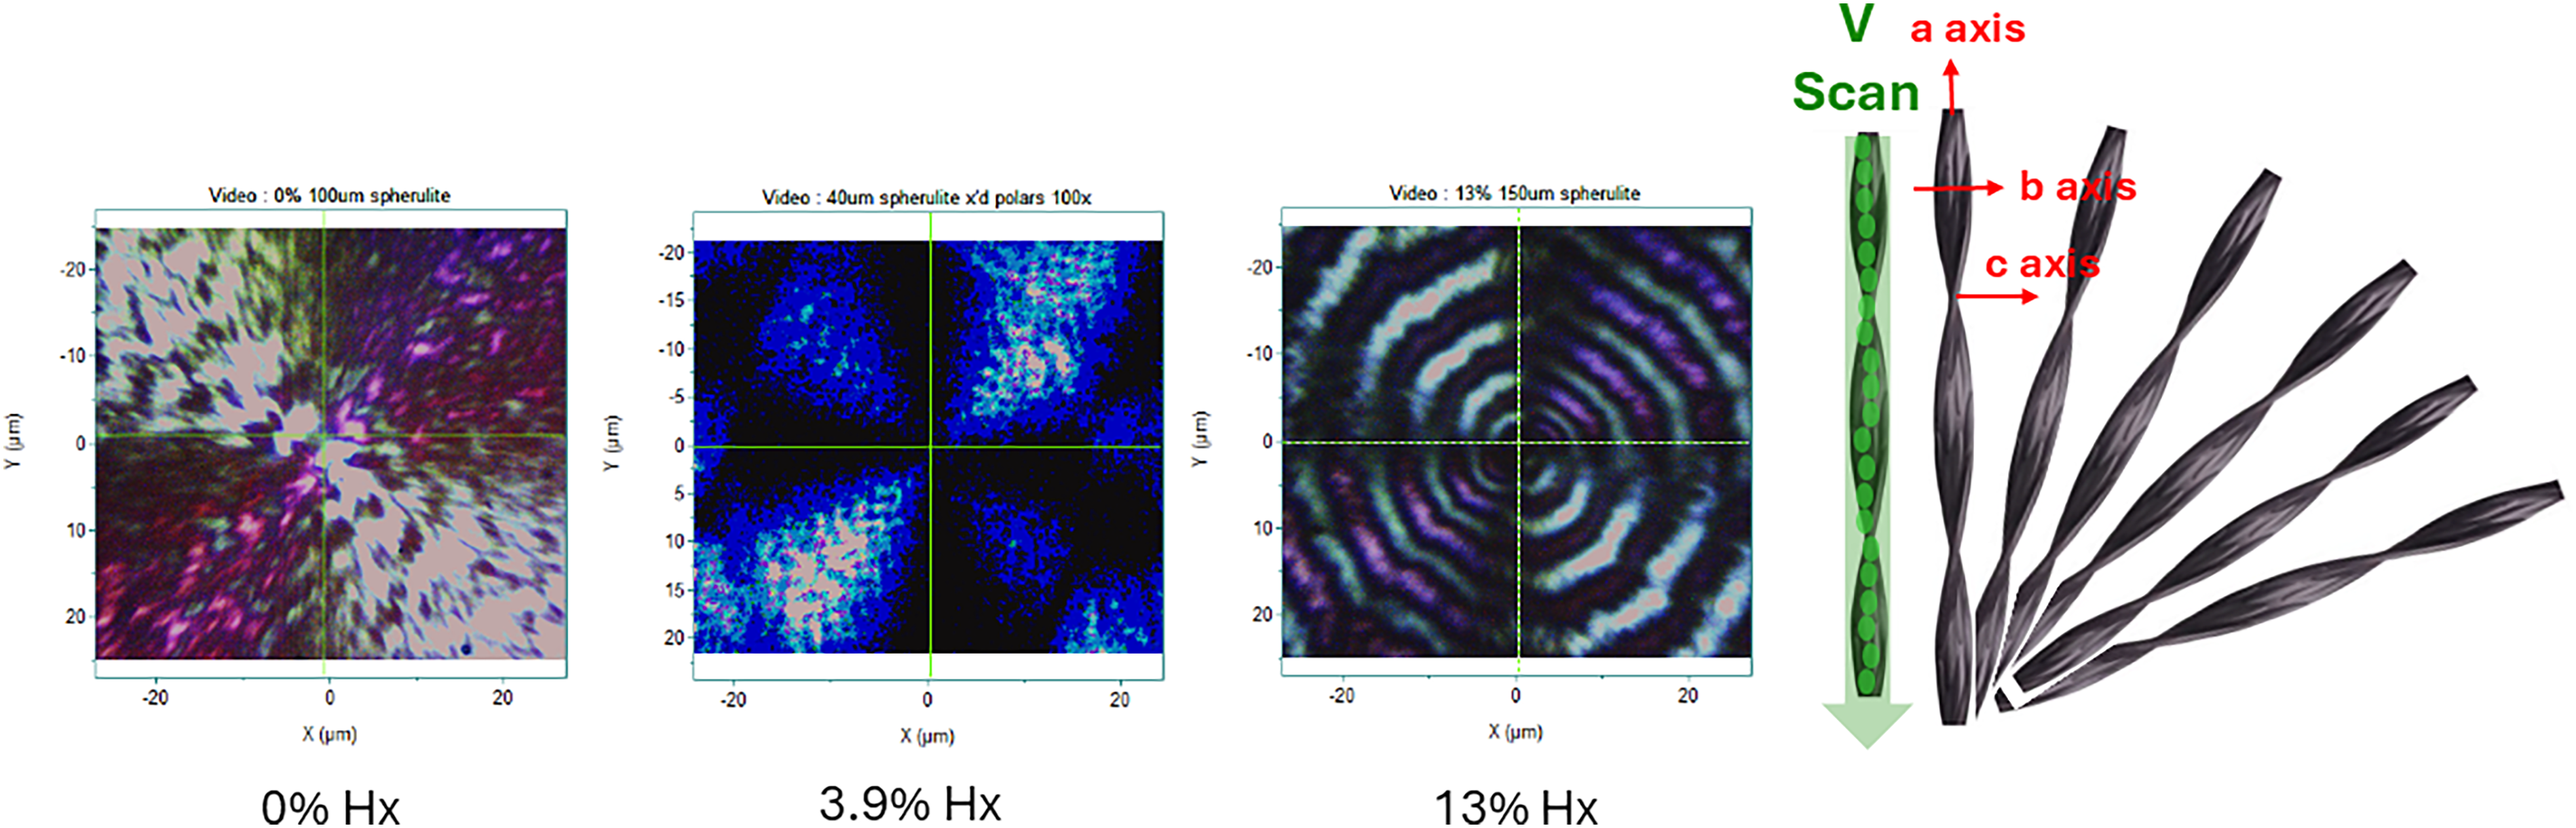
Left panel: Polarized light microscope images of spherulites of PHA with composition 0, 3.9, and 13.9% Hx. Right panel: Schematic of polymer crystal structure in spherulite.
In order to further understand the polarization behavior, the next figures will show plots of vertical line scans along with the micrograph of the measured spherulites and 2D-COS analysis of the same data.
Figure 4 shows the micrograph of a 0% spherulite in which a vertical line scan through the center was measured. In the center of the figure the intensities for the carbonyl (top), 3008 cm–1 CH band (middle), and 2998 cm–1 CH stretching band (bottom) for the two diagonal polarizations (VV and HH). Note that because of the substantial overlap between the crystalline and amorphous components of the carbonyl band, the intensity traces represent the sum of both bands. In each graph the VV trace is a darker color than the HH trace. In all cases the VV intensity is higher than the HH. Note that VV is predicted to be aa whereas HH will have changing composition of bb and cc if the crystalline ribbons are twisting. On the right side of the figure is the 2D-COS analysis of the same data.
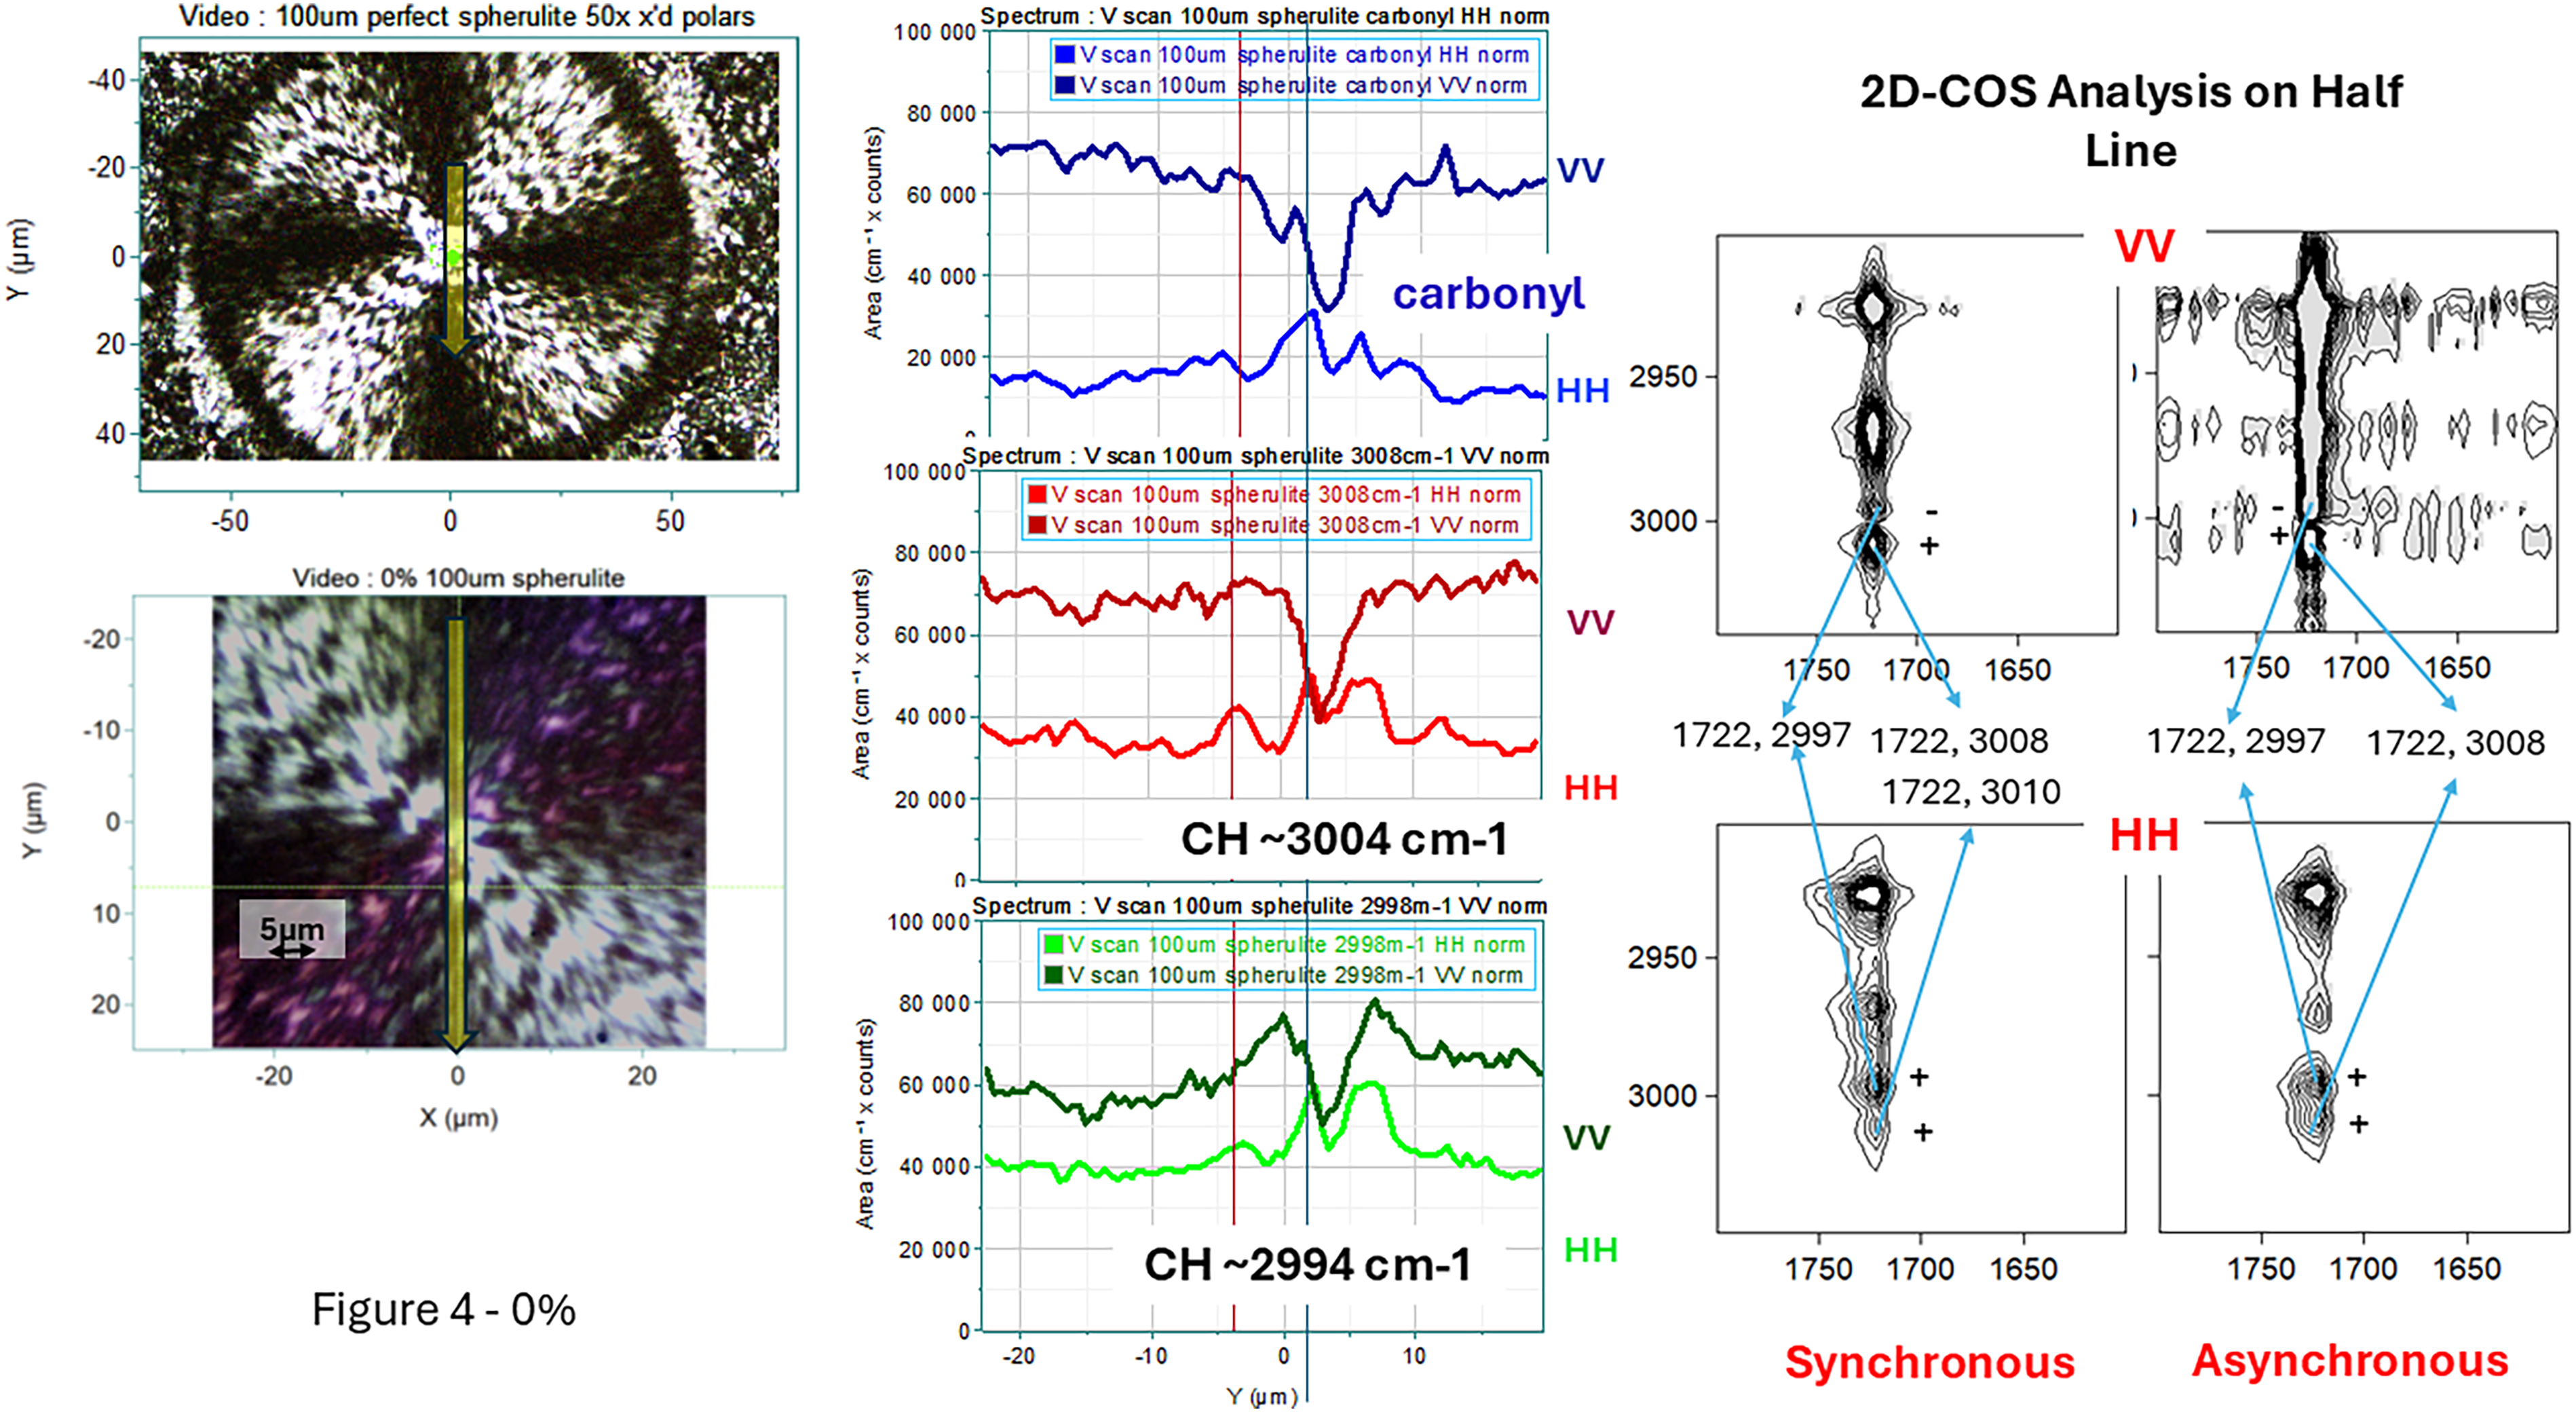
Left panel: Polarized light micrograph of a spherulite of 0% 3HHx in PHA. The yellow line in the middle indicates the line scan along the vertical radius whose spectral intensities are shown in the middle of the plot. All radii are parallel to the a axis. The periodicity along the radius is about 5–10 μm but quite irregular. Middle panel: Vertical line profiles of VV and HH intensities of the carbonyl band (top), the 3008 cm–1 CH stretching band (middle), and the 2998 cm–1 band (bottom) for a spherulite in the 0% material. Right panel: 2D-COS heteroplots comparing the carbonyl envelope with the CH region.
Figure 5 shows comparable measurements for the 13.9% sample. In this case, the rings are quite clear and separated by about 5 µm. In the center are the line profiles of the carbonyl band and the correlation split CH doublet. The 2D-COS analysis analogous to Figure 4 is shown on the right.
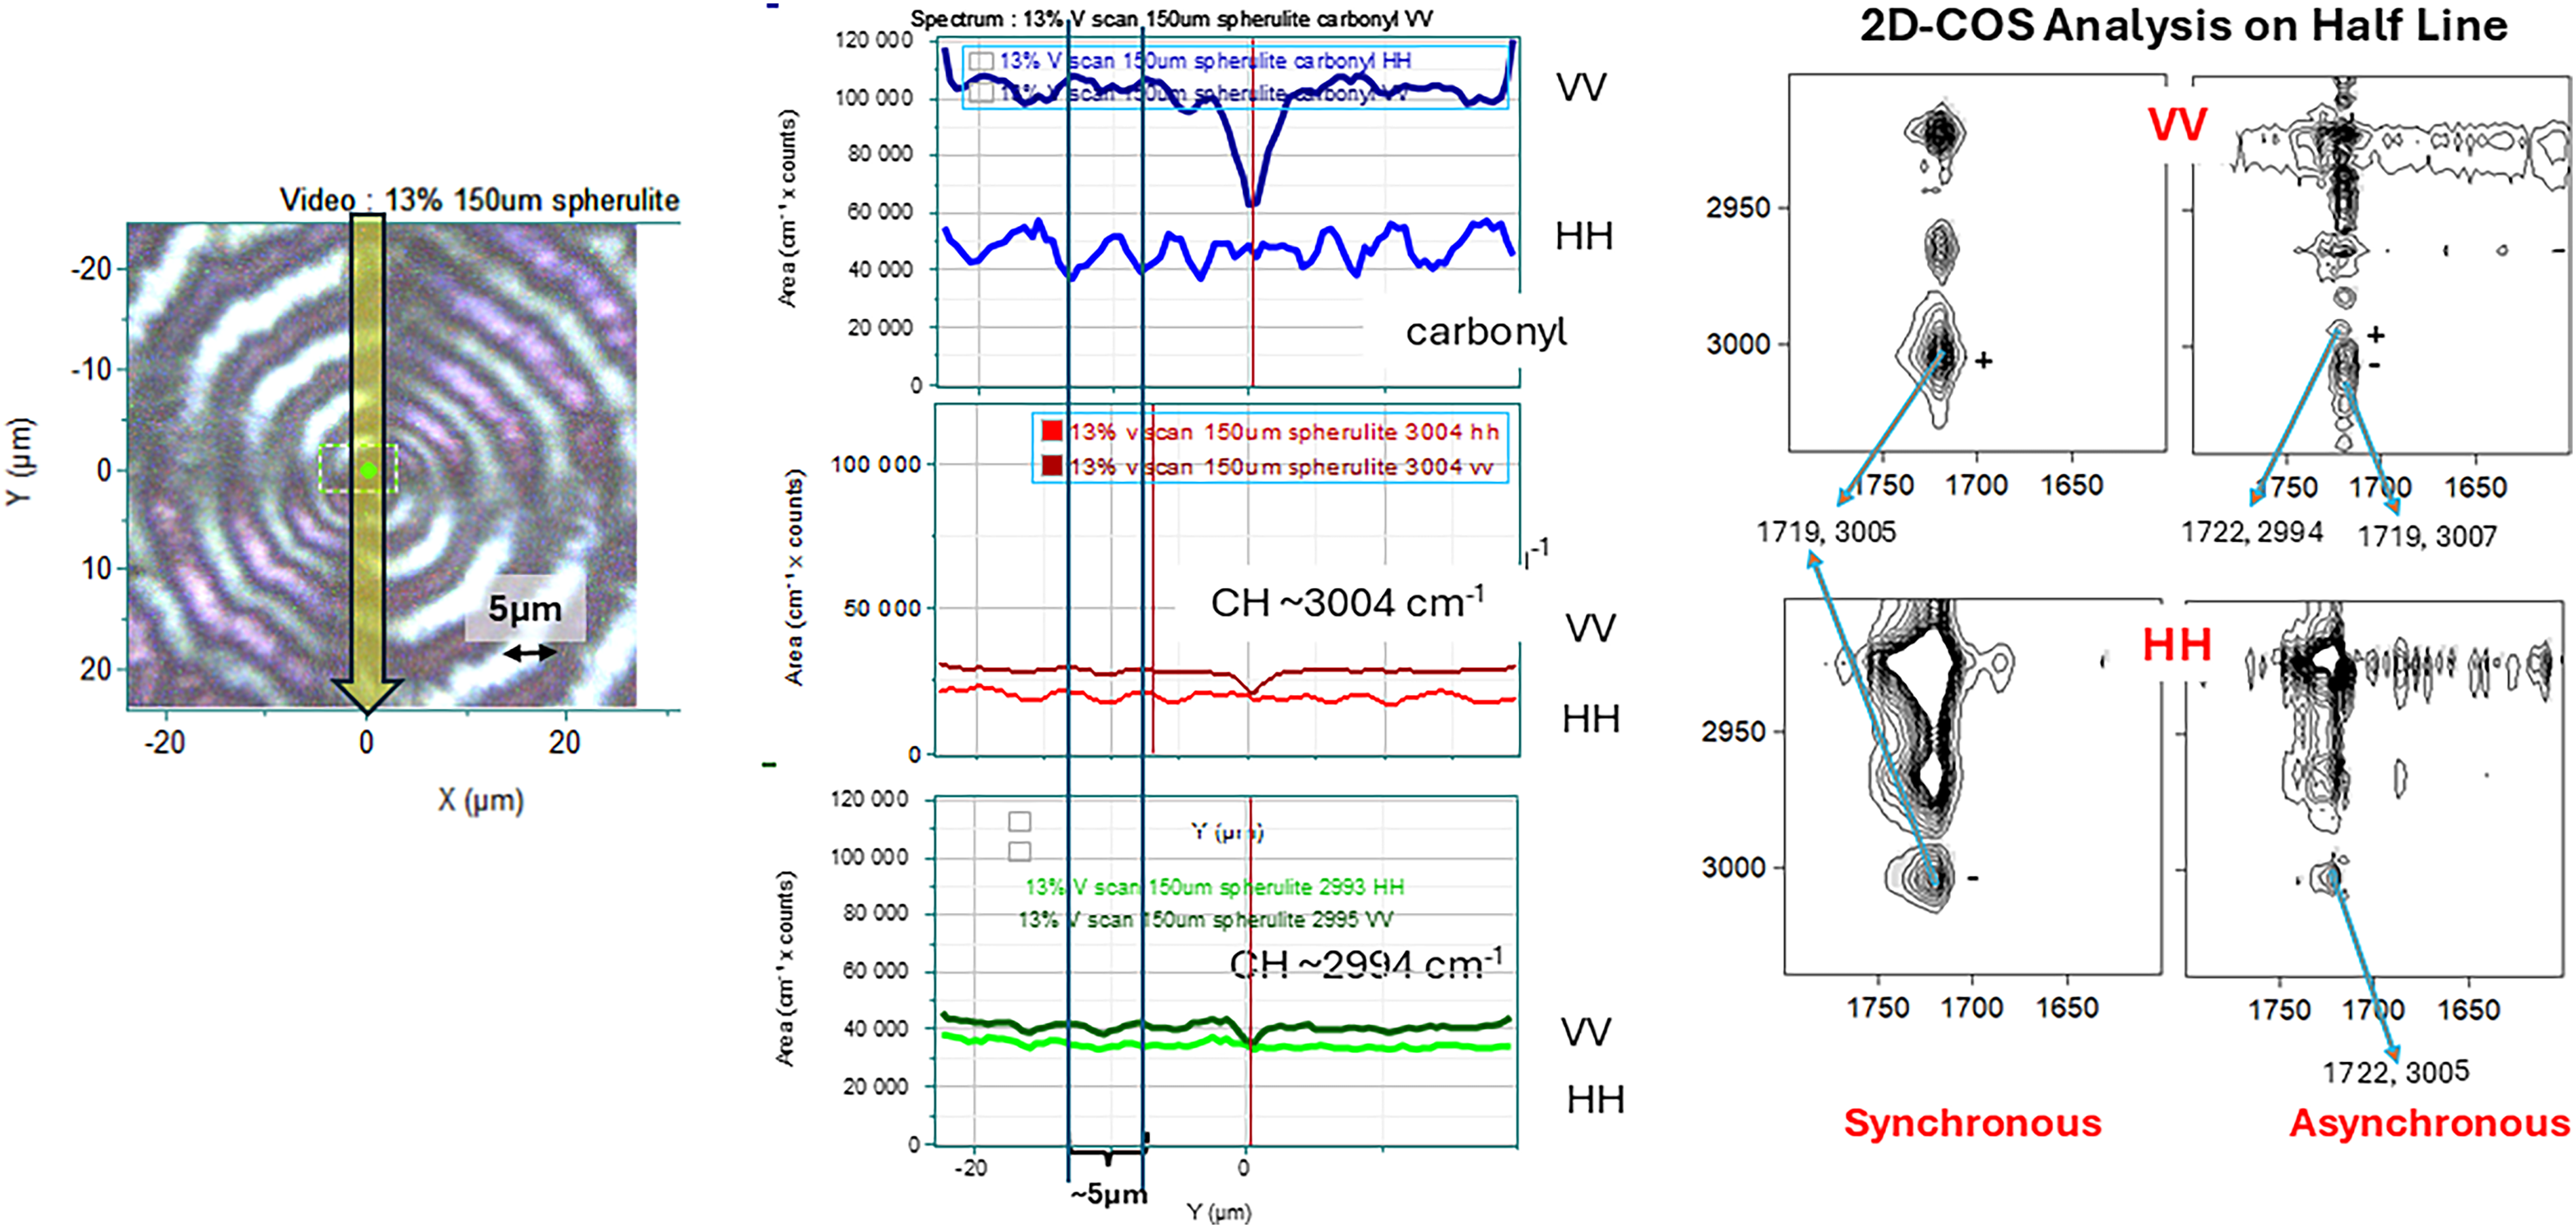
Left panel: Polarized light micrograph of spherulite of the 13.9% PHBHx material The yellow line in the middle indicates the line scan along the vertical radius whose spectral intensities are shown in the middle of the plot. All radii are parallel to the a-axis. The periodicity along the radius is about 5 µm although it appears to increase as one moves from the nucleation center. Middle: Vertical line profiles of VV and HH intensities of the carbonyl band (top), the 3008 cm–1 CH stretching band (middle), and the 2998 cm–1 band (bottom) for a spherulite in the 13.9% material. Right panel: 2D-COS heteroplots comparing the carbonyl envelope with the CH region.
Isothermal Crystallization of PHB13.9%Hx
These measurements clearly showed the conversion of the amorphous form to the crystalline form. The early publication 7 indicated the order in which the different crystalline bands appeared in the spectra, and importantly that the unusual high frequency CH doublet near 3000 cm–1 represents the correlation splitting of a particular methyl CH that is interacting with the carbonyl on the other chain in the unit cell. The identification of particular amorphous versus crystalline bands will be useful in understanding the spectra of the single crystals which should, in principle, not have amorphous bands.
Single Crystal Polarized Spectra
Any solid-state physicist will tell you that the spectrum of a single crystal of a material should not exhibit bands of the amorphous phase. However, polymer physics has its own rules. Polymers rarely exhibit 100% crystallinity. The creation of these single crystals was enabled only because single lamellae were deposited Because the propyl side chains of the hexanoate groups cannot be included in the crystal phase they will interrupt the continued ordering of the crystal chains and thus terminate the growth of the lamellae. Figure 3 in the Supplemental Material represents the recognized conception of the lamellar structure. 9 A limited number of monomers define the height of the lamella; the appearance of the propyl side group will induce the chain to bend over on itself or may be terminated in an amorphous segment. Thus, it is possible to account for the amorphous composition seen in the spectra in Figure 2. Inspection of the spectra in the CH stretching region shown on the left show the crystalline band near 2925 cm–1 to be significantly stronger in the bb spectrum than the aa spectrum (ratio = 5.7). If the amorphous material centered at 2932 cm–1 is truly unoriented one would expect the intensities to be comparable in the bb and aa spectra. The measured ratio is, in fact, 1.8, not 1.0, but significantly lower than the value of the crystalline band. Another metric that can provide insight is the ratio of the amorphous material to the crystalline material in the bb versus the aa. In the bb spectrum where the crystalline band has more intensity, the amorphous to crystalline band ratio is 3.0 whereas in the bb spectrum it is 4.8. Note that these ratios were calculated from the integrated intensities of the bands.
Unlike infrared absorption where it is clear that the absorption will be most intense along the axis of the functional group, in the Raman effect there are two photons, and without a full description of the Raman tensor in the crystallographic symmetry one cannot predict what the polarization behavior will be. There is a description of the Raman tensor in the literature, 10 but our spectra do not confirm these predictions which assign B3 symmetry to carbonyl bands with bc selection rules. In our geometry of the single crystals both photons move parallel to the c axis, so c polarized light is not accessible; that means that the fact that we observe the carbonyl band means that it must have different symmetry.
The observed polarization behavior of the single crystals will be used to understand the polarized Raman behavior of the spherulites.
Polarized Spectra of Spherulites
The model that has been proposed to explain the PLM behavior is that from the nucleation point in the center of the figures, crystals are growing radially with the radial direction coincident with the axis of fastest growth.2–5 In the case of PHA that is the a axis. The explanation of the rings is a bit more convoluted. It is believed that the rings are a result of the radial ribbons twisting around the radial direction. We will see that the polarized Raman behavior is consistent with this model.
First we will discuss the intensity profiles of the bands in the line scans. It is probably helpful to review first the expected polarization behavior. Since the fastest growing direction of the polymer is the a axis, a vertical polarization at any point on a vertical line scanned through the center of the spherulite will also be along a. When the polymer ribbon on such a tract is flat on the surface, the c axis will be out of the plane, and the horizontal axis will be b. However, if the ribbon twists as proposed,2–5 the laboratory horizonal axis will represent a sum of b- and c- axis components.
We will first discuss the results from the 13.9% spherulite shown in Figure 5 because the rings are smoother than in the 0% sample and the results are thus easier to explain. In the line profiles the intensities in these plots represent the integrated intensities of the bands of interest; in deriving these plots the baselines were not subtracted before calculating the integrated intensities of the bands because the bands of interest are heavily overlapped, and in fact the intensity of the carbonyl represents both the amorphous and the crystalline phase. The VV profile at the top represents the aa intensity of the carbonyl band. However, the HH intensity below is believed to represent the carbonyl intensity as the ribbon rotates along the radius of the spherulite and will have changing intensities due to the contributions from bb, cc, and bc. Note that the HH carbonyl intensity does exhibit significant ripples with a width of about 5 μm which corresponds to the ripple distance observed in the PLM. The VV component shows a dip in intensity in the center which is obviously due to the nucleating material that will not be crystalline or oriented, and the VV intensity in the center approaches that of the HH because there is no orientation in the nucleation site; similarly in the traces for the correlation split CH bands there is a dip for the VV intensity at the center for both components, for the same reason, i.e., the aa (VV) component is monitoring the crystalline material whose concentration will be low in the nucleation center. The HH component of the CH stretching bands also shows ripples similar to those of the carbonyl. Note that the CH ripples are out of phase to the carbonyl ripples, presumably because the Raman tensor components for the modes are different. Note also that the rings in the micrograph seem to be widening as the distance from the center increases and the HH linescans reflect these changes. One question that remains is why the VV to HH intensities of the carbonyl band are close to 0.5, whereas the CH band ratios are both close to 1.0. These CH bands are both present only in the crystal phase so they should adhere to the expectations of the previous measurements on single crystals (Figure 2) where their intensities in the aa and bb spectra are comparable. On the other hand, the VV and HH plots for the carbonyl band in the center of Figure 5 includes the intensity of the amorphous part as well. Since the amorphous part is not expected to be oriented, that, in combination with the H polarization changing from b to a combination of b and c would explain the drop in the HH intensity.
The right side of the figure shows 2D-COS heteroplots of the carbonyl region versus the CH stretching region for these data sets. The variable that is changing in assembling the 2D-COS series is the position on a vertical line on the spherulite; the data points were arranged from outside in. If the spherulite truly behaves as described earlier, then the variable is the orientation, possibly with decreasing crystalline content the closer to the nucleation site.
The top set of 2D-COS plots illustrates the VV component behavior while the bottom has the HH component. For both polarizations, the synchronous plot shows a point at (1719, 3005). This is somewhat low for the carbonyl crystal band, but it has been seen numerous times before. One worries about the wavelength stability of the measurement, but note the asynchronous plots show bands at (1722, 2994) and (1719, 3007) in the VV plot and at (1722, 3005) in the HH asynchronous plot. Because these numbers come from the same data sets, the variations cannot be measurement instability. And before these numbers were entered in the figures, the 2D-COS plots were expanded in order to get a precise measure of their locations. Note that in the synchronous VV plot the intensity is positive while in the HH plot the intensity is negative. The bands at 1719 and 3005 cm–1 are both assigned to crystalline material. We believe that the negative intensity in the HH data is due to rotation of the ribbon whereas the VV intensity is not sensitive to the rotation. In the asynchronous plot of the VV data, both CH bands of interest appear, one positive and one negative, reflecting the opposite relationship between the carbonyl and the CH split bands. In the HH data only one spot at 3005 cm–1 is seen in the asynchronous plot as well as the synchronous plot. One is tempted to attribute this to deeper ripples in this band.
Now we can look at the analogous plots for the 0% spherulite. Again, there are intensity dips at the nucleation site in the center for the VV components of all bands. For all bands studied the intensity in the VV polarization was stronger than the HH polarization. But the HH plots also show structure in the middle which was less clear for the 13.9% sample results. Not a single rise but several positive bumps. This chaotic behavior is presumably related to the chaos seen in the PLM. What is also interesting is the synchronous plots for both VV and HH have points for both high frequency CH bands whereas the 13.9% plots have spots only at 3005 cm–1. And both asynchronous plots for the 0% spherulite also have spots for both CH bands.
We propose that the qualitative differences between the spherulites of these two PHA compositions is due to the differences in crystallinity and the effect that has on the morphology of the spherulites. The crystalline content of the two samples is about 56% versus 30% for 0% versus 13.9% hexanoate. 1 In the 0% Hx sample, it is possible that the crystals are growing so rapidly in the spherulite that there is branching of the growing ribbon and then there will not be smooth flat ribbons in the plane of the substrate, and it is also possible then that c axis polarization will be accessible in VV spectra. This would invalidate all the polarization predictions discussed earlier. Remember that the single crystal measurements provided no information on Raman components with c axis polarization. What is surprising is that until now, more than 50 years after the introduction of the Raman microscope, no one that we are aware of has tried to confirm the structure of spherulites by using polarized Raman measurements. Since this work was done however, we have become aware of analysis of ringed spherulites of high density polyethylene (HDPE) by polarized coherent anti-Stokes Raman spectroscopy (CARS) in which it was shown that the crystals were not rotating totally about the radial axes. 11
In reading the literature on spherulites6–8 it is not possible not to notice the comments about “unbalanced surface stresses” on the lamellae surfaces that have been proposed to explain the twisting. 12 The presence of stresses, of course would explain the small variations on peak positions that are uncovered by the 2D-COS analysis.
Conclusion
Based on the knowledge of the changes from amorphous to crystalline PHA from isothermal crystallization, these measurements have explained the structure of the single crystals of PHA and the structure of spherulites. In the case of single crystals, the presence of intensity of the amorphous phase is explained as due to amorphous polymer segments excluded from the lamellae. In the case of the spherulites these measurements confirm that when the laser polarization is perpendicular to the a axis (which is the growth axis), signals show ripples which confirm the model which says that the growing crystals are rotating/twisting around the growth axis. A systematic study designed to reveal spectral shifts that can be indicators of strain would be useful in further elucidation of the nature of the spherulites.
Supplemental Material
sj-docx-1-asp-10.1177_00037028251394393 - Supplemental material for Combining Polarization Analysis and Isothermal Crystallization Behavior Elucidated by Two-Dimensional Correlation Spectroscopy for Understanding the Crystallization Properties of Poly[(R)-3-hydroxybutyrate-co-(R)-3-hydroxyhexanoate
Supplemental material, sj-docx-1-asp-10.1177_00037028251394393 for Combining Polarization Analysis and Isothermal Crystallization Behavior Elucidated by Two-Dimensional Correlation Spectroscopy for Understanding the Crystallization Properties of Poly[(R)-3-hydroxybutyrate-co-(R)-3-hydroxyhexanoate by Fran Adar, John Rabolt, Changhao Liu and Isao Noda in Applied Spectroscopy
Footnotes
Declaration of Conflicting Interests
The author(s) declared no potential conflicts of interest with respect to the research, authorship, and/or publication of this article.
Funding
The author(s) received no financial support for the research, authorship, and/or publication of this article.
Supplemental Material
All supplemental material mentioned in the text is available in the online version of the journal.
References
Supplementary Material
Please find the following supplemental material available below.
For Open Access articles published under a Creative Commons License, all supplemental material carries the same license as the article it is associated with.
For non-Open Access articles published, all supplemental material carries a non-exclusive license, and permission requests for re-use of supplemental material or any part of supplemental material shall be sent directly to the copyright owner as specified in the copyright notice associated with the article.