
Abstract
Attenuated total reflection infrared–far-infrared (ATR IR-FIR) spectra (4000–50 cm–1) and Raman spectra (2000–50 cm–1) were measured for twelve types of biogenic minerals (shells), including Corbicula sandai (aragonite), Corbicula fluminea (aragonite), Corbicula japonica (aragonite), Ruditapes philippinarum (aragonite), and Mytilus galloprovincialis (aragonite and calcite) from different origins and growing environments. In this study, we investigated the crystal structures of these biogenic minerals, the water contents and structure in them, and the differences in the crystal structures among the aragonite forms of these minerals. In the 4000–3000 cm–1 region and around the 1650 cm–1 band region in the IR spectra, the proportion of the IR absorption bands related to weak and strong hydrogen bonds was significantly different among the shellfish species investigated. Therefore, it has been found that IR spectroscopy is useful for discriminating among shells based on the content and structure of water such as hydrogen bonds. In the low-frequency region below 500 cm–1, where bands corresponding to lattice vibrational modes are observed, we investigated the lattice vibration modes of aragonite of shells and discussed particularly the full width at half-maximum (FWHM) of the bands at around 267 cm–1 in the FIR spectra and the intensity of the side band at around 140 cm–1 in the Raman spectra. As a result, we demonstrated that using both IR and Raman spectroscopies including the low-frequency regions allows us to distinguish various biogenic minerals from different habitats and growing environments. Additionally, it suggests that both IR and Raman spectroscopies including low-frequency regions are useful for characterizing habitats of shellfish.
This is a visual representation of the abstract.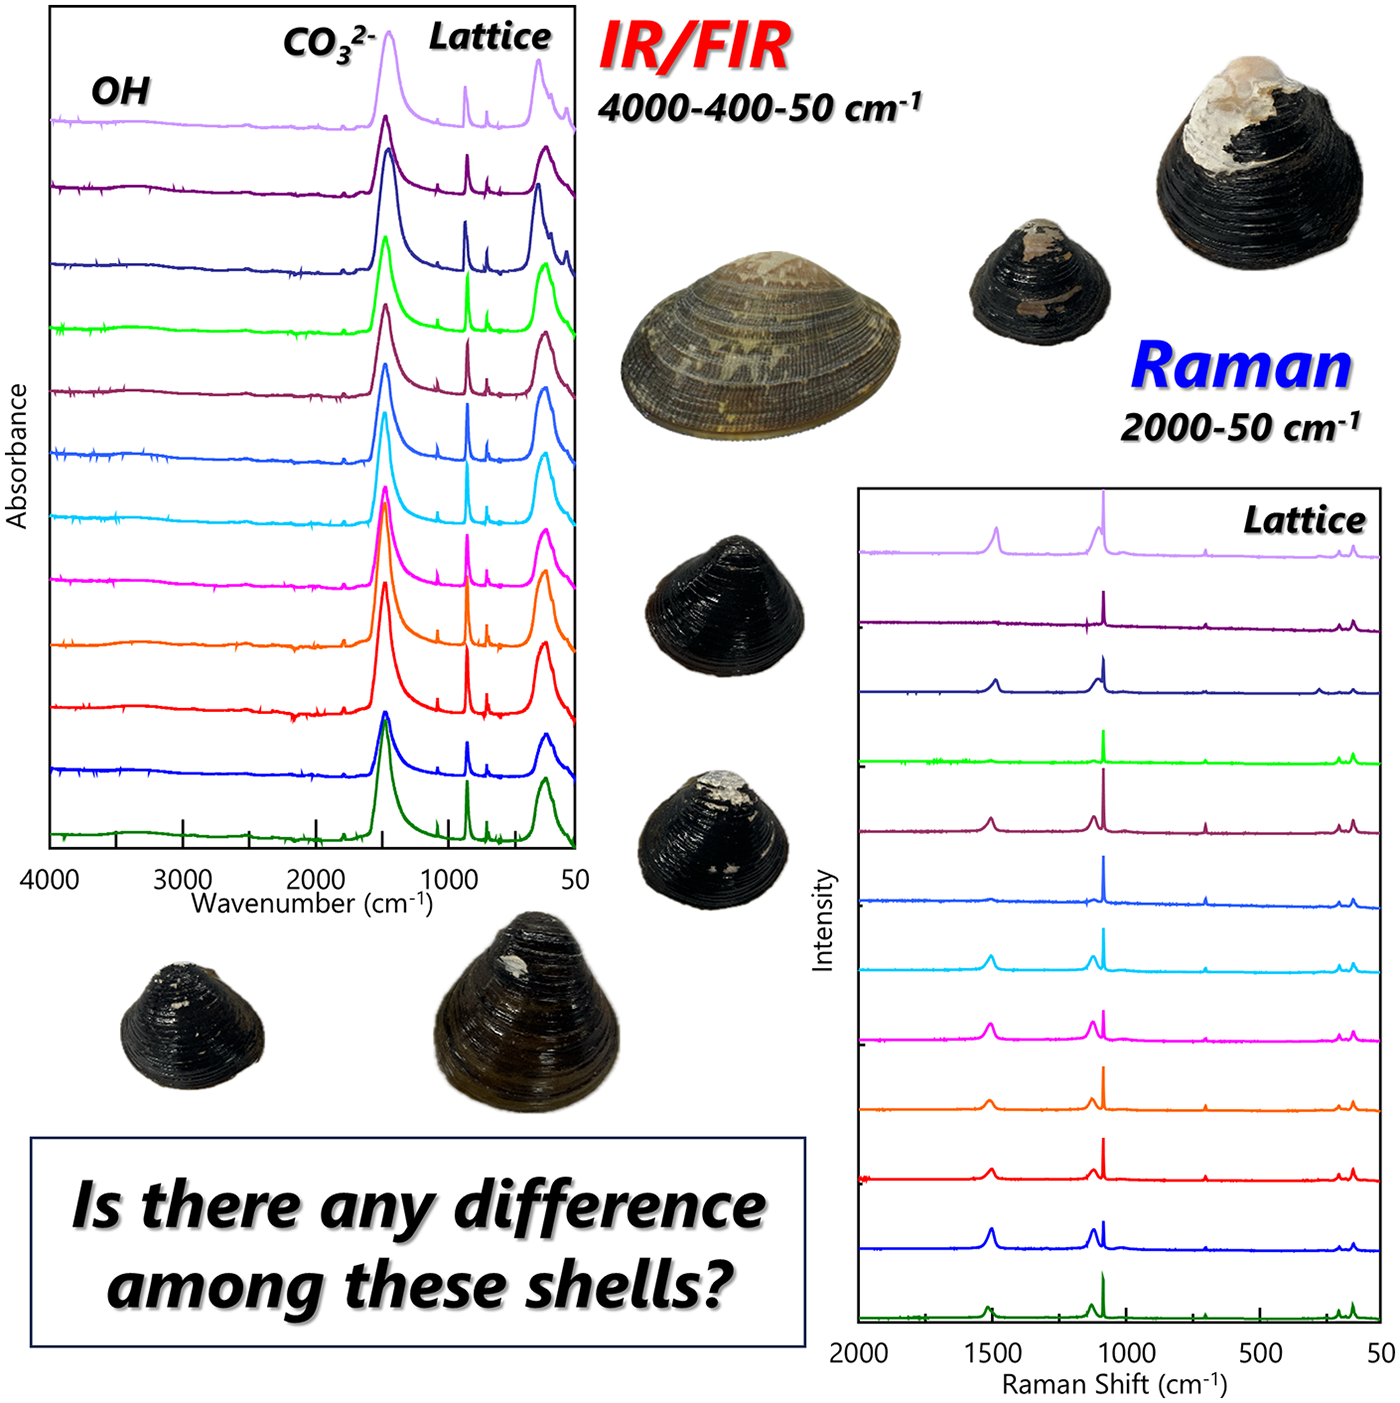
Keywords
Introduction
Studies for natural minerals using infrared (IR), far-infrared (FIR), and Raman spectroscopies have a long history and are a popular subject of research.1–5 However, there have been few cases in which these methods have been applied to the analysis of biogenic minerals.6–8 Moreover comparative studies combining IR and Raman spectroscopies including the low-frequency regions are rather rare. 9 In this study, we have explored biogenic mineral samples using both IR and Raman spectroscopies including the low-frequency regions.
The common advantages of IR and Raman spectroscopies include the ability to obtain information about molecular structure, the capability to analyze both crystalline and amorphous materials, and the ease of sample preparation. One of the significant advantages of IR spectroscopy is that absorption bands due to water are clearly detectable, and it is also sensitive to its hydrogen bonds. This compensates for the limitation of Raman spectroscopy, where the bands due to water are weak. As a result, based on IR spectroscopy, there is a lot of active discussion about the contents and status of water, 9 such as hydrogen bonds.10–14 One can investigate free water and bound water with different hydrogen bonding strength. In this study, the attenuated total reflection (ATR) method was applied to the analysis of biogenic minerals due to its simplicity in sampling. This allowed for easy measurement, ranging from the water absorption band in the 4000–3000 cm–1 region to the FIR region down to 50 cm–1, which provides information about lattice vibration modes.
One of the strong points of Raman spectroscopy in biogenic mineral research is its ability to easily measure in the low-frequency region, where the bands derived from lattice vibration modes appear. In other words, it is particularly useful for investigating crystal structures.15–17 In general, in the IR spectra, the typical absorption bands of crystalline minerals and inorganic substances in the low-frequency region are broad, whereas in the Raman spectra, the bands are usually sharp. Although systematic discussion on this phenomenon has been limited, it is generally considered to result from multiple factors, such as the phonon lifetime and the difference in anharmonicity between IR and Raman spectroscopies of active lattice vibration modes. Therefore, Raman spectroscopy has the advantage of more easily detecting slight differences such as peak shift and overlapping bands.
In this study, we utilized the characteristics of IR and Raman spectroscopies to analyze shellfish, a type of biogenic minerals. Shellfish exhibits variations in type and taste depending on their habitats and growing environments, making it important for consumers to know their origin. From the seafood producers’ perspective, scientifically identifying the origin of shellfish ensures product quality and helps to maintain the brand’s reputation, which is also significant from an industrial standpoint. Recently, the issue of mispresenting the origin of shellfish has emerged as a social concern, highlighting the growing importance of chemical analysis in reliably determining their true origin. One of the most widely used analytical methods for identifying the origins is genome analysis. 18 Genome analysis method can clarify the species and pedigree of shellfish, making it an important method for determining their origins. However, genome analysis cannot reveal the growing environments or habitats of shellfish. Therefore, we chose to examine the shells themselves, which reflect the growing environments, and conduct an analysis. Although efforts to clarify the growing environments from the state of shells using laser ablation inductively coupled plasma mass spectrometry (LA-ICP-MS), 19 neodymium isotope ratio, 20 and other methods have been reported, there are no cases where the growing environments have been clarified by vibrational spectroscopies as far as we recognize. Since vibrational spectroscopic methods require minimal sample preparation and often provide easy non-destructive analysis, they present a low barrier to implementation. We analyzed several bivalve mollusks, whose main component is calcium carbonate, using IR and Raman spectroscopies. The investigated samples were Corbicula sandai collected in Shiga (Japan), Corbicula fluminea collected in China, Corbicula japonica collected in Aomori (Japan), Ibaraki (Japan), Shimane (Japan), and Tottori (Japan), Ruditapes philippinarum collected in Hokkaido (Japan), Mie (Japan), and South Korea, and Mytilus galloprovincialis collected in Chile, New Zealand, and Miyagi (Japan). We selected multiple species from different habitats and with varying salinity concentrations.
In the high wavenumber region (4000–3000 cm–1) of the IR spectra, the O–H absorption bands have been investigated for many rocks and natural minerals. 10 However, it is rather rare that the region of 4000–3000 cm–1 of water is compared for various kind of shellfish. In our previous study, it was found that the ratio of absorbance between the bands assigned to strongly hydrogen-bonded water species (SHB) at around 3200 cm–1 and weakly hydrogen-bonded water species (WHB) at around 3400 cm–1 varied depending on the types of biogenic aragonite minerals. 21 In this study, we followed this finding to conduct a comparative analysis of various kinds of shellfish species, employing a curve fitting approach to the O–H stretching vibration region for the first time.
In addition, calcium carbonate is known to exist in three crystal forms, calcite, aragonite, and vaterite.16,22 In the case of shells, it is known to consist of calcite and/or aragonite. In this study, the peak position and full width half-maximum (FWHM) of the band at around 1470 cm–1, which is assigned to CO32– asymmetric stretching, 22 confirmed that shells are not composed solely of aragonite, and that Mytilus galloprovincialis also contain calcite. On the other hand, in the Raman spectra of this region, signals from polyenes, present in trace amounts, were detected due to resonance Raman scattering. The peak positions of these bands differed among samples. These points are also important to characterize and identify shellfish from various species and habitats.
In the low-frequency region below 500 cm–1, both IR and Raman spectroscopies were used to perform a detailed analysis of the differences in crystal states, including crystal structures and lattice vibration modes. The FIR spectra revealed that the FWHM of the band at around 267 cm–1, assigned to the anti-translatory vibration of the lattice, 23 varied with the growing environments.
In the Raman spectra, as in the IR spectra, it was unveiled that most shells were composed solely of aragonite, while some Mytilus galloprovincialis contained both calcite and aragonite. In addition to the dominant bands of aragonite assigned to the translational and librational modes of lattice vibrations at 204 and 152 cm–1, 24 a side band of external lattice modes was observed at around 140 cm–1 in some shells. These results suggest that slight differences in the crystal structure can be detected.
In this study, we examined biogenic minerals with different origins and growing environments, using both IR and Raman spectroscopies including the low-frequency regions. As a result, we discovered new possibilities for their applications in characterization and identification, such as determining the habitats and type of shellfish by investigating the O–H group, and lattice vibrations in the low-frequency region.
Experimental
Materials and Methods
All samples were washed and dried, then samples were pulverized. Powders were made by a mortar. Therefore, each sample was homogenized macroscopically.
Sample Description
All shell samples employed were commercially accessible in Japan. According to the product labels, Corbicula sandai was collected in Shiga (Japan). Corbicula fluminea was collected in China. Corbicula japonica were collected in Aomori (Japan), Ibaraki (Japan), Shimane (Japan), and Tottori (Japan). Ruditapes philippinarum were collected in Hokkaido (Japan), Mie (Japan), and South Korea. Mytilus galloprovincialis were collected in Chile, New Zealand, and Miyagi (Japan).
Generally, Corbicula sandai and Corbicula fluminea live in freshwater environments. Corbicula japonica lives in brackish water conditions (the salinity is approximately 0.3–0.5%). Ruditapes philippinarum lives in tideland near an estuary (its salinity is slightly lower than seawater’s, approximately 2–3%). Mytilus galloprovincialis generally lives in seawater (salinity is approximately 3.5%) or brackish water conditions.
ATR-IR, ATR-FIR, and Raman Measurements
The ATR IR-FIR spectra in the region of 4000–50 cm–1 were measured using a Fourier transform IR (FT-IR) spectrometer (FT/IR-6700FV, JASCO) with a high-intensity ceramic light source, a Si beamsplitter, and a deuterated L-alanine doped tri-glycine sulfate (DLaTGS) detector (KRS-5 or polyethylene window). An ATR accessory (ATR PRO ONE, JASCO) with a diamond crystal which transmits light in the wide wavenumber region was used for the IR-FIR measurements. In addition, a whole optical path was evacuated to avoid the interference of water vapor and carbon dioxide. Each spectrum was measured with a spectral resolution of 2 cm–1 and accumulated for 50 scans. All ATR spectra were treated with the Kramers–Kronig relations-based correction in order to convert an ATR IR-FIR spectrum to a transmittance-like spectrum. 25 To reduce the influence of localities of samples and to improve signal-to-noise ratio, each sample was measured five times and averaged spectra were used. To obtain second derivative spectra of ATR-FIR, the Savitzky–Golay method was used. 26
Raman spectra were measured on a microscope Raman spectrometer (NRS-5500, JASCO) with an excitation laser line at 532 nm of solid laser (100 mW). Raman scattered light was collected by an objective lens (100×, numerical aperture = 0.90) in back scattering mode, passed through an edge-filter (cutoff ∼50 cm–1) and a grating (1800 lines/mm for the 2000–50 cm–1 region, 600 lines/mm for the 3700–50 cm–1 region), then finally detected on a Peltier-cooled charge-coupled device. Although no analyzer was used, the optical path could be considered as
Results and Discussion
Study of Water Content and Structure in the 4000–1600 cm–1 Region
Figure 1 shows ATR IR-FIR spectra of (1) Corbicula sandai (Shiga), (2) Corbicula fluminea (China), (3–6) Corbicula japonica (Aomori, Ibaraki, Shimane, and Tottori), (7–9) Ruditapes philippinarum (Hokkaido, Mie, and South Korea), and (10–12) Mytilus galloprovincialis (Chile, New Zealand, and Miyagi) in the 4000–50 cm–1 region. In Figure 1, bands are detected in the 4000–3000 cm–1 region and around 1650, 1470, 860, and 270 cm–1. These are assigned to O–H stretching and H–O–H bending modes of water included in the biogenic minerals, CO32– asymmetric stretching, 22 CO32– out-of-plane bending, 16 and lattice vibration modes of calcite and/or aragonite, respectively. Figure 2a shows corresponding Raman spectra in the 3700–50 cm–1 region measured using a 600 gr/mm grating. In Figure 2a, no significant signals were observed in the 3700–2000 cm–1 region, except for the bands due to the overtones of resonance Raman scattering bands. 27 Additionally, according to our previous study, no signals were observed in the low-frequency region below 50 cm–1 of the Raman spectra of shells. 21 Therefore, we considered the wavenumber region of 2000–50 cm–1 to be sufficient for Raman measurement and selected this region for high-resolution analysis using an 1800 gr/mm grating (Figure 2b).
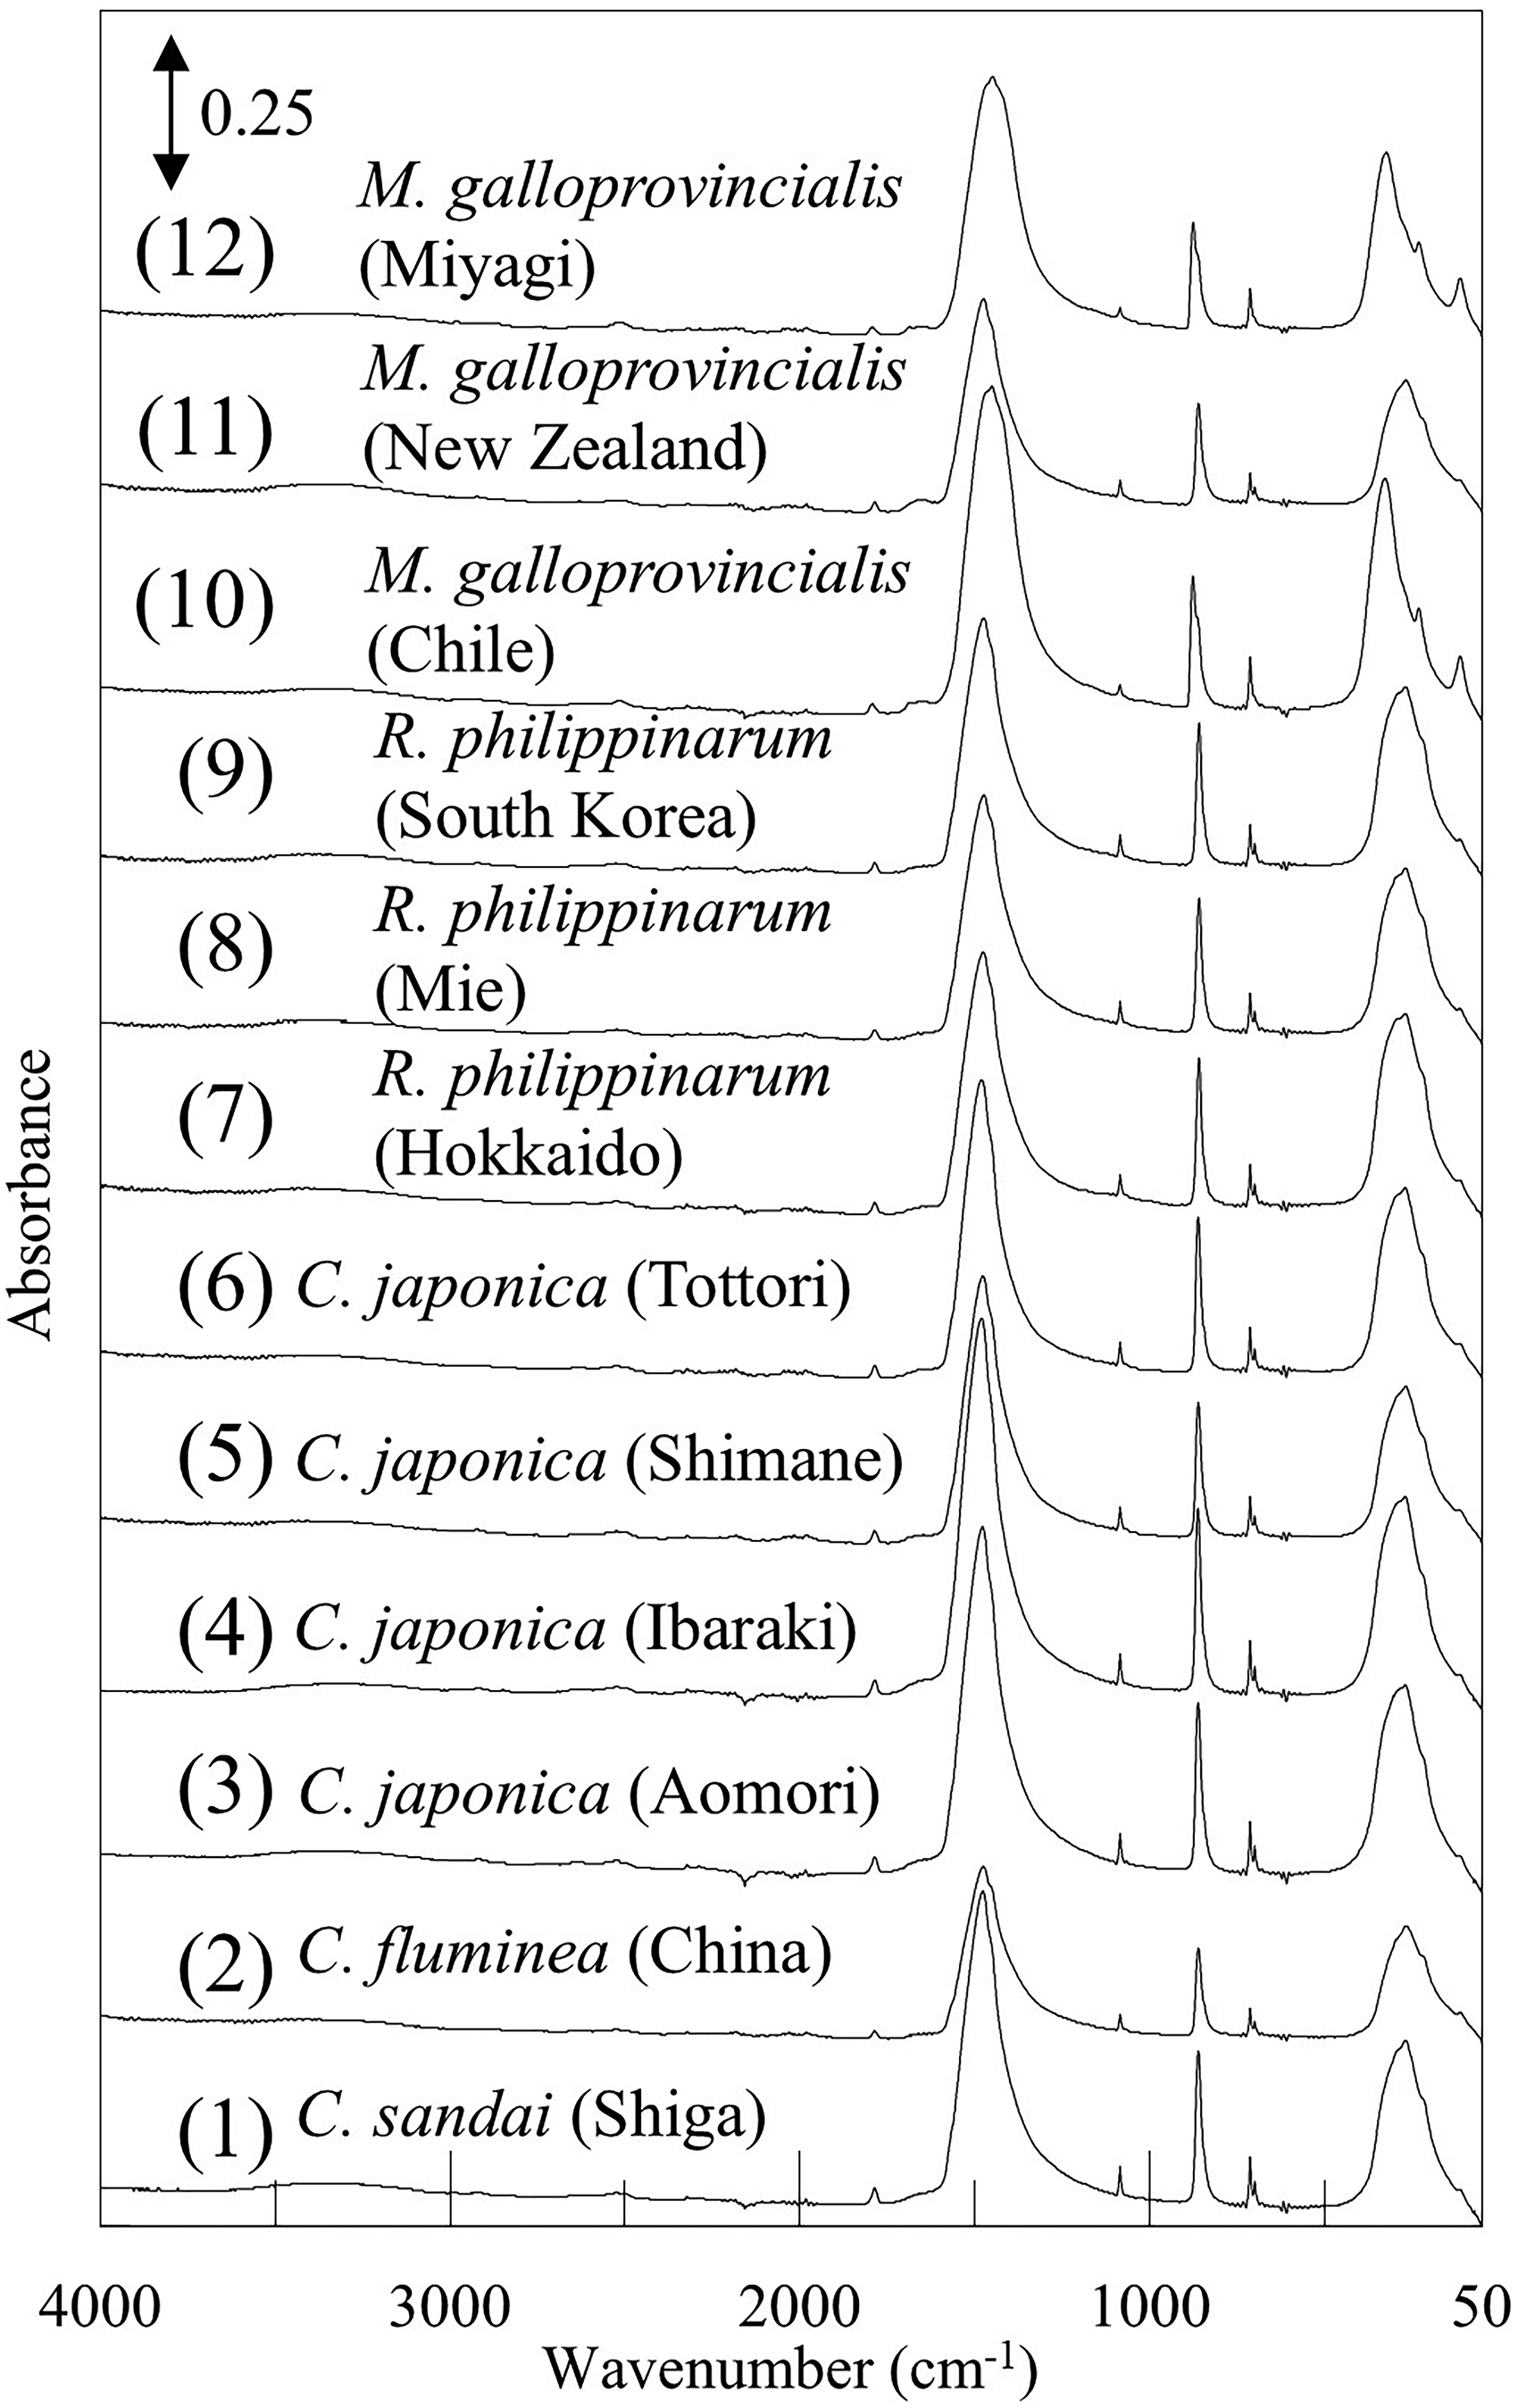
ATR IR-FIR spectra in the 4000–50 cm–1 region of shells.
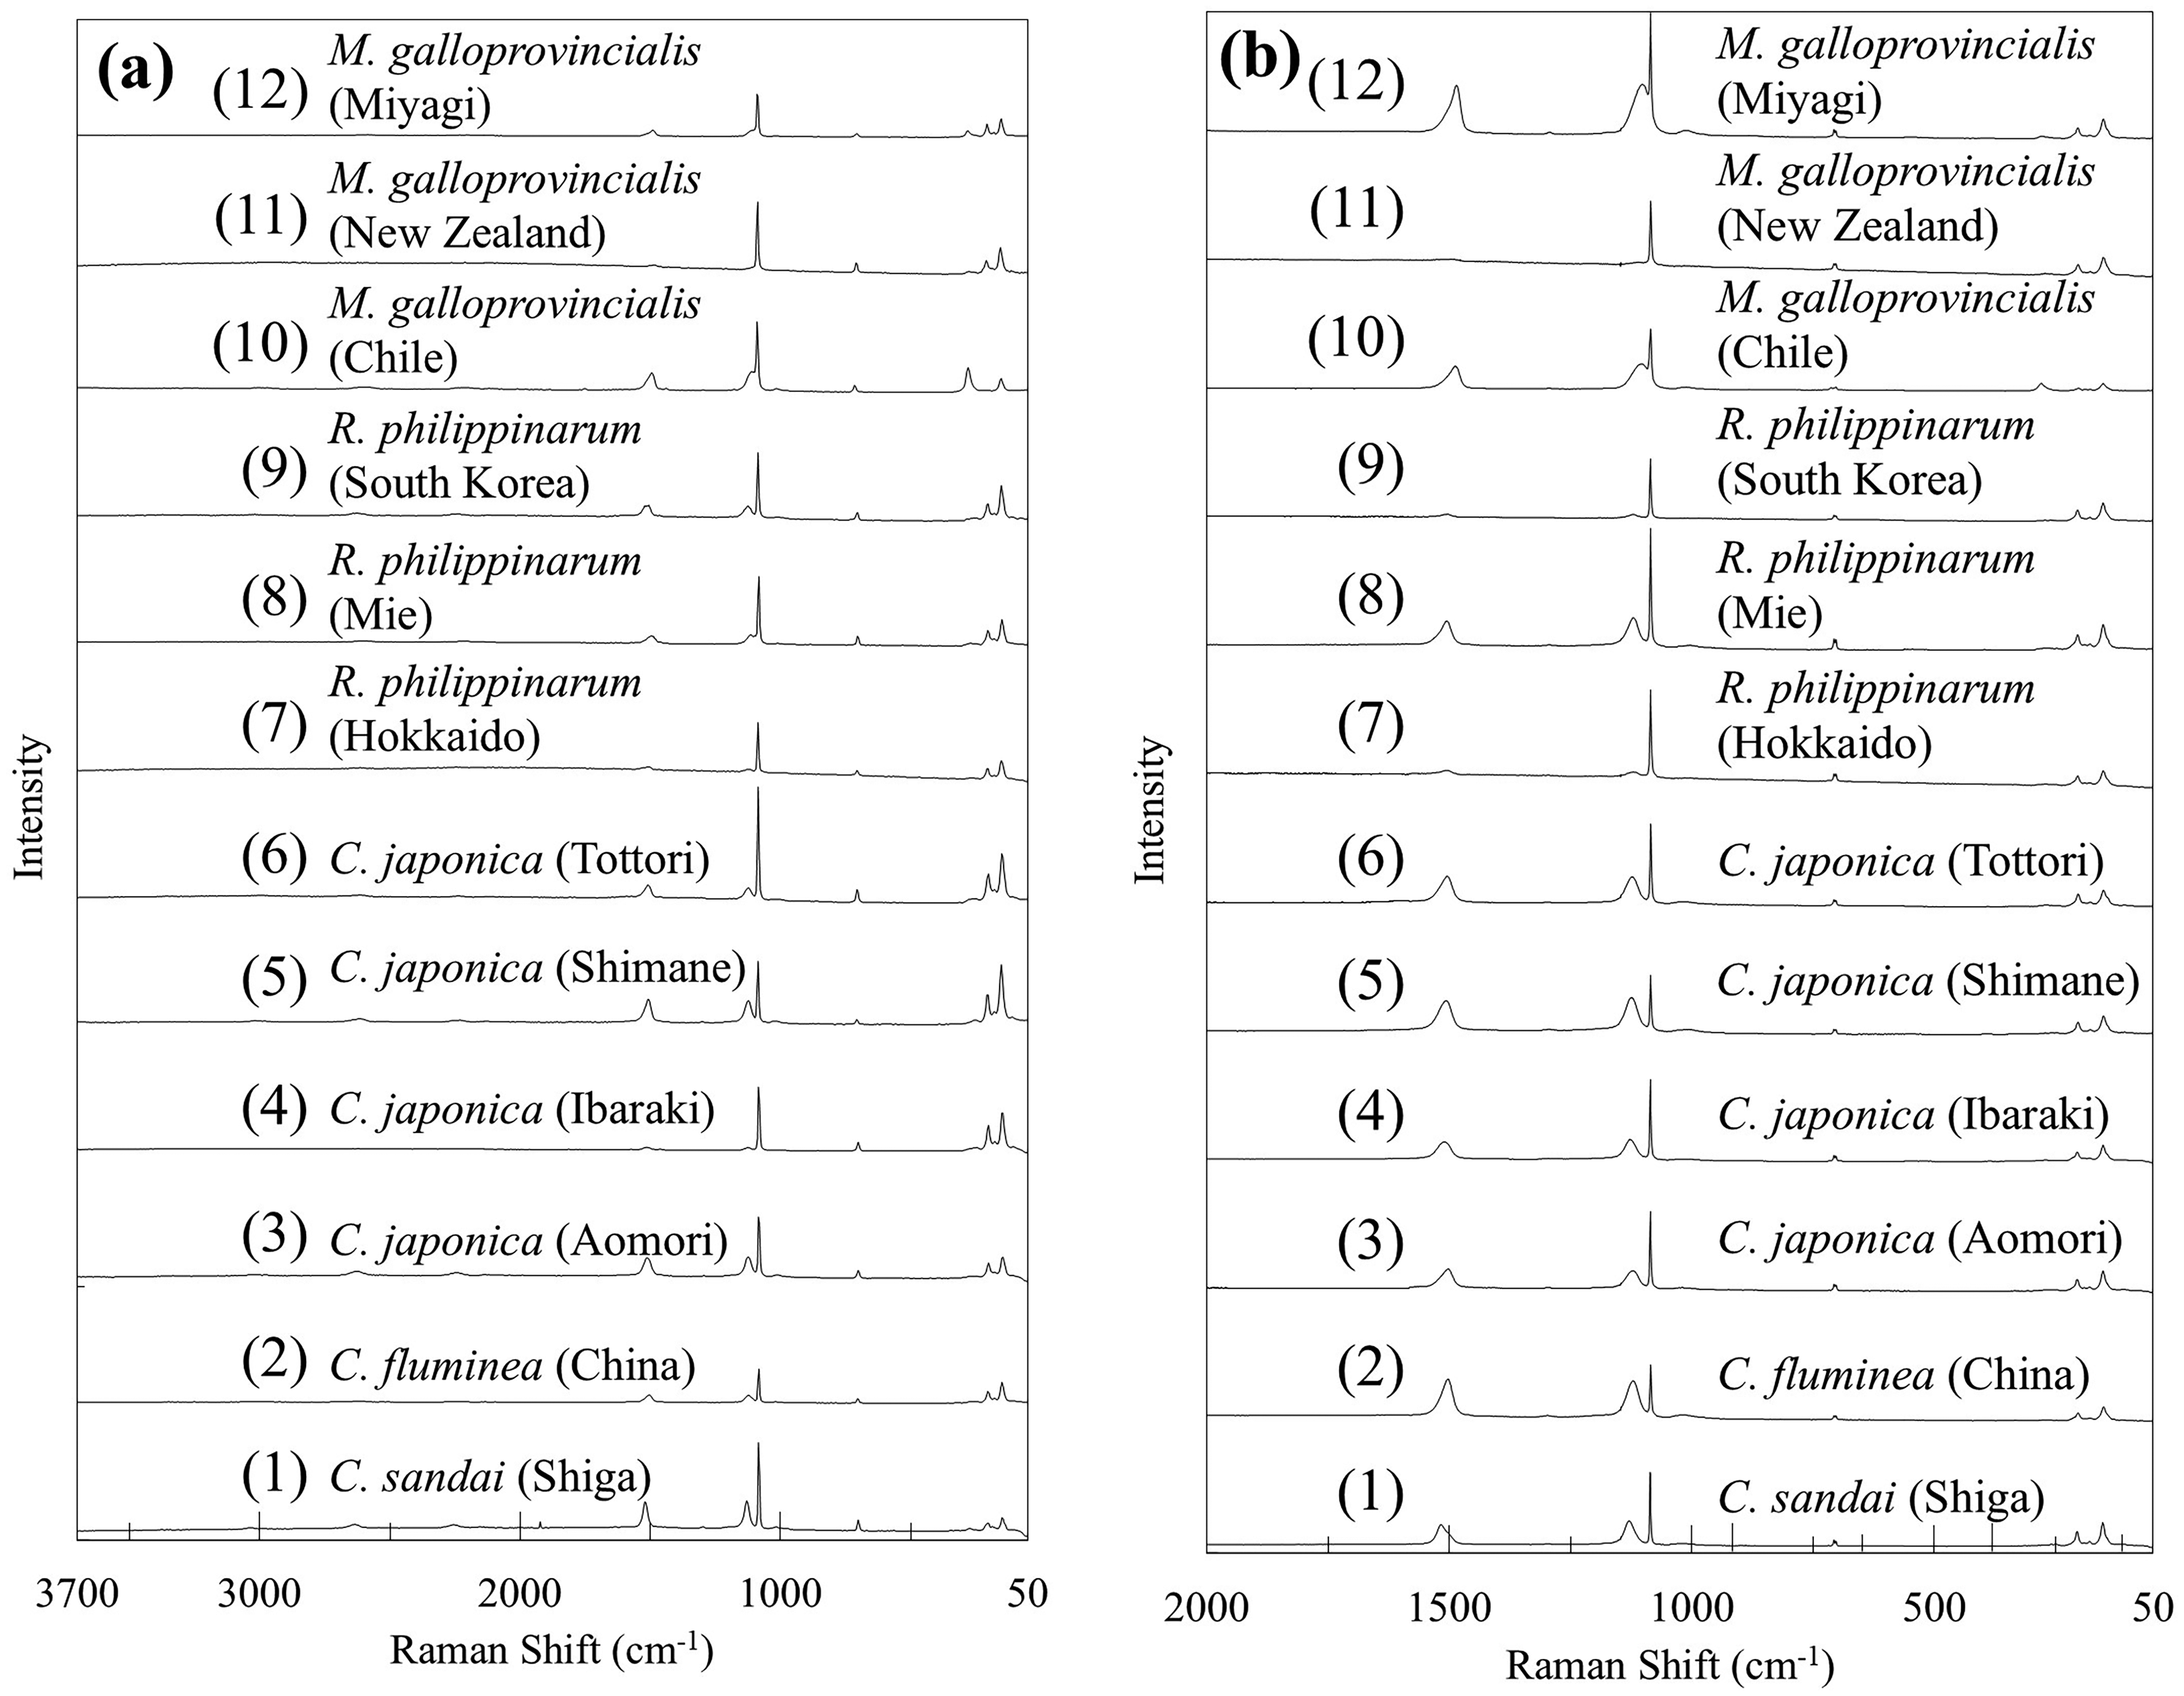
(a) Raman spectra in the 3700–50 cm–1 region of shells measured using 600 gr/mm grating, and (b) Raman spectra in the 2000–50 cm–1 region of shells measured using 1800 gr/mm grating.
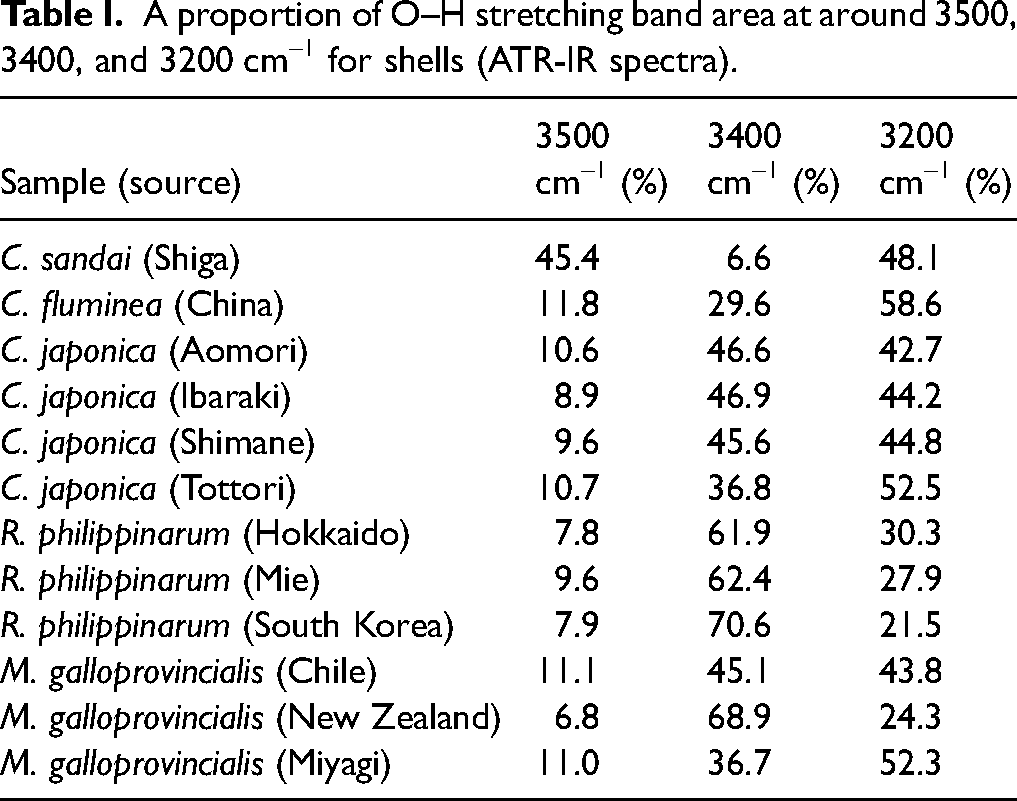
The enlarged spectra of Figure 1 are displayed in Figure 3a for the 4000–2800 cm–1 region, Figure 3b for the 1800–800 cm–1 region, and in Figure 3c for the 1750–1600 cm–1 region. In the 4000–3000 cm–1 region (Figure 3a), O–H stretching bands of water are observed, and the differences of their band shapes among the IR spectra of these shells were noted. It has been reported that the O–H stretching band of water split into three components depending on the presence and strength of hydrogen bonds. 28 In addition, Czarnik-Matusewicz et al. 29 reported that the band at around 3400 and 3200 cm–1 are assigned to WHB and SHB, respectively. However, in previous studies on mineral analysis, attention has primarily been focused on the total area of the O–H region, 13 with little emphasis placed on the individual bands associated with hydrogen bonding. Hence, we hypothesized that the O–H stretching band of minerals would also separate into three components, and we performed a curve fitting using the pseudo-Voigt function, 30 the linear combination of Gaussian and Lorentzian, with initial conditions set at peak positions of 3500, 3400, and 3200 cm–1 as a new approach (Figure 4). The region of 4000–3000 cm–1 contains bands due to WHB and SHB species of fluid water and bands arising from various kinds of bound water species. In Figure 4, we considered that these three bands were due to bound water, WHB and SHB, respectively. The fitting results (Table I) showed that the proportion of WHB was relatively high in all specimens of Ruditapes philippinarum and SHB was relatively high in some Corbicula species. Furthermore, the proportion of three bands were quite unique in Corbicula sandai. The ratio of SHB/WHB was high in Corbicula sandai and Corbicula fluminea, which live in freshwater environment. Among Corbicula japonica, the SHB/WHB ratio varied: it was relatively high in Tottori and relatively low in Aomori. The habitat in Aomori (Lake Jusan-ko) is directly connected to the sea, while the habitat in Tottori (Lake Togo-ike) is located about 2 km inland. This difference may be attributed to salinity difference of their habitats. Among Mytilus galloprovincialis, the ratio of SHB/WHB areas was relatively low in the Chile and New Zealand samples. In addition, when examined the region at around 1650 cm–1, which is assigned to H–O–H bending mode of water, it was found that the absorption band at around 1650 cm–1 for them was relatively stronger (Figure 3c). An absorption band due to H–O–H bending mode in ice, which has rigid hydrogen bonds, is very weak. 28 In other words, weaker hydrogen bonds result in stronger absorption in this band. This suggests that Mytilus galloprovincialis (Chile and New Zealand) may have weaker hydrogen bonds than other shells. These results revealed that the hydrogen bond state of water contained in the shells differs depending on the type and habitats of shellfish.
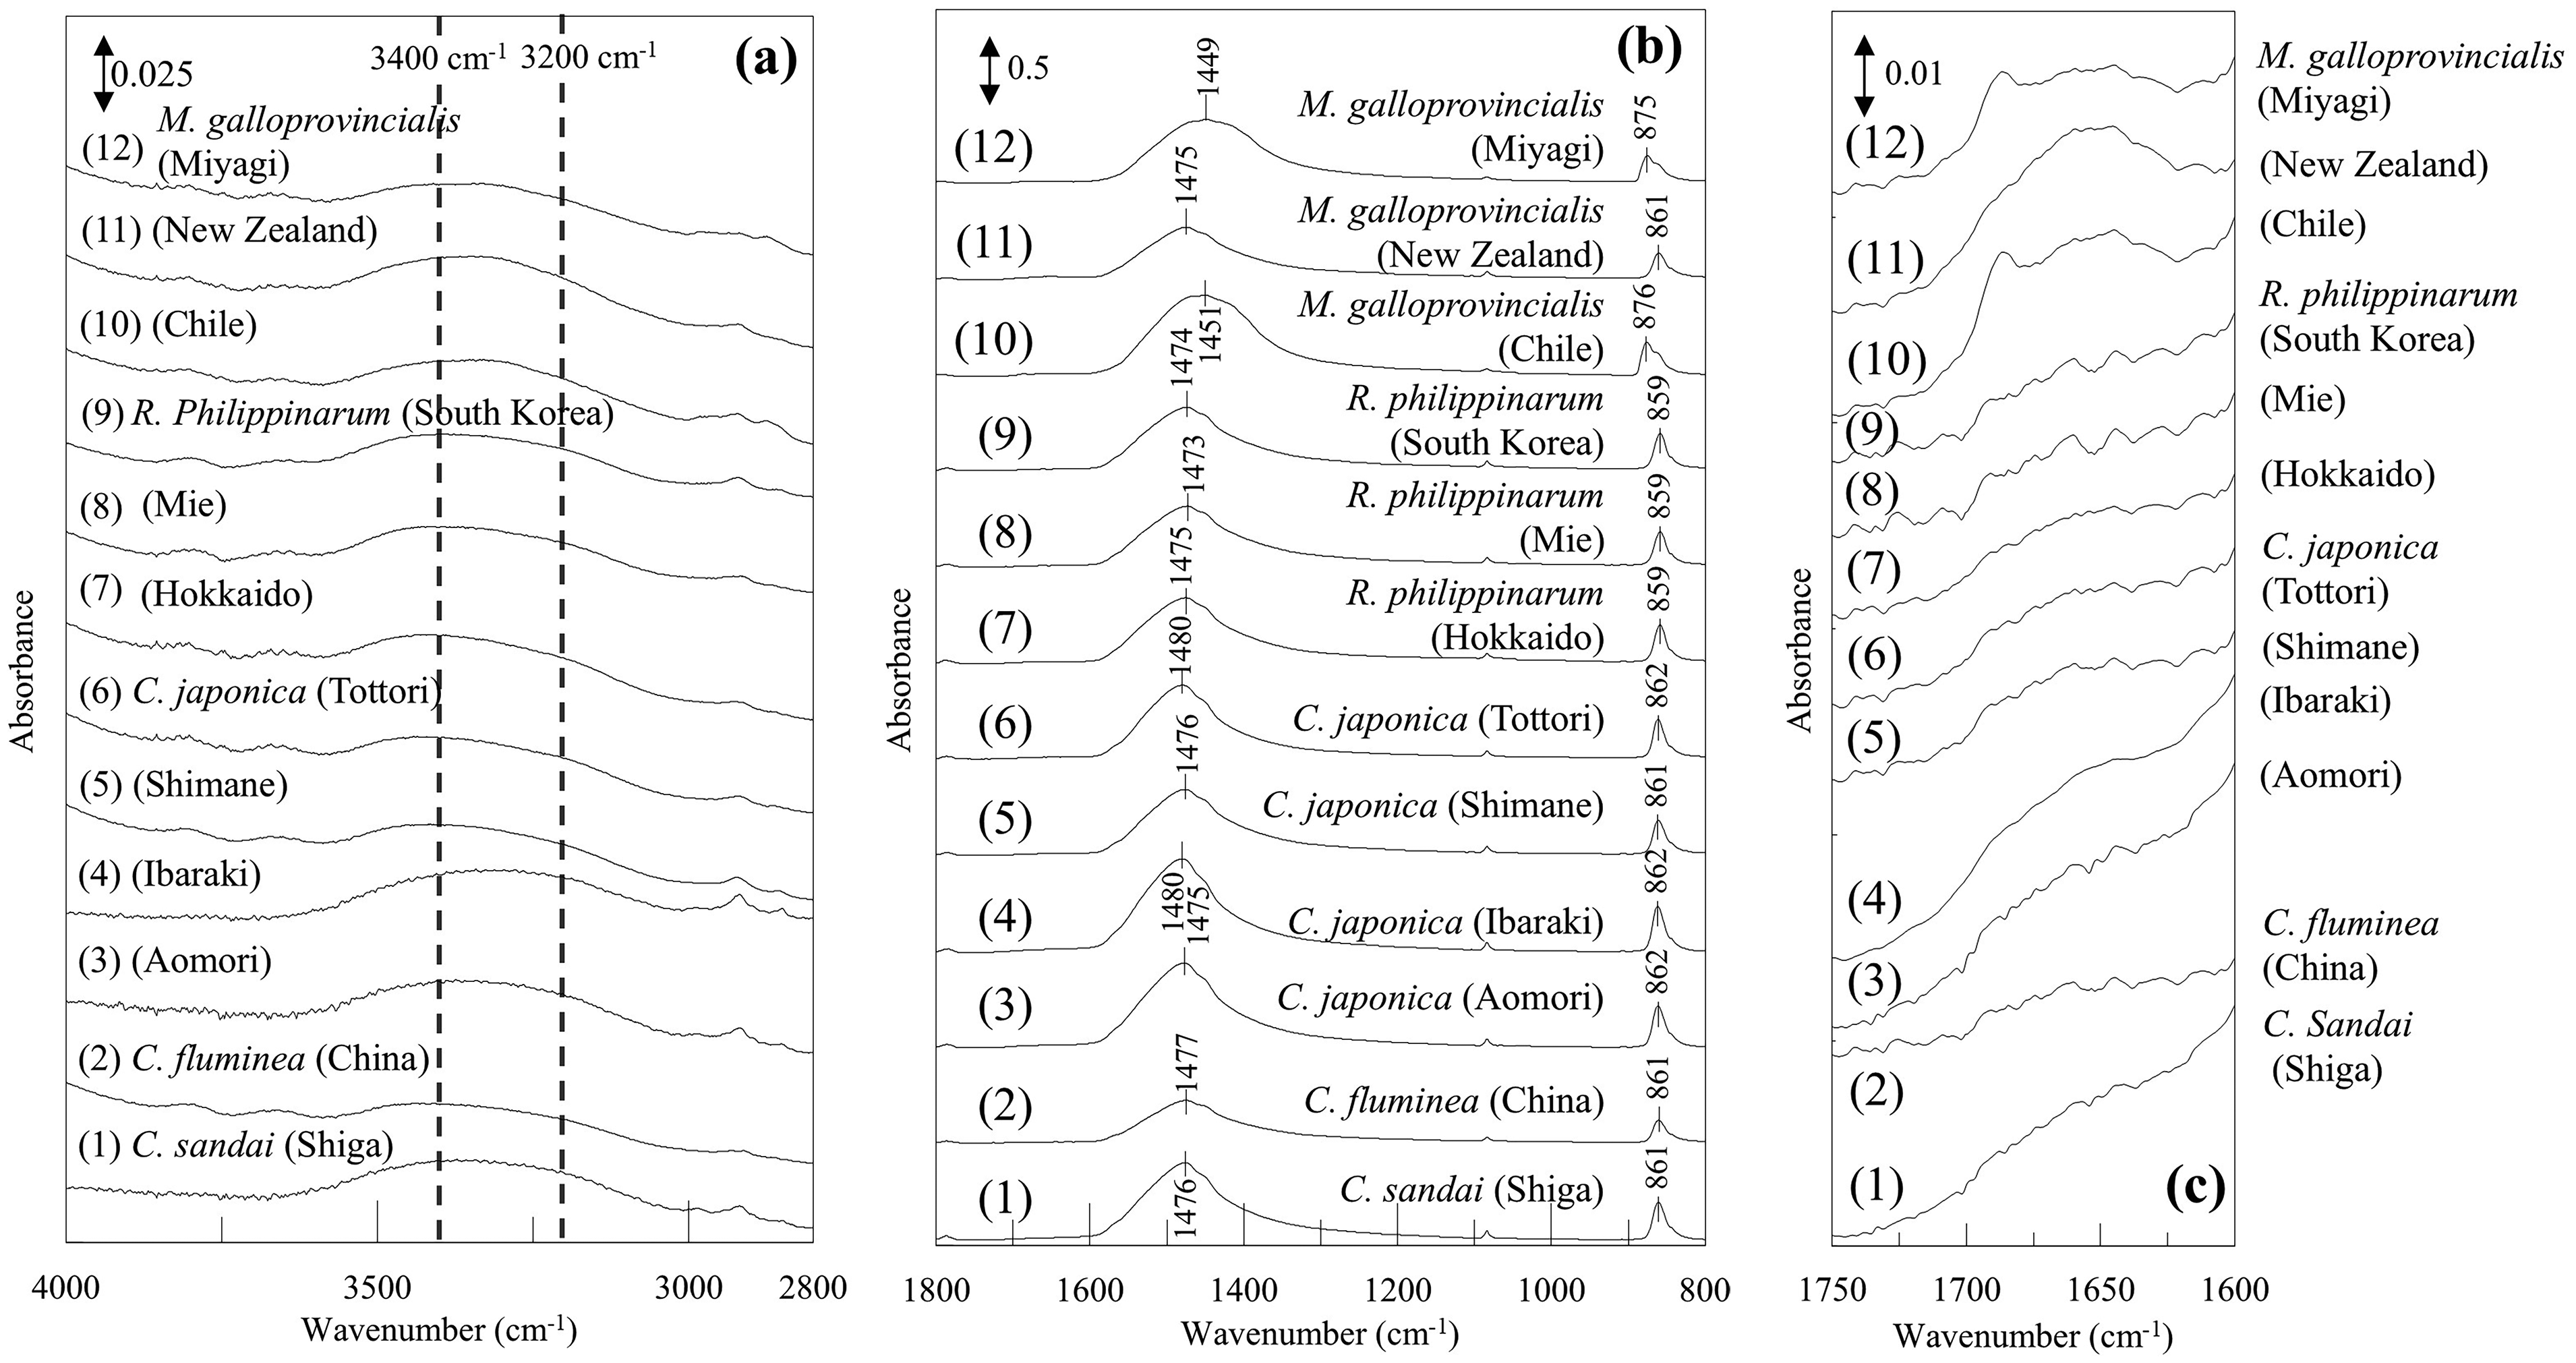
The enlarged ATR IR-FIR spectra in the (a) 4000–2800 cm–1 region, (b) in the 1800–800 cm–1 region, and (c) in the 1750–1600 cm–1 region of Figure 1.
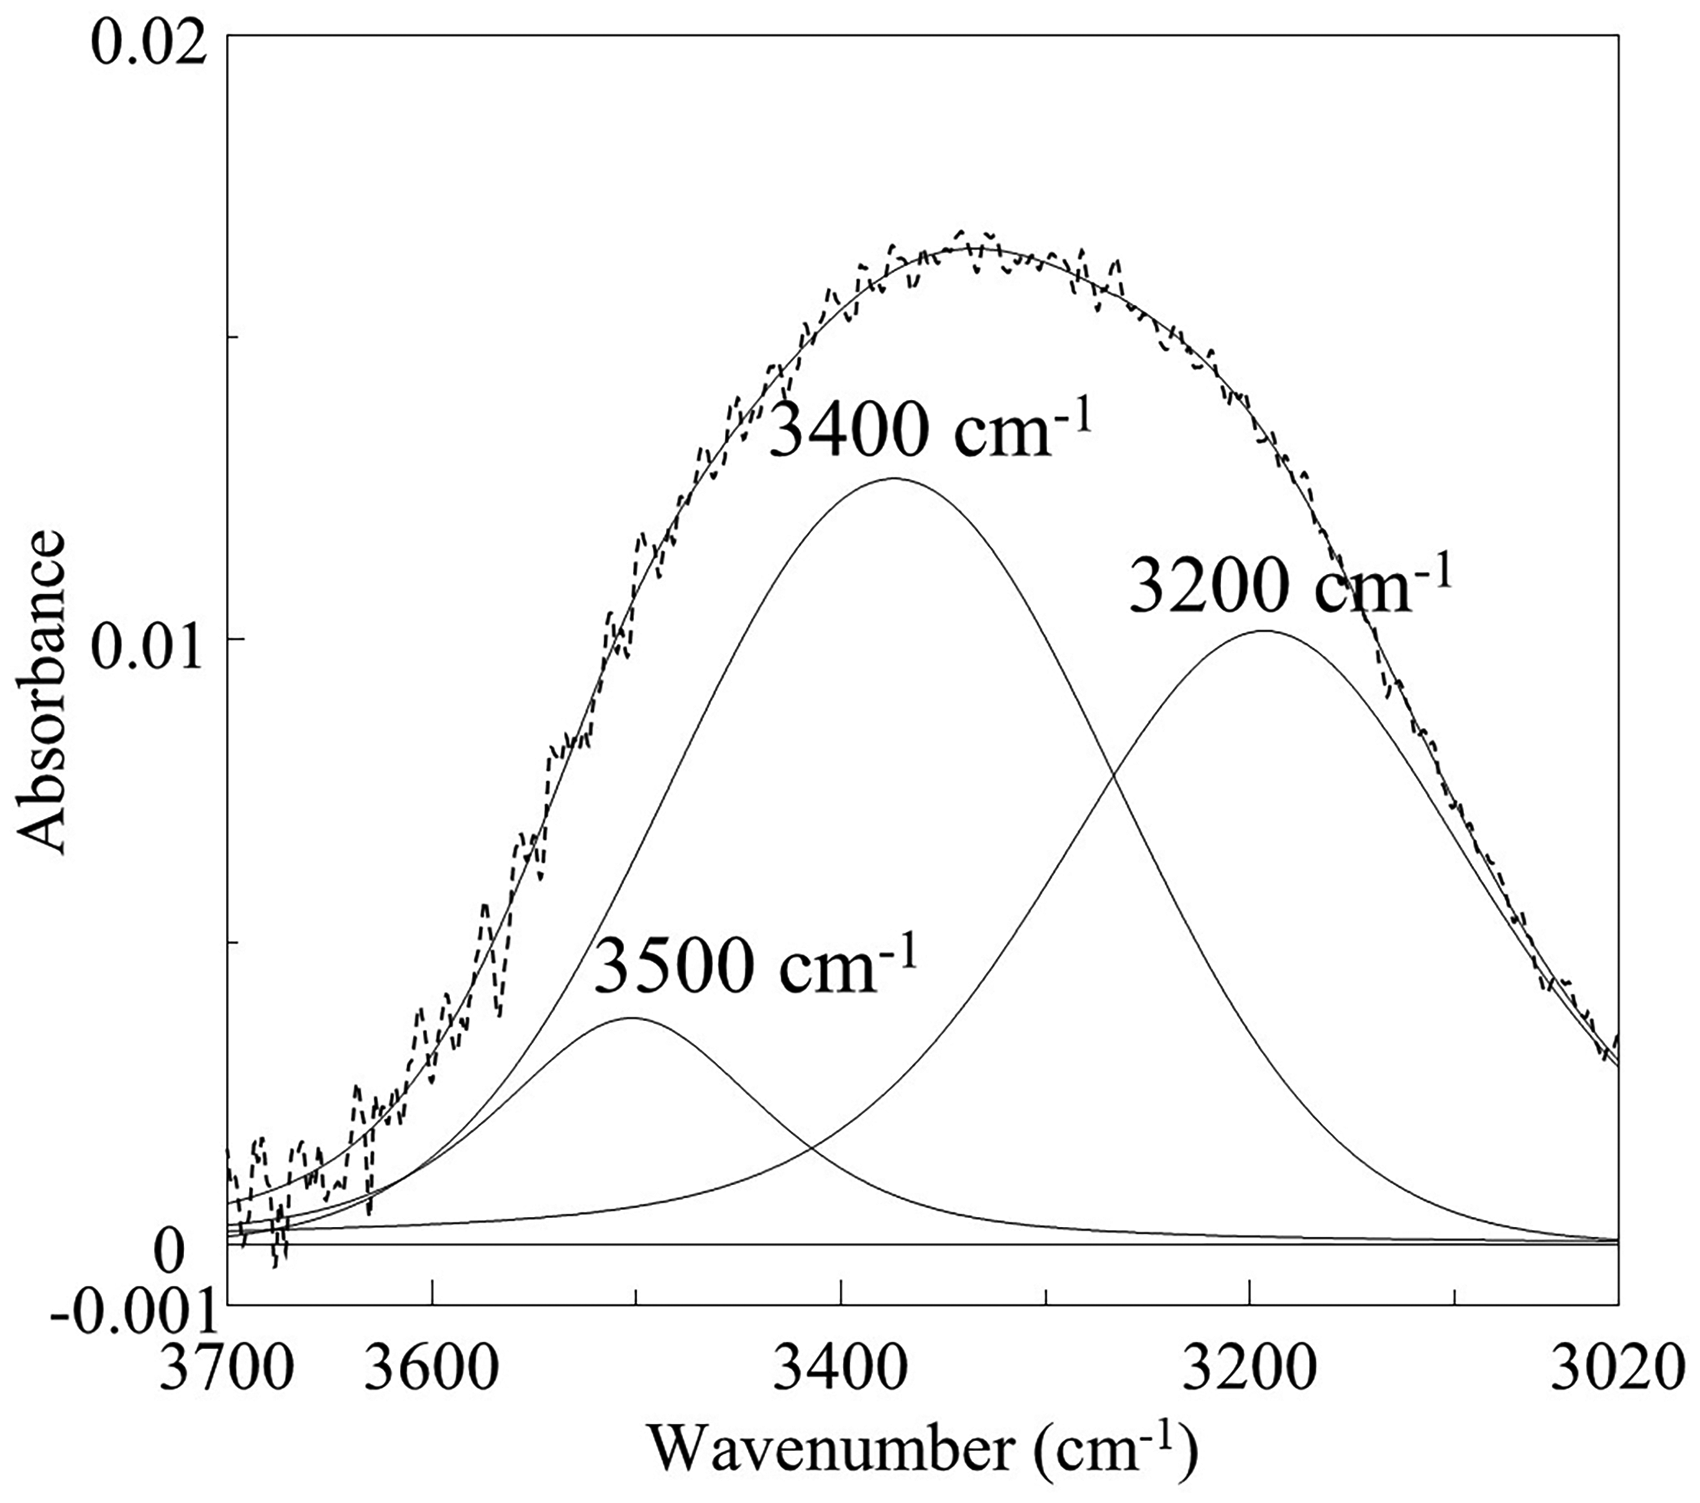
The fitted ATR-IR spectrum by pseudo-Voigt function in the O–H stretching absorption bands (baseline corrected, this spectrum is for C. japonica (Aomori) as an example. Dashed line: raw spectrum. Solid lines: fitted bands.
A proportion of O–H stretching band area at around 3500, 3400, and 3200 cm–1 for shells (ATR-IR spectra).
Study of Crystal Structure in the 1600–500 cm–1 Region
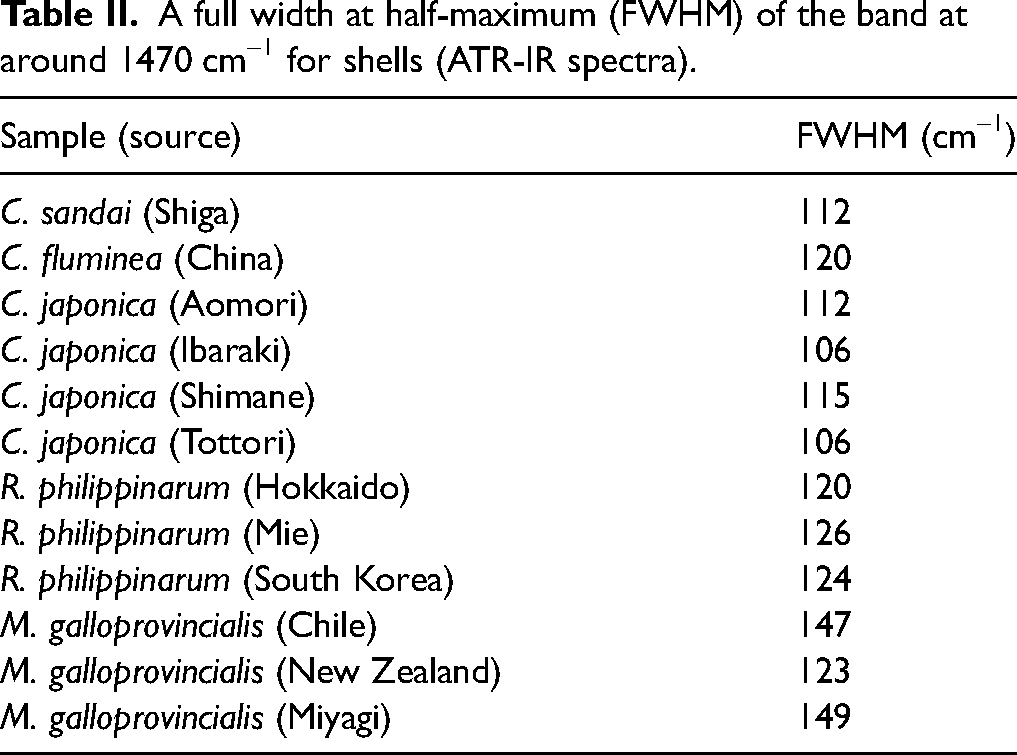
Next, we investigated the peak positions and FWHMs at around 1470 cm–1 and 860 cm–1, which are assigned to the CO32– asymmetric stretching 22 and CO32– out-of-plane bending, 16 respectively (Figure 3b, Table II). In the 1600–1400 cm–1 region, all Corbicula species and Ruditapes philippinarum had a peak at around 1475 cm–1, indicating that they are all aragonite. 31 In contrast, the result for Mytilus galloprovincialis was different. The crystal structure of Mytilus galloprovincialis (New Zealand) was predominantly aragonite, similar to the Corbicula species and Ruditapes philippinarum. However, for Mytilus galloprovincialis (Chile and Miyagi), the peak position was found at around 1450 cm–1 and the FWHM of this band was relatively larger, suggesting that they were mainly composed of calcite. 31 Both the band at 875 cm–1 and its shoulder band at around 860 cm–1 band (calcite and aragonite, respectively) 22 were observed in the shells of Mytilus galloprovincialis (Chile and Miyagi), suggesting that a certain amount of aragonite is also present in Mytilus galloprovincialis (Chile and Miyagi). It is known that the crystal structure of calcium carbonate, the main component of Mytilus galloprovincialis, contains both calcite and aragonite. 32 Furthermore, this result revealed that the ratio of aragonite to calcite varies depending on their growing environments such as their habitats. There are several reports where the crystal structure of biogenic minerals changes depending on the growing environments. For example, the proportion of amorphous calcium carbonate increases in Mytilus galloprovincialis when the concentration of carbon dioxide in seawater increases. 32 Additionally, the proportion of calcite increases in corals when the ratio of Mg–Ca in seawater decreases. 33 These findings suggest that analyzing the crystal structures of shells can provide clues when investigating their growing environments, also in the case of Mytilus galloprovincialis. For the band at around 860 cm–1, the differences in the peak position were also observed among the aragonite-type shells. The peak position of all Ruditapes philippinarum samples was approximately 3 cm–1 lower than that of all Corbicula species samples (Figure 3b). It has been reported that such shifts occur depending on the type of cation. 34 However, all bands exhibited shifts in that study. In contrast, the shift was observed only in the band at around 860 cm–1 in our current study, suggesting other factors such as the influence of hydrogen bonds may be involved. The spectral features of all Ruditapes philippinarum in the 4000–3000 cm–1 region were also distinct from those of other species, further supporting the hypothesis that the shift is related to the influence of water.
A full width at half-maximum (FWHM) of the band at around 1470 cm–1 for shells (ATR-IR spectra).
In the 2000–500 cm–1 region of the Raman spectra (Figure 2b), bands attributed to calcium carbonate were noted at 1083 and 705 cm–1. Although the differences were not significant compared with the IR spectra, slight variations in peak positions were detected in Mytilus galloprovincialis (Chile and Miyagi), which includes calcite, compared with other shellfish. In addition, bands derived from polyenes, which are thought to be due to resonance Raman scattering, were observed at around 1500 cm–1 (C=C) and 1120 cm–1 (C–C). Several resonance Raman studies have been carried out for polyenes such as carotenoids found in mollusks, including shellfish. 35 In this study, it was found that the peak positions varied depending on the samples, suggesting that resonance Raman scattering may be useful for characterizing and identifying biogenic minerals, such as determining their origin and habitat. We will soon report more detailed study of resonance Raman scattering bands in the shells separately.
As a result, the 4000–500 cm–1 region of both IR and Raman spectra can be used to distinguish shellfish from different habitats and species. The notable points are as follows: First, the O–H absorption in the IR spectra (in the 4000–3000 cm–1 region and around 1650 cm–1 region) revealed differences in water contents and hydrogen bonds, proving effectiveness for distinguishing shellfish species. Second, Mytilus galloprovincialis from different origins could be distinguished by the differences between aragonite and calcite in the CO32– stretching at around 1470 cm–1 in the IR spectra. Finally, the peak positions of the bands at around 1500 cm–1 and 1120 cm–1 due to resonance Raman scattering in the Raman spectra also varied depending on the samples.
Study of Lattice Vibration Modes Below the 500 cm–1 Region
We paid attention to the low-frequency regions where information about the lattice vibration modes of crystal is typically found. Figure 5 shows an enlarged view of the 500–50 cm–1 (FIR) region of the IR spectra from Figure 1. Similarly, Figure 6 presents an enlarged view of the 500–50 cm–1 region of Raman spectra from Figure 2b. Similar to the difference observed in the IR spectra at around 1450 cm–1, a significant difference was detected in the Raman spectra in the 300–100 cm–1 region (Figure 6) of Mytilus galloprovincialis (Chile and Miyagi), which contains calcite. In Figure 5, bands attributable to the lattice vibration modes of calcite 36 were presented at 326, 231 and 112 cm–1 in Mytilus galloprovincialis (Chile and Miyagi). Additionally, focusing on the spectra of Mytilus galloprovincialis (Chile and Miyagi), it was found that the peak position of the band at 326 cm–1 for Mytilus galloprovincialis (Miyagi) was at a lower wavenumber than that for Mytilus galloprovincialis (Chile), suggesting that while the signal derived from hexagonal calcite is dominant, orthorhombic aragonite is also included. In the Raman spectra shown in Figure 6, a band characteristic of calcite was observed at around 280 cm–1 in Mytilus galloprovincialis (Chile and Miyagi), with a more prominent peak in Mytilus galloprovincialis (Chile). On the other hand, bands characteristic of aragonite 21 were also detected at 204 and 152 cm–1 in Mytilus galloprovincialis (Miyagi). This suggests the presence of both calcite and aragonite, as seen in the results in FIR region. In the wavenumber region above 500 cm–1, both IR and Raman spectra can distinguish calcite and aragonite; however, it is challenging to determine whether they are mixed or consist only of one component. Nevertheless, information from the low-frequency region allowed to clearly determine that the two components were mixed. Specifically, in the case of Mytilus galloprovincialis (Miyagi), the IR spectrum resembled that of calcite, while the Raman spectrum was similar to that of aragonite. In other words, it is suggested that using both IR and Raman spectroscopies, the crystal structures of both aragonite and calcite can be detected more reliably, even when both are present in small proportions. Therefore, it was demonstrated that utilizing both IR and Raman spectra in the low-frequency region, differences in the crystal structures of biogenic minerals can be explored in detail.
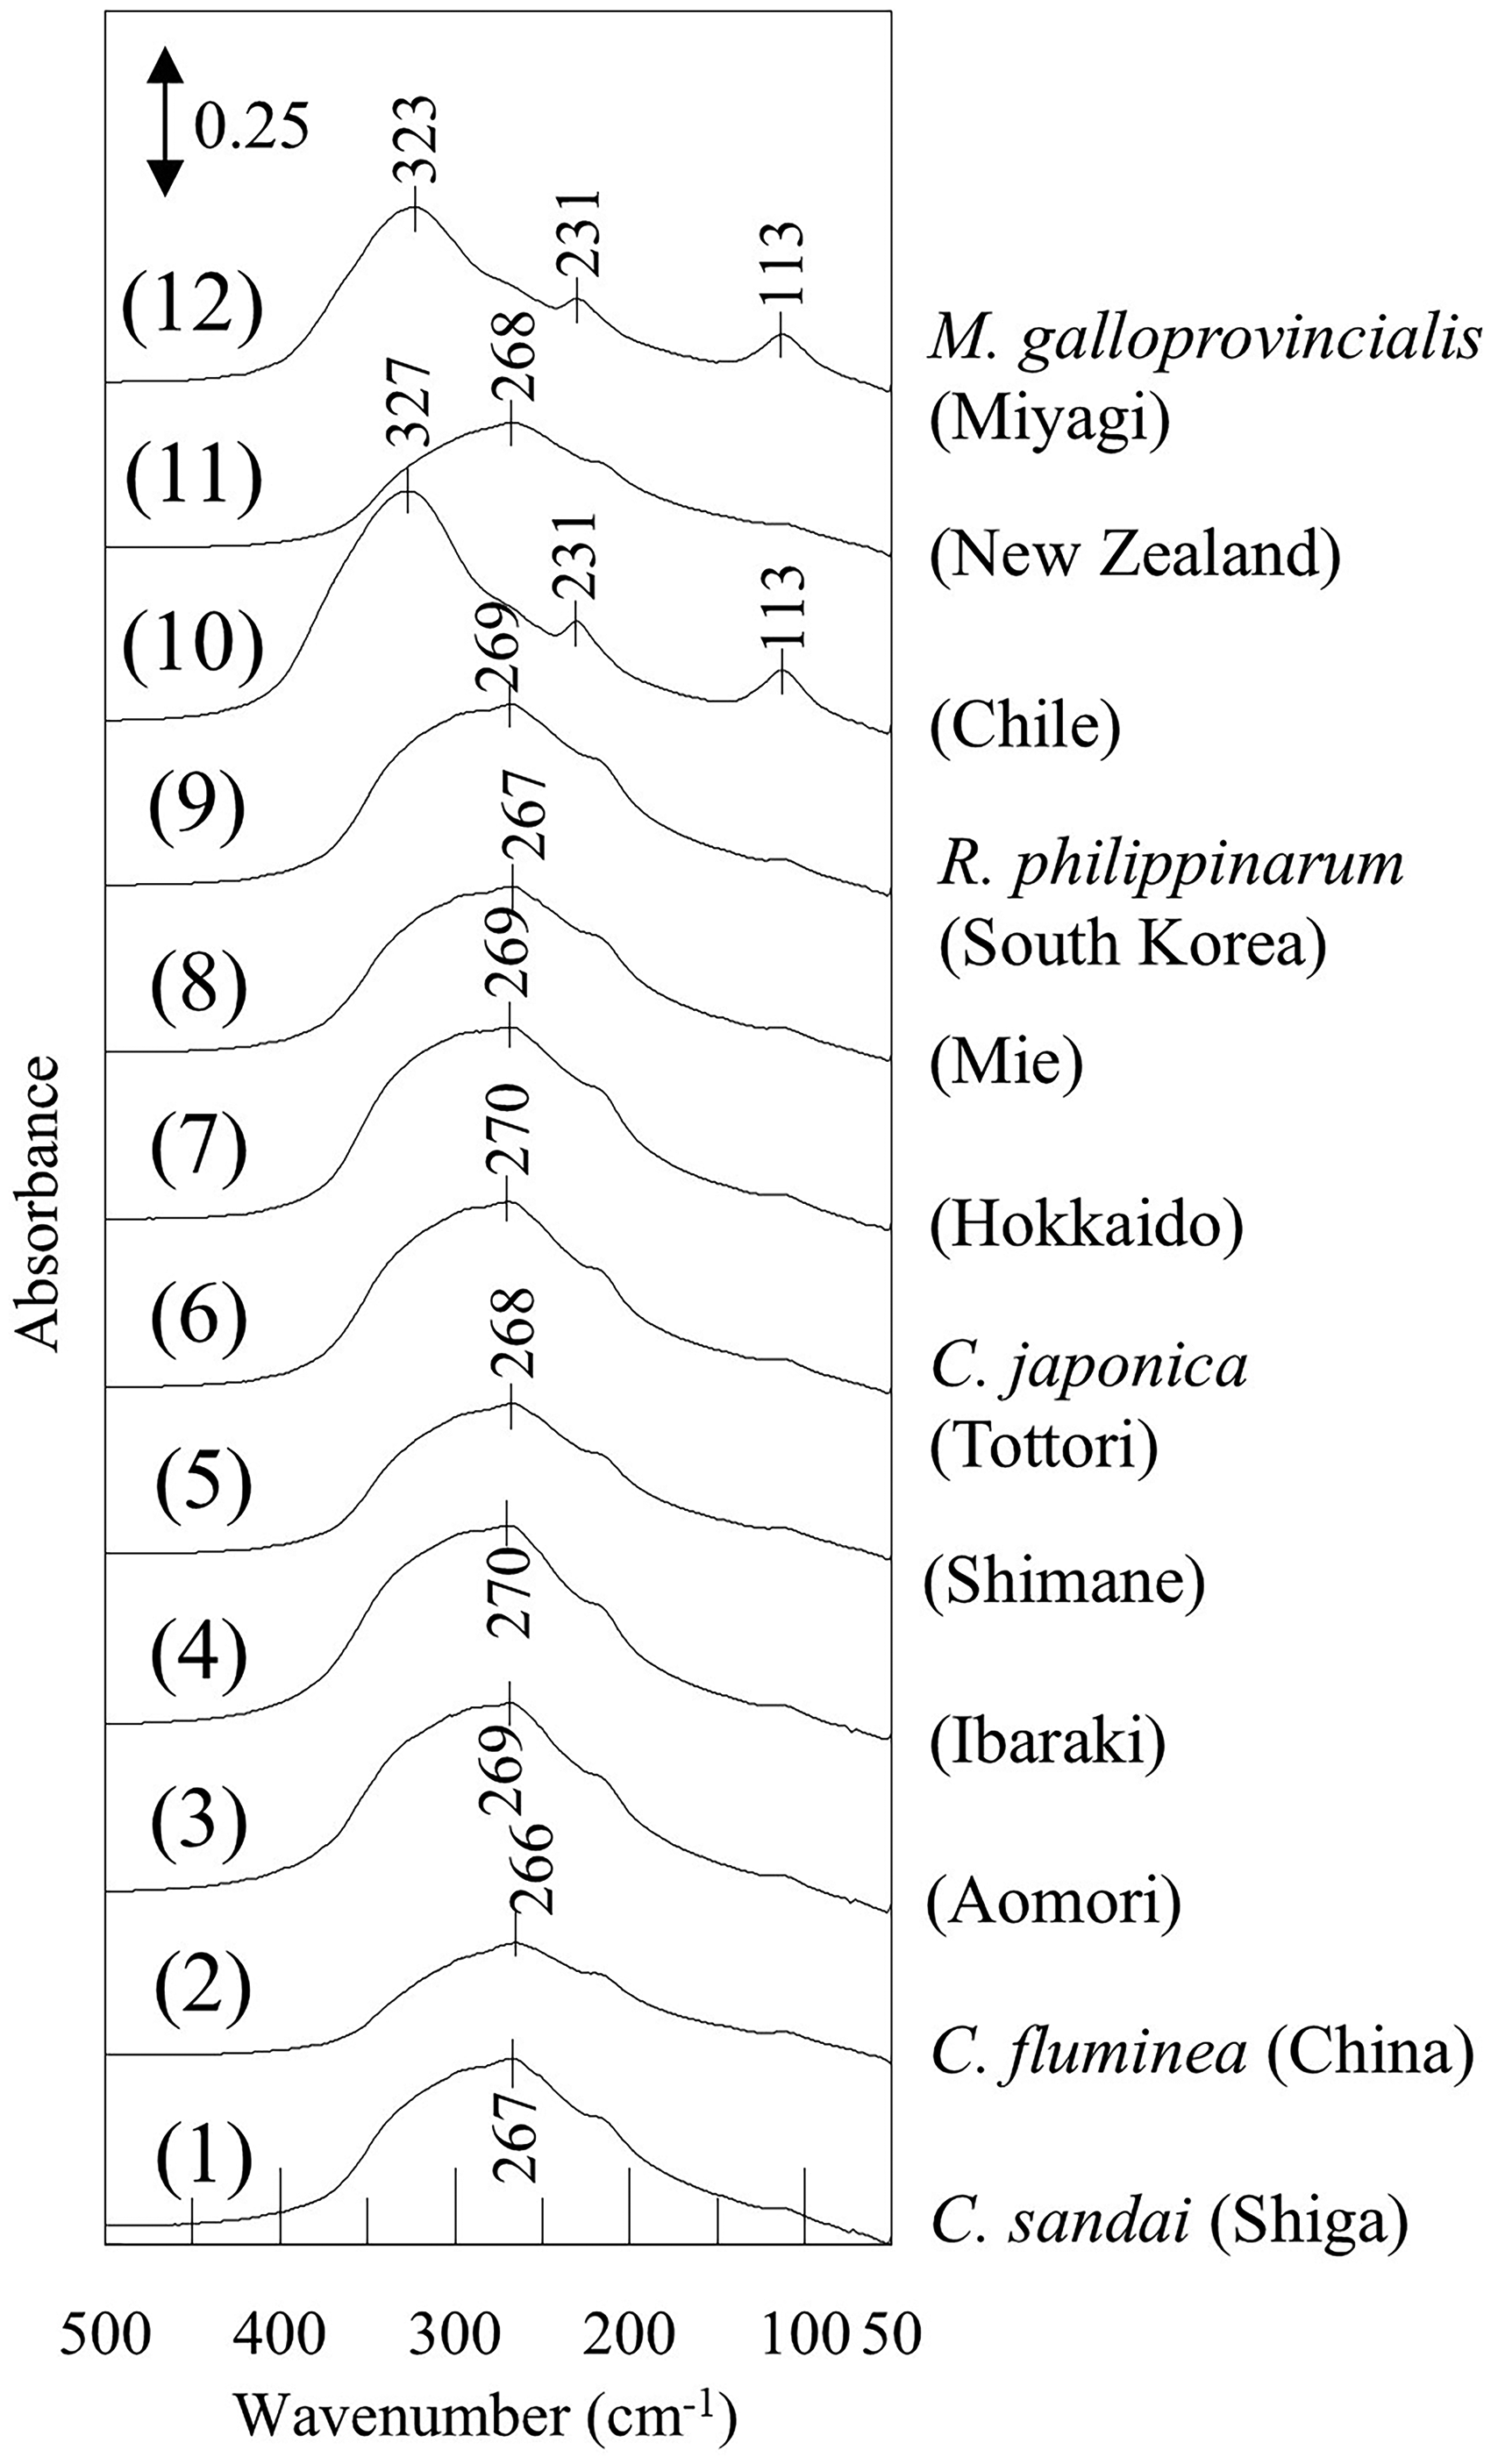
The enlarged ATR-FIR spectra in the 500–50 cm–1 region of Figure 1.
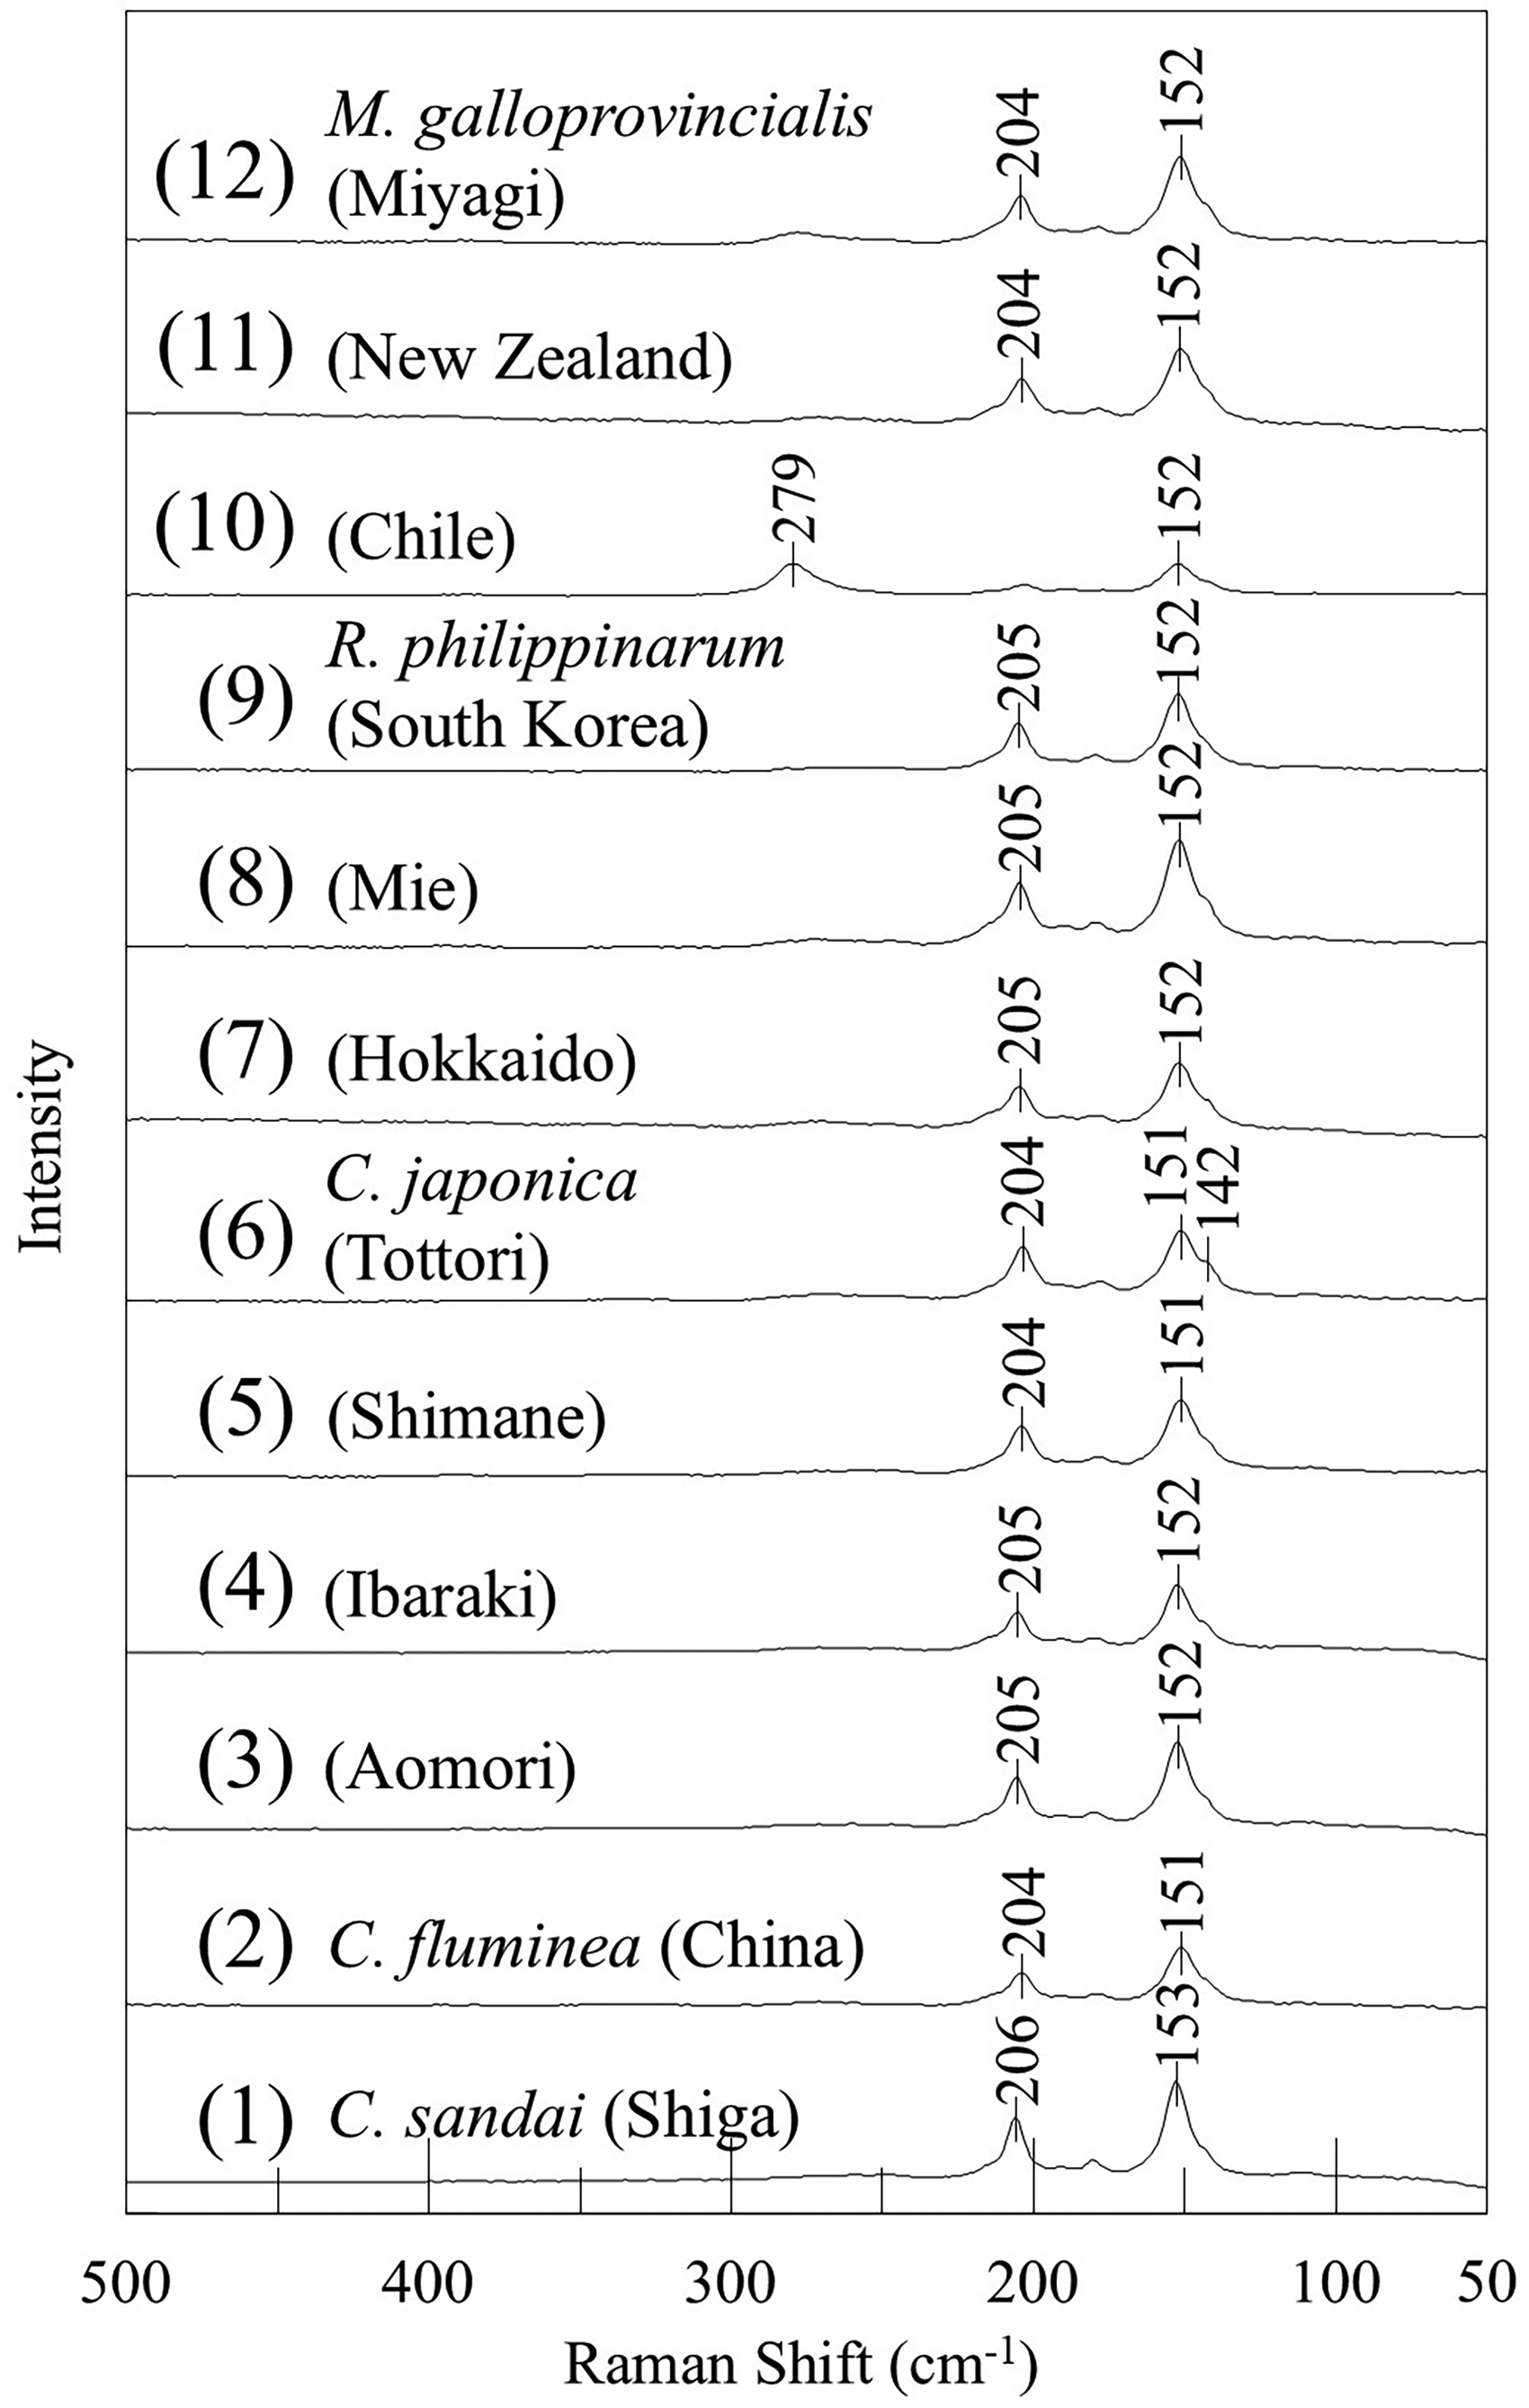
The enlarged Raman spectra in the 500–50 cm–1 region of Figure 2b.
As further discussion, in addition to differences in crystal structures, we aimed to identify differences within the same aragonite species. The lattice vibration modes of aragonite have been extensively investigated using both IR and Raman spectroscopies, with specific assignments provided in previous studies.16,21–24,31,36,37 Orthorhombic aragonite consists of four molecules per unit cell,
37
and is represented as D2h in Schönflies notation.
38
In the irreducible representation of D2h, there are eight symmetry species (Ag, Au, B1g, B1u, B2g, B2u, B3g and B3u) for aragonite. Among these, Au is inactive for both IR and Raman spectroscopies. B1u, B2u, and B3u are IR active, with vibration modes parallel to the x-, y-, and z-axes of the crystal, respectively. Ag, B1g, B2g, and B3g are Raman active. Active modes of these species are following. Ag is for αxx, αyy, and αzz, B1g is for αxy, B2g is for αxz, and B3g is for αyz, respectively.
37
As described in the experimental section, the optical system of the Raman spectrometer used in this study can be roughly considered as
In the FIR region (Figure 5), all shells composed solely of aragonite have the broad feature at 267 cm–1. This band corresponds to the anti-translatory vibration mode of lattice vibration modes. 23 It consists of three bands assigned to B1u, B2u, and B3u species. 23 Though B1u, B2u, and B3u modes will be influenced by the orientation of samples as mentioned above, we did not consider about it. Because, all shells were powdered, the crystal orientation was homogenized, and the optical system for IR measurement was not polarized in this study. In addition, these three bands overlap at intervals of approximately 20 cm–1 and their FWHM is broad. 36 The peak positions of these three bands could not be successfully resolved, even with the use of second derivative spectra. Therefore, B1u, B2u, and B3u species could not be distinguished from one another. For this reason, the bands at around 267 cm–1 were treated as a single band for simplicity, and its FWHM was evaluated among samples to investigate the differences in their habitats and species (Table III). The FWHM values of all Ruditapes philippinarum, growing in tidal flats with salinity close to that of seawater (approximately 2–3%), and Corbicula japonica (Aomori), growing in the brackish lake (Lake Jusan-ko) directly connected to the sea as mentioned above, were both approximately 150 cm–1. In contrast, the FWHM of Corbicula fluminea growing in freshwater was about 140 cm–1, the smallest among the aragonite-composed shells measured in this study. The FWHM of Corbicula japonica (Ibaraki, Shimane, and Tottori) growing in brackish lakes with a salinity of approximately 0.3–0.5% (about 1/10 that of seawater) was about 145 cm–1, which is intermediate between the FWHM of shellfish growing in freshwater (Corbicula fluminea) and those growing in environments with salinity close to seawater (Ruditapes philippinarum and Corbicula japonica (Aomori)). This result indicates that the FWHM of the band at 267 cm–1 in aragonite-composed shells is correlated with the salinity of their growing environments. Although Corbicula sandai was grown in freshwater, its FWHM was relatively large. The results of the O–H stretching analysis in the 4000–3000 cm–1 region for Corbicula sandai discussed above were unique. Therefore, Corbicula sandai appears in distinct state compared to the other shellfish species, and the hypothesis mentioned above did not seem to apply in this case. In addition, since Mytilus galloprovincialis contains both calcite and aragonite and the FWHM of its band at 267 cm–1 is relatively small, Mytilus galloprovincialis samples were excluded from this comparison.
A full width at half-maximum (FWHM) of the band at around 267 cm–1 for shells (ATR-FIR spectra).
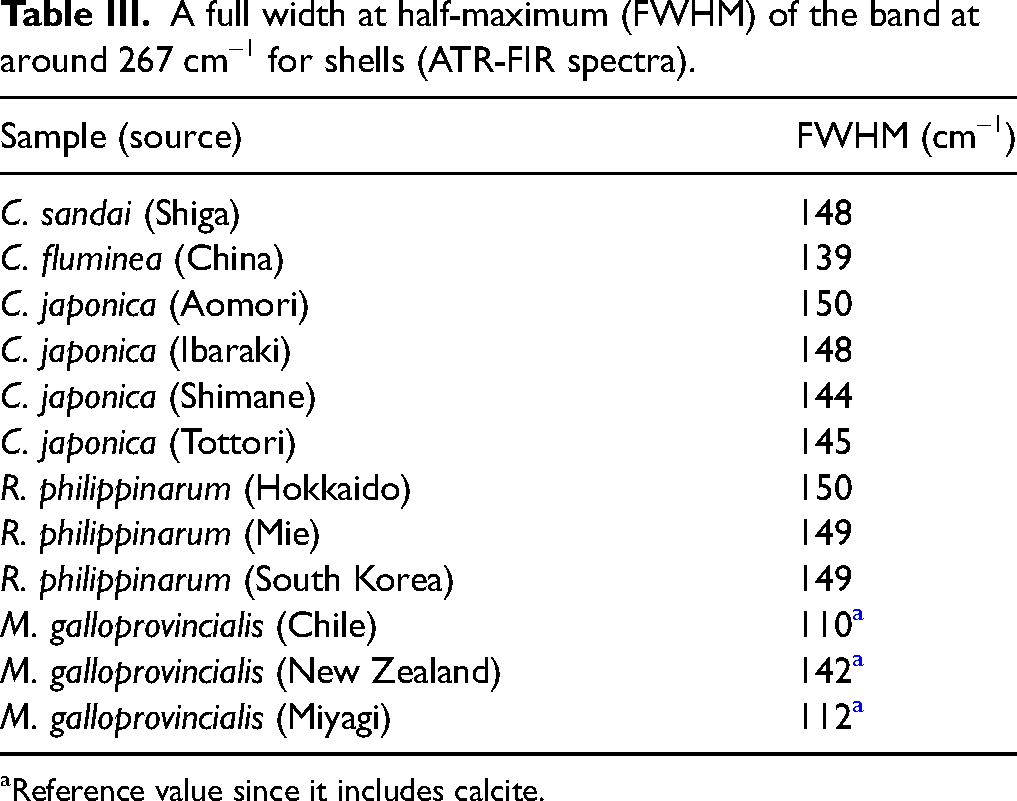
Reference value since it includes calcite.
In the Raman spectra below 500 cm–1 of aragonite-composed shells (Figure 6), significant bands were observed at 204 and 152 cm–1. The band at 152 cm–1 is attributed to translational vibration modes of lattice vibration, while the band at 204 cm–1 is assigned to the librational mode. 24 In the IR spectra shown in Figure 5, broad and strong band(s) attributed to anti-translational vibration was detected at around 267 cm–1, whereas only weak bands due to the librational mode 36 were seen at 215 and 110 cm–1. This clearly indicates the complementarity of IR and Raman spectroscopies. The shape and peak position of these prominent bands in the Raman spectra were nearly identical for each sample, and no significant differences were detected. However, a shoulder band was observed at around 140 cm–1 in the Raman spectra of some samples upon detailed examination. When this shoulder band was present, the FWHM of the entire band at 152 cm–1 increased. Therefore, the FWHM of the 152 cm–1 band, including the shoulder band at around 140 cm–1, was calculated (Table IV), revealing that the FWHM of the 152 cm–1 band was clearly larger in Corbicula japonica (Tottori) and smaller in Corbicula sandai. The band at 140 cm–1 corresponds to the external lattice vibration mode. 24 Therefore, the intensity of this band reflects the differences in the lattice vibrational states among the samples. Specifically, the external lattice vibration mode arises from the interaction between CO32– and the surrounding cations. This suggests that factors, such as the substitution of Ca2+ ions by other cations, influence the crystal structure. The trend observed for the shoulder band at 140 cm–1 differs from the FWHM of the band at around 267 cm–1 in the FIR spectra, implying that factors beyond the salinity concentration in the growing environments, such as variations in cation concentrations like Mg2+, may also influence the crystal state. 39 The band at 140 cm–1 (shoulder of the band at 152 cm–1) is regarded as the relative vibration of carbonates group with metal ions. Therefore, it is considered that substitution of metal cation will induce the appearance of this shoulder band.
A full width at half-maximum (FWHM) of the band at around 150 cm–1 for shells (Raman spectra).
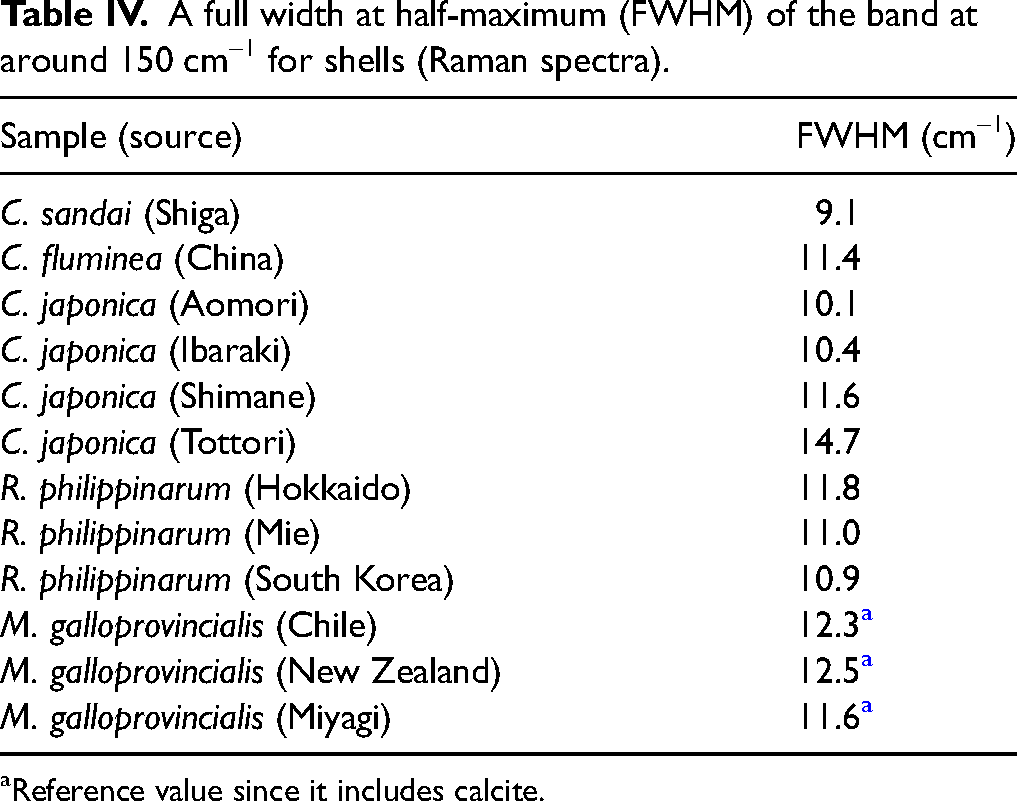
Reference value since it includes calcite.
The results above demonstrate that both IR and Raman spectra in the low-frequency region are useful for exploring differences in crystal forms. Furthermore, they enable a detailed analysis of the lattice vibrational states, potentially providing insights into the environment in which biogenic minerals form, including origin identification.
Conclusion
In this study, we emphasized shellfish that are sensitive to changes in their growing environments and analyzed twelve types of shells (biogenic minerals), with different habitats and species. Additionally, we tried to identify factors influencing the growing environments of biogenic minerals, using both IR and Raman spectroscopies, including the low-frequency regions for the first time.
In the 4000–1600 cm–1 region, we adopted the curve fitting method for the detailed analysis of O–H absorption bands in the 4000–3000 cm–1 region as a new approach for the analysis of water in minerals, and valuable information was obtained from the IR spectra. As a result, the O–H absorption (in 4000–3000 cm–1 and around 1650 cm–1 regions) revealed that the contents of water and the state of hydrogen bonds varied depending on the shellfish species. In particular, the ratio of SHB/WHB was different among shellfish. Especially, among Corbicula japonica, it was suggested that the ratio is related to the salinity of their habitats. In the 1600–500 cm–1 region, the difference in the peak position of the CO32– stretching mode (at around 1470 cm–1) allowed us to distinguish Mytilus galloprovincialis from different habitats by evaluating the relative content of aragonite and calcite in the shells. Also, in the Raman spectra, we found differences in the peak positions of the bands (at around 1500 and 1120 cm–1) due to the resonance Raman scattering phenomenon for each sample. In the low-frequency region (500–50 cm–1), complementary information was obtained from both the FIR and Raman spectra for shellfish from different growing environments and species. In the Raman spectra, we disclosed differences in crystal forms (aragonite and calcite) depending on the habitats of Mytilus galloprovincialis, which were similar to the findings in the IR spectra (4000–500 cm–1). Additionally, the bands assigned to lattice vibration modes in the FIR and Raman spectra were analyzed in detail. As a result, it was revealed that the FWHM of the band at 267 cm–1 in the FIR spectra, assigned to the anti-translatory lattice vibration mode, correlated with the salinity of their growing environments. Although the differences among samples were small in the Raman spectra, we identified differences in a shoulder band at around 140 cm–1, which is attributed to an external lattice vibration, and these were considered to arise from the presence of cations other than Ca2+. In this study, we investigated only bivalve mollusks; however, it is expected that the findings will also be applicable to the analysis of other shells and gemstones derived from biogenic minerals.
Through these findings, we demonstrated that IR and Raman spectroscopies, including the low-frequency regions, are beneficial for identifying the habitats and growing environments of biogenic minerals such as shells.
Footnotes
Declaration of Conflicting Interests
The authors declared no potential conflicts of interest with respect to the research, authorship, and/or publication of this article.
Funding
This study was financially supported by JSPS KAKENHI (Grant Number 23K04797).