






Abstract
The anharmonic Debye–Waller (DW) factor in the X-ray absorption fine structure (XAFS) spectroscopy of crystalline silver (Ag) is explicitly examined, accounting for thermal disorder. A framework combining classical statistical mechanics with the correlated Einstein model is employed to describe atomic interactions and lattice vibrations. The DW factor characterizes attenuation of the XAFS amplitude induced by thermal motion and is essential for extracting structural and thermodynamic information from XAFS spectra. The derived thermodynamic XAFS parameters incorporate atomic correlations and anharmonicity, accounting for nearest-neighbor effects on both the absorber and backscatterer. The analytical expressions for these parameters are derived in a simple, explicit, temperature-dependent form, making them convenient for XAFS analysis. The applicability of the classical approximation is quantitatively assessed through comparison with quantum-mechanical expressions for lattice vibrations. Adopting a conservative criterion of less than 10% deviation, the classical description is reliable for temperatures T
Results
at lower temperatures illustrate the breakdown of the classical approximation and are not used for quantitative interpretation. Theoretical and experimental Fourier transform magnitudes |χ(R)| from k2 weighted spectra match closely near the first-shell peak. Overall, the present approach provides an effective framework for anharmonic XAFS DW analysis in Ag at elevated temperatures and is extendable to other metals.
This is a visual representation of the abstract.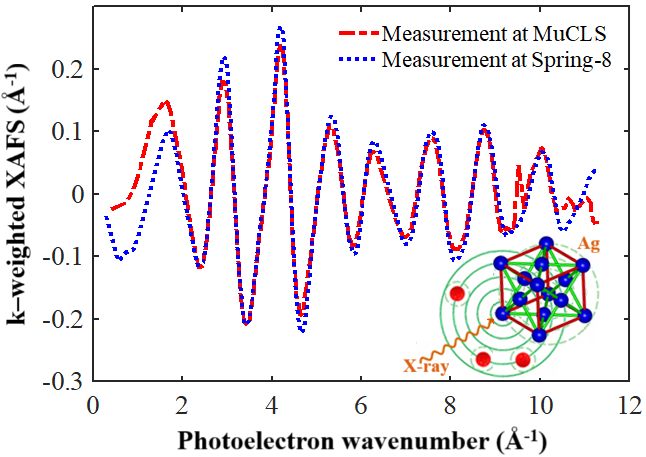
Keywords
Introduction
To date, X-ray absorption fine structure (XAFS) spectroscopy has served as a powerful tool for extracting structural parameters and thermodynamic properties of materials.1,2 Theoretically, XAFS is well established as a quantum interference phenomenon arising from the backscattering of photoelectrons emitted upon core-level excitation. 3 In parallel, practical methodologies such as the ratio method have proven effective in analyzing disordered systems. 4 Significant progress in both theoretical frameworks and experimental techniques, particularly those facilitated by synchrotron radiation sources, has substantially broadened the applicability of XAFS. 5 The characteristic oscillatory modulations observed in XAFS spectra encode critical local structural information, including interatomic distances, coordination numbers, and contributions from thermal and static disorder.6,7 The cumulant expansion approach has enabled quantitative analysis of lattice vibrations through the Debye–Waller (DW) factor, thus linking XAFS to lattice dynamics and thermodynamic behavior.4,8 Furthermore, model-independent techniques have been developed to extract interatomic distances directly from XAFS signals without relying on predefined potential models. 9 Finally, advances in XAFS methodology have significantly improved surface sensitivity, enabling enhanced structural characterization in catalytic and electrochemical systems. 10
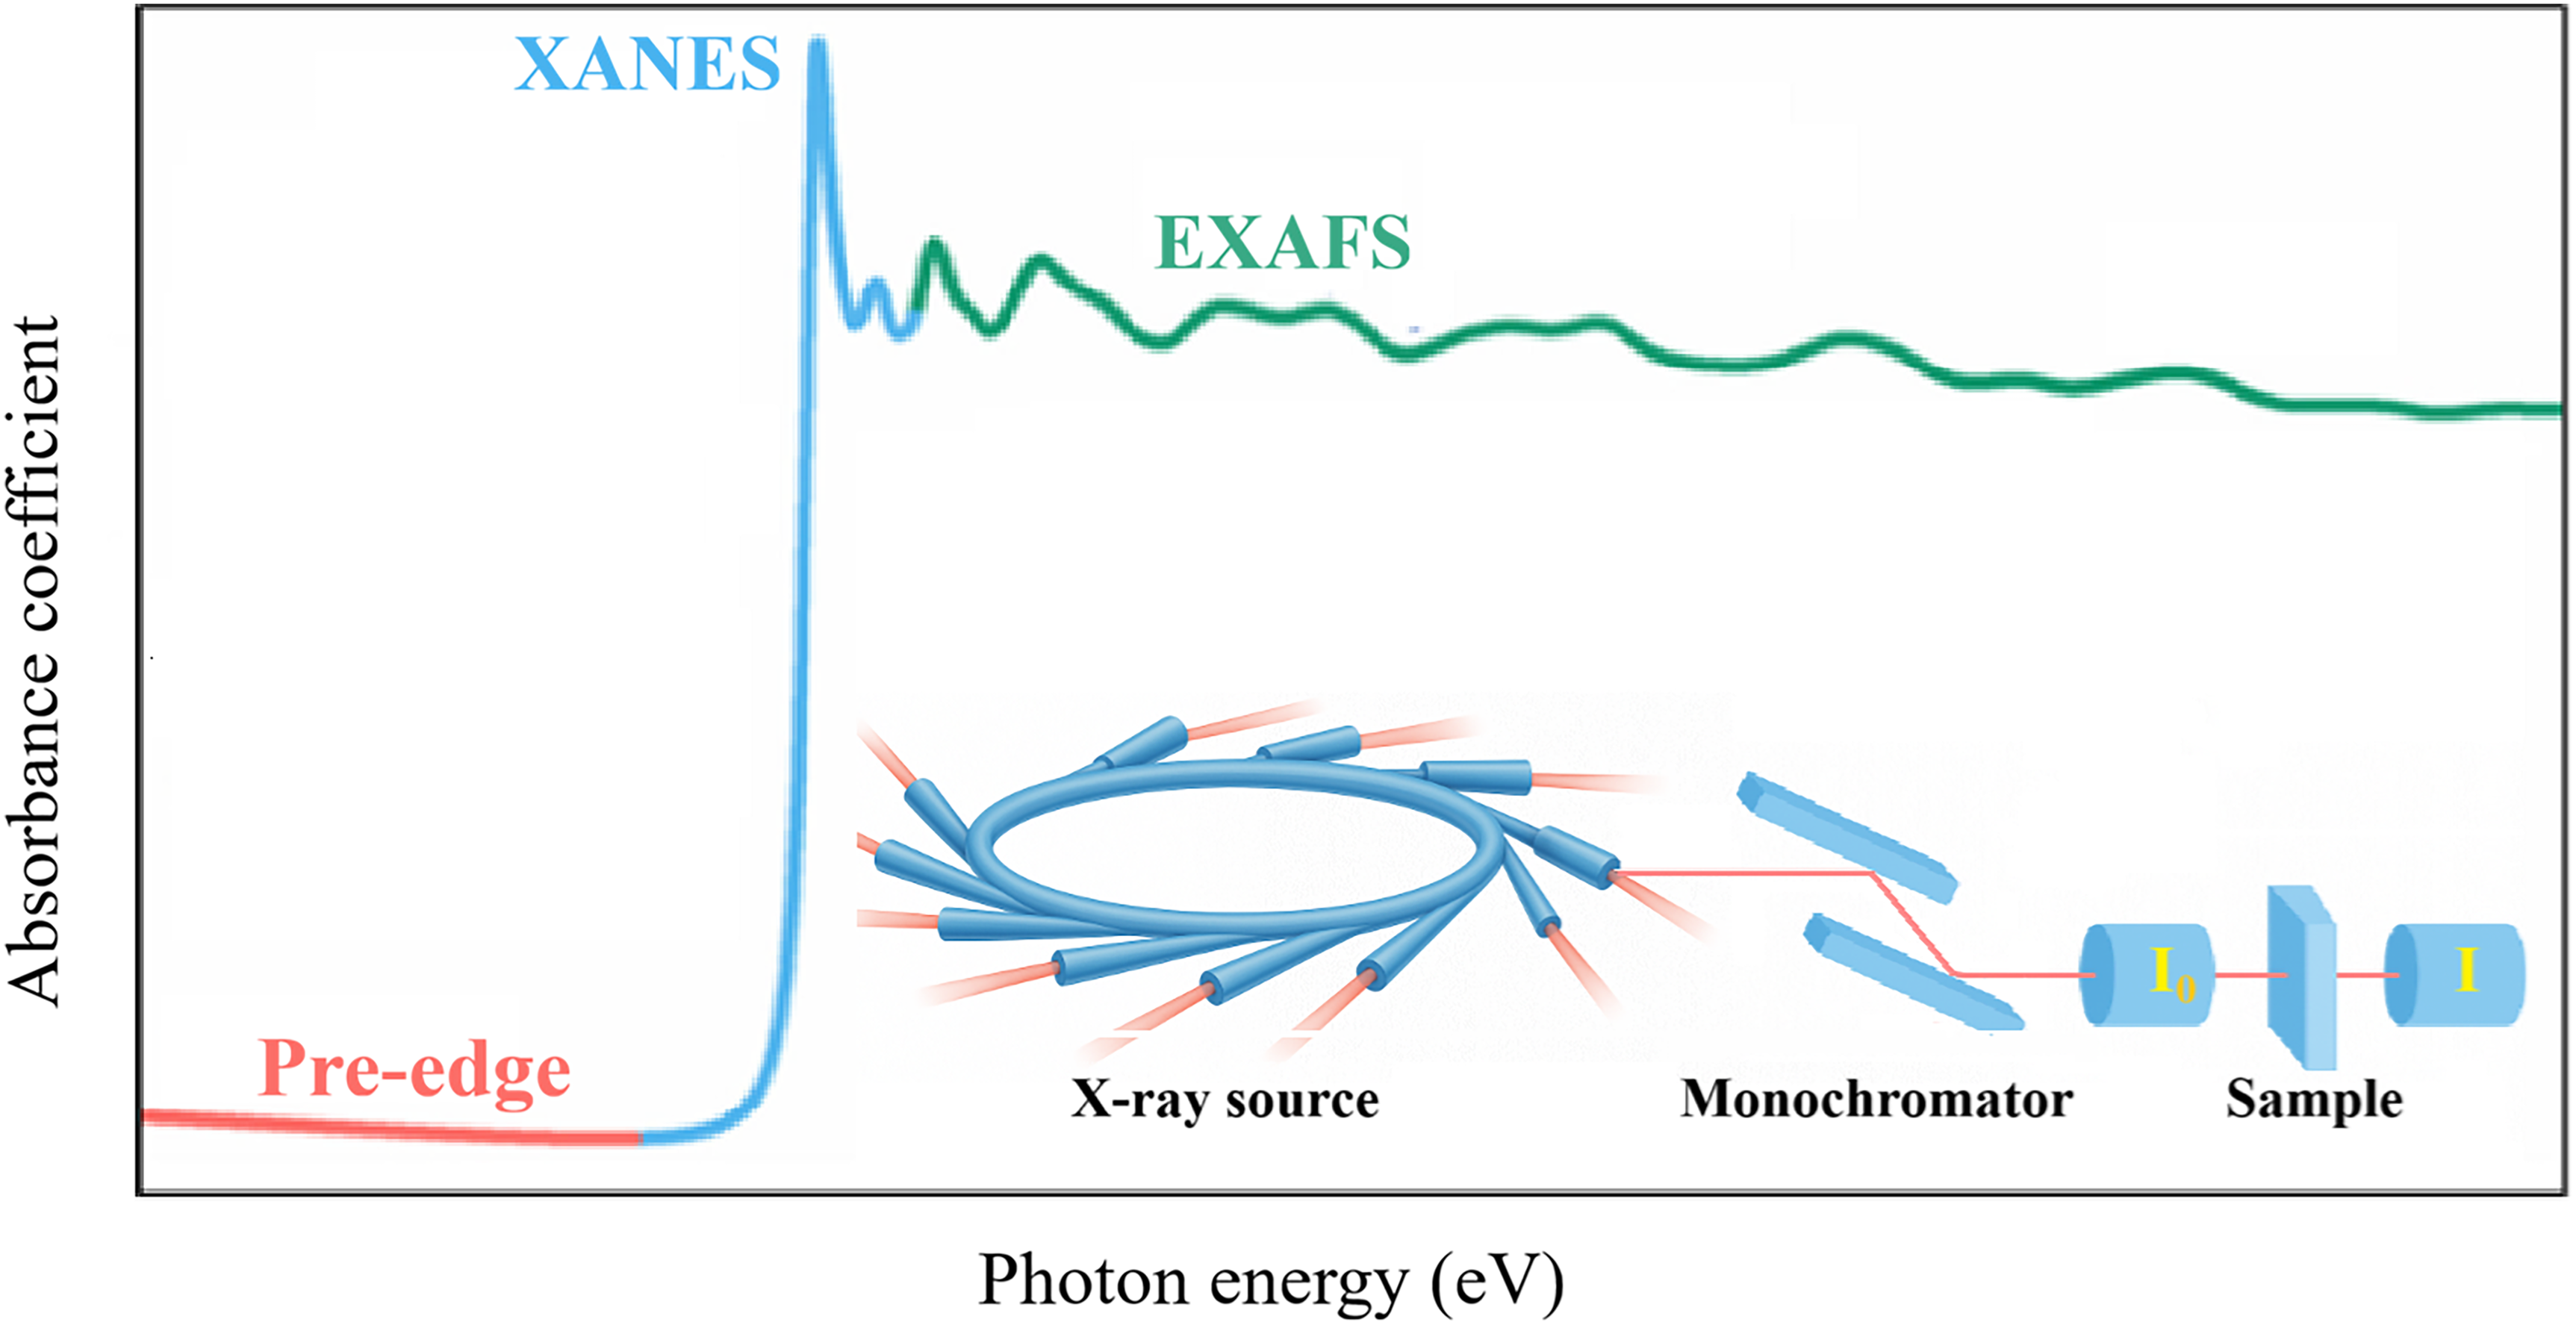
A schematic illustration of the XAFS experimental setup and the photoelectron-scattering mechanism is shown in Figure 1. A monochromatic X-ray beam from a synchrotron source is tuned across the absorption edge energy E0 to excite a core-level electron.
9
This electron is ejected as a photoelectron, whose wave interferes with the backscattered waves from neighboring atoms, producing oscillations in the absorption coefficient μ(E) that depend on the incident photon energy E > E0.
10
These oscillations depend on the photoelectron wavenumber
Although χ(k) arises from quantum-mechanical photoelectron interference, 13 its temperature dependence is strongly governed by lattice vibrations and associated thermal disorder. 2 At elevated temperatures, anharmonicity in the interatomic potential distorts the atomic pair distribution away from a Gaussian, thereby modifying XAFS amplitudes and phases. 14 Consequently, explicit treatment of thermal disorder and anharmonicity is essential in XAFS analysis. 15 As emphasized by Eisenberger and Brown, 16 neglecting these effects can introduce substantial errors in extracting thermodynamic quantities from experimental data. 7 Therefore, the reliability of derived thermodynamic parameters hinges on accurate anharmonic modeling within an appropriate theoretical framework, 17 and is further strengthened by ongoing advances in describing their influence on both the amplitude and phase of the oscillations. 18
In this broader context of temperature-dependent XAFS analysis, recent studies have also applied XAFS analysis to investigate local electronic and structural properties in a variety of functional materials, including thermoelectric Heusler compounds and lithium-based cathode materials.19,20 Within this XAFS framework, the DW factor constitutes a fundamental component in the analysis of anharmonic XAFS signals, as it characterizes the attenuation of the XAFS amplitude resulting from both thermal and static disorder, manifesting in its dependence on temperature and wavenumber. 2 Specifically, it quantifies the exponential damping of the oscillatory XAFS signal caused by atomic thermal vibrations and local structural disorder between the absorbing atom and its neighboring scatterers. 16 Therefore, the DW factor is essential for the accurate interpretation of XAFS spectra, as it governs the amplitude decay behavior and captures critical temperature and wavenumber dependencies in the signal.2,21 Improper treatment or omission of this factor can lead to significant inaccuracies in the extraction of thermodynamic parameters and local structural information from XAFS analysis.7,18
Currently, crystalline silver (Ag) is a precious metal with a face-centered cubic (FCC) structure, widely used in advanced electronic, optical, and energy-conversion applications due to its exceptional electrical and thermal conductivities and superior reflectivity.22–24 Beyond its practical applications, Ag is widely regarded as an ideal model system for studying vibrational dynamics and thermal disorder in solids, particularly using XAFS spectroscopy. 25 This is attributed to Ag being a relatively heavy metal with a well-defined phonon structure and exceptional sensitivity to anharmonic effects, which surpasses that of many other FCC metals such as Cu, Ni, and Al.26,27 Notably, Ag exhibits a significantly lower characteristic Einstein temperature, making anharmonic behavior more prominent and easier to characterize. 28 Meanwhile, the experimental XAFS cumulants of Ag at 184 K, 295 K, and 360 K were reported by Yokoyama et al. at the High Energy Accelerator Research Organization (KEK), Tsukuba, Japan. 25 Complementary XAFS datasets over an extended temperature range from 10 K to 952 K were obtained by Haug et al. at the Deutsches Elektronen-Synchrotron (DESY), Hamburg, Germany. 29 Haug et al. also fitted these experimental results using force constants derived within the high-order quantum perturbation (HOQP) framework. 29 In parallel, the anharmonic correlated Debye (ACD) model has also been employed to calculate anharmonic XAFS parameters of Ag across a wide temperature range. 30 However, the resulting cumulant expressions in this model remain in integral form and lack analytical simplicity, often requiring substantial computational effort for practical data analysis.
In recent years, the classical anharmonic correlated Einstein (CACE) model has emerged as a convenient and effective theoretical framework for analyzing anharmonic effects in XAFS data. 31 This approach offers the advantage of yielding simple and explicit analytical expressions for key anharmonic XAFS parameters even at room temperature, thereby facilitating practical applications, particularly in the study of metallic systems.32,33 In the present work, Ag is selected as a reference material to assess the applicability of the CACE model. 31 This choice is well justified, as Ag possesses high-quality experimental XAFS datasets and, owing to its relatively large atomic mass, exhibits significant thermal disorder and pronounced anharmonic behavior at elevated temperatures. 34 These conditions fall within the regime in which the classical assumptions underlying the CACE model remain valid for describing atomic vibrations in solids. 35 Moreover, the structural stability of Ag, evidenced by the absence of any phase transition over the temperature range relevant to the XAFS measurements, makes it an ideal system for assessing the capability of the CACE model to describe the temperature dependence of the DW factor under thermal disorder.28,29 Incorporating the XAFS DW factor determined from this work into the ARTEMIS fitting procedure significantly improves the accuracy in modeling amplitude damping, temperature-dependent behavior, and thermal disorder effects in XAFS spectra.11,12 Therefore, this approach, based on the XAFS DW factor obtained from the present model, significantly improves the reliability of structural and thermodynamic parameters extracted from experimental data for Ag and can be extended to other metals under thermal disorder.
Rather than proposing a new anharmonic formalism, the present work aims to quantitatively assess the applicability and limitations of a classical approach for Ag by directly comparing it with quantum-mechanical and experimental benchmarks.28–30 Accordingly, classical approaches such as the CACE model are not intended to replace quantum-mechanical descriptions but rather to serve as a complementary, computationally efficient framework within a well-defined temperature regime where the classical approximation remains valid. 36
Theoretical Calculation Model
Basic Formulas in XAFS Theory
Normally, for a given scattering path in K-edge XAFS, the signal is expressed through distance-dependent terms derived from a canonical ensemble average over thermally disordered atomic configurations.
37
This average accounts for both thermal vibrations and structural disorder in the absorber–scatterer environment.
2
When the distribution of interatomic distances deviates from a purely Gaussian form, particularly at elevated temperatures or in the presence of anharmonicity, the XAFS oscillation includes non-Gaussian disorder through higher-order cumulants,15,38 leading to the following form:

where N is the neighboring atomic number, k is the wavenumber of the photoelectron, T is the absolute temperature, f(k) and δ(k) are characteristic parameters for scattering photoelectron, R(T) is the distance between neighboring atoms, and the second XAFS cumulant σ2(T) is the mean square relative (MSR) displacement, incorporating both harmonic and anharmonic contributions of thermal disorder as considered in this work.
The anharmonic XAFS Debye–Waller (DW) factor characterizes the reduction in the amplitude of the XAFS oscillations due to thermal vibrations and structural disorder.39,40 This factor is typically expressed through a modified exponential damping term as follows
16

In the general framework of XAFS theory, the second cumulant is directly related to the low-order moments of the true radial pair distribution (RPD) function of the absorbance–backscatterer pair. It reflects the fluctuations of the instantaneous interatomic distance around its thermal average and captures both thermal and structural disorder. The second cumulant is then given by the following expression 4,41

where x is the deviation distance between the backscattering and absorbing atoms,
In the harmonic and symmetric limit, which is typically applicable at sufficiently low temperatures, the vibrational distribution is centered at equilibrium, and the mean relative displacement vanishes

This harmonic reference provides a natural, physically well-defined starting point for describing thermal disorder effects in XAFS theory, as it captures the leading contribution of atomic vibrations through a symmetric distribution centered at equilibrium.2,3 In this limit, the XAFS DW factor is governed by the second moment of the relative displacement, whereas deviations from this harmonic baseline signal the onset of anharmonic effects. 16
Validity Range of the Classical Statistical Approach
Before introducing any specific classical anharmonic model, it is necessary to clarify the temperature range over which a classical statistical description of atomic vibrations remains physically meaningful.15,36 This issue is fundamental and essentially model-independent, as it arises from the intrinsic difference between quantum and classical statistics rather than from the particular form of the interatomic potential or the phonon spectrum.2,44 At low temperatures, the breakdown of classical statistics is governed by the discretization of vibrational energy levels rather than by anharmonicity.37,43 For this reason, the harmonic oscillator serves as an appropriate and rigorous reference for defining the classical limit, so that the quantum–classical crossover of a harmonic vibrational mode suffices to delineate the validity range.
In the harmonic regime, the second XAFS cumulant can be consistently assessed through the mean-square displacement
For a harmonic vibrational mode characterized by the atomic mass M and vibrational frequency ω, the exact quantum-mechanical second moment of the vibrational coordinate is given by26,43

where kB and
Whereas the corresponding classical high-temperature limit obtained from the equipartition theorem reads27,36

A comparison between Eqs. 5 and 6 therefore provide a quantitative criterion for the temperature range in which quantum effects become negligible, and the classical statistical description of atomic vibrations is justified. The relative deviation of the classical approximation from the exact quantum result, normalized to the classical value, can then be written as

In the low-temperature regime, quantum effects, such as ZP motion, dominate, leading to a substantial deviation from the classical prediction.44,45 In contrast, at sufficiently high temperatures, (y << 1), the classical limit is progressively recovered as temperatures rise.13,36 Imposing a conservative accuracy criterion of δ(y) ≥ 10% leads to the inequality y coth y ≤ 1.1, whose numerical solution yields y ≤ 0.55. This condition corresponds to a temperature threshold

This inequality provides a quantitative criterion for identifying the temperature regime in which classical behavior becomes applicable to lattice vibrations. The criterion is derived from an explicit comparison between quantum-mechanical and classical mean-square displacements.36,45 Hence, this criterion is directly tied to a well-defined accuracy requirement, rather than to heuristic assumptions on phonon dispersion, atomic correlations, or anharmonicity.
Classical Anharmonic Correlated Einstein Model
The CACE model is developed from the correlated Einstein (CE) model 43 based on the anharmonic effective (AE) potential 46 and classical statistical (CS) approach. 36 This approach provides a practical framework for modeling atomic vibrations in XAFS analysis, especially at high temperatures where quantum effects become negligible. 33 By treating anharmonicity as a small perturbation, this approach enables the derivation of simple, closed-form expressions for cumulants and DW factors, thereby facilitating the interpretation of XAFS data with thermal disorder and anharmonic effects. 46 The CE model, in particular, allows an approximate description of correlation effects between atom pairs while maintaining analytical simplicity for practical calculations. 43 Therefore, the CACE model can provide valuable insights into thermodynamic parameters derived from XAFS analysis conveniently and efficiently.
Usually, thermodynamic XAFS parameters are derived from the anharmonic XAFS DW factor using the cumulant expansion approach.4,8 This method systematically incorporates higher-order cumulants to account for the effects of quantum vibrations and anharmonic thermal disorder.15,42 The derived parameters provide quantitative insights into the local vibrational dynamics and bonding characteristics of materials.1,2 To evaluate the thermodynamic parameters of a crystalline solid, it is essential to establish a precise form of the AE potential and to determine the corresponding local force constants.30,32 For a monatomic crystal, the AE potential can be systematically expanded in a Taylor series with respect to the atomic displacement by equilibrium position, retaining terms up to the fourth order as follows32,47

where keff is the harmonic effective force constant, while k3 and k4 represent the third- and fourth-order anharmonic force constants, respectively, which quantify the asymmetry and the non-parabolic curvature of the potential due to anharmonic effects.
Normally, the AE potential is determined from the atomic interaction (AI) potential of single-bond (SB) pairs in the crystal lattice and subsequently used to identify the thermodynamic parameters.32,45 For metals, this AE potential can be derived from the Morse potential,48,49 expanded to fourth order around its equilibrium position

where D is the dissociation energy and α characterizes the potential width.
The first-shell near-neighbor contribution (FSNNC) method
50
is an efficient approach for calculating the AE potential, incorporating many-body (MB) interaction effects into the interatomic potential formulation.
44
Developed by Hung and Rehr, it accounts for the crystallographic environment and correlation effects from surrounding atoms, making the AE potential structure dependent.
32
For an SB pair, consisting of an absorbing atom (A) and a backscattering atom (B), the AE potential is evaluated in the center-of-mass frame to describe local vibrational dynamics within the anharmonicity accurately
46

where
The structure of Ag is face-centered cubic (FCC), with each unit cell containing four atoms. This structure features atoms arranged like a cube, with eight atoms at each corner and six at each face, all corresponding to identical Ag atoms of mass M.26,27 After using structural characteristics, the AE potential of Ag is obtained from Eq. 11 and is presented as


The force constants are deduced from comparing Eq. 9 with Eq. 13, which are obtained in a temperature-independent form

In the crystal lattice, each atomic thermal vibration in this model can be treated as a phonon and characterized by the correlated Einstein temperature and frequency.30,32 The effective force constant is used to it is used to specify these parameters of Ag as follows


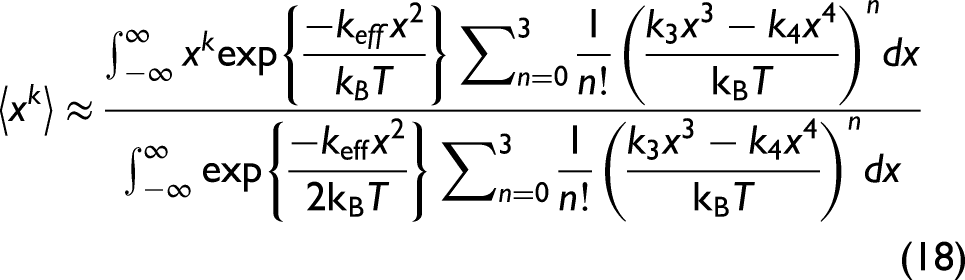
In the CS limit, the temperature-dependent moments
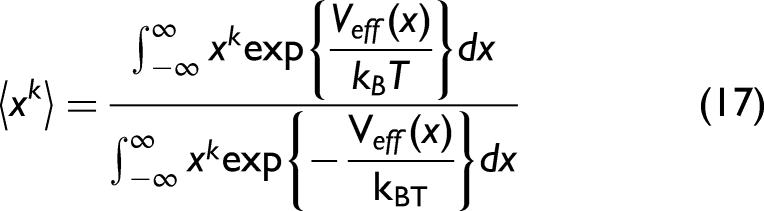
Utilizing the AE potential in Eq. 13 and expanding Eq. 17 approximately to the third order, which is written as
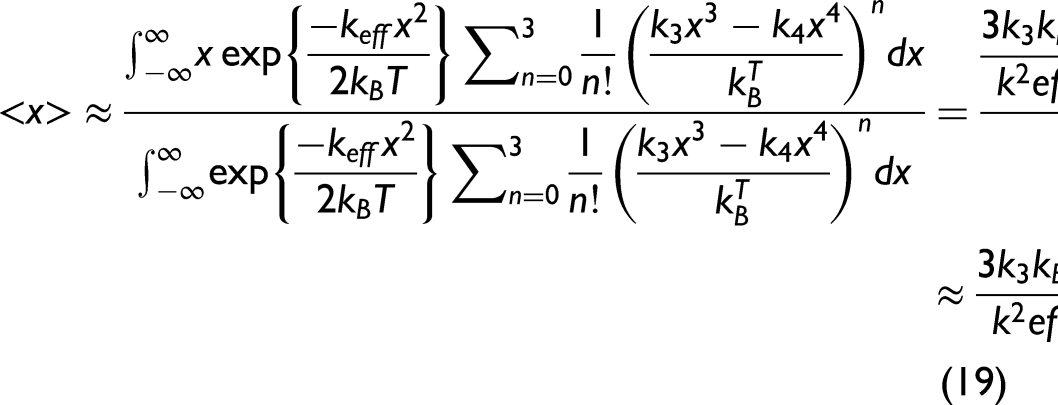
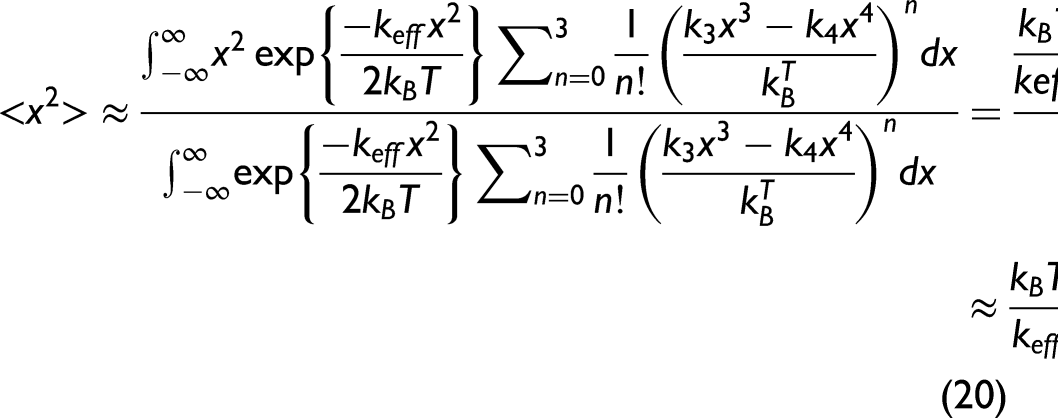
Substituting the obtained expressions of these moments into Eq. 3, the anharmonic second XAFS cumulant can be obtained within the lowest order in temperature
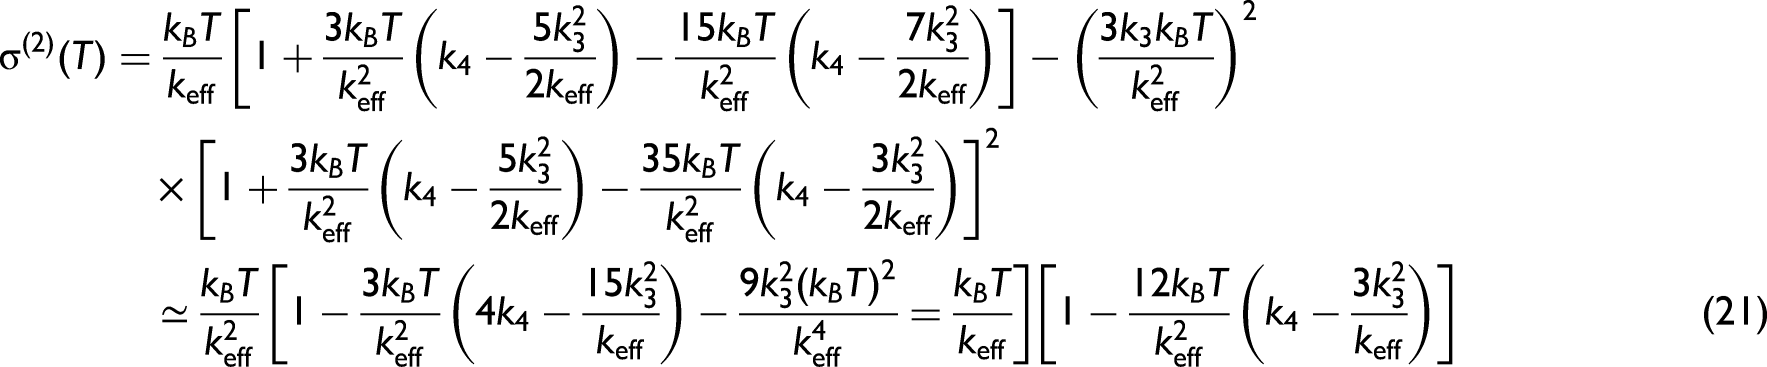
Herein, the component containing the anharmonic force constants, k3 and k4, quantifies the contribution of anharmonicity to the second XAFS cumulant. After replacing the expressions of local force constants keff, k3 and k4 in Eq. 9 into this general expression, we obtain the temperature-dependent second XAFS cumulant of Ag in the following form:


As a result, the anharmonic XAFS DW factor of Ag in XAFS has been successfully calculated under the effect of thermal disorder based on the CACE model. 29 This approach is based on the CS approach, 36 where anharmonicity is treated as a small perturbation, allowing for the derivation of simple, closed-form expressions for the XAFS DW factor.32,33
Model Framework and Benchmarking Strategy
Based on the general validity criterion established above, the classical statistical description of lattice vibrations is applied here within a temperature regime where quantum effects are sufficiently suppressed.33,45 The present calculations employ the CACE model to describe anharmonic atomic motion in Ag, with the associated model parameters specified in the preceding subsection. Although the CACE model does not explicitly account for quantum effects such as ZP motion or higher-order anharmonic contributions at low temperatures,32,36 the classical approximation remains valid at sufficiently high temperatures, including room temperature for many metals.31,35 In this regime, the CACE model provides a quantitative description of atomic thermal vibrations in XAFS analysis via explicit, computationally efficient expressions. This facilitates the extraction of local structural information and thermodynamic parameters.15,33
When the general quantum–classical crossover criterion is specialized to the CACE model adopted in this work, the characteristic vibrational frequency entering the validity analysis is identified with the correlated Einstein temperature

For quantitative assessment and benchmarking, the obtained numerical results from the present CACE model are compared with those from the ACD model 30 reported in the literature, which provides a fully quantum-mechanical, material-specific description of lattice vibrations. 50 Accordingly, the ACD model 30 explicitly accounts for phonon dispersion and atomic correlations and is therefore adopted here as a quantum reference for Ag. Available experimental XAFS data28,29 and corresponding fitting method 29 are further employed to validate the theoretical predictions. On this basis, the performance and applicability of the present CACE model for Ag are evaluated in the following section through direct comparisons with both the ACD model 30 and experimental benchmarks.28,29
Results and Discussion
In this section, the calculated expressions from the Theoretical Calculation Model section above are used to determine the thermodynamic XAFS parameters for Ag based on its fundamental physical properties. Herein, the atomic mass of m = 107. 868 u was identified by Mermin and Ashcroft, 51 and the Morse potential parameters of Ag are D = 0.121 eV and α = 2.062 Å–1 that were determined using the experimental XAFS data 29 based on an effective method proposed for metals by Pirog et al. 33 The present investigation was performed over a wavenumber range of 0 to 12 Å–1 and a temperature range of 0 to 1000 K. The numerical results for Ag are compared with those obtained from the ACD model reposted in previous work, 30 the fitting approach employed by Haug et al., 29 and experimental data measured by Yokoyama et al. 25 and Haug et al. 29 The effectiveness of the present theoretical model is also analyzed and discussed for the anharmonic XAFS DW factor of Ag under thermal disorder.
The values of the correlated Einstein frequency ωE and temperature θE, local force constants keff, k3, and k4 of Ag are given in Table I. The obtained values from the present CACE model are calculated using Eqs. 14–16 with the above Morse potential parameters. It is essential to note that the results obtained from the present CACE model are similar to those obtained from the ACD model, 30 as both employ the AE potential function with identical force constants. Meanwhile, the experimental data were measured by Newville and Stern at the Beamline X23A2 of the National Synchrotron Light Source (NSLS) (Brookhaven National Laboratory, USA). 52 Other experimental data were measured by Haug et al. at the Beamline X1 of the Hamburg Synchrotron Radiation Laboratory (HASYLAB), DESY (Germany). 29 Note that the correlated Einstein frequency ωE and temperature θE can be derived directly from the effective force constant keff. It is observed that our values agree well with those obtained from the experimental data,29,52 especially in comparison with the corresponding values obtained from the experimental data with error bars measured by Haug et al. 29
The physical and thermodynamic parameters of Ag are obtained from the present CACE model and experimental data.
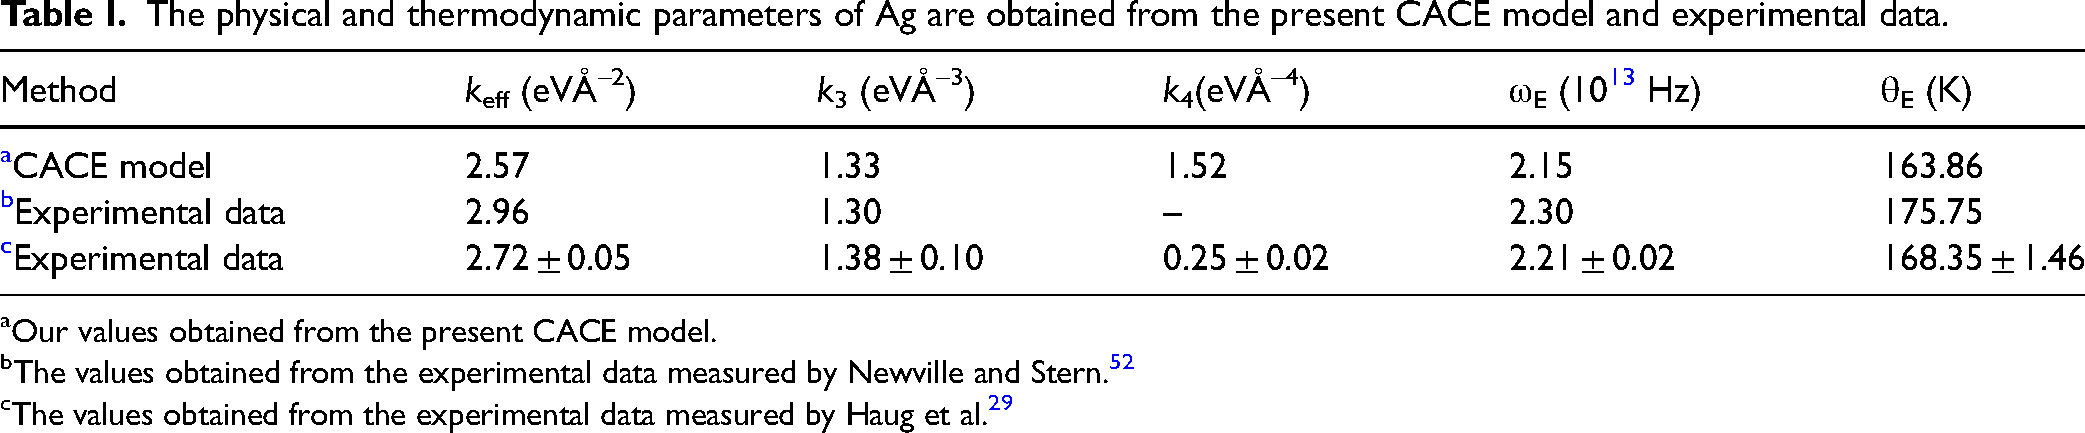
Our values obtained from the present CACE model.
The values obtained from the experimental data measured by Newville and Stern. 52
The values obtained from the experimental data measured by Haug et al. 29
The AE potential Veff(x) of Ag and its harmonic and higher-order anharmonic contributions over positions ranging from –0.36 Å to 0.36 Å are compared with available experimental data in Figure 2. Herein, our obtained results from the present CACE model are determined by Eq. 13 with the above Morse potential parameters, while the obtained results from the experimental data29,52 are determined by Eq. 9 with corresponding local force constants given in Table I. Notably, the obtained results from the experimental data measured by Newville and Stern 52 do not account for the fourth anharmonic term k4x4 in the AE potential. It is observed that our obtained results agree with those obtained from the experimental data with error bars.29,52 This is particularly evident compared with the experimental data measured by Haug et al., especially at the negative positions and near the equilibrium position. Furthermore, the present CACE model allows the AE potential to be analyzed into the harmonic term Vha(x) = keffx2 and the anharmonic term Van(x) = – k3x3 + k4x4, wherein the anharmonic term arises from thermal disorder in atomic vibrations. The AE potential exhibits asymmetry and anharmonicity, with higher magnitudes at negative positions (x < 0) compared to positive positions (x > 0) of the same magnitude. The fourth anharmonic term k4x4 becomes increasingly significant at larger displacements from the equilibrium position (x = 0), as seen in Figure 2.
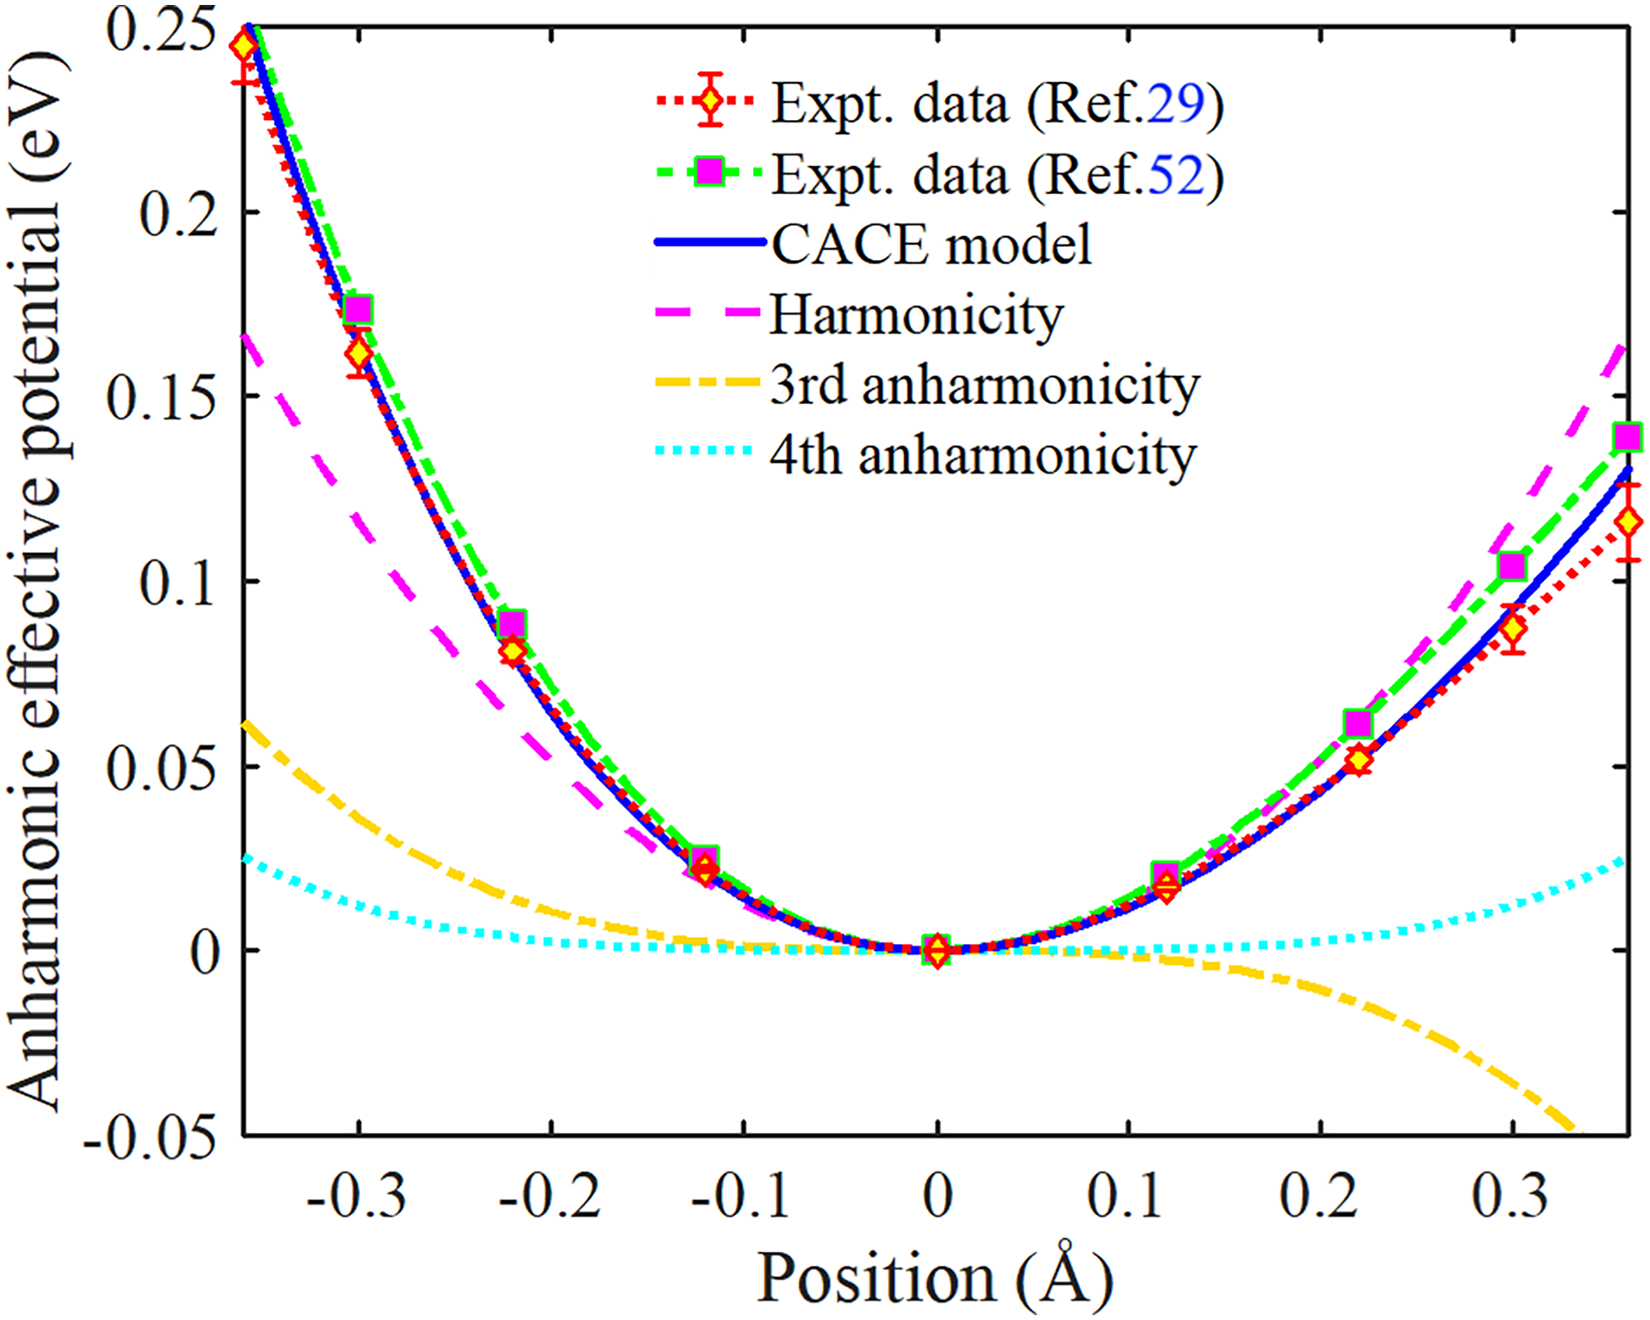
Position-dependent AE potential of Ag obtained from the present CACE model, together with the harmonic term and anharmonic contributions up to the fourth order. Experimental data are included for comparison. Experimental data are included for comparison, illustrating the anharmonicity and asymmetry of the AE potential at increasing atomic displacements.
The values of the AE potential and its contributing terms at various positions are given in Table II. It is observed that the anharmonic term is positive at negative positions (x < 0) and negative at positive positions x > 0, wherein the third anharmonic term –k3x3 makes a major contribution, and the fourth anharmonic term k4x4 makes a significant contribution. Moreover, the influence of anharmonicity intensifies as the displacement increases, particularly for negative positions (x < 0), where the AE potential increases substantially due to the third anharmonic term–k3x3. This behavior underscores the profound impact of thermal disorder, as large vibrational amplitudes can result in substantial changes in atomic positions within the crystal lattice. Therefore, the contribution of anharmonic effects needs to be fully considered to determine the anharmonic XAFS DW factor of Ag accurately.
The AE potentials and their contributing terms of Ag are obtained from the present CACE model and experimental data at various positions.
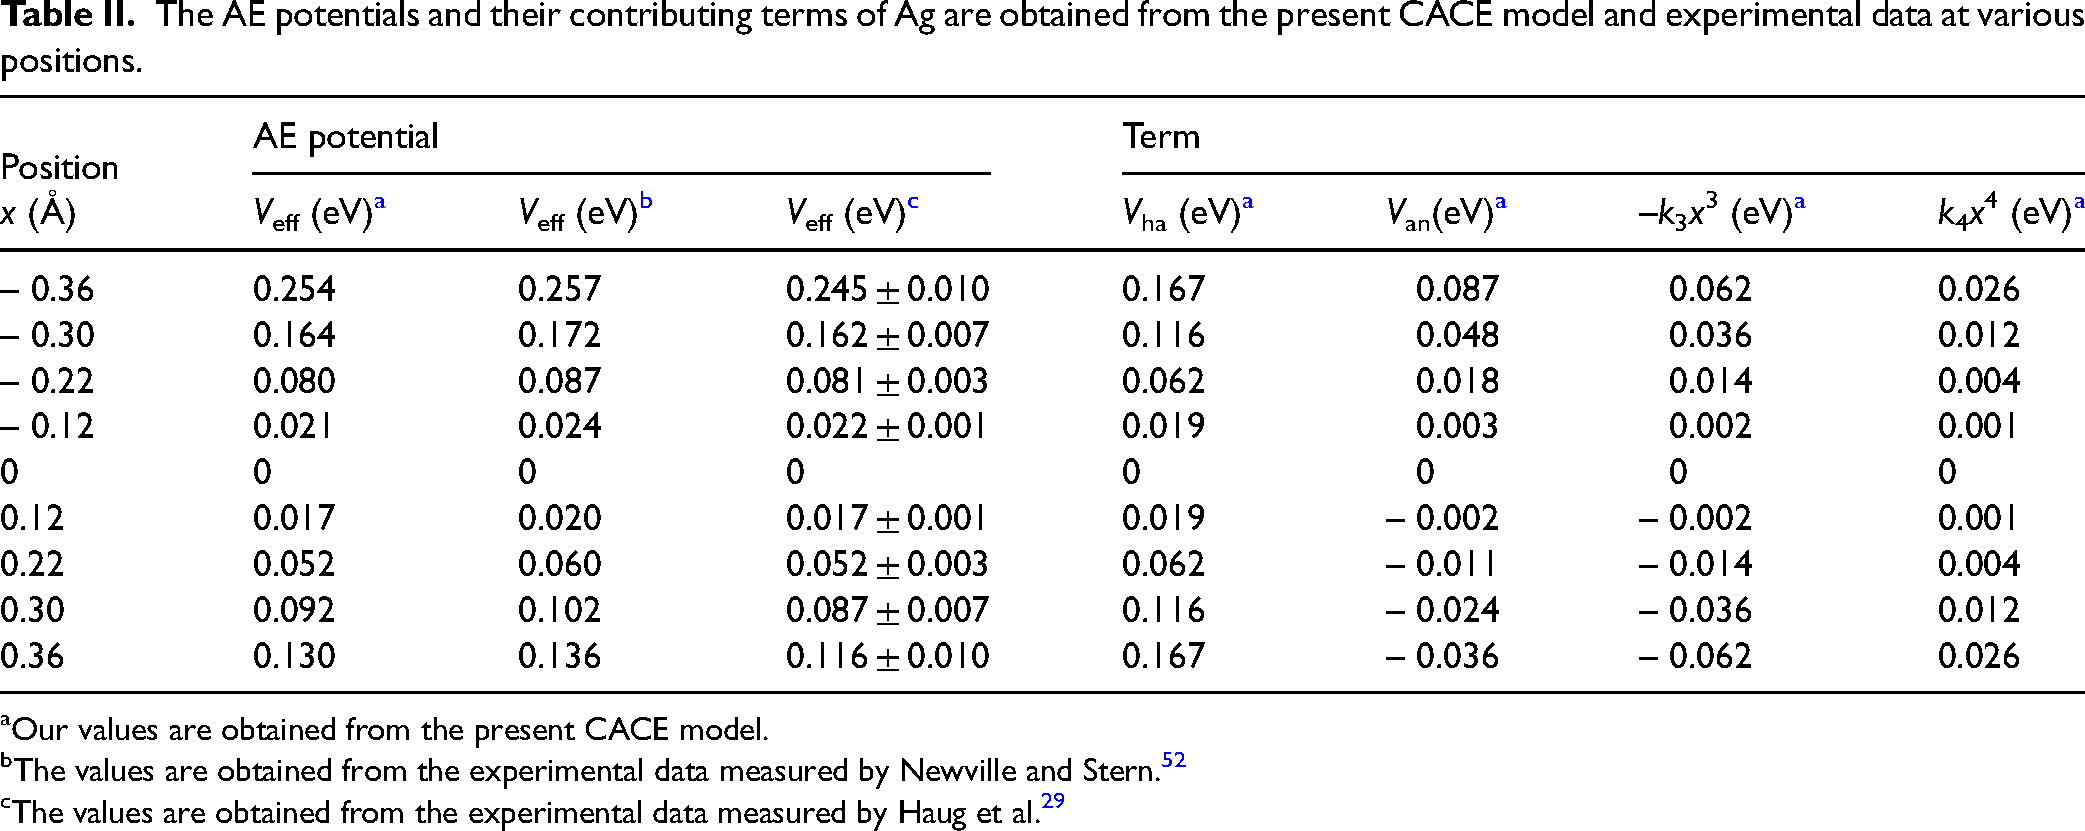
Our values are obtained from the present CACE model.
The values are obtained from the experimental data measured by Newville and Stern. 52
The values are obtained from the experimental data measured by Haug et al. 29
Using the correlated Einstein temperature (θE ≈ 164 K) obtained from the present CACE model, the validity criterion given by Eq. 24 corresponds to a conservative temperature threshold of approximately T ≳ 148 K for this classical model. Accordingly, the following discussion of the second XAFS cumulant and the XAFS DW factor emphasizes this temperature range, while results at lower temperatures are included only to illustrate the progressive breakdown of the present classical approximation.
The second XAFS cumulant σ2(T) of Ag obtained from the present CACE and ACD models, fitting method, and experiments over the temperature range from 0 to 1000 K is shown in Figure 3. This cumulant plays a key role in quantifying the thermal and static disorder in the thermodynamic system. 16 It can provide crucial information on vibrational amplitudes and bond-length fluctuations in XAFS analysis. 53 The results obtained from the present CACE model are calculated via Eq. 22, and those obtained from the ACD model are reported in previous work. 30 Meanwhile, the experimental data were measured by Yokoyama et al. at three points in the 30–360 K range at the Beamline 10B of the Photon Factory (PF) (KEK, Japan), 25 and by Haug et al. at ten temperatures in the 10–952 K range at the Beamline X1 of HASYLAB. 29 Additionally, Haug et al. obtained the fitted results using a method based on the high-order quantum perturbation (HOQP) theory, incorporating measured experimental data and calculated force constants. 29 It is observed that our results agree with those obtained from the ACD model, 30 fitting method, 29 and experimental results with error bars25,29 at high temperatures, as seen in Figure 3.
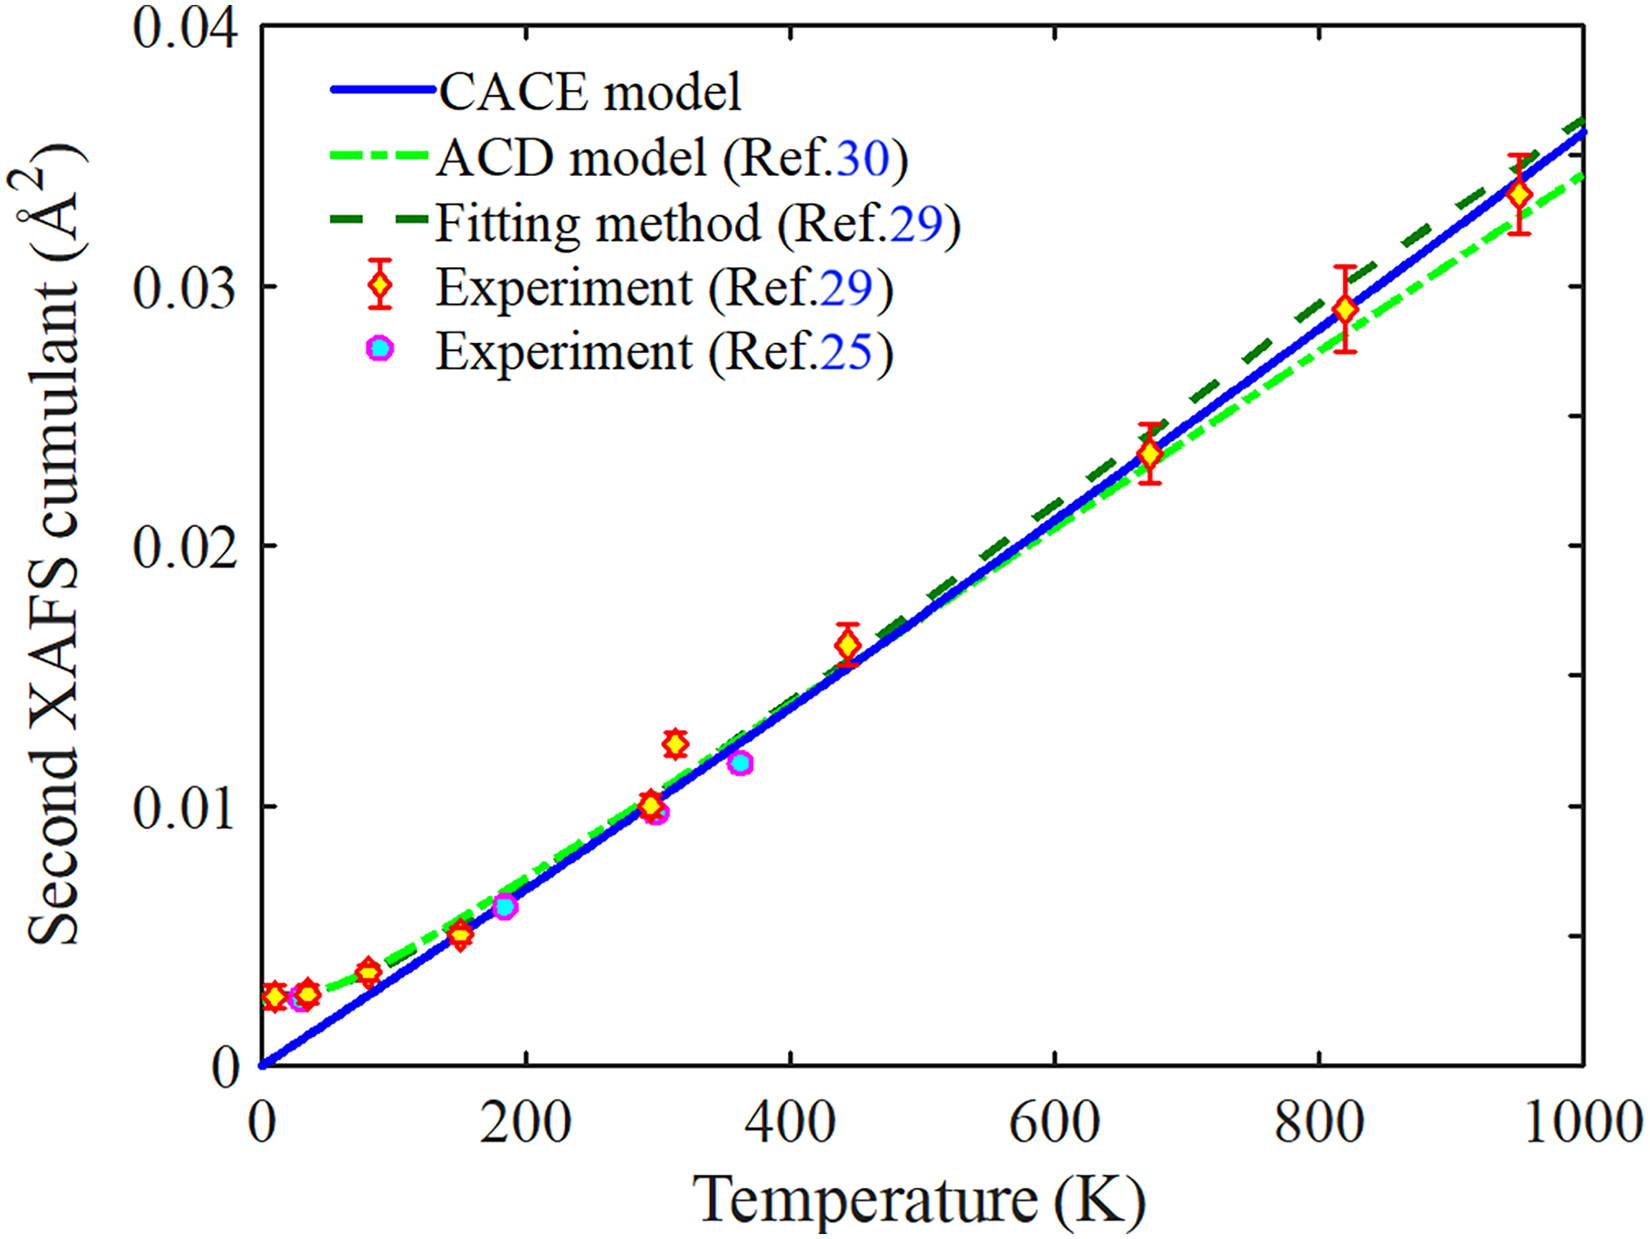
Temperature-dependent second XAFS cumulant of Ag obtained from the present CACE and ACD models, fitting method, and experiments. The comparison illustrates the consistency between theoretical predictions and experiments.
The obtained values of the anharmonic second XAFS cumulant of Ag at various temperatures are given in Table III. It is observed that our values agree with those obtained from the ACD model 30 and experimental values with uncertainty25,29 even at 150 K. This confirms the effectiveness of the present CACE model at moderate and high temperatures, where classical assumptions remain valid and quantum effects become negligible. This is a key advantage of the present CACE model, which provides a physically consistent description of thermal disorder and anharmonic contributions in XAFS analysis, particularly for metals such as Ag, where the classical approximation remains applicable even at room temperature. 36 However, it is essential to note that the present CACE model cannot fully account for quantum effects at low temperatures, which the CS approach cannot capture. 31 Nevertheless, the present CACE model remains a convenient and efficient tool for extracting local structural information and thermodynamic parameters from the anharmonic XAFS signal under significant thermal disorder.
The anharmonic second XAFS cumulant of Ag is obtained from the present CACE and ACD models, fitting method, and experiments at various temperatures.
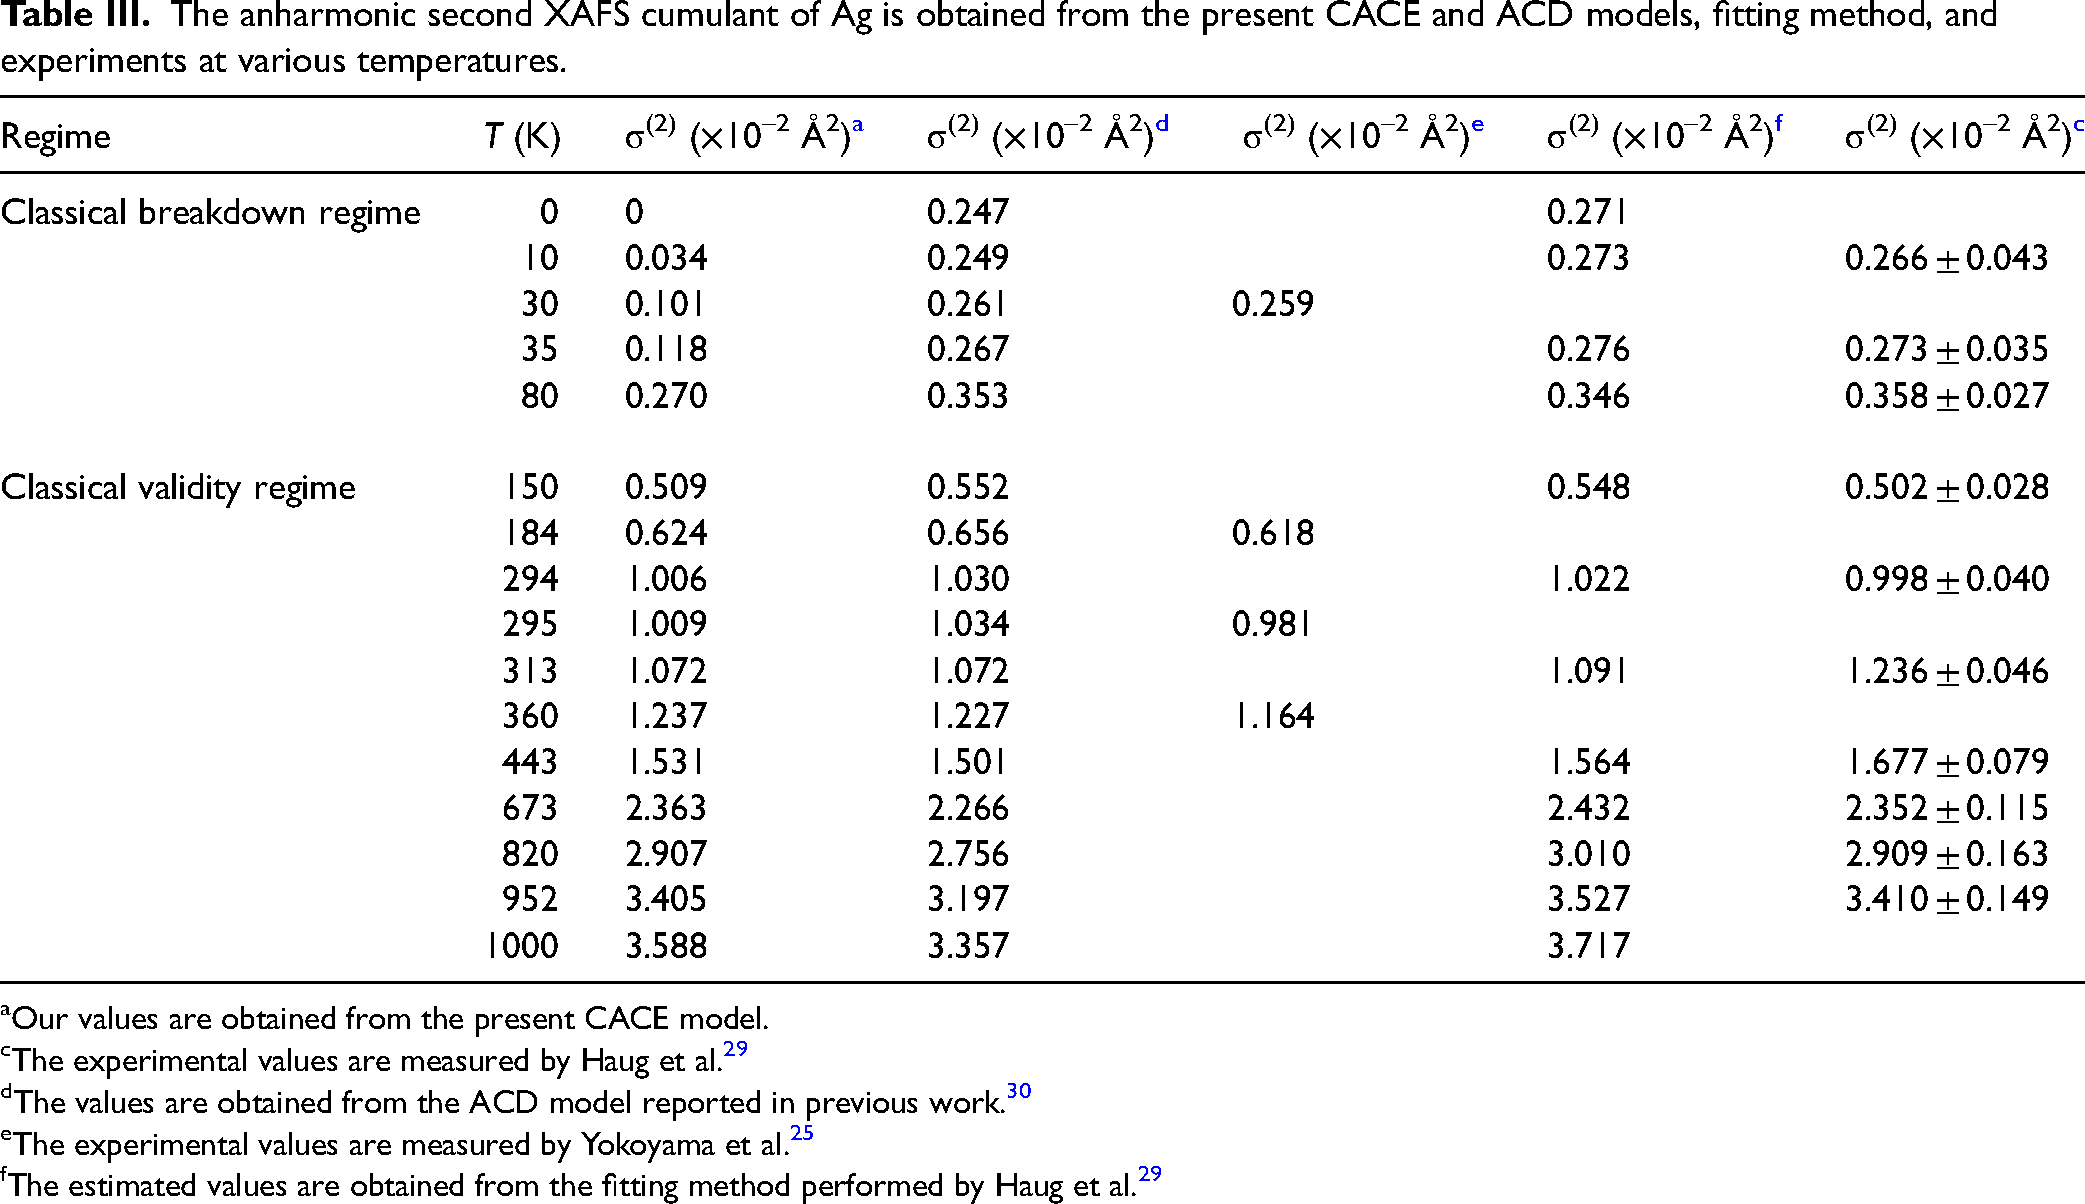
Our values are obtained from the present CACE model.
The experimental values are measured by Haug et al. 29
The values are obtained from the ACD model reported in previous work. 30
The experimental values are measured by Yokoyama et al. 25
The estimated values are obtained from the fitting method performed by Haug et al. 29
The anharmonic XAFS Debye–Waller factor W(T, k) of Ag obtained from the present CACE and ACD models over the temperature range of 0–1000 K and wavenumber range of 0–12 Å–1 is shown in Figure 4. Our obtained results from the present CACE model are calculated using Eq. 23, and those obtained from the ACD model are calculated using Eq. 2 with σ2(T) σ2(T) reported in previous work. 30 It is observed that our calculated result agrees with those obtained from the ACD model 30 within the validated temperature range. The discrepancy observed at low temperatures arises because the present CACE model is not valid in this regime, as σ2(T) approaches zero as the temperature approaches zero. In contrast, the ACD model incorporates quantum effects, including ZP energy, and thus enables the calculation of nonzero values for σ2(T) even at low temperatures. 30 Moreover, W(T, k) is an inversive function of σ2(T) and wavenumber k, in which σ2(T) rises with rising temperature T, as seen in Eqs. 2 and 22. It is observed that W(T, k) is an inversive function of σ2(T) and wavenumber k, in which σ2(T) rises with rising temperature T, as seen in Figure 4.
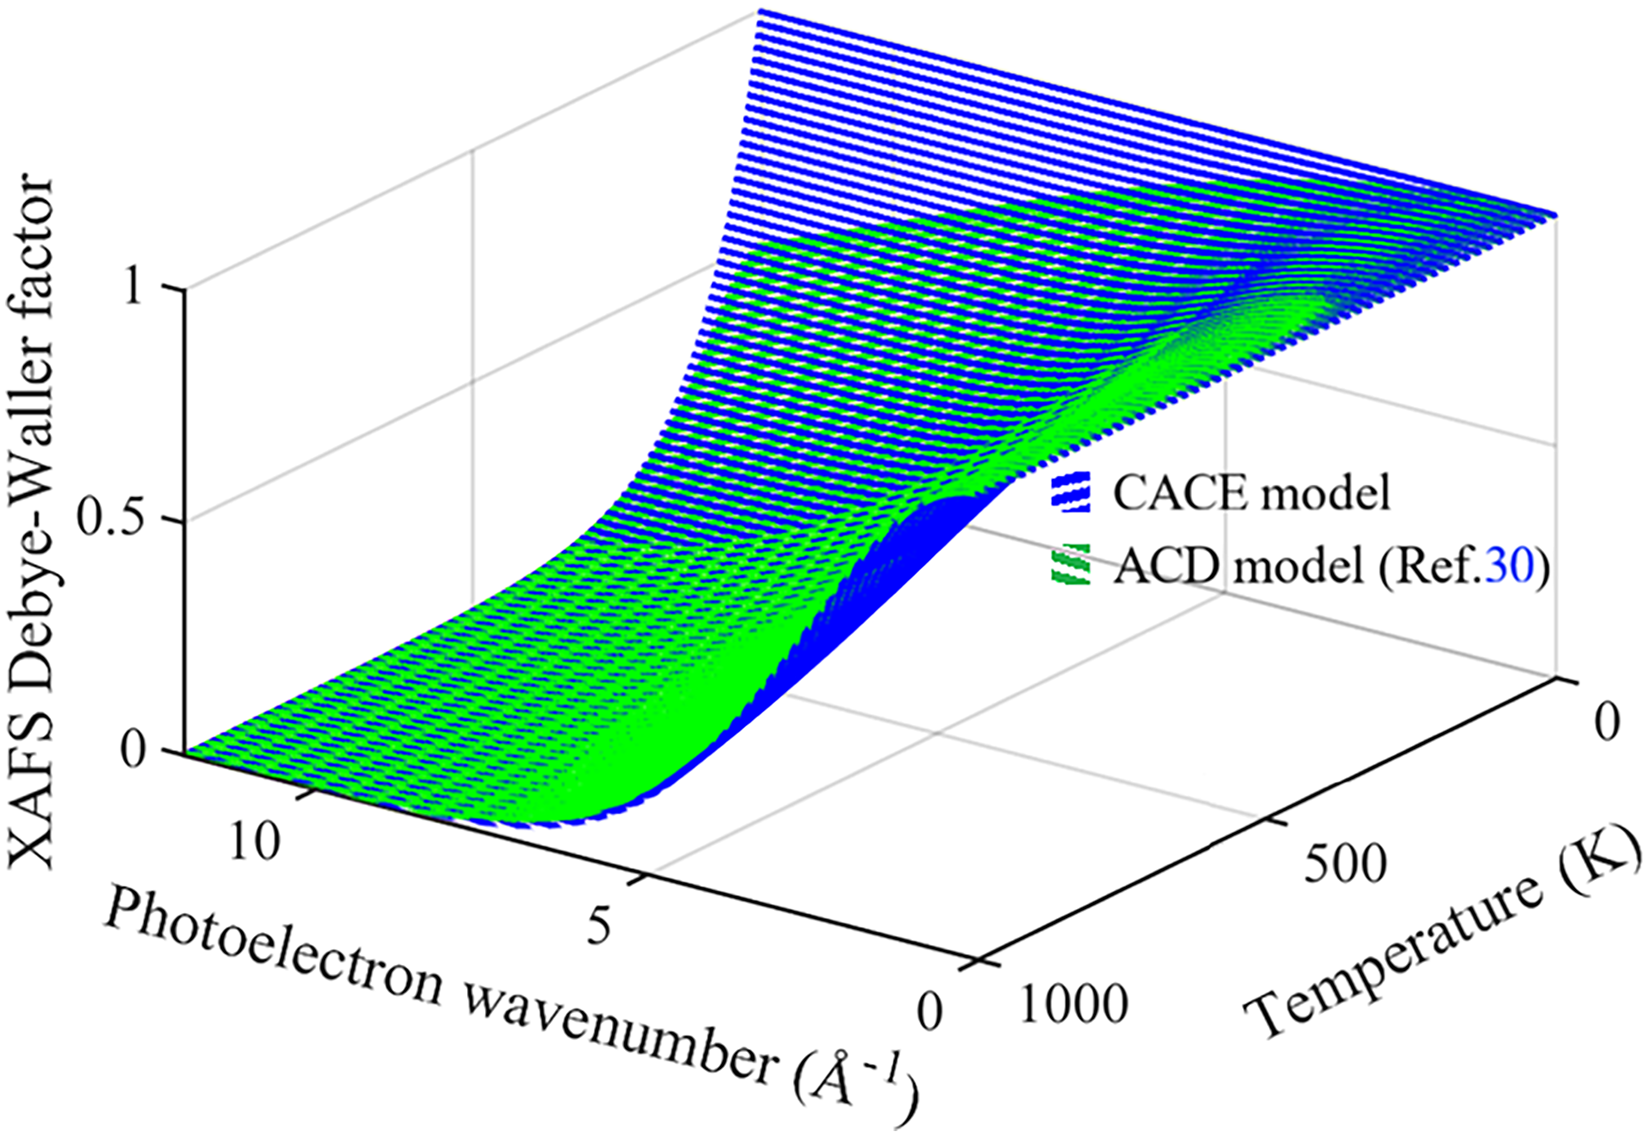
Temperature- and wavenumber-dependent XAFS DW factor of Ag obtained from the present CACE and ACD models, illustrating their different descriptions of thermal disorder in reciprocal space.
The anharmonic XAFS DW factors of Ag obtained from the present CACE and ACD models, fitting method, and experimental data are shown in Figure 5 for selected temperatures of 150 K, 295 K, 360 K, and 673 K over the wavenumber range of 0–12 Å–1. Herein, our obtained results from the present CACE model are calculated using Eq. 23, and the obtained results from the ACD model are calculated using Eq. 2 with σ2(T) are reported in previous work. 30 Meanwhile, the experimental results is obtained from Eq. 2 with the experimental values of σ2(T) measured by Yokoyama et al. 25 and Haug et al., 29 and the fitted results are obtained from Eq. 2 with σ2(T) are performed by Haug et al. 29 It is observed that our results agree with those obtained from the ACD model, fitting method, 29 and experimental data,25,29 particularly at high temperatures and large wavenumbers. At temperatures below the classical applicability threshold, only qualitative trends are observed and cannot be used for quantitative analysis due to the breakdown of the classical approximation, as shown in Figure 5.
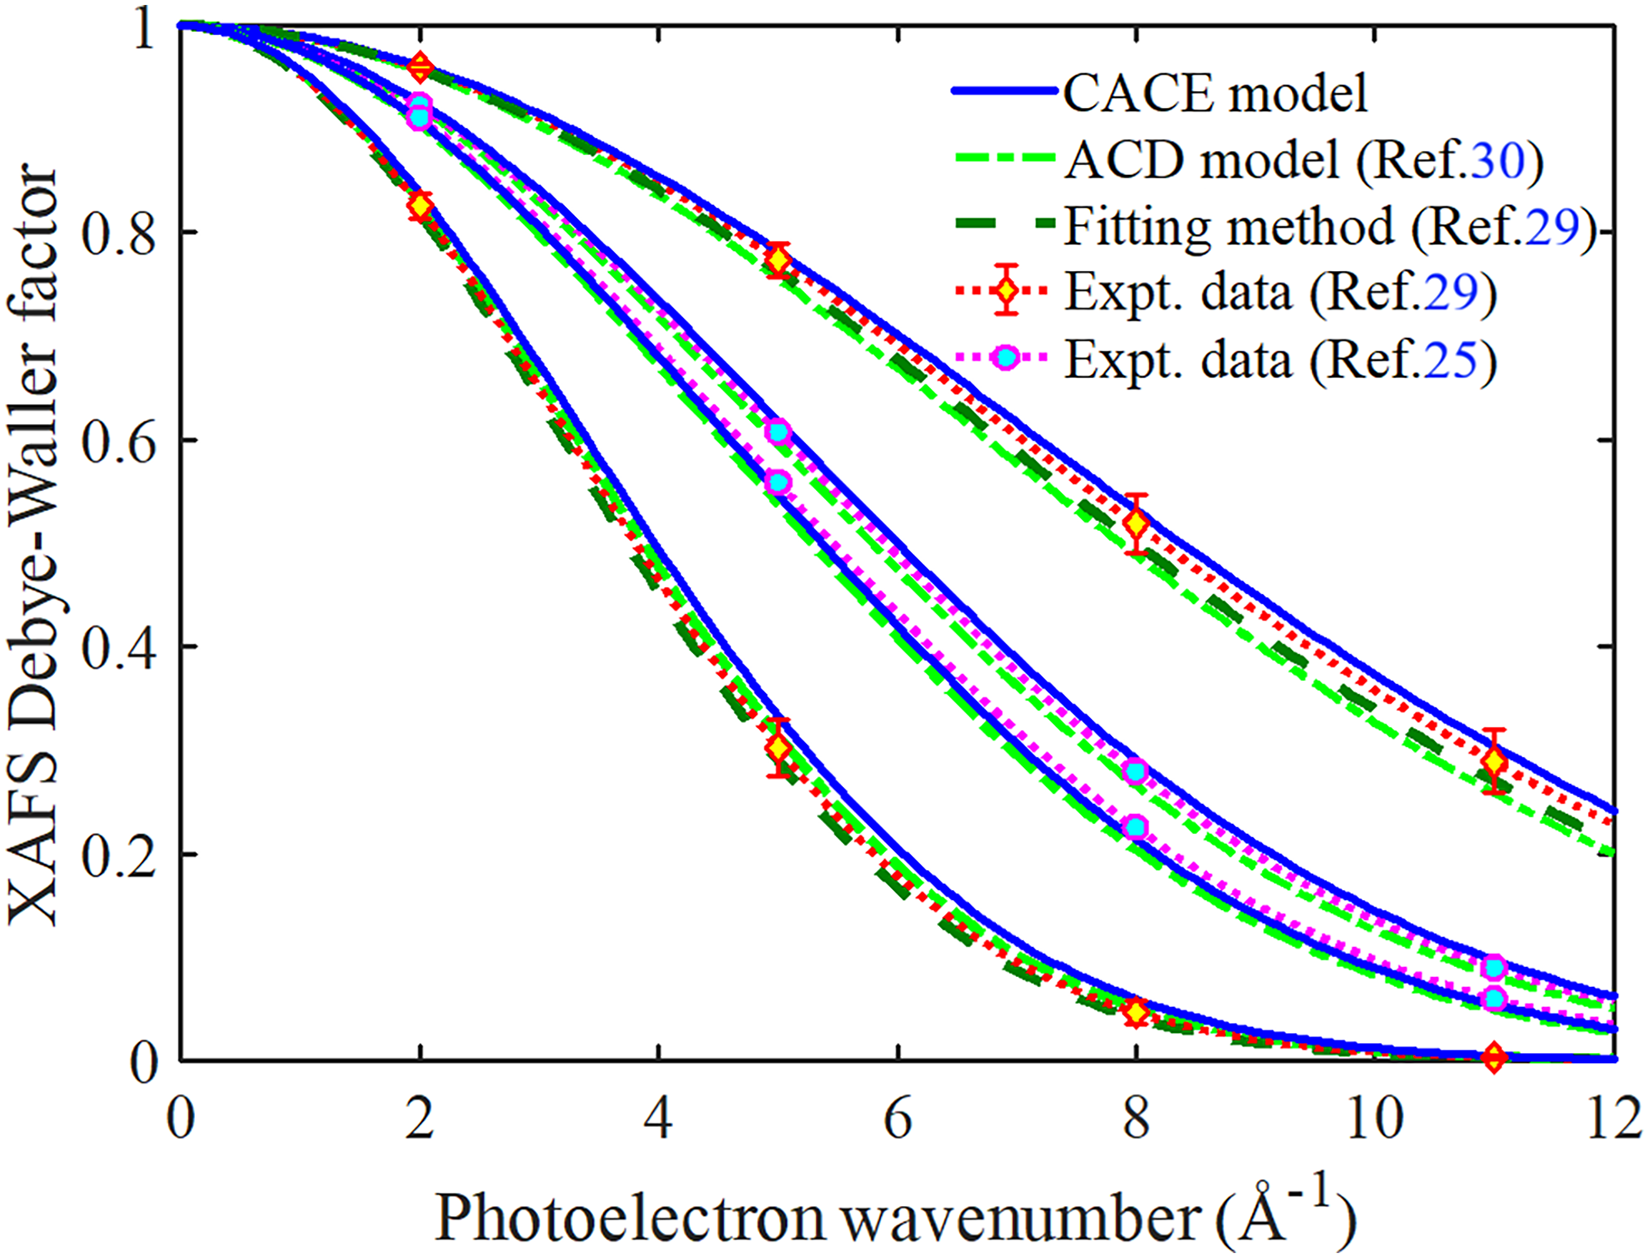
Wavenumber-dependent XAFS DW factors of Ag obtained from the present CACE and ACD models, fitting method, and experimental data at selected temperatures.
The obtained values of the anharmonic XAFS DW factor of Ag at various wavenumbers and temperatures are presented in Table IV. It is observed that W(T, k) decreases with increasing wavenumber k, and the rate of decrease becomes more pronounced as the temperature T increases from 150 K to 673 K. This behavior reflects the physical nature of atomic vibrations in the anharmonic XAFS analysis; at larger wavenumbers, the signal amplitude diminishes sharply due to stronger scattering and phase-shift effects, while higher temperatures enhance the amplitude of atomic vibrations, leading to greater thermal disorder and a more rapid decline.3,13 The rapid decrease of W(T, k) towards zero at 673 K for k > 10 Å–1 demonstrates that the XAFS signal at high wavenumbers is highly sensitive to thermal disorder, particularly in the high-temperature regime. Furthermore, at 150 K, a temperature lower than the correlated Einstein temperature θE, the ACD model 30 shows better agreement with the fitting method and experimental data25,29 owing to its explicit inclusion of quantum effects. In contrast, the present CACE model, based on the CS approach, cannot accurately reproduce W(T, k) at low temperatures. 36 However, the discrepancies between the values from the present CACE model and those obtained from the ACD model, 30 fitting method, and experimental data25,29 are not significant, indicating that the present CACE model remains applicable for the anharmonic XAFS analysis at elevated temperature.
The anharmonic XAFS DW factor of Ag is obtained from the present CACE model, ACD model, fitting method, and experimental data at various wavenumbers and temperatures.
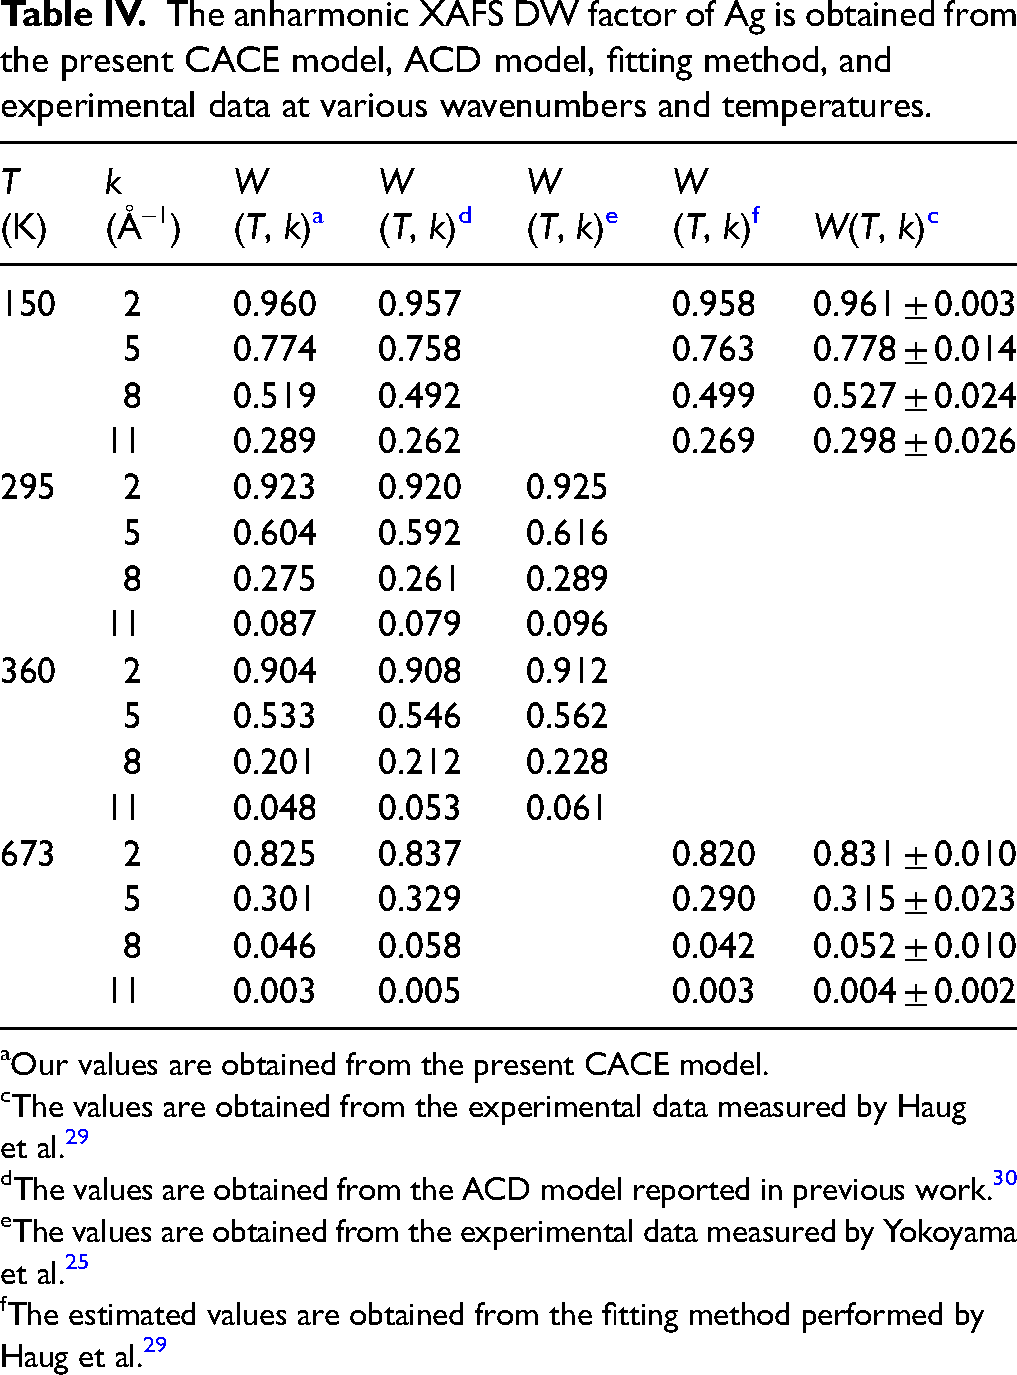
Our values are obtained from the present CACE model.
The values are obtained from the experimental data measured by Haug et al. 29
The values are obtained from the ACD model reported in previous work. 30
The values are obtained from the experimental data measured by Yokoyama et al. 25
The estimated values are obtained from the fitting method performed by Haug et al. 29
In the anharmonic XAFS analysis, the Fourier transform (FT) of the XAFS function χ(k) is widely used in the data analysis and plays a central role in extracting local structural information. 2 The function χ(k), defined as the oscillatory part of the absorption coefficient, contains information about the distances and coordination environment of neighboring atoms. 13 However, this information is embedded in a complex interference pattern in momentum space (k-space). 54 By applying an FT with an appropriate window function, the signal is converted into real space (R-space), yielding a magnitude function | χ(k) | that exhibits peaks corresponding approximately to the radial distances of atomic shells. 11 The kn-weighted FT magnitudes provide an intuitive R-space representation of the local structure and enable quantitative comparison between theoretical simulations and experimental measurements. 29
The FT magnitudes | χ(k) | of Ag as a function of radial distance R, obtained from the present CACE model and experimental data with first-shell filtering at 150 K and 673 K, are shown in Figure 6. Herein, | χ(k) | is defined as the magnitude of the Fourier transform of k2χ(k), using a Hanning window over the k-range 2.6–18 Å–1, and the first-shell analyses were carried out over the R-range 1.4–3.6 Å. Because no phase correction is applied, the energy-dependent phase shifts from the absorber and scatterer are not removed, so the first-shell peak in | χ(k) | appears at R ≈ 2.65 Å, slightly smaller than the crystallographic distance (R ≈ 2.89 Å). 51 The obtained results from the present CACE model are derived from the function χ(k) in Eq. 1 using σ2(T) defined from Eq. 22, and the experimental results are extracted from the measured data reported by Haug et al. 29 It is observed that our results fit with experimental results, 29 particularly around the main peak located near. As the temperature increases, the amplitude of the main peak decreases significantly. For example, the obtained values from the present CACE model at 150 K and 673 K are | χ(R) | ≈ 0.598 Å–2 and | χ(R) | ≈ 0.164 Å–2, respectively, while the corresponding experimental values 29 are | χ(R) | ≈ 0.579 Å–2 and | χ(R) | ≈ 0.161 Å–2, respectively. This consistent decrease in amplitude with increasing temperature reflects the expected thermal damping of anharmonic XAFS signals, driven by enhanced atomic disorder. The shape and evolution of the theoretical curves closely reproduce the experimental data, including the attenuation trend and broadening of the peak with increasing temperature. Moreover, the experimental data of | χ(R) | reported by Haug et al. show a clear low-R sub-peak adjacent to the first-shell maximum. 29 The inclusion of the anharmonic third (skewness) and fourth (kurtosis) cumulants reproduces this feature by transforming the low-R sidelobe into a distinct sub-peak, an effect that is further enhanced by the absence of phase correction. 29 In contrast, this work is restricted to the first shell and uses only σ2(T), such that the basic lineshape consists of a single peak, with any remaining ripples arising primarily from window or k-range artifacts (ringing) rather than from genuine structural features.2,3 Regarding temperatures, at higher temperatures (673 K), the development of σ2(T) suppresses high-k components and broadens the peak, thereby reducing the resolution of R. Meanwhile, at lower temperatures (150 K), σ2(T) remains small, resulting in a wide effective k range and a sharp peak, thereby allowing anharmonicity to accentuate the low-R sub-peak. As a result, the sub-peak is smeared and gradually merges into the main peak, appearing only as a shoulder. This quantitative agreement validates the ability of the present CACE model to describe the temperature-dependent XAFS behavior of Ag. It reflects the reliability of the cumulant-based formulation of the XAFS DW factor in R-space, as shown in Figure 6.
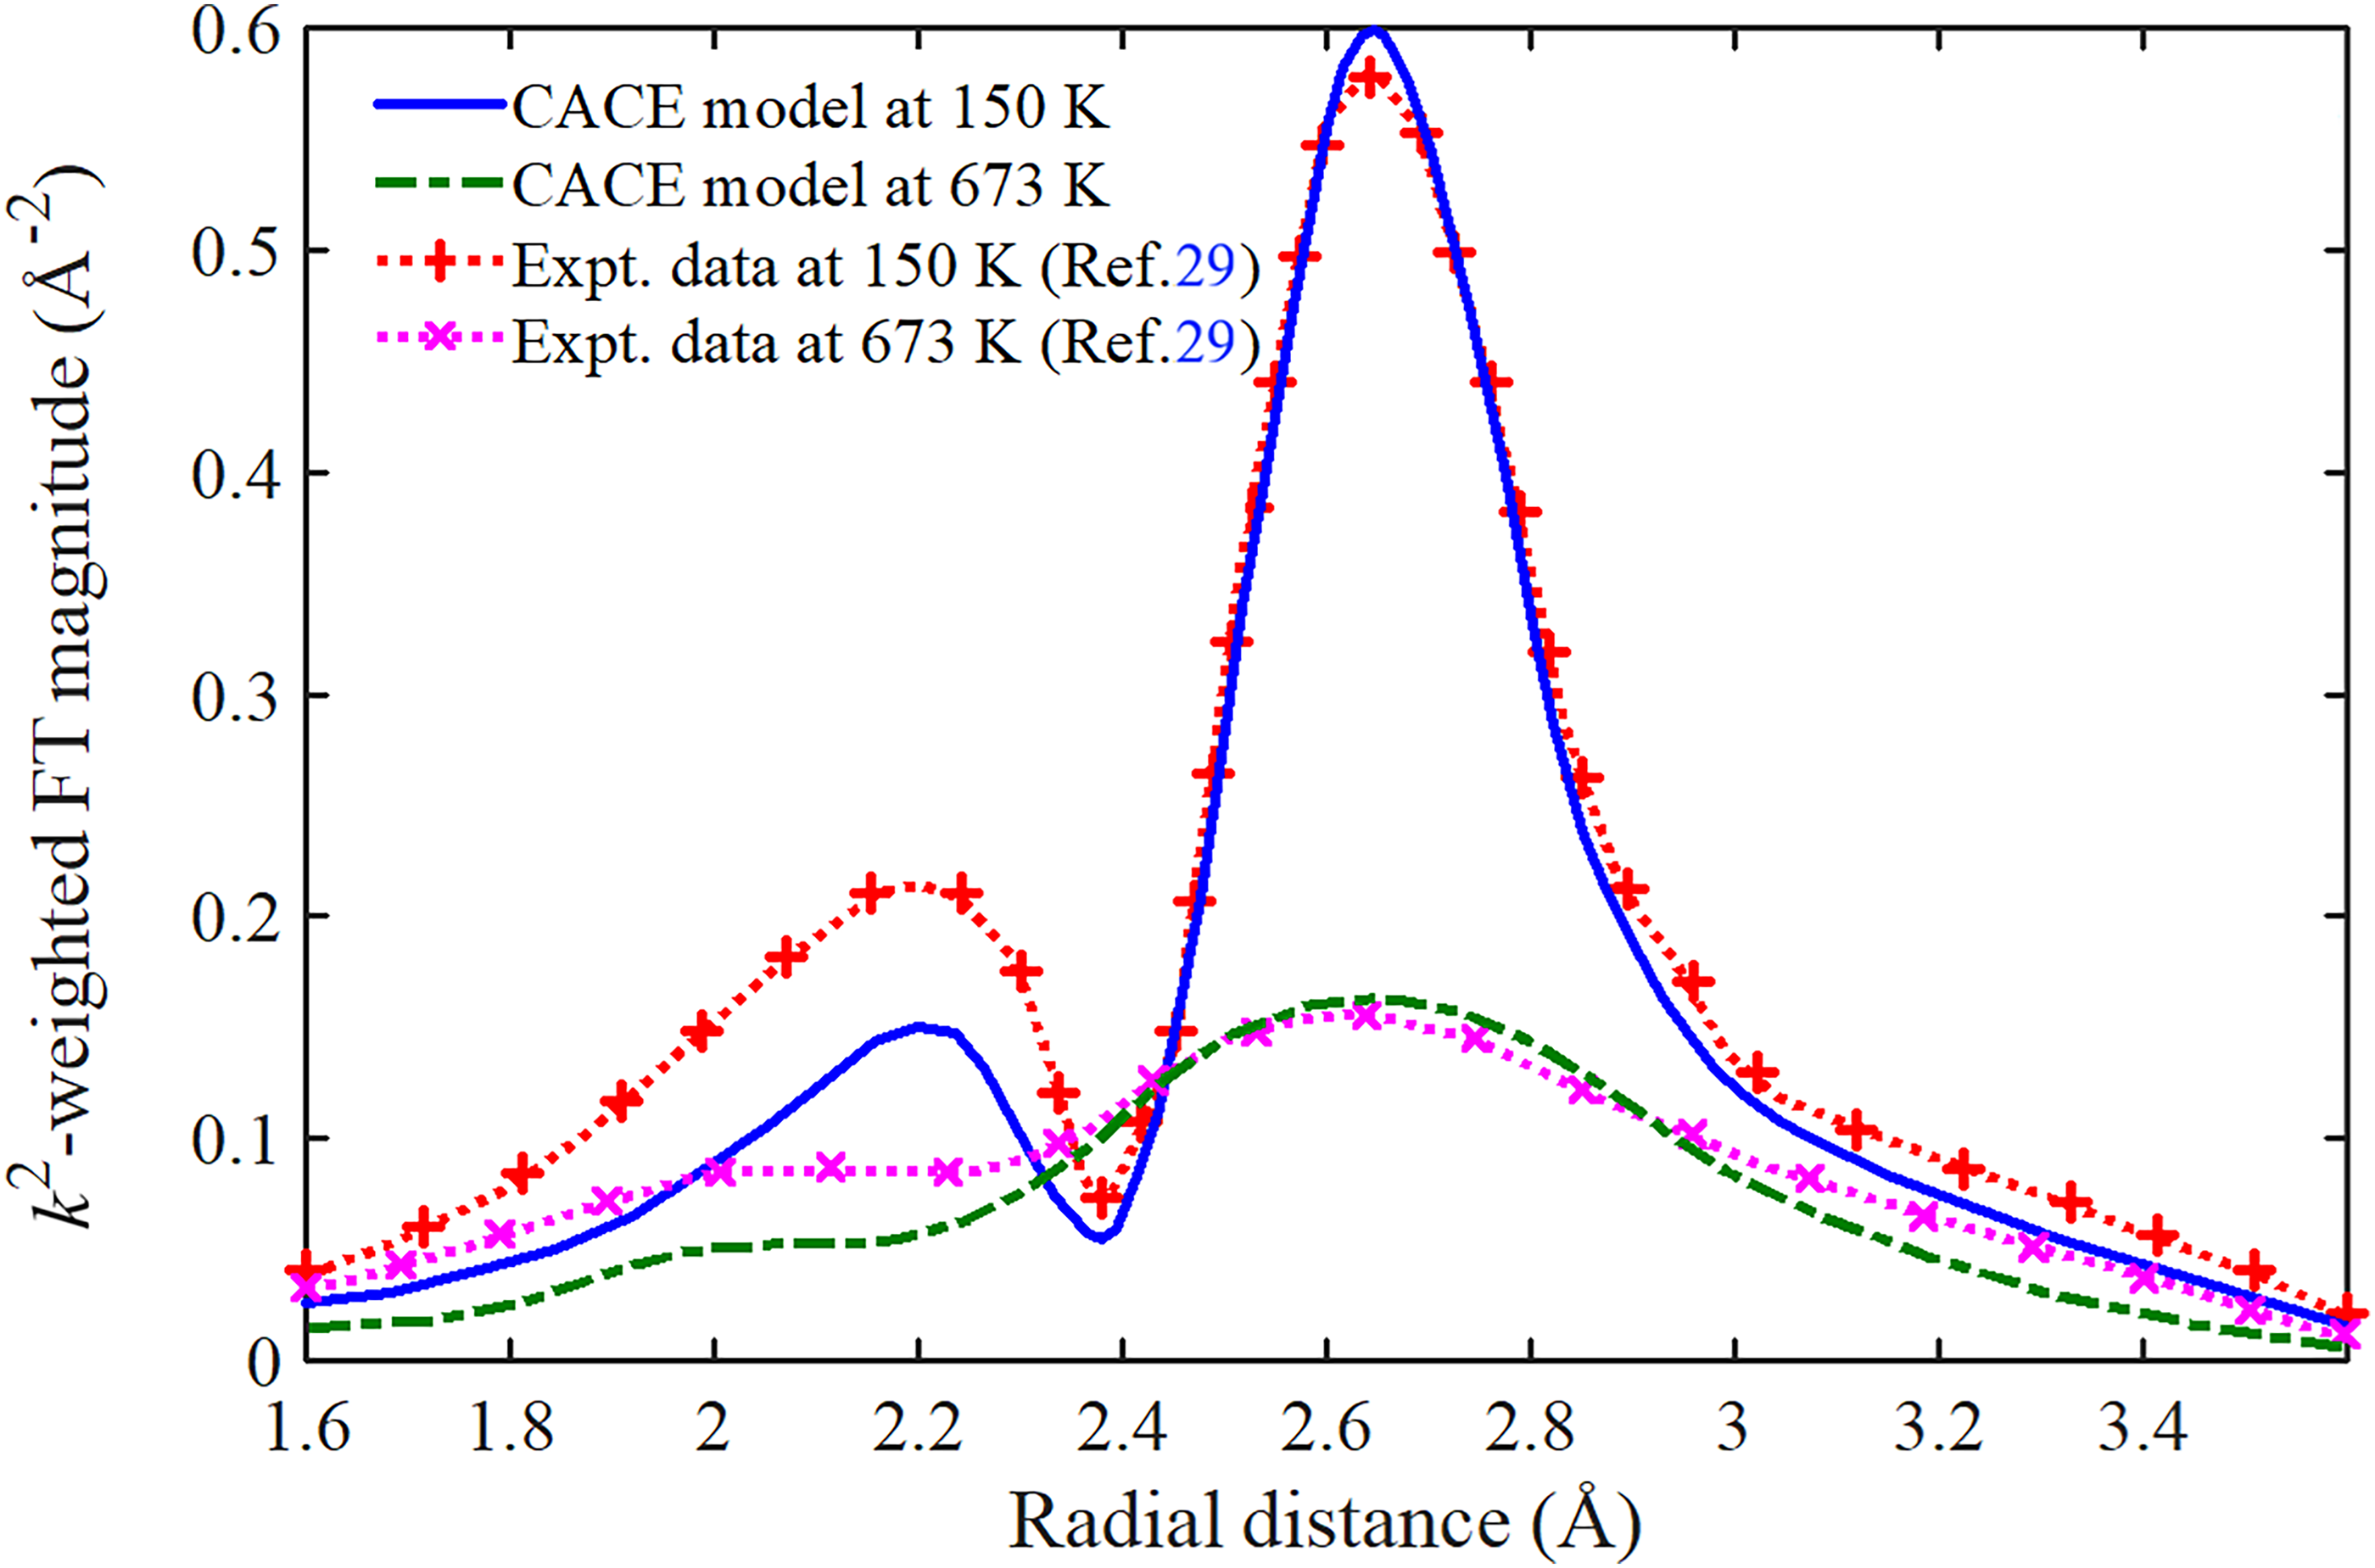
R-dependent FT magnitudes of Ag with first-shell filtering, obtained from the present CACE model and experimental data at selected temperatures.
These findings confirm that the present CACE model remains an effective tool for analyzing XAFS in the moderate to high-temperature range, where classical assumptions are valid, and also emphasize the importance of selecting an appropriate theoretical model for different temperature regimes in the anharmonic XAFS DW factor analysis.
Conclusion
In summary, the present CACE model has been demonstrated to be an effective and physically consistent tool for analyzing the anharmonic XAFS DW factor of Ag, particularly in the moderate-to-high temperature regime where classical assumptions remain valid. By employing the AE potential, which incorporates both anharmonic and interatomic correlation effects, the model provides a simple yet realistic description of three-dimensional interatomic interactions in the crystal lattice. As a result, atomic thermal vibrations and anharmonic effects are more realistically captured, improving the analysis of XAFS amplitude attenuation at elevated temperature and larger wavenumber.
The numerical results for Ag obtained using this model show good agreement with the experimental data, fitting method, and the ACD model at moderate and high temperatures within the temperature range where the classical approximation remains valid, confirming its validity and effectiveness under thermal disorder. In addition, the fit between the temperature-dependent FT magnitudes | χ(k) | from both theory and experiment confirms that the present CACE model can accurately describe the attenuation and broadening behavior of the XAFS peaks as the temperature increases. Although quantum effects such as ZP motion dominate at low temperatures and are not accounted for within the classical framework, results in this regime are included only to illustrate the limitations and breakdown of the classical approximation, rather than for quantitative interpretation. Based on a quantitative comparison with the exact quantum-mechanical expression for lattice vibrations, the present CACE model is shown to be reliable only for temperatures T ≳ 0.90E.
Furthermore, the practical applicability of the present CACE model is highlighted by its seamless integration into the IFEFFIT framework using a modified FEFF code. This allows the obtained results to be directly incorporated into the fitting process as input parameters, facilitating accurate modeling of anharmonic XAFS signals without requiring structural changes to existing analysis software. Consequently, this approach not only reduces uncertainties in the interpretation of experimental data affected by thermal disorder but also provides an effective tool for investigating anharmonic XAFS DW factors in a wide range of metals, particularly from moderate temperatures up to near their melting points. The generality and practical relevance of the present CACE model are therefore confined to its well-defined high-temperature validity range, making it a valuable contribution to the study of anharmonic effects in XAFS signal.
Footnotes
Acknowledgments
This research is funded by the Vietnam National Foundation for Science and Technology Development (NAFOSTED) under Grant no. 103.01-2023.32. The authors gratefully acknowledge the anonymous reviewers for their insightful comments and constructive suggestions that significantly improved the quality of this work.
Declaration of Conflicting Interests
The authors declared no potential conflicts of interest with respect to the research, authorship, and/or publication of this article.
Funding
The authors received no financial support for the research, authorship, and/or publication of this article.
Data Availability
The data that support the findings of this study are available from the corresponding author upon reasonable request.
