






Abstract
Minimally invasive screening tools are essential for early detection of oral cancers to reduce mortality. A key necessity is the ability to differentiate highly heterogeneous oral potentially malignant disorders (OPMDs) and cancers. This study evaluated serum and salivary Raman spectroscopy (RS) for detecting OPMDs and oral cancers. Blood and saliva were collected from 13 non-habitual controls (NHC), 13 tobacco habitués (HC), 10 leukoplakia (L), 25 oral submucous fibrosis (OSMF), and 14 oral squamous cell carcinoma (OSCC) subjects. Raman spectra were acquired, pre-processed, and analyzed using multivariate methods. Serum outperformed saliva in individual classification models, achieving accuracies of 92%, 85%, 100%, 88%, and 85% for NHC, HC, L, OSMF, and OSCC, respectively. Saliva, despite its non-invasive advantage, showed higher misclassification among HC, L, OSMF, and OSCC. Low-level fusion of serum and saliva spectral data improved the classification of OSMF, OSCC, and NHC groups compared to saliva models. Mid-level fusion surpassed both biofluids, reaching 100% accuracy for NHC, L, and OSMF. Multivariate curve resolution–alternating least squares analysis of serum revealed altered protein- and lipid-related features among groups. These findings demonstrate the potential of serum and salivary RS, particularly with data fusion, as effective tools for OPMD and oral cancer screening.
This is a visual representation of the abstract.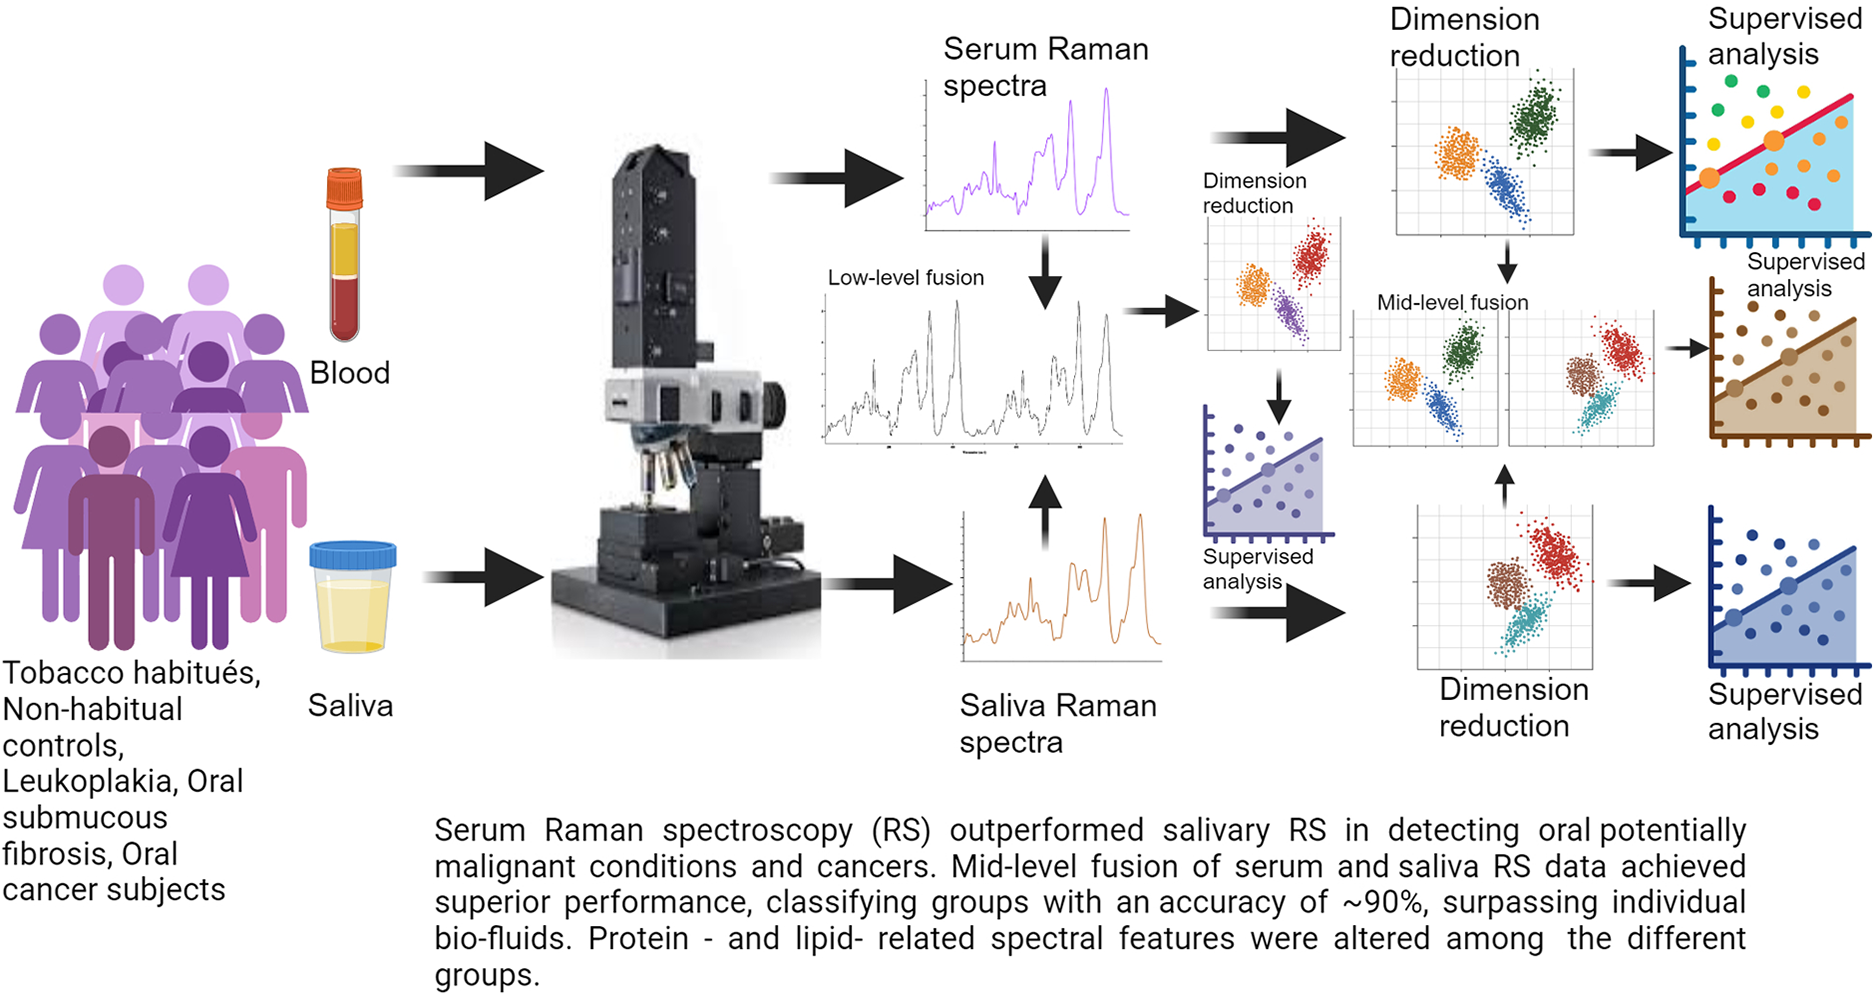
Introduction
The high incidence of oral cancer is a major concern worldwide. The situation in India is especially grim, where it has the highest incidence among males. 1 Owing to the lack of awareness among the vulnerable population, a significant number of patients present with advanced-stage disease. Delayed detection and recurrence can lead to high mortality rates. 2 Several studies have highlighted the importance of early detection and screening to reduce mortality and enhancing five-year survival rates.3–5 Early-stage cancers are often asymptomatic and can resemble benign conditions, which reduces the likelihood of individuals seeking medical attention. Screening offers the opportunity for early detection in these cases.
An important aspect of early detection is accurate identification of oral potentially malignant disorders (OPMDs). OPMDs are highly heterogeneous in appearance and have significant malignant transformation rates. 6 The World Health Organization defines oral leukoplakia as a white patch or plaque that cannot be ascribed to any other disease. 7 The exact etiology of leukoplakia is unknown, however, long-term tobacco use has been strongly correlated with its development. Oral submucous fibrosis (OSMF) is a chronic condition characterized by fibrosis of the lining mucosa of the upper aerodigestive tract, involving the oral cavity, oropharynx, and often the upper third of the oesophagus.6,8 OSMF leads to increased tissue mobility. It is strongly linked to areca nut chewing, which is the main component of betel quid. 9 Consequently, it is the most prevalent precancerous lesion, posing a unique challenge, particularly in Southeast Asia, where India is particularly affected. 10
Tissue biopsy followed by histopathological analysis is the gold standard for the detection of oral cancer. Apart from being invasive in nature, it is also time consuming and relies on the appearance of lesions. An ideal screening tool is minimally invasive, rapid, objective, cost-effective, and capable of detecting biochemical alterations that precede morphological changes. Raman spectroscopy (RS) provides a biomolecular snapshot of biological samples. Numerous Raman spectroscopy studies have shown promising results in the detection of oral pathologies.11–15 In vivo RS has shown efficacy in identification of not only tobacco habitués, oral premalignant and oral cancer, but has also demonstrated the ability to identy field cancerization in the oral cavity.14–18 Although in-vivo RS is non-invasive and achieves highly sensitive results, it suffers from limitations such as the necessity for ambient temperature and dark rooms. To address these challenges, Raman spectroscopy of biofluids has been explored.11,19,20
Serum is the liquid component of blood, excluding blood cells and coagulation factors. Blood serum investigations for disease detection offer numerous advantages, such as a minimally invasive collection process, which involves a simple blood draw. This makes it patient-friendly compared to tissue biopsies. Blood serum provides a comprehensive snapshot of a patient's systemic health, as it contains a wide array of biomarkers, including proteins, metabolites, lipids, electrolytes, cell-free nucleic acids, and other molecules that can indicate the presence of diseases. Due to the ease of collection, transport, and storage, serum is amenable to large-scale screening and serial sampling, contributing to more effective disease monitoring and management. Serology is vital for the detection of a variety of lifestyle-related conditions and infectious diseases. Serum biomarkers such as PSA for prostate cancer and AFP for liver cancers, are in clinical use.21,22 Serum-based investigations provide a valuable and patient-friendly approach for disease detection and monitoring.
Saliva is a hypotonic solution secreted by the salivary glands. Collection of saliva is a non-invasive procedure that does not require specially trained professionals. Like serum, saliva is also suitable for mass screening and serial sampling. Several studies have reported the efficacy of saliva for the detection of various diseases, including cancer.23–25
Independent serum and salivary RS studies have demonstrated promise in detecting various cancers, including oral cancers and oral premalignant conditions.19,20,26–29 Most previous investigations have grouped all highly heterogeneous OPMDs into a single category. The delineation of OPMDs is crucial because of their diverse characteristics and varying malignant transformation rates. This study investigated two of the most prevalent OPMDs, leukoplakia and oral submucous fibrosis, alongside tobacco habitués, non-habitual controls, and oral squamous cell carcinoma subjects. Additionally, serum and saliva from the same cohort have been examined. Several studies have reported the application of fusion strategies to generate highly accurate models.30–36 Serum and saliva data from the same cohort have further enabled the construction of fusion models in this study. Exploratory MCR-ALS analyses of sera and saliva samples were performed to gain deeper insights into the biomolecular differences among the different groups and to establish a basis for the discrimination of the different groups.
Experimental
Materials and Methods
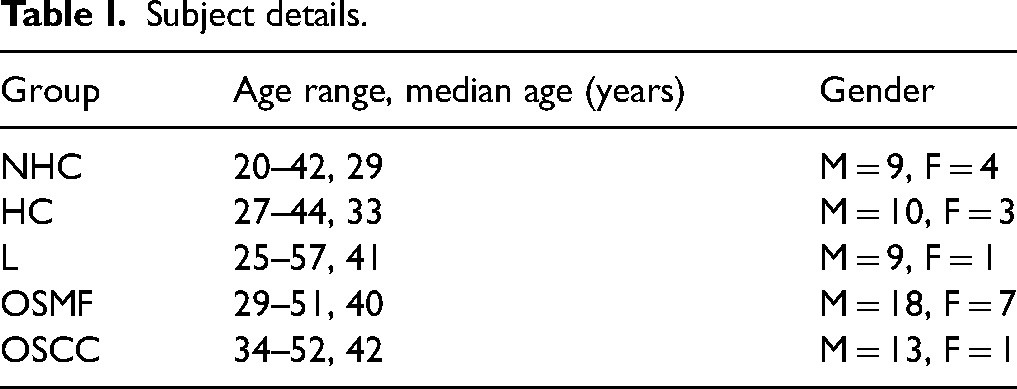
A total of 75 subjects (13 NHC, 13 HC, 10 L, 25 OSMF, 14 OSCC) were accrued to this study. The OPMD, HC and NHC subjects were accrued from Nair Dental College, Mumbai. The OSCC subjects were accrued from Tata Memorial Centre, Advanced Centre for Treatment, Education and Research in Cancer (TMC-ACTREC). Institutional Ethical Clearance were obtained from both institutes. Written informed consent was obtained from all subjects. Table I summarizes the details of all the subjects. All participants underwent a comprehensive clinical oral examination at the time of recruitment. Individuals with acute oral infections or significant inflammatory conditions unrelated to the study groups were excluded to minimize potential confounding effects.
Subject details.
Sample Collection and Storage
Blood (4 ml) and unstimulated saliva (5 ml) were collected from all subjects. Blood samples were collected in plain red-cap vacutainer tubes without anticoagulant and allowed to clot at room temperature. Following clot formation, the serum fraction was carefully collected, aliquoted into several tubes, and stored at −80 °C until analysis. Participants were instructed to rinse their mouths with plain water and wait for 15 minutes prior to sample collection. Unstimulated whole saliva was then collected using the passive drooling method. The collected saliva was immediately stored at –80 °C to preserve its integrity for subsequent analysis.
Sample Preparation and Raman Spectroscopy
The serum samples were passively thawed at 4 °C, vortexed at low speed and subjected to RS. 8 μl of the thawed serum was applied to a calcium fluoride (CaF2) window and Raman spectra were recorded using a WITec 300R alpha (WITec GmbH, Germany) confocal Raman instrument. The spectral acquisition conditions were: 532 nm laser source, approximate power output of 30 mW, 100× objective lens (Zeiss; numeric aperture, or NA, 0.75), grating 600 grooves/mm, and 5 second acquisitions over 10 integrations. Raman spectra (n = 10) were obtained from different regions of the sample. The spectrograph was calibrated by utilizing the 520 cm–1 Raman line of silica. The Raman spectra acquired were interpolated within the 600 to 1800cm–1 range. Each spectrum was pre-processed, which encompassed smoothing for noise reduction, baseline correction by fitting and subtraction, and vector normalization. To circumvent intra-sample variations, the ten pre-processed spectra for each sample were averaged, resulting in a single representative average spectrum. The sample average spectra were subjected to multivariate analyses.
A 15 μL drop of saliva was dispensed on a CaF2 window and air-dried at room temperature. This approach was employed in previous studies.29,37 Saliva spectral acquisition was carried out as described above.
Mean Spectra
Mean spectrum for each of the groups was computed by averaging all the sample mean spectra of the respective group. Following this method, mean spectra of sera and saliva for NHC, HC, L, OSMF and OSCC groups were generated to identify spectral features of the sera and saliva of the different groups.
Multivariate Analyses for Classification
Separate five-, four-, and three-class models were built for serum and saliva. The five-model system encompassed all the study groups, the four-model system wherein the HC, L, OSMF and OSCC groups were analyzed, and the three-model system examining the L, OSMF, and OSCC groups. Unsupervised principal component analysis (PCA) was used for dimensionality reduction, followed by PC-based quadratic discriminant analysis (PC-QDA) for classification. For low-level fusion, pre-processed mean serum and saliva spectra per subject were concatenated to form fused data, subjected to PCA and subsequently to PC-QDA. For mid-level fusion, five serum PCs and three saliva PCs per subject were combined, and QDA models were constructed for each of the five-, four-, and three-class systems. The number of principal components (PCs) retained for serum and saliva was selected based on the variance explained and model stability. Multiple combinations of PCs from the two biofluids were evaluated, and the optimal combination (five serum PCs and three saliva PCs) was chosen based on the best performance. All models were validated using leave-one-patient-out cross-validation (LOPOCV).
Multivariate Curve Resolution Analysis
Exploratory multivariate curve resolution alternating least squares (MCR-ALS) analysis was performed separately on serum and saliva RS data, to better understand the altered spectral features across the groups.
Shapiro–Wilk’s test was employed to determine if the relative abundance values of each component were normally distributed. Based on the results, either Anova or Kruskal–Wallis test followed by pairwise comparison was used to test for significance. Figure 1 is a schematic diagram of sample collection, RS acquisition, and data analysis.
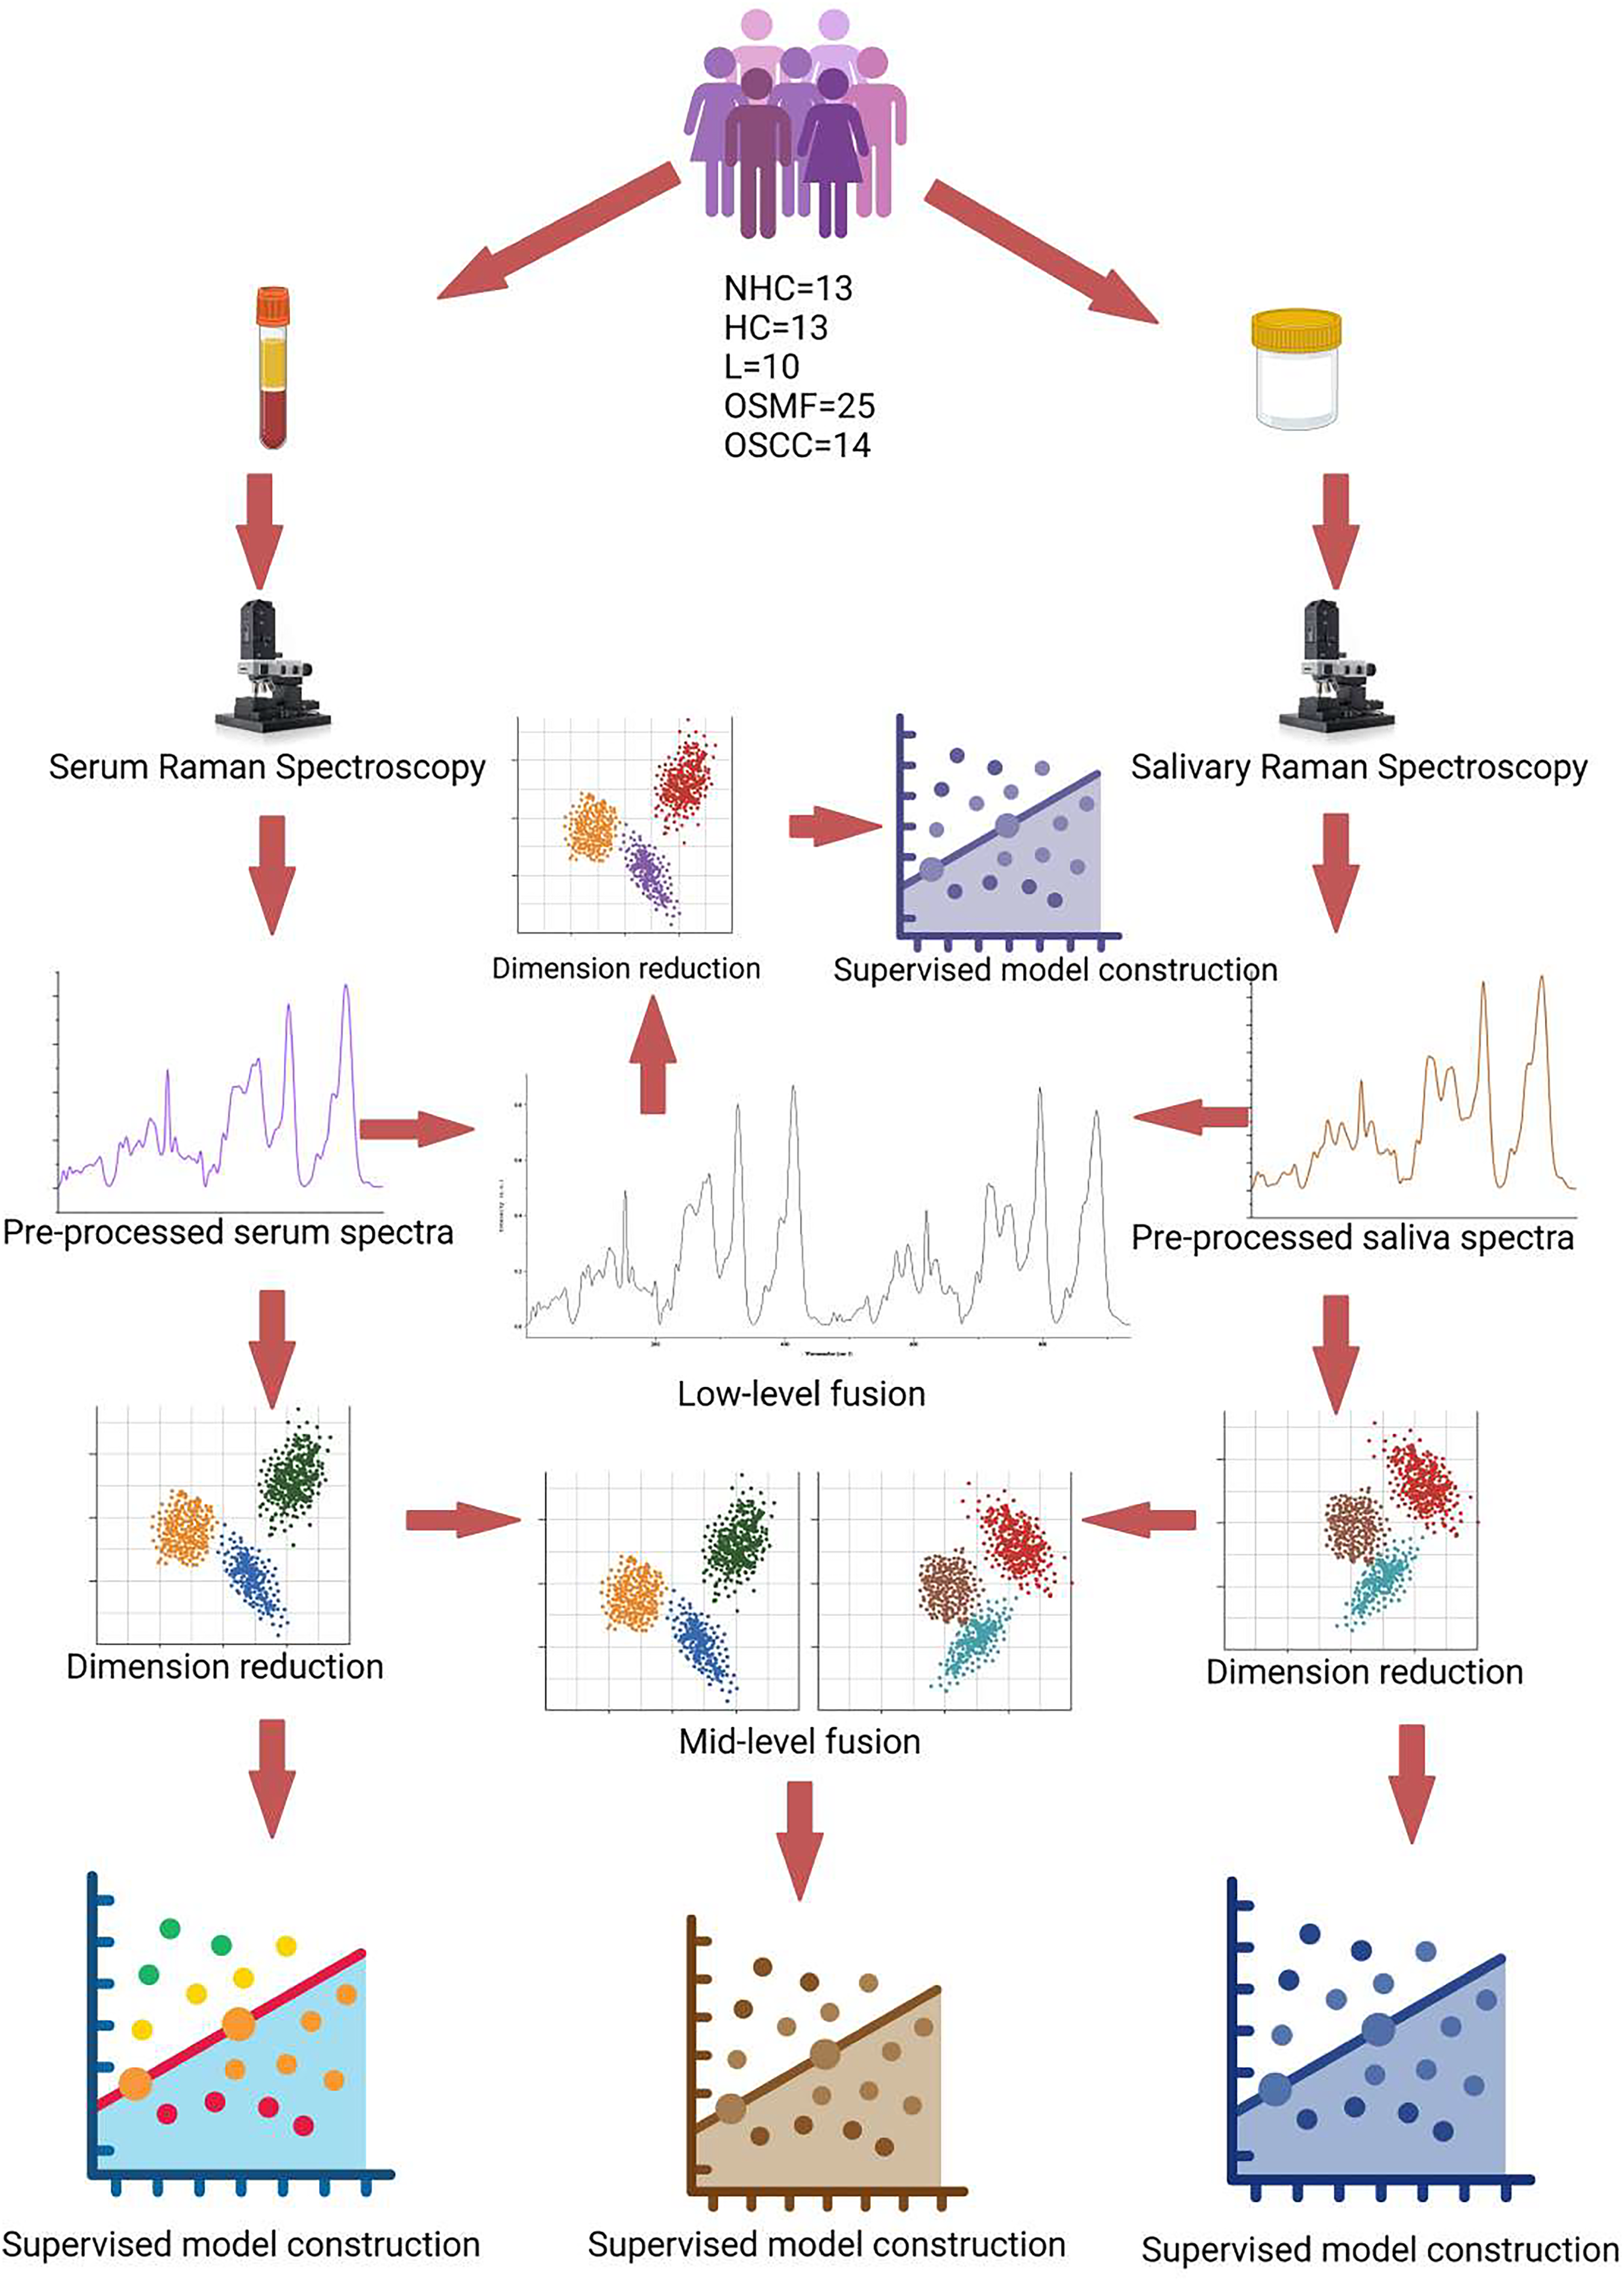
Schematic diagram of sample collection, Raman spectra acquisition and data analysis.
Results and Discussion
Mean Spectra
Mean serum and saliva spectra of the different study groups were generated. In serum spectra of all the study groups (Figure S1a, Supplemental Material), prominent bands attributable to proteins and lipids were observed at 830, 850 (Tyr), 1004, 1033 (Phe), 1087 (PO2– stretch), 1247 (amide III), 1451 (CH2 bending), 1620 (Tyr), 1655 (amide I) and 1745cm–1 (C = O, ester). Protein-related bands at 870 (Hyp), 921 (Pro), 1004, 1033 (Phe), 1248 (amide III), 1452 (CH2 bending), and 1667 cm–1(amide I) observed in the saliva spectra of all the groups (Figure S1b, Supplemental Material). Table S1 (Supplemental Material) summarizes the observed Raman bands and their tentative assignments.
Serum: Five-Model System (NHC Versus HC Versus L Versus OSMF Versus OSCC)
The PCA scatter plot showed substantial overlap among all five groups, with relatively minimal overlap between the NHC and OSCC groups (Figure S2a, Supplemental Material). In the PC-QDA scatter plot, overlaps persisted among the groups (Figure S3a, Supplemental Material). Using five PCs, the PC-QDA model correctly classified 11/13 (84.6%) HC, 10/10 (100%) L, 14/25 (56%) OSMF, 9/14 (64.2%) OSCC, and 12/13 (92.3%) NHC subjects (Figure 2a).
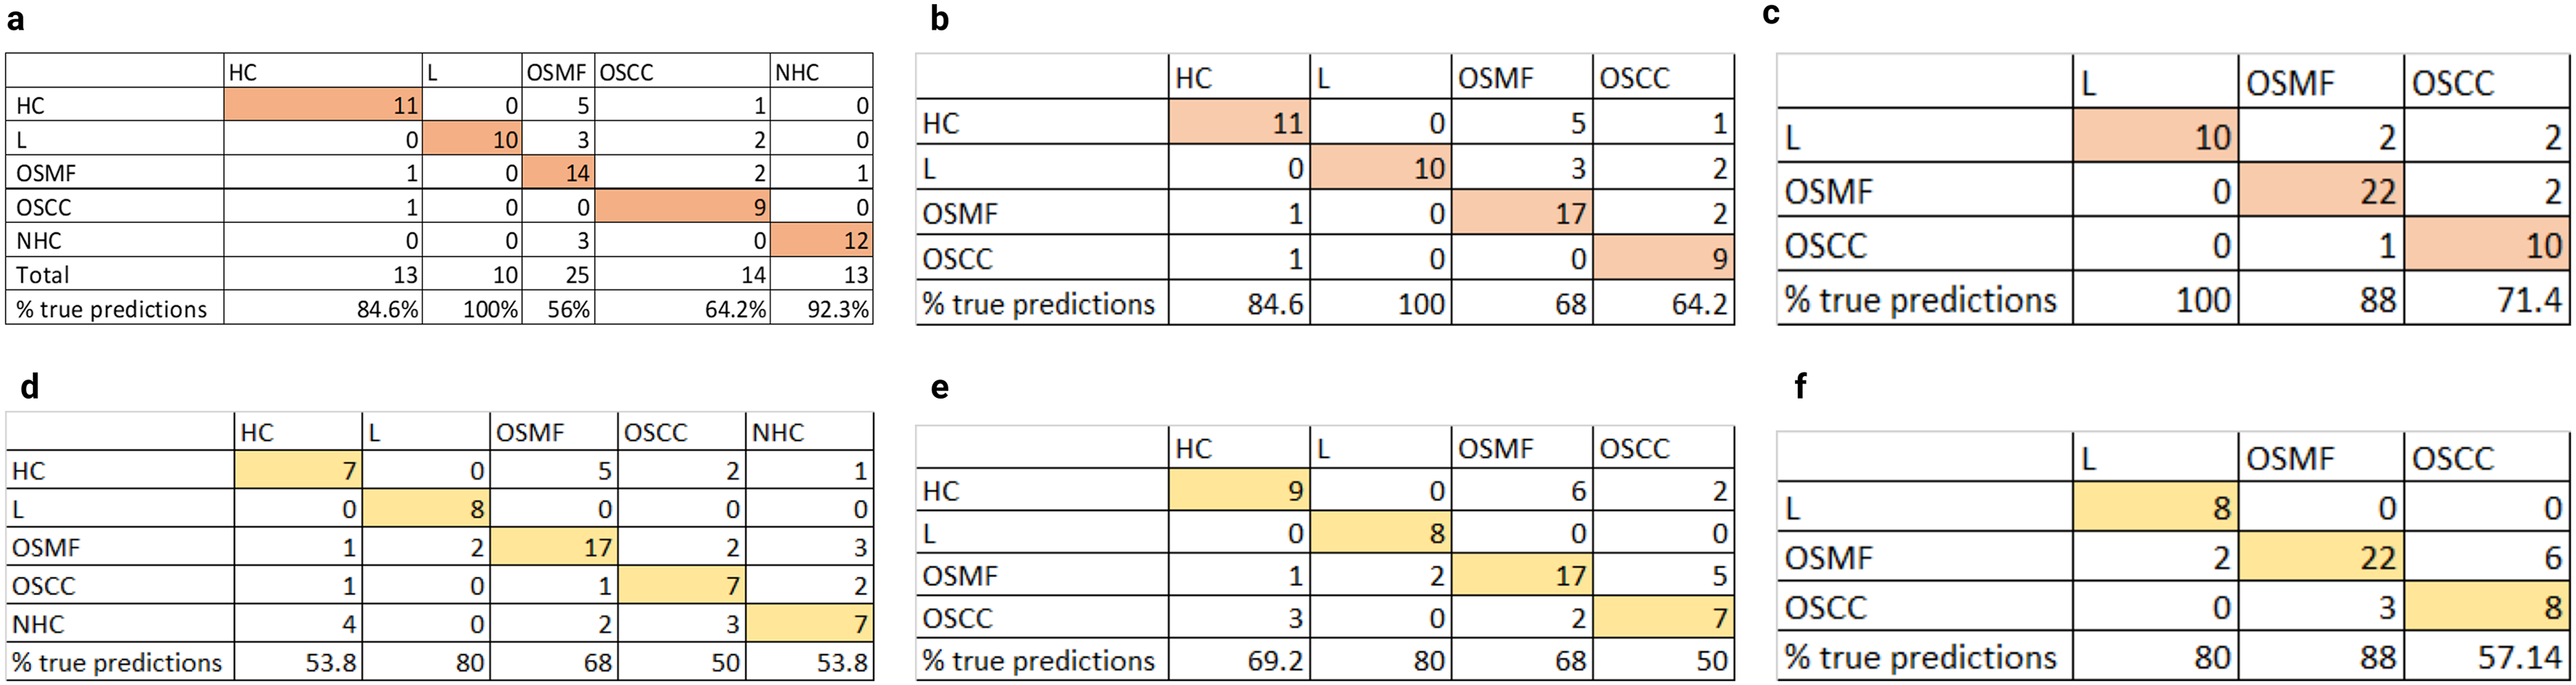
Serum and saliva PC-QDA confusion matrices, (a) serum five-model, (b) serum five-model, (c) serum three-model, (d) saliva five-model, (e) saliva four-model, and (f) saliva three-model. The results presented in the confusion matrices were validated by LOPOCV.
Serum: Four-Model System (HC Versus L Versus OSMF Versus OSCC)
The PCA revealed overlapping distributions across all four groups (Figure S2b, Supplemental Material). The PC-QDA scatter plot similarly showed overlapping clusters (Figure S3b, Supplemental Material). The PC-QDA model using five components achieved correct identification of 11/13 (84.6%) HC, 10/10 (100%) L, 17/25 (68%) OSMF, and 9/14 (64.2%) OSCC subjects (Figure 2b).
Serum: Three-Model System (L Versus OSMF Versus OSCC)
In the three-group comparison, PCA showed the L group forming a relatively distinct cluster, while OSMF and OSCC overlapped (Figure S2c, Supplemental Material). The PC-QDA scatter plot retained this pattern, with partial separation of L and overlap between OSMF and OSCC (Figure S3c, Supplemental Material). The PC-QDA model correctly classified 10/10 (100%) L, 22/25 (88%) OSMF, and 10/14 (71.4%) OSCC subjects (Figure 2c).
Saliva: Five-Model System
The PCA of saliva spectra demonstrated extensive overlap among all five groups, with the least overlap observed between NHC and OSCC (Figure S4a, Supplemental Material). The PC-QDA scatter plot continued to show overlapping group distributions, indicating limited visual separability (Figure S5a, Supplemental Material). The PC-QDA model correctly identified 7/13 (54%) NHC, 7/13 (54%) HC, 8/10 (80%) L, 17/25 (68%) OSMF, and 7/14 (50%) OSCC subjects (Figure 2d).
Saliva: Four-Model System
Overlapping group distributions were again evident in the PCA scatter plot (Figure S4b, Supplemental Material). The PC-QDA scatter plot showed similar overlap with no clearly isolated clusters (Figure S5b, Supplemental Material). Using five principal components, the model achieved correct classification of 9/13 (69.2%) HC, 8/10 (80%) L, 17/25 (68%) OSMF, and 7/14 (50%) OSCC subjects (Figure 2e).
Saliva: Three-Model System
In PCA, the overlap persisted between OSMF and OSCC (Figure S4c, Supplemental Material). Overlaps among the groups were also observed in the PC-QDA scatter plot (Figure S5c, Supplemental Material). The model correctly identified 8/10 (80%) L, 22/25 (88%) OSMF, and 8/14 (57.14%) OSCC subjects (Figure 2f).
Low-Level Fusion of Serum and Saliva: Five-Model System
The PCA of the low-level fused dataset did not reveal distinct clustering among the study groups (Figure S6a, Supplemental Material). In contrast, the PC-QDA scatter plot showed clearer clustering tendencies, though overlaps remained (Figure S7a, Supplemental Material). The PC-QDA model correctly classified 7/13 (53.8%) HC, 7/10 (70%) L, 19/25 (76%) OSMF, 8/14 (57.14%) OSCC, and 9/13 (69.2%) NHC subjects (Figure 3a).
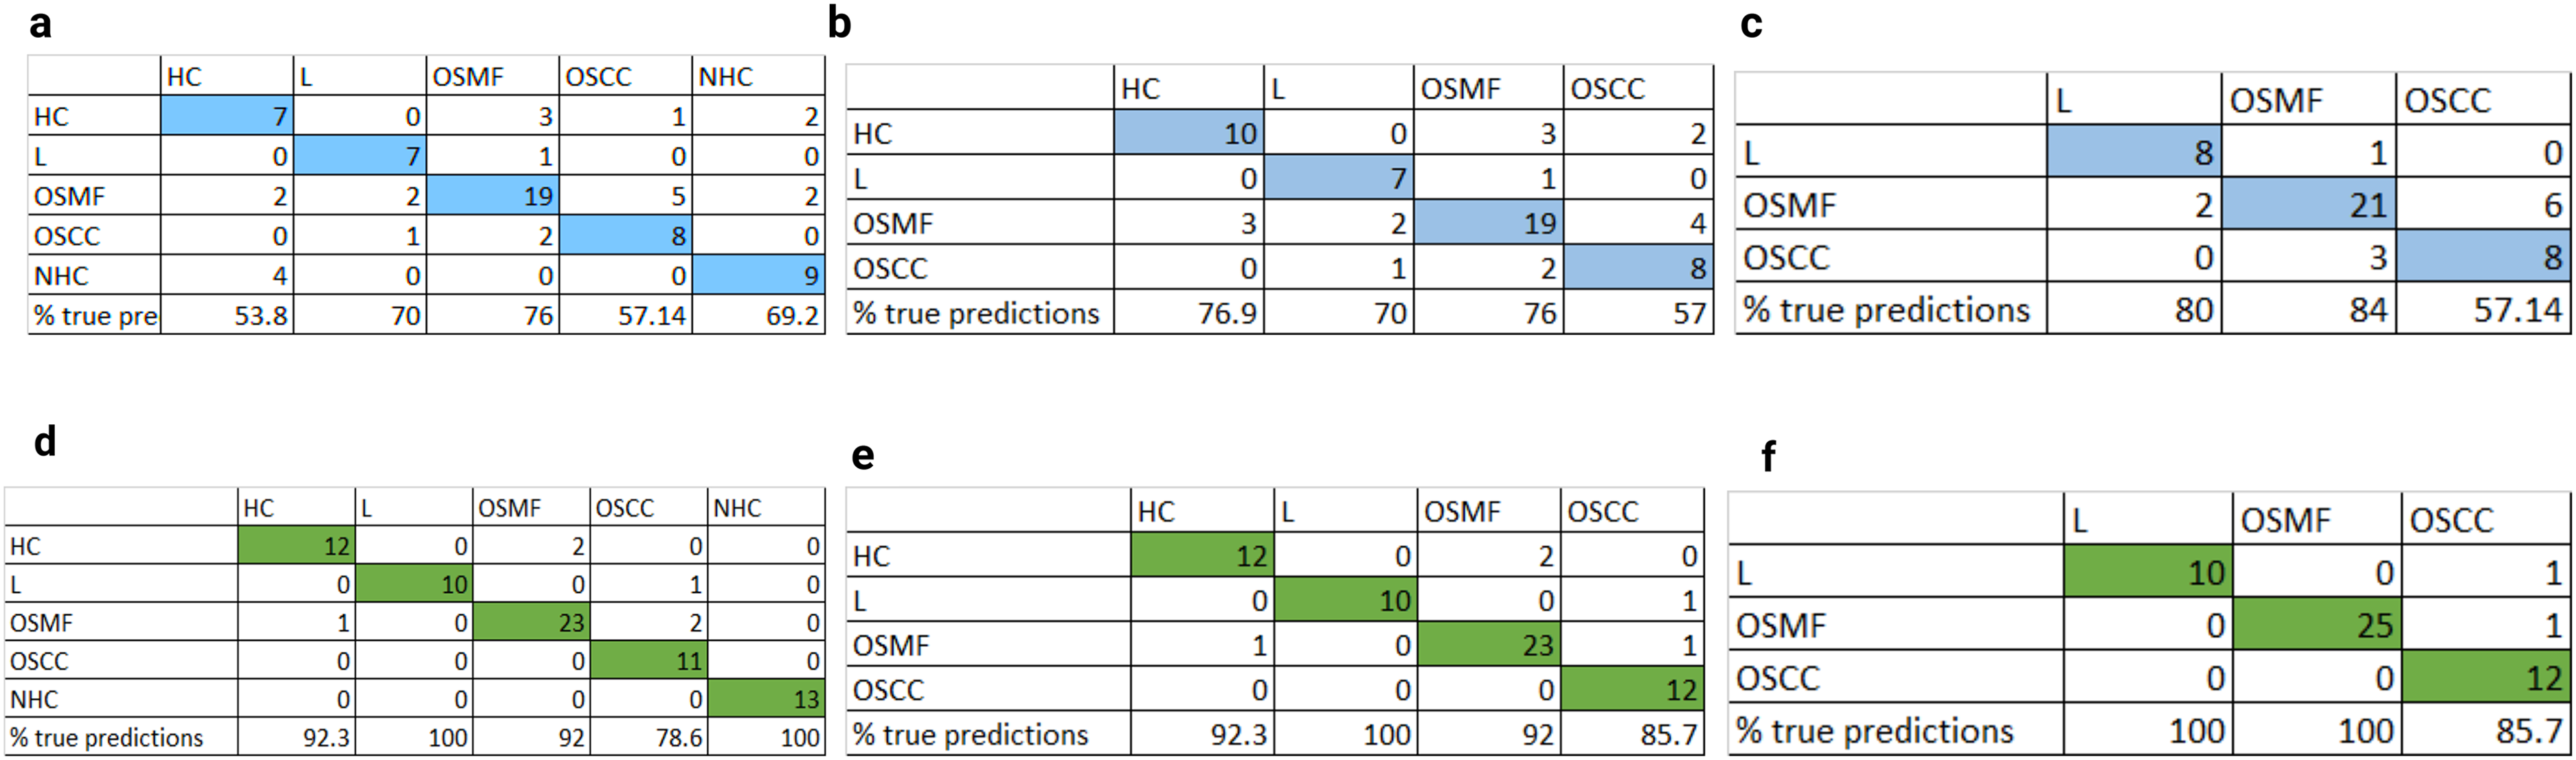
Low and mid-level confusion matrices, (a) low-level five-model PC-QDA, (b) low-level four-model PC-QDA, (c) low-level three-model PC-QDA, (d) mid-level five-model QDA, (e) mid-level four-model QDA, and (f) mid-level three-model QDA. The results presented in the confusion matrices were validated by LOPOCV.
Low-Level Fusion of Serum and Saliva: Four-Model System
The PCA scatter plot again showed no distinct group separation (Figure S6b, Supplemental Material). The PC-QDA scatter plot demonstrated improved visual separation across groups, although clusters were not fully discrete (Figure S7b, Supplemental Material). The PC-QDA model achieved classification accuracies of 77% for HC, 70% for L, 76% for OSMF, and 57% for OSCC subjects (Figure 3b).
Low-Level Fusion of Serum and Saliva: Three-Model System
The PCA indicated a clustering trend with overlap between OSMF and OSCC (Figure S6c, Supplemental Material). The PC-QDA scatter plot showed distinguishable but overlapping clusters for these groups (Figure S7c, Supplemental Material). The model correctly classified 8/10 (80%) L, 21/25 (84%) OSMF, and 8/14 (57.14%) OSCC subjects (Figure 3c).
Mid-Level Fusion of Serum and Saliva: Five-Model System
The QDA scatter plot showed a pattern similar to low-level fusion, with a more compact and distinct HC cluster (Figure S8a, Supplemental Material). The QDA model achieved correct classification of 12/13 (92.3%) HC, 10/10 (100%) L, 23/25 (92%) OSMF, 11/14 (78.6%) OSCC, and 13/13 (100%) NHC subjects (Figure 3d).
Mid-Level Fusion of Serum and Saliva: Four-Model System
The QDA scatter plot revealed clearer separation among the four groups compared with single-modality and low-level fusion models (Figure S8b, Supplemental Material). The model correctly identified 12/13 (92.3%) HC, 10/10 (100%) L, 23/25 (92%) OSMF, and 12/14 (85.7%) OSCC subjects (Figure 3e).
Mid-Level Fusion of Serum and Saliva: Three-Model System
A similar clustering trend was observed in the QDA scatter plot for the three-group analysis, with improved separation between OSMF and OSCC compared with earlier models (Figure S8c, Supplemental Material). The QDA model achieved correct classification of 10/10 (100%) L, 25/25 (100%) OSMF, and 12/14 (85.7%) OSCC subjects (Figure 3f).
MCR-ALS
In serum, Component 1 exhibited bands at 1005, 1030, 1450, and 1667 cm−1, corresponding to proteins (Figure 4a). No significant differences observed across groups, as seen in the relative abundance plot (Figure 4b-i). In Component 2, prominent protein-related bands attributable to Tyr at 830, 850, 1620; Phe bands at 1007, 1035; 1456, and 1672 cm−1 indicate random coil structure (Figure 4a). This component was found to have significantly lower relative abundance in OSCC than OSMF (p = 0.045), HC (0.001), and NHC (p = 0.008) (Figure 4b-ii). Component 3 had prominent lipid features at 1082, 1303, 1448, and 1746cm–1, as well as some protein-related features at 1005 and 1655 cm−1 (Figure 4a). Relative abundance of this component was significantly higher in OSCC than all other groups (NHC, HC, L, and OSMF; p = 0.018, 0.004, 0.013, and 0.006, respectively; Figure 4b-iii). Component 4 had protein related bands at band 1244, 1400, 1456, 1674 cm–1, indicative of immunoglobulins (Figure 4a). This component was significantly lower in NHC than all the other groups (OSCC, HC, L, and OSMF; p = 0.018, 0.006, 0.000, and 0.001, respectively, Figure 4b-iv). Component 5 displayed bands at 937, 1002, 1316, 1209, 1453, 1656 cm–1, indicating α-helical structures (Figure 4a). This component was significantly higher in NHC than all other groups (Figure 4b-v).
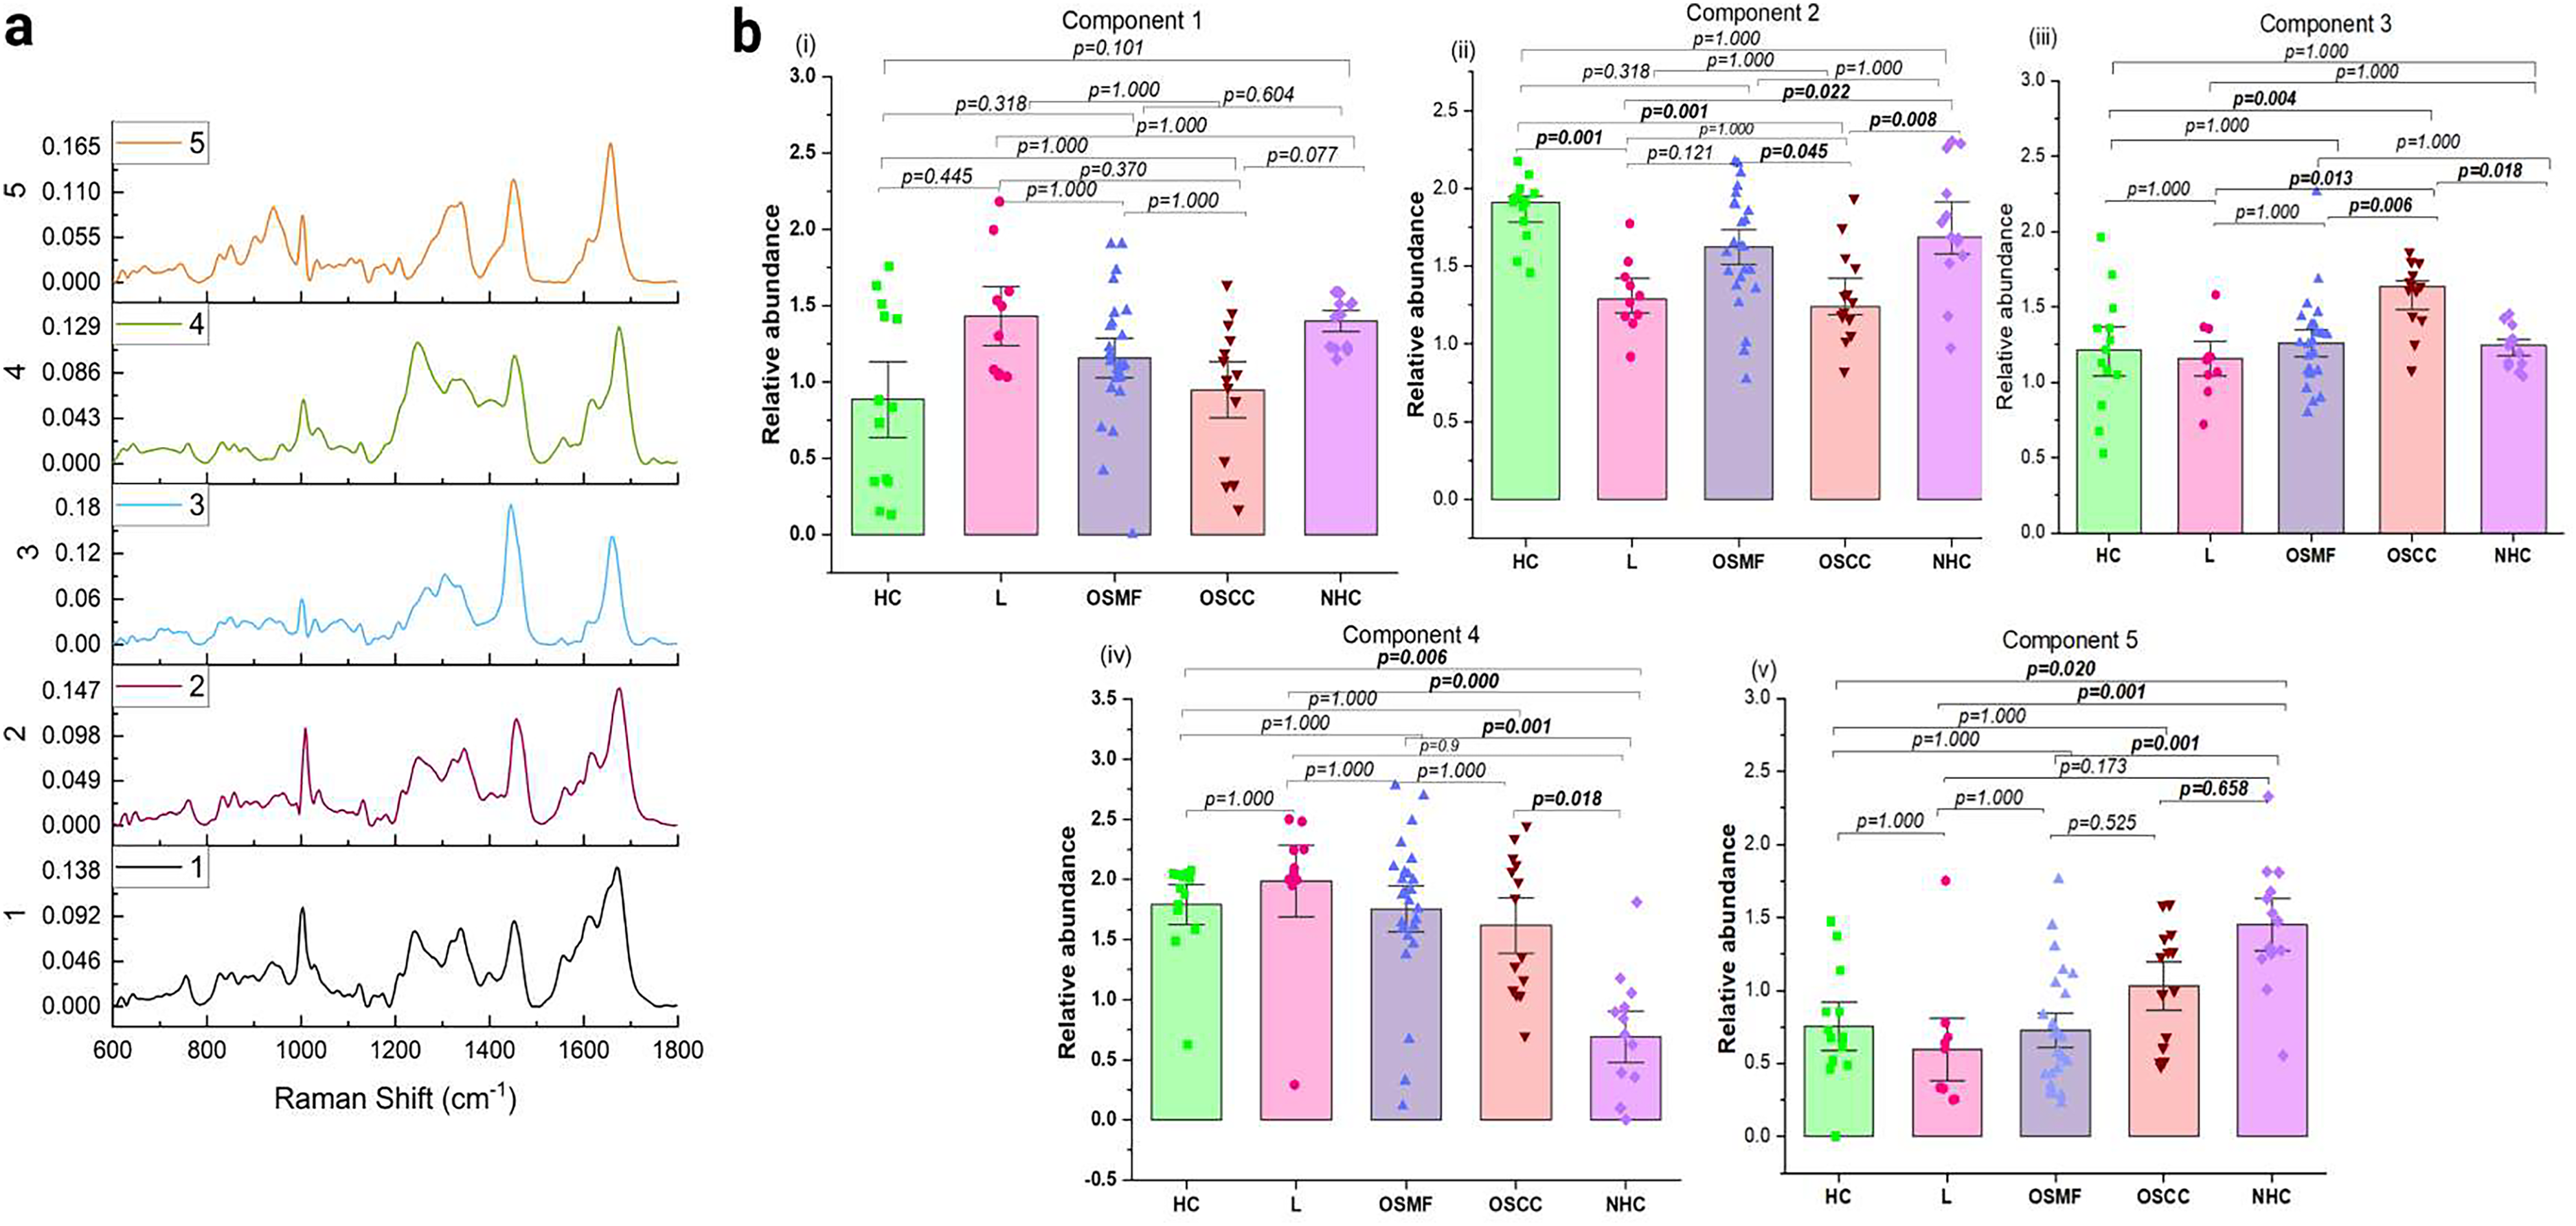
Exploratory MCR-ALS of serum. (a) MCR extracted spectral components. (b) Relative abundance plots (i) Component 1, (ii) Component 2, (iii) Component 3, (iv) Component 4, and (v) Component 5. Error bars represent standard error. P values were determined by Anova or Kruskal–Wallis tests.
The MCR-ALS analysis of saliva revealed five components, of which Component 1, with prominent bands at 879 (Hyp), 927 (Pro), 1003, 1252, 1451, 1676 cm–1, attributable to proteins (Figure 5a), showed significant difference in the abundance between L and OSMF (p = 0.007), and NHC and OSCC (0.037; Figure 5b-i). The other components and did not result in significant differences in abundance across the groups (Figure 5). All statistical comparisons were evaluated at a 95% confidence interval.
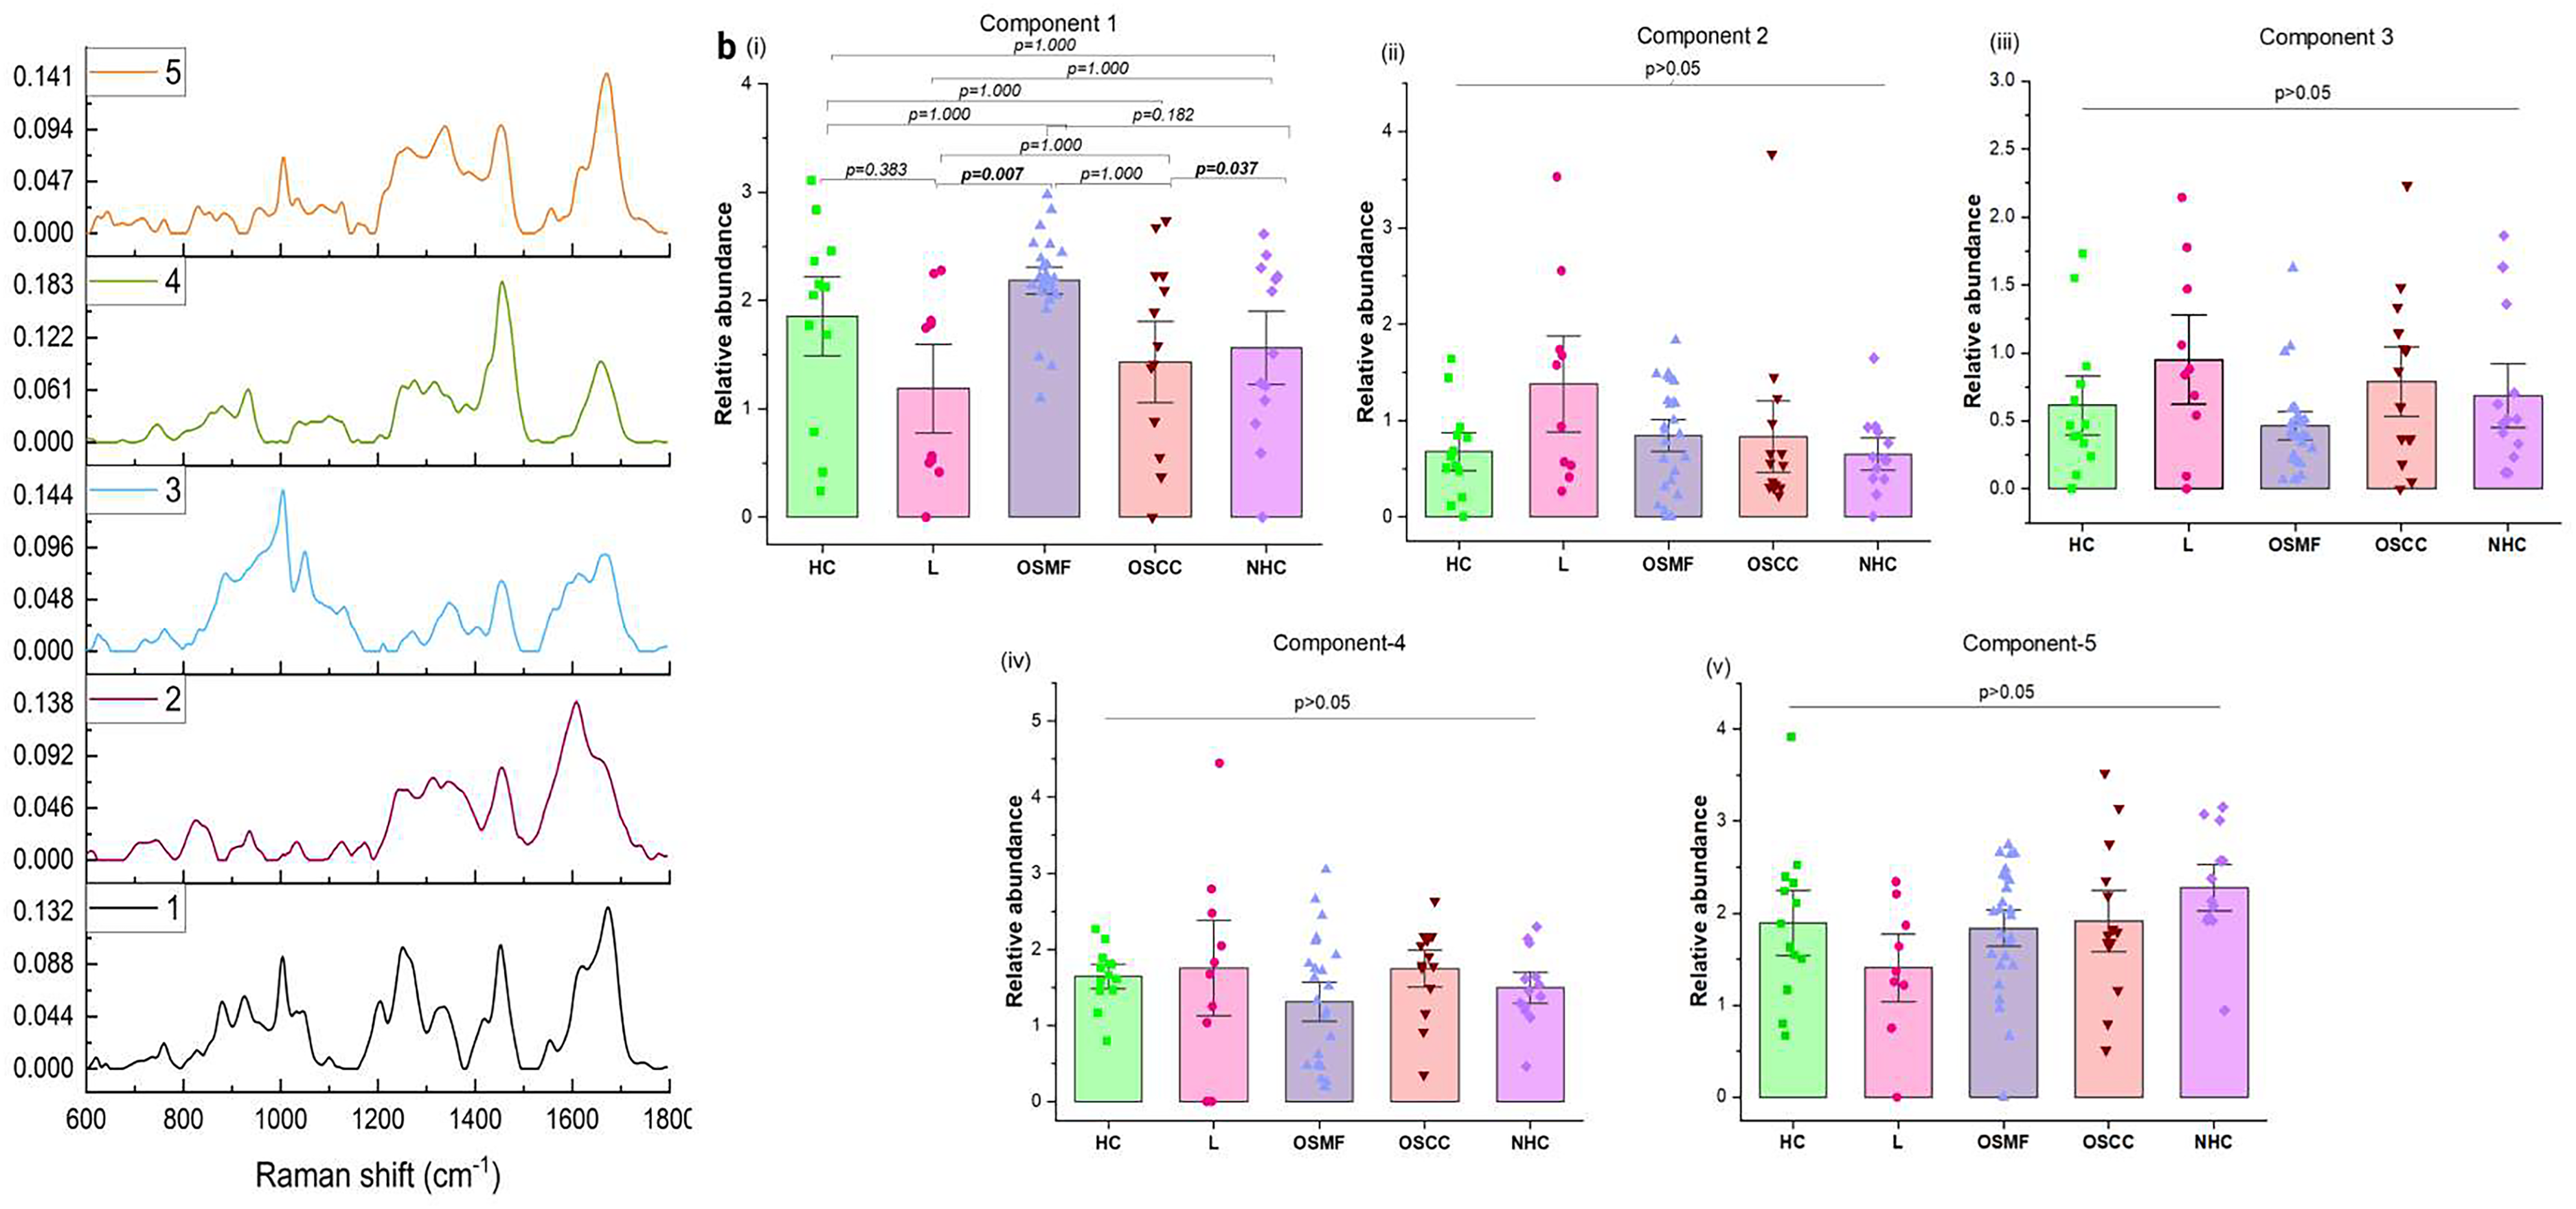
Exploratory MCR-ALS of saliva. (a) MCR extracted spectral components. (b) Relative abundance plots: (i) Component 1, (ii) Component 2, (iii) Component 3, (iv) Component 4, and (v) Component 5. Error bars represent standard error. P values were determined by Anova or Kruskal–Wallis tests.
Results and Discussion
Oral cancers have emerged as a major healthcare challenge in India. 1 Early detection is imperative for reducing mortality rates and development of minimally invasive methods for the same is being actively explored. To this end, serum and salivary RS have been examined for the identification of leukoplakia, OSMF, oral cancer, HC, and NHC groups in the present study.
In the serum spectra of all the study groups, prominent protein and lipid-associated bands were observed. The saliva spectra displayed protein-specific bands. These findings are consistent with our previous studies and provide insights into the biochemical composition of the groups.11,20,38 Blood and saliva samples were collected from the same cohort, enabling a comparative analysis of these biofluids and the exploration of data fusion to improve classification accuracy. When analyzed individually, serum outperformed saliva in QDA models. Major misclassifications were noted among the saliva of HC, L, OSMF, and OSCC groups. The subjects of these groups were long-term tobacco users. It is known that prolonged tobacco abuse causes field cancerization in the upper-aerodigestive tract. Alterations at the molecular level that did not progress to the formation of clinically detectable patches/lesions, especially in the HC group, could be attributed to the observed misclassifications. Additionally, the presence of tobacco metabolites in both serum and saliva can be another source of confounding factors.
In this study, data fusion was explored at two levels. Low-level fusion PC-QDA models outperformed saliva-based PC-QDA in classifying OSMF, OSCC, and NHC groups but showed diminished accuracy for L. Low-level fusion models are susceptible to significant performance degradation when one data source or modality underperforms, in this case, saliva. This is because low-level fusion lacks mechanisms to account for errors or poor quality from individual inputs, leading to amplified inaccuracies in the fused output. 39 Mid-level fusion strategies, integrating the principal components of serum and saliva, were explored to mitigate this issue and improve the overall performance; mid-level fusion models surpassed both serum and saliva and achieved highly accurate results. Mid-level fusion three-model QDA successfully stratified the two OPMDs with 100% accuracy. A small number of misclassifications were observed in the OSCC group, with the two OPMDs, which might be attributed to the frequent presence of multiple potentially malignant patches in the oral cavity of OSCC patients. This underscores the remarkable efficacy of integrating data from multiple biofluids to enhance early detection oral cancers and potentially cancerous conditions.
Exploratory MCR-ALS analyses of serum and saliva samples were carried out to gain deeper insights into the biomolecular differences between groups and to identify spectral features contributing to discrimination by QDA. Five MCR components were obtained from the serum, of which four showed statistically significant differences among the different groups. Component 2 indicates proteins with random coils. Lower levels of Component 2 in OSCC than in OSMF, NHC, and HC. Component 3 was predominantly composed of lipid features. It was found to be significantly higher in OSCC than in all the other groups. Several studies have reported increased levels of certain lipids such as high-density lipid cholesterol, low-density lipid-cholesterols, serum VLDL and triglycerides in OPMDs and OSCC.40–42 Features attributable to immunoglobulins were observed in Component 4. Previous studies have reported increased levels of IgG, IgM, and IgA in the sera of oral cancer patients. 43 This component was significantly reduced in NHC than all other groups. Component 5 revealed features indicative of α-helical structures present in abundant proteins, such as human serum albumin. This component was significantly higher in the NHC group than that in the other groups. Decrease in albumin levels in the serum of oral premalignant and oral cancer patients have been reported. 44 MCR analysis of saliva identified a single significant protein-related component. This aligns with the observation that classification models based on saliva yielded poor accuracies, whereas those based on serum achieved comparatively higher accuracies. This highlights that although saliva offers the advantage of non-invasive collection, its standalone diagnostic efficacy remains limited.
The findings of this study reveal that while serum exhibits superior diagnostic potential compared to saliva in individual RS-based classification, the incorporation of data fusion strategies substantially enhances the accuracy of detection of different conditions. Despite the limitations posed by misclassifications in individual biofluid-based models, mid-level fusion models present a promising approach with high rates of classification. This emphasizes the need for further exploration of multi-biofluid approaches to refine minimally invasive detection methods for oral cancer screening.
Conclusion
This study demonstrates the potential of biofluid-based RS as a screening tool for early detection of oral cancers and related conditions. Serum outperformed saliva, with PC-QDA models showing high accuracy despite some misclassifications between HC and disease groups. Saliva showed limited performance, with best results for OSMF. Low-level fusion slightly improved classification for OSMF, OSCC, and NHC but reduced accuracy for L. Mid-level fusion significantly enhanced performance, clearly separating leukoplakia and OSMF. Altered serum protein signatures were observed in the NHC group. The results indicate that serum is more reliable, but combining biofluid data offers greater diagnostic potential. The present findings demonstrate promising trends and support the potential utility of the proposed approach. Validation in larger and independent cohorts will further establish its robustness and clinical applicability.
Supplemental Material
sj-docx-1-asp-10.1177_00037028261445469 - Supplemental material for Raman Spectroscopy of Biofluids: Fusion Strategies for Detecting Oral Potentially Malignant Disorders and Oral Cancers
Supplemental material, sj-docx-1-asp-10.1177_00037028261445469 for Raman Spectroscopy of Biofluids: Fusion Strategies for Detecting Oral Potentially Malignant Disorders and Oral Cancers by Panchali Saha, Pooja Malu, Poonam Joshi, Arti Hole, Pankaj Chaturvedi, Sonal Vahanwala and C. Murali Krishna in Applied Spectroscopy
Footnotes
Acknowledgments
The authors would like to express their sincere gratitude to the subjects who participated in the study and donated their blood and saliva samples. The Raman instrument used in this study was procured through (BT/IN/Indo-Finnish/04/MKC/2014), Department of Biotechnology, Government of India.
Data Availability
Data of human subjects is confidential.
Declaration of Conflicting Interests
The author(s) declared no potential conflicts of interest with respect to research, authorship, and/or publication of this article.
Ethical Considerations
Institutional Ethical Clearance were obtained from Nair Hospital Dental College, Mumbai and Tata Memorial Centre, Advanced Centre for Treatment, Education and Research in Cancer, Kharghar Navi Mumbai, Maharashtra, India (EC-204/OMR/ND43/2023 and 900960). Written informed consent was obtained from all subjects
Funding
The author(s) received no financial support for the research, authorship, and/or publication of this article.

Supplemental Material
All supplemental material mentioned in the text accompanies this work online.
References
Supplementary Material
Please find the following supplemental material available below.
For Open Access articles published under a Creative Commons License, all supplemental material carries the same license as the article it is associated with.
For non-Open Access articles published, all supplemental material carries a non-exclusive license, and permission requests for re-use of supplemental material or any part of supplemental material shall be sent directly to the copyright owner as specified in the copyright notice associated with the article.
