






Abstract
The present study investigated the carotenoid content in colored bracts, nectar gland, flowers, and pollen of Euphorbia pulcherrima (poinsettia) using Raman spectroscopy. Raman spectra obtained from in situ and crude extracts of the structural components were attributed to carotenoids, phenolic acids, flavonoids, and anthocyanins. Significant changes in the spectral profile were observed according to the bract´s color variation. In the green leaves, bands assigned to carotenoids presented a higher intensity when compared to the main bands ascribed to phenolic acids/polyphenols. Intensity ratios involving ν(C=C) mode at 1527 cm–1, from carotenoids and ν(C=C)ar at 1600 cm–1, from polyphenols decreases in the following order: green leaves (Icar/Ipol = 1.89), yellow (Icar/Ipol = 0.72), red (Icar/Ipol = 0.4), and pink bracts (Icar/Ipol = 0.3). No carotenoid band was detected in white bracts. Raman mapping performed with bracts in transition of the coloration from green to red revealed that both carotenoids and phenolic compounds occur throughout the adaxial surface, but with different color gradients according to the development of the bract. The analysis of the inflorescences showed that carotenoids were the main pigments responsible for the coloration of the yellow nectar gland and pollen grains, while bracts and flowers (pedicel and style) had a predominance of polyphenols. We also used Raman spectroscopy to characterize the efficiency of crude extracts of green leaves and red bract as a reducing agent in the synthesis of silver nanoparticles (AgNPs). The red bract acetone crude extract yielded the most intense localized surface plasmon resonance (LSPR) signals. This work demonstrates the dual utility of E. pulcherrima bracts: as a source of diverse phytochemicals and as a sustainable route to biologically active nanostructured materials.
This is a visual representation of the abstract.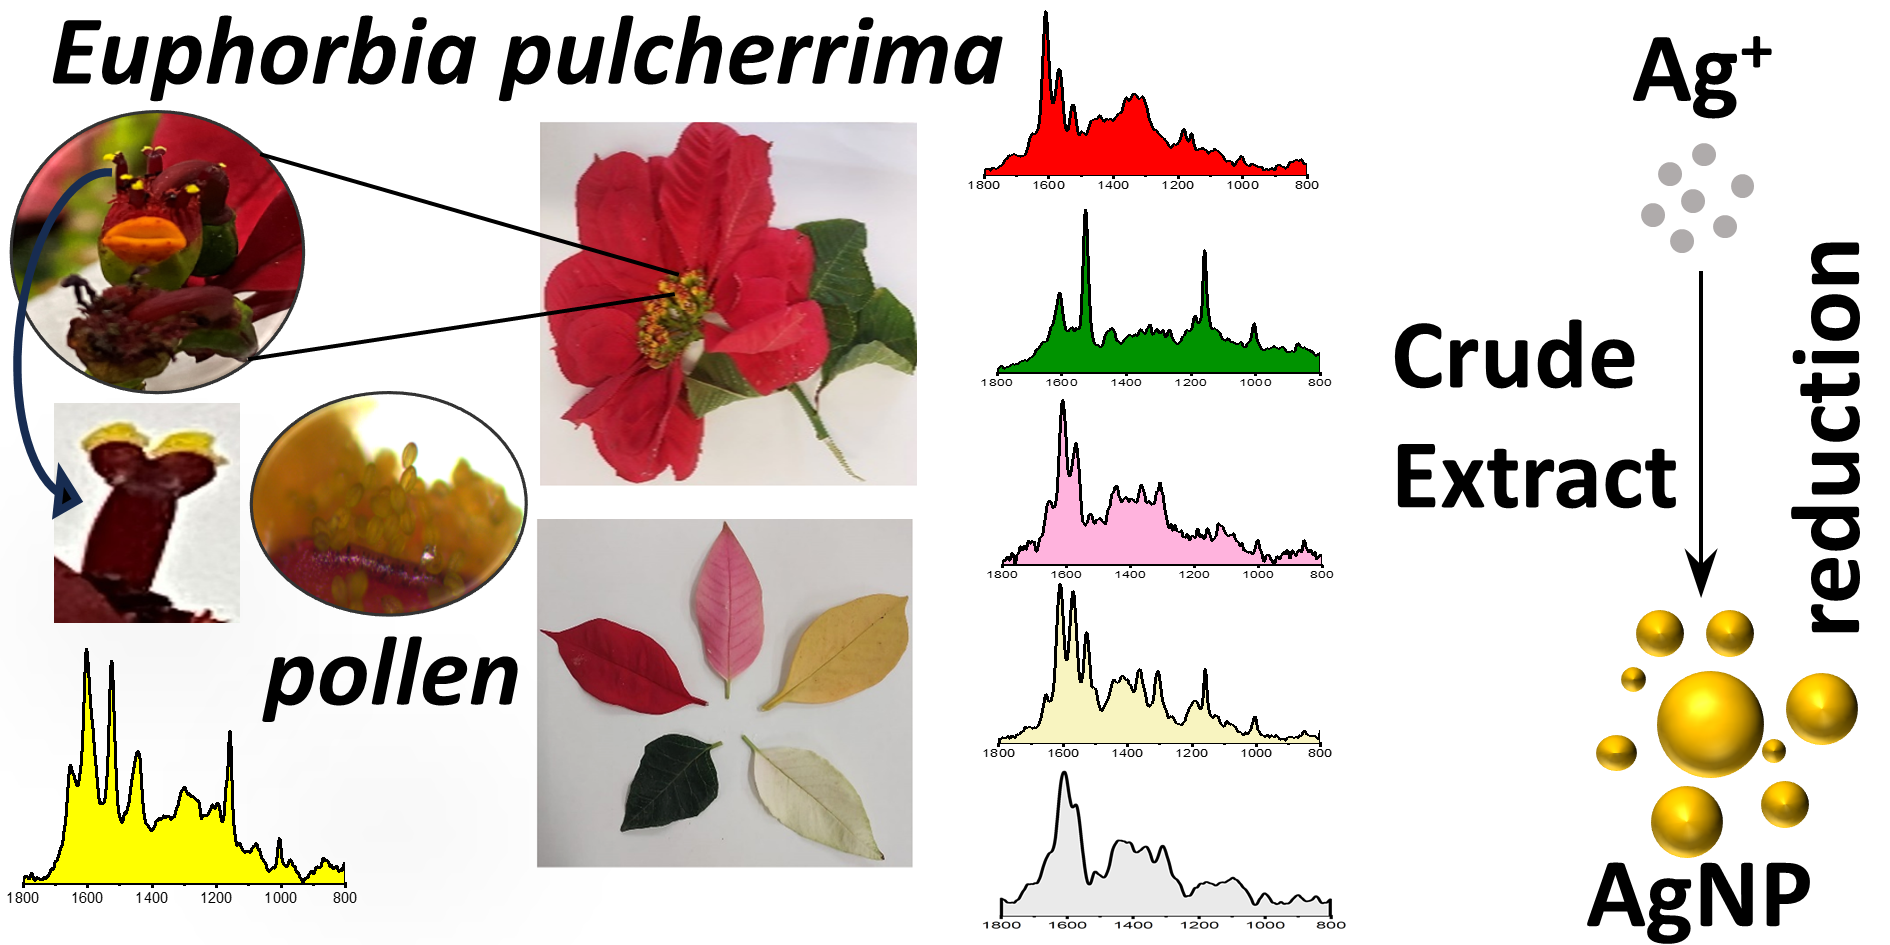
Introduction
The poinsettia (Euphorbia pulcherrima Willd. ex Klotzsch) is an ornamental plant of cultural and economic importance, a symbol of Christmas due to its resemblance to the Star of Bethlehem. 1 The majority of cultivars show intense red coloration in the bract, a leaf-like structure that forms below the true flowers. 1 Light captured by the photoreceptors in E. pulcherrima induces the flowering process 2 and the pigment concentration in transitional bracts, which varies according to the color developing stage 3 . The transition from green to red, for instance, results from the degradation and/or synthesis of chlorophyll, carotenoids,3,4 and polyphenols (flavonoids and anthocyanins)5,6 (Figure 1). Chlorophyll and carotenoid concentrations significantly decrease over time, while the concentration of anthocyanins increases. 3
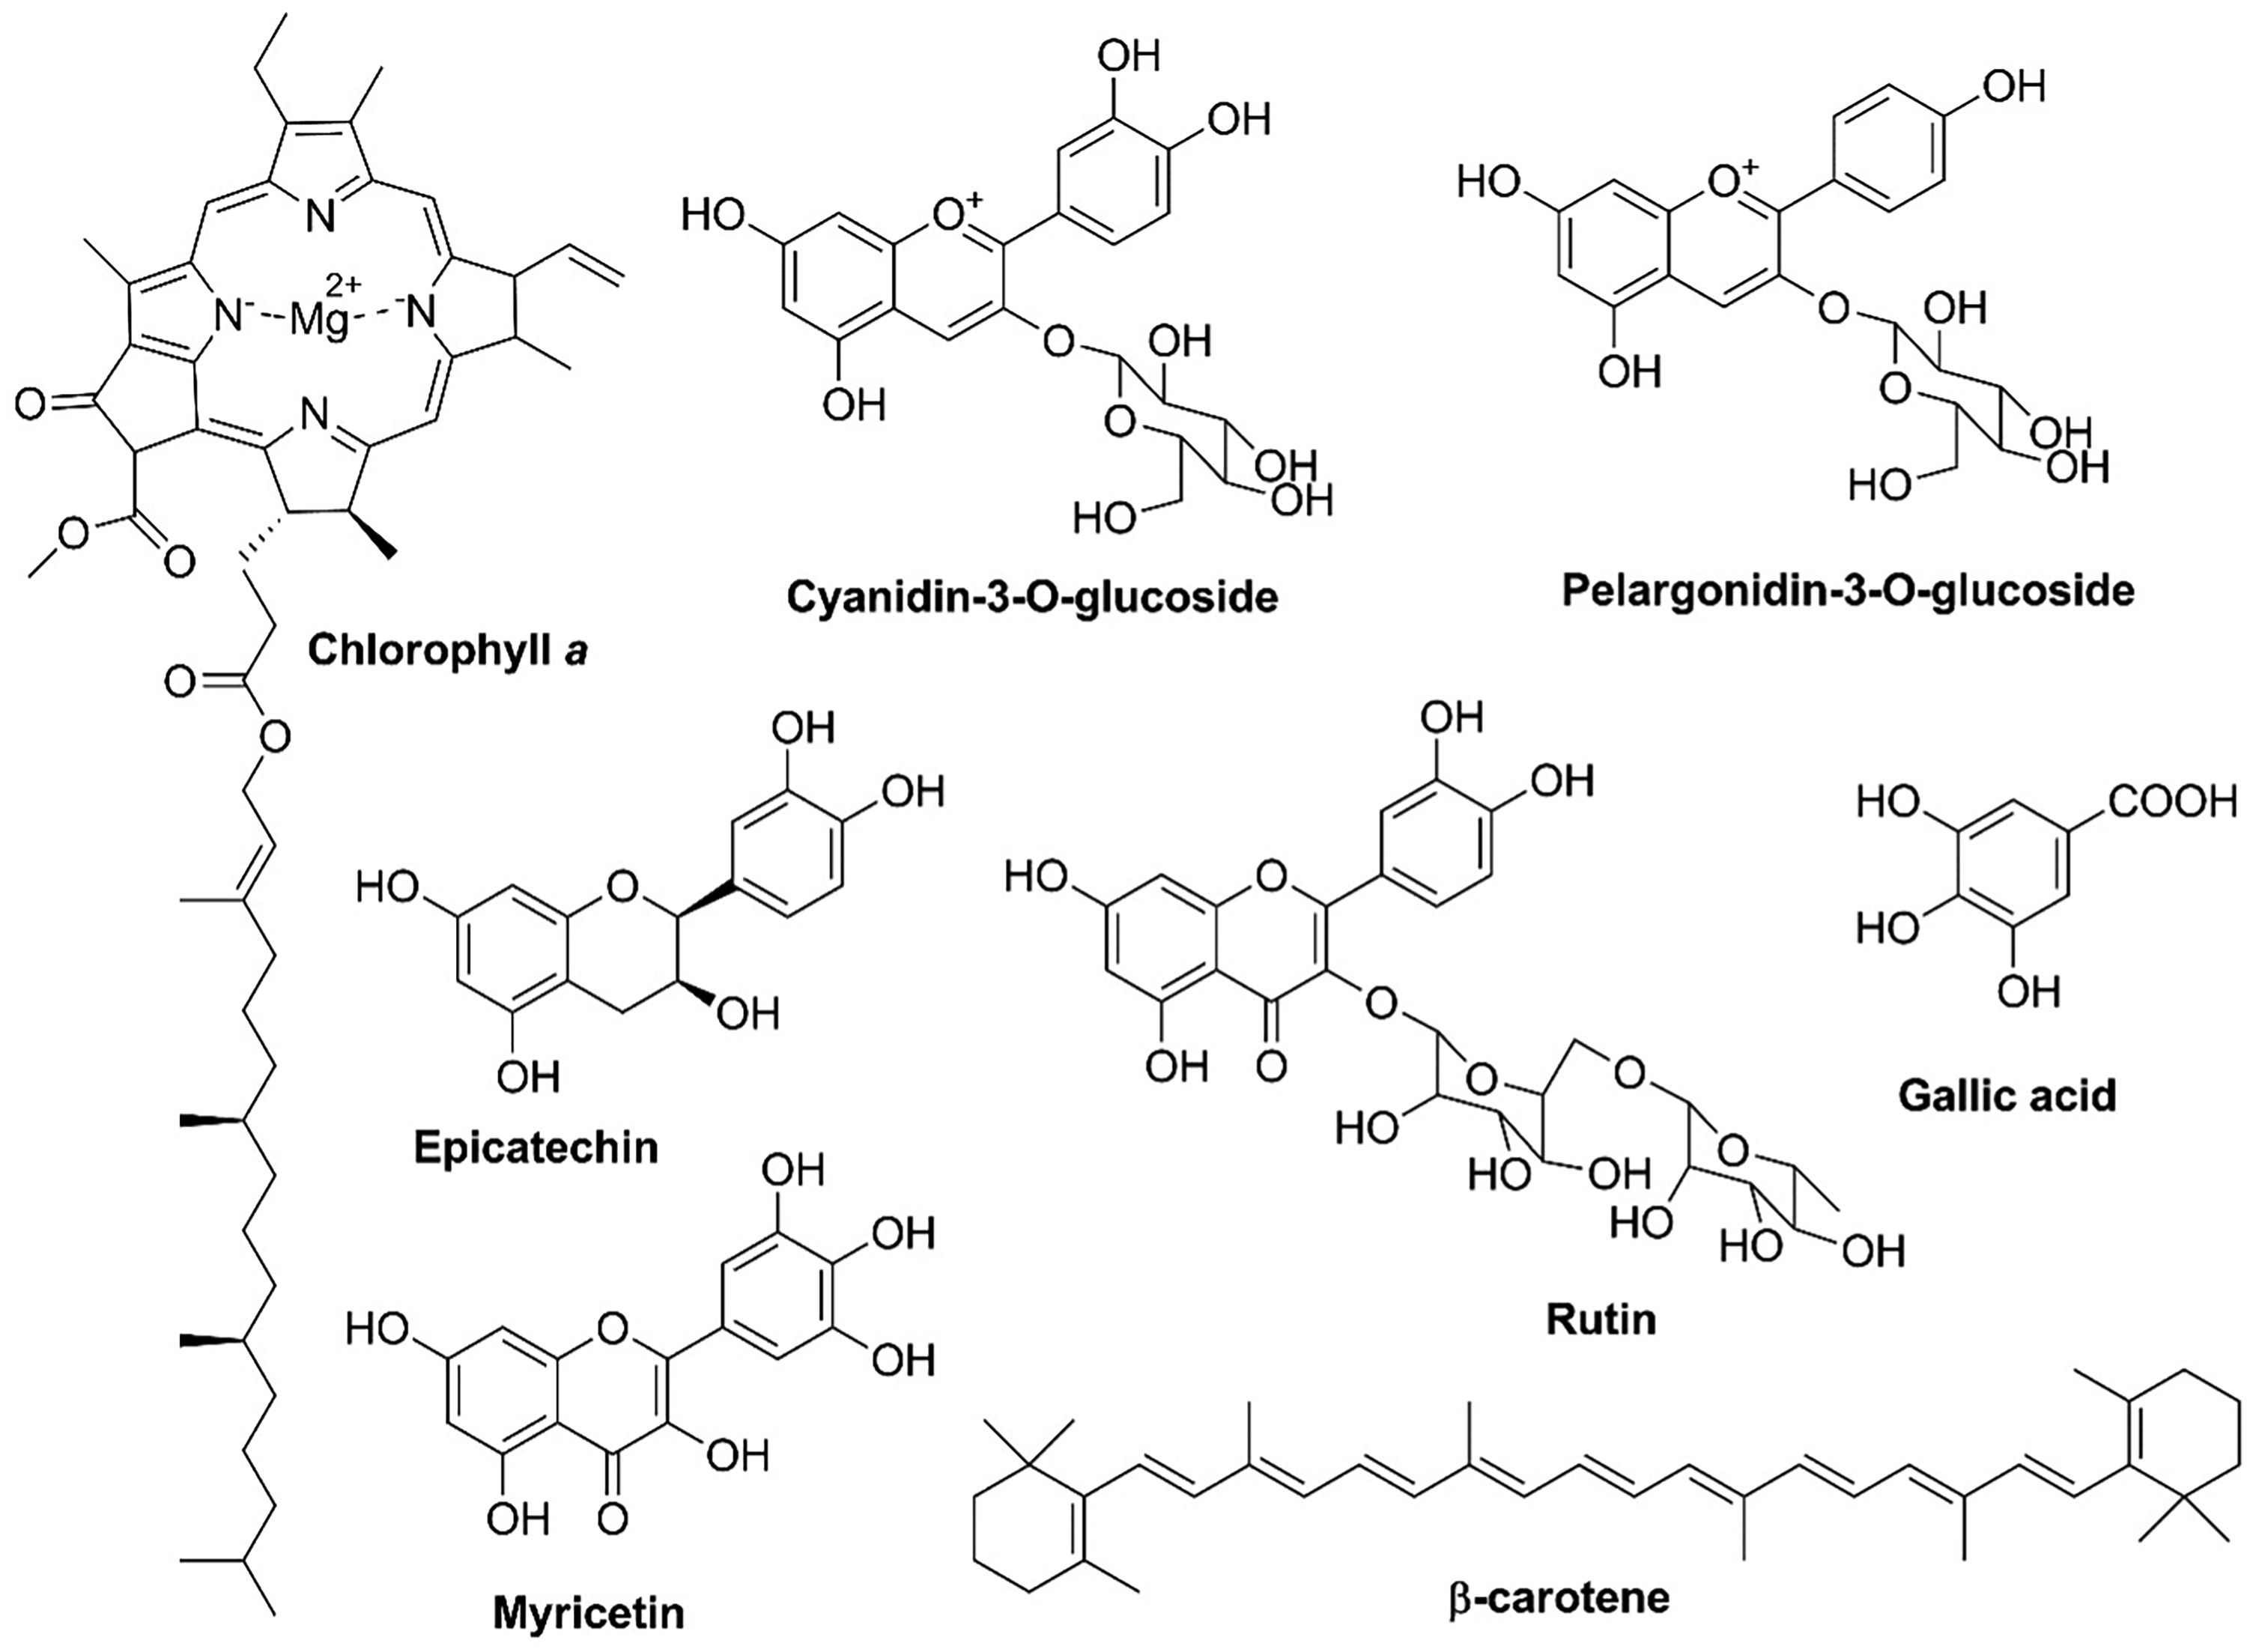
Selected chemical compounds described for Euphorbia pulcherrima.
The traditional red varieties are very popular, but there is a growing consumer demand for novelty colors. Through the use of mutation breeding, a wide range of new color variations, including pink, yellow, white, and even bicolored, scattered, or marbled types, have been successfully generated.7,8 Although bracts are the most attractive part of the poinsettia, no less important is the coloration of the “hybrid” flower/inflorescence termed a cyathium, 9 composed of nectar gland and male/female flowers. The main functions of these structures are to attract pollinators and to reproduce, respectively; however, there is no report concerning the pigment composition of these structures in E. pulcherrima.
The major pigments responsible for the bracts coloration are anthocyanins derived from two main types: cyanidin, with dark red/pink derivatives, and pelargonidin, with colors from orange to red. 8 Regardless of the variety and the range of red colours exhibited by the bracts, cyanidin predominates; 8 however, bracts also contain flavanones, flavones, flavanols, and phenolic acids (Figure 1).10–11 According to Gu et al., these common flavonoids had higher contents and structural diversity in the green bracts than in the red-turning ones. 11 On the other hand, the carotenoids, a light-harvesting pigment for photosynthesis in poinsettia3,4 play a key role in color modulation in the bracts of some ornamental plants, 12 however, research on the identification of these molecules in E. pulcherrima is limited.
As can be seen in Figure 1, the molecules biosynthesized in poinsettia bracts contain highly polarizable π electrons due to the extended double bond conjugated systems. This is an ideal feature for their detection and characterization by Raman spectroscopy, a light-scattering, non-destructive technique that provides information about molecular vibrations.13–15 Polyphenols, such as flavonoids and anthocyanins, are commonly identified by bands assigned to ν(C=C) stretching in the range of 1630–1530 cm–1, ν(C–O) stretching between 1370 and 1340 cm–1, δ(C–OH) bending in 1360–1300 cm–1, and bands in the region of 1270–1250 cm–1 ascribed to the vibrational mode δ(O–H) + ν(C–O).15–19 On the other hand, carotenoid bands are generally identified from the strong bands observed between 1570 and 1500 cm–1 and between 1170–1150 cm–1, ascribed in the literature to the normal modes of stretching ν(C=C) and ν(C–C), respectively.15,20 Each class of compounds exhibits a characteristic vibrational spectrum, which has been used as a chemical marker within a complex mixture.21–24
E. pulcherrima presents diverse medicinal uses ranging from less severe health issues such as fever, toothaches, and wound healing to more significant conditions like gonorrhea, eczema, asthma, malaria, etc.25–28 A wide range of bioactivity has been reported for diverse Euphorbia species,29,30 including the use as a biological agent in redesigning the synthesis of metallic nanoparticles (NP).31–38 Such nanomaterials have numerous applications in medical devices, healthcare, diagnostics, drug delivery, cosmetics, electronics, household appliances, catalysis, wastewater treatment, biosensing, agriculture, etc.39,40 The rich content of polyphenols in leaves, stems, and bracts of Euphorbia spp. can act as both reducing and stabilizing agents in the green synthesis of NP.31,32
Besides the biological activities and the strong commercial value, poinsettia is also an important model plant in studies on anthocyanin metabolism regulated by photoperiod, 11 and in mutagenesis-based plant breeding. 41 Raman spectroscopy, especially Raman mapping, can provide chemical information of the plant tissue by monitoring and tracing marker molecules produced as a result of different gene introductions42,43 and differentiation of mutant lines, as already demonstrated for wheat 44 and soybean. 45 The discrimination of multi-components in flower petals, 21 leaves, 46 plant cuticle, 47 and the color transition during ripening has also been well documented,22,23,48–50 but the in situ identification of pigments during bract development has been first revealed in this work.
The evaluation of carotenoid and phenolic content in different bract colors was investigated directly on the plant’s tissues and in the crude extracts prepared according to recovery efficiency of each class of compounds. In situ Raman spectroscopy performed at different parts of E. pulcherrima proved to be a versatile tool for characterizing the diverse pigments responsible for the plant's distinct functions. The chemical distribution of both pigments in the developing bract was revealed by in situ 2D-macro-sampling using FT-Raman spectroscopy. Extraction of green leaves and red bracts using acetone and hydroalcoholic mixtures indicated the most effective solvents for yielding the polyphenols required for the green synthesis of silver nanoparticles (AgNPs).
In this way, it was presented a comprehensive chemical analysis of this plant, reporting on the flowers, pollen, and nectar gland, showing the variability of pigments across white, yellow, pink, and red bracts, and the chemical basis for color development in the red bracts.
Experimental
Materials and Methods
Silver nitrate >99% (Sigma-Aldrich, AgNO3), acetone 99.5% (Synth, C3H6O), ethanol 96% (Vetec, C2H5OH), methanol 99.8% (Vetec, CH3OH), acetic acid 99.7% (Synth, C2H4O2). All aqueous solutions were prepared using deionized water (Mili-Q SQ 2Series, Merck Millipore, Merck KGaA, Germany). All reagents were used without prior purification.
Plant Material
The specimens of Euphorbia pulcherrima Willd. ex Klotzsch (Figure 2), were collected between June and December 2023 in the city of Juiz de Fora, Minas Gerais, Brazil. The experiments were performed with leaves, bracts, nectar gland, pollen, male, and female flowers.9,51
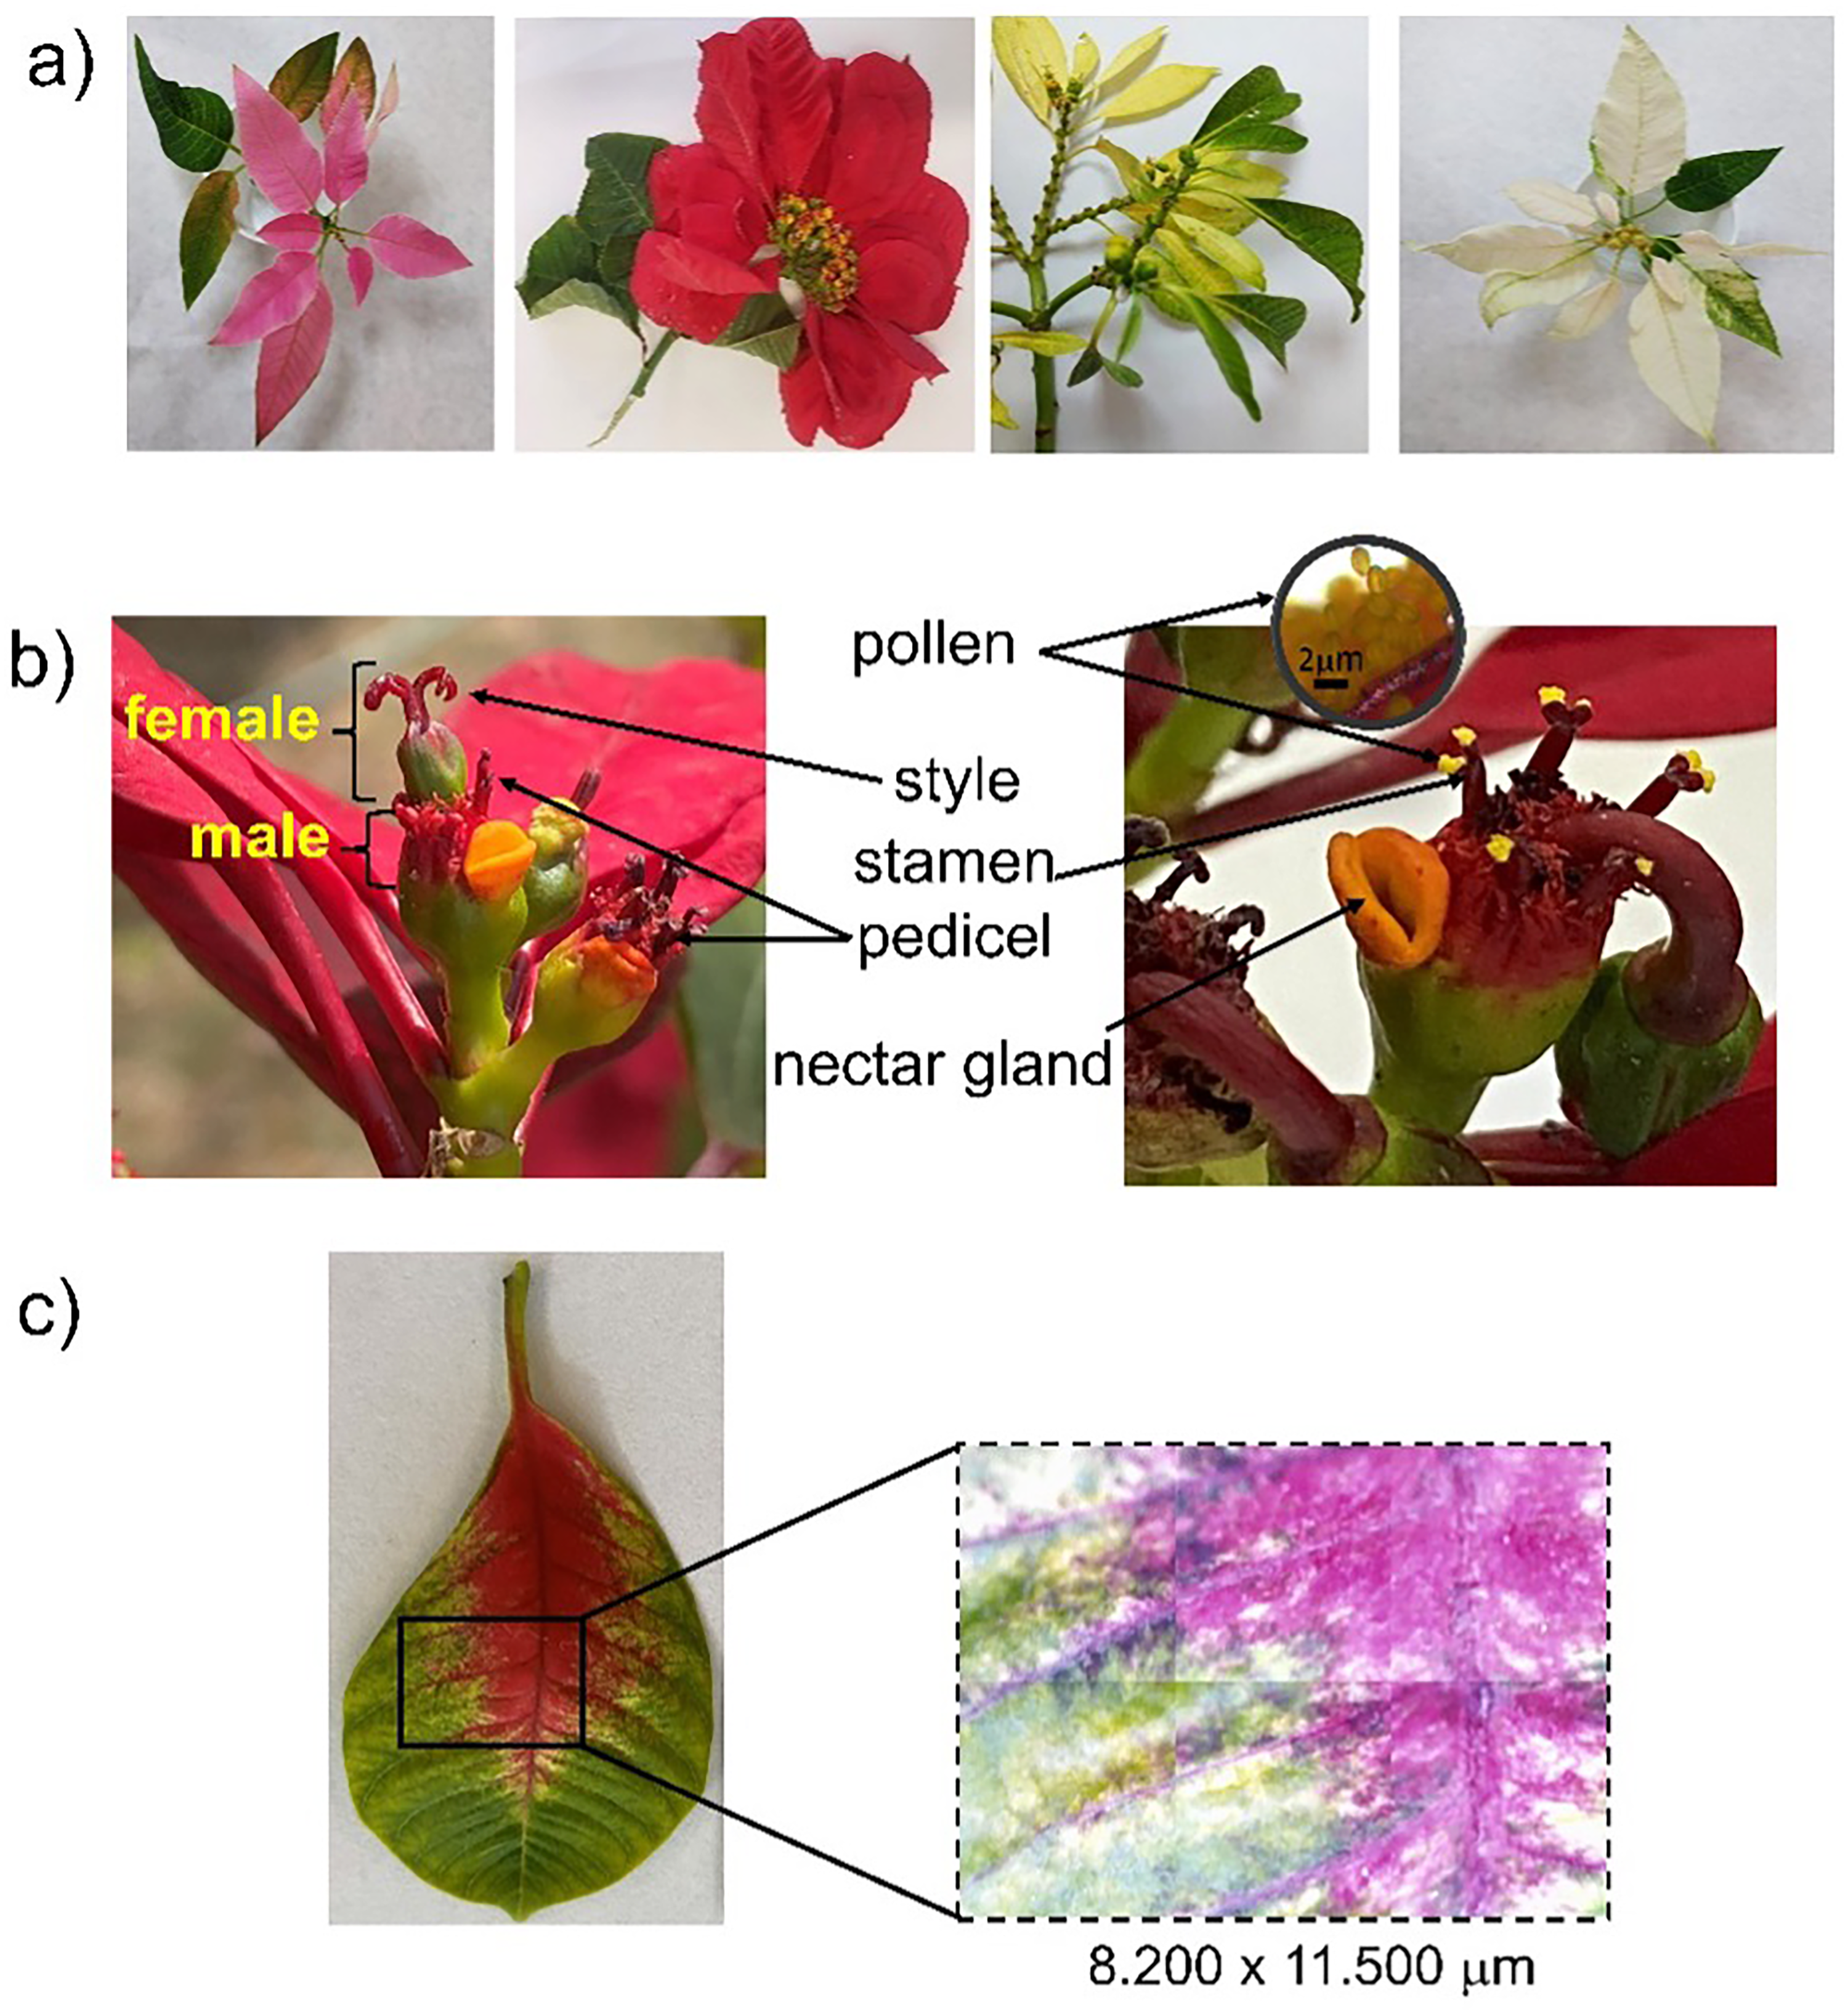
Diverse Euphorbia pulcherrima bracts and flowers. (a) Pink, red, yellow, and white poinsettias. (b) Flowers, pollen, and nectar gland of red poinsettia. (c) Developing stage of red bract.
Extraction Methods
The green leaves, red, and yellow bracts of E. pulcherrima (Figure 2) were subjected to extraction with two different extracting media. To optimize the extraction of carotenoids, acetone (Ac) was used as the extracting agent, 52 while for the extraction of phenolic compounds, an alcoholic mixture of ethanol:methanol:water at 1:1:1 (Alc) volume ratio with the addition of 1.0 mL of acetic acid.53,54 Briefly, 5 g of bracts were moistened with 50.0 mL (3x) of the extracting solvent at room temperature and then ground using a mixer instrument for approximately 10 minutes. Each crude extract labeled as Ac-G, Alc-G for green leaves, Ac-R, Alc-R for red bracts and, Ac-Y, Alc-Y for yellow was filtered, and the solvents were removed through filtration under reduced pressure. 55 The masses of the leaves and bracts, as well as their resulting dry extracts, were: Ac-G: 3.2 g/0.32 g, Alc-G: 2.6 g/0.29 g; Ac-R: 5.44 g/0.23 g, Alc-R: 5.39 g/0.36 g; Ac-Y: 4.82 g/0.14 g; Alc-Y: 5.02 g/0.27 g. White and pink bracts were not extracted due to the limited sample availability.
Green Synthesis of the Silver Nanoparticles (AgNP) with E. pulcherrima Crude Extracts
For the green synthesis of AgNP, dried extracts of green (Ac-G and Alc-G) and red (Ac-R and Alc-R) E. pulcherrima bracts were used. Solutions of the E. pulcherrima extracts were prepared by dissolving 10.0 mg of the dried extracts in 10.0 mL of 70% v/v ethanol, followed by sonication for 10 minutes. In the synthesis step, 10.0 μL of the E. pulcherrima solution was mixed with 990.0 μL of 3.0 × 10⁻³ mol L–1 AgNO3 aqueous solution at room temperature and atmospheric pressure. The mixtures were then subjected to sonication for 10 minutes. The solutions, initially green or red depending on the extract used, rapidly changed to a yellowish color, characteristic of AgNP formation.
Instrumentation and Spectroscopic Analyses
Spectra were recorded using a Bruker MultiRAM spectrometer (Bruker Optik GbmH, Germany), neodymium-doped yttrium aluminum garnet (Nd:YAG) laser operating at 1064 nm, using a germanium detector cooled with liquid nitrogen, equipped with mirror objective and video camera (R348-VAR) and a motorized x,y,z stage (R313). Macro-mode Raman spectroscopy was performed on three green leaves, two inflorescences, ten bracts (three red, two pink, three yellow, two white) as well as from dry crude extracts of green, red, and yellow bracts. The spectra were acquired at least in duplicate in each leaf, bract, and crude extracts. The experimental conditions were spectral window from 4000 to 50 cm−1, spectral resolution of 4.0 cm−1, laser power ranging from 70 to 150 mW, and 512 or 1024 cumulative scans. The 2D macro-mapping sampling: spectral window from 4000 to 50 cm–1, spectral resolution of 4.0 cm−1, 150 mW and 256 scans. Resonance Raman spectra from colored bracts were also analyzed using an excitation wavelength of 532 nm with a Bruker Senterra dispersive Raman spectrometer (Bruker Optik GbmH, Germany) equipped with a charge-coupled device (CCD) detector and coupled to an Olympus BX51 microscope (Olympus, Japan) and operating with a long working distance 50× magnification objective. Data were collected in the wavenumber range of 1700 to 300 cm−1, with a spectral resolution of 3.0–5.0 cm−1, 50×, 50 mW, and integration times of 5 s. Raman mapping of pollen grain was obtained with 785 nm exciting radiation (Bruker SENTERRA) as follows: spectral window from 1770 to 400 cm−1, 50 mW, 50×, 10 accumulations, 10 s. Dry and aqueous solution crude extracts (Ac-G, Alc-G, Alc-R, Alc-R) were recorded with 632.8 nm in the spectral window from 1780 to 390 cm–1, resolution of 3.0–5.0 cm−1, 50×, 0.2, and 20 mW, 1–15 s. The intensity ratios between carotenoids and polyphenols (Icar/Ipol) were calculated after applying the baseline corrections of spectra taken from the in-situ samples and crude extracts using the 1064 nm laser line. Baseline correction was carried out using the second-derivative (zeroes) method, with zero-crossings of the second derivative (after adjacent-averaging smoothing) serving as anchor points. Data analysis and graphing were performed using OriginLab 8.0 software. 56
The absorption spectra of crude extracts as well as the extinction spectra of the NPs synthesized from the bract extracts were obtained by using an Ocean Optics spectrometer model USB2000 + XR1-ES (Ocean Optics, USA), operating with an Ocean Optics DH-2000-BAL radiation source in the ultraviolet–visible–near infrared (UV–Vis-NIR) region, and quartz cuvettes with an optical pathlength of 1.0 cm. All electronic spectra were collected from 200 to 1100 nm, with a spectral resolution of 1.0 nm. UV–Vis spectra were recorded for the crude extracts using water and the corresponding solvent used for extraction: acetone (Ac-G, Ac-R, Ac-Y), and ethanol:methanol:water at a 1:1:1 ratio (Alc-G, Alc-R, Alc-Y).
The surface-enhanced Raman spectroscopy (SERS) spectra of pure AgNP, i.e., the SERS spectra of extracted molecules adsorbed on the AgNP surface after their synthesis, were obtained through direct analysis of the colloidal suspension using a dispersive Raman spectrometer operating at a wavelength of 632.8 nm.
Results and Discussion
In Situ Raman Analyses of E. pulcherrima Bracts
The brightly colored bracts of E. pulcherrima are modified leaves that surround the tiny flowers, or a cluster of cyathia, which make up the plant's inflorescence. Figure 3a shows the in situ Raman spectra of E. pulcherrima bracts with diverse coloration and distinct parts of the flower (shown in Figure 2). In the spectra obtained using an excitation line at 1064 nm (Figure 3), bands characteristic of two main classes of natural products were observed: namely, phenolic acids/polyphenols, with bands around 1630–1570 cm–1 ν(C=C), 1370–1340 cm–1 ν(C–O), 1360–1300 cm−1 δ(C–OH), and 1270–1250 cm–1 δ(O–H)/ν(C–O) (Table I);17–19 and carotenoids, with bands in the range of 1530–1520 cm–1 ν(C=C), 1158 cm–1 ν(C–C), and 1005 cm–1 ρ(C–CH3), as summarized in Table I.14,57–59 Raman spectra from the high wavenumber region showed bands around 3070 cm–1 ν(C–H)ar and 2950–2850 cm–1 ν(C–H) that can be ascribed to a broad range of molecules (Figure S1, Supplemental Material). Significant changes in the spectral profile the mid wavenumber region were observed according to color variation. In the green leaves, bands assigned to carotenoids present a higher intensity (e.g., 1527, 1157, and 1005 cm–1) when compared to the main bands ascribed to phenolic acids/polyphenols (1630–1570 cm–1) (Figure 3a). The ratio between the band intensities of the ν(C=C) mode in carotenoids (∼1527 cm–1) and ν(C=C)ar polyphenols (∼1600 cm–1) was Icar/Ipol = 1.89. Conversely, in the non-green colored bracts, the opposite is observed, with the phenolic acids/polyphenol bands being more intense (Figure 3a). The intensity of the carotenoid bands gradually decreases in the following order: green leaves (Icar/Ipol = 1.89), yellow (Icar/Ipol = 0.72), red (Icar/Ipol = 0.4), and pink bracts (Icar/Ipol = 0.3). In the white bracts, the characteristic bands of carotenoids (approximately 1530, 1159, 1005 cm–1) were not detected, despite the presence of the low-intensity bands at 1513 and 1000 cm−1, which could also be attributed to flavonoids.15,18,60 White cultivars are known to contain a few prevailing anthocyanins also detected in the bracts of the originally red E. pulcherrima species. 61 The absence of carotenoid content in the white bracts was confirmed in the spectra performed with 532 nm exciting radiation (Figure S2, Supplemental Material). The signal enhancement effect known as resonant Raman scattering,23,52 was observed in all colored bracts, except for the white one. Such a phenomenon is explained by the resonance of the electronic transitions of carotenoids, commonly observed in the region around 550 nm, with exciting radiation used.
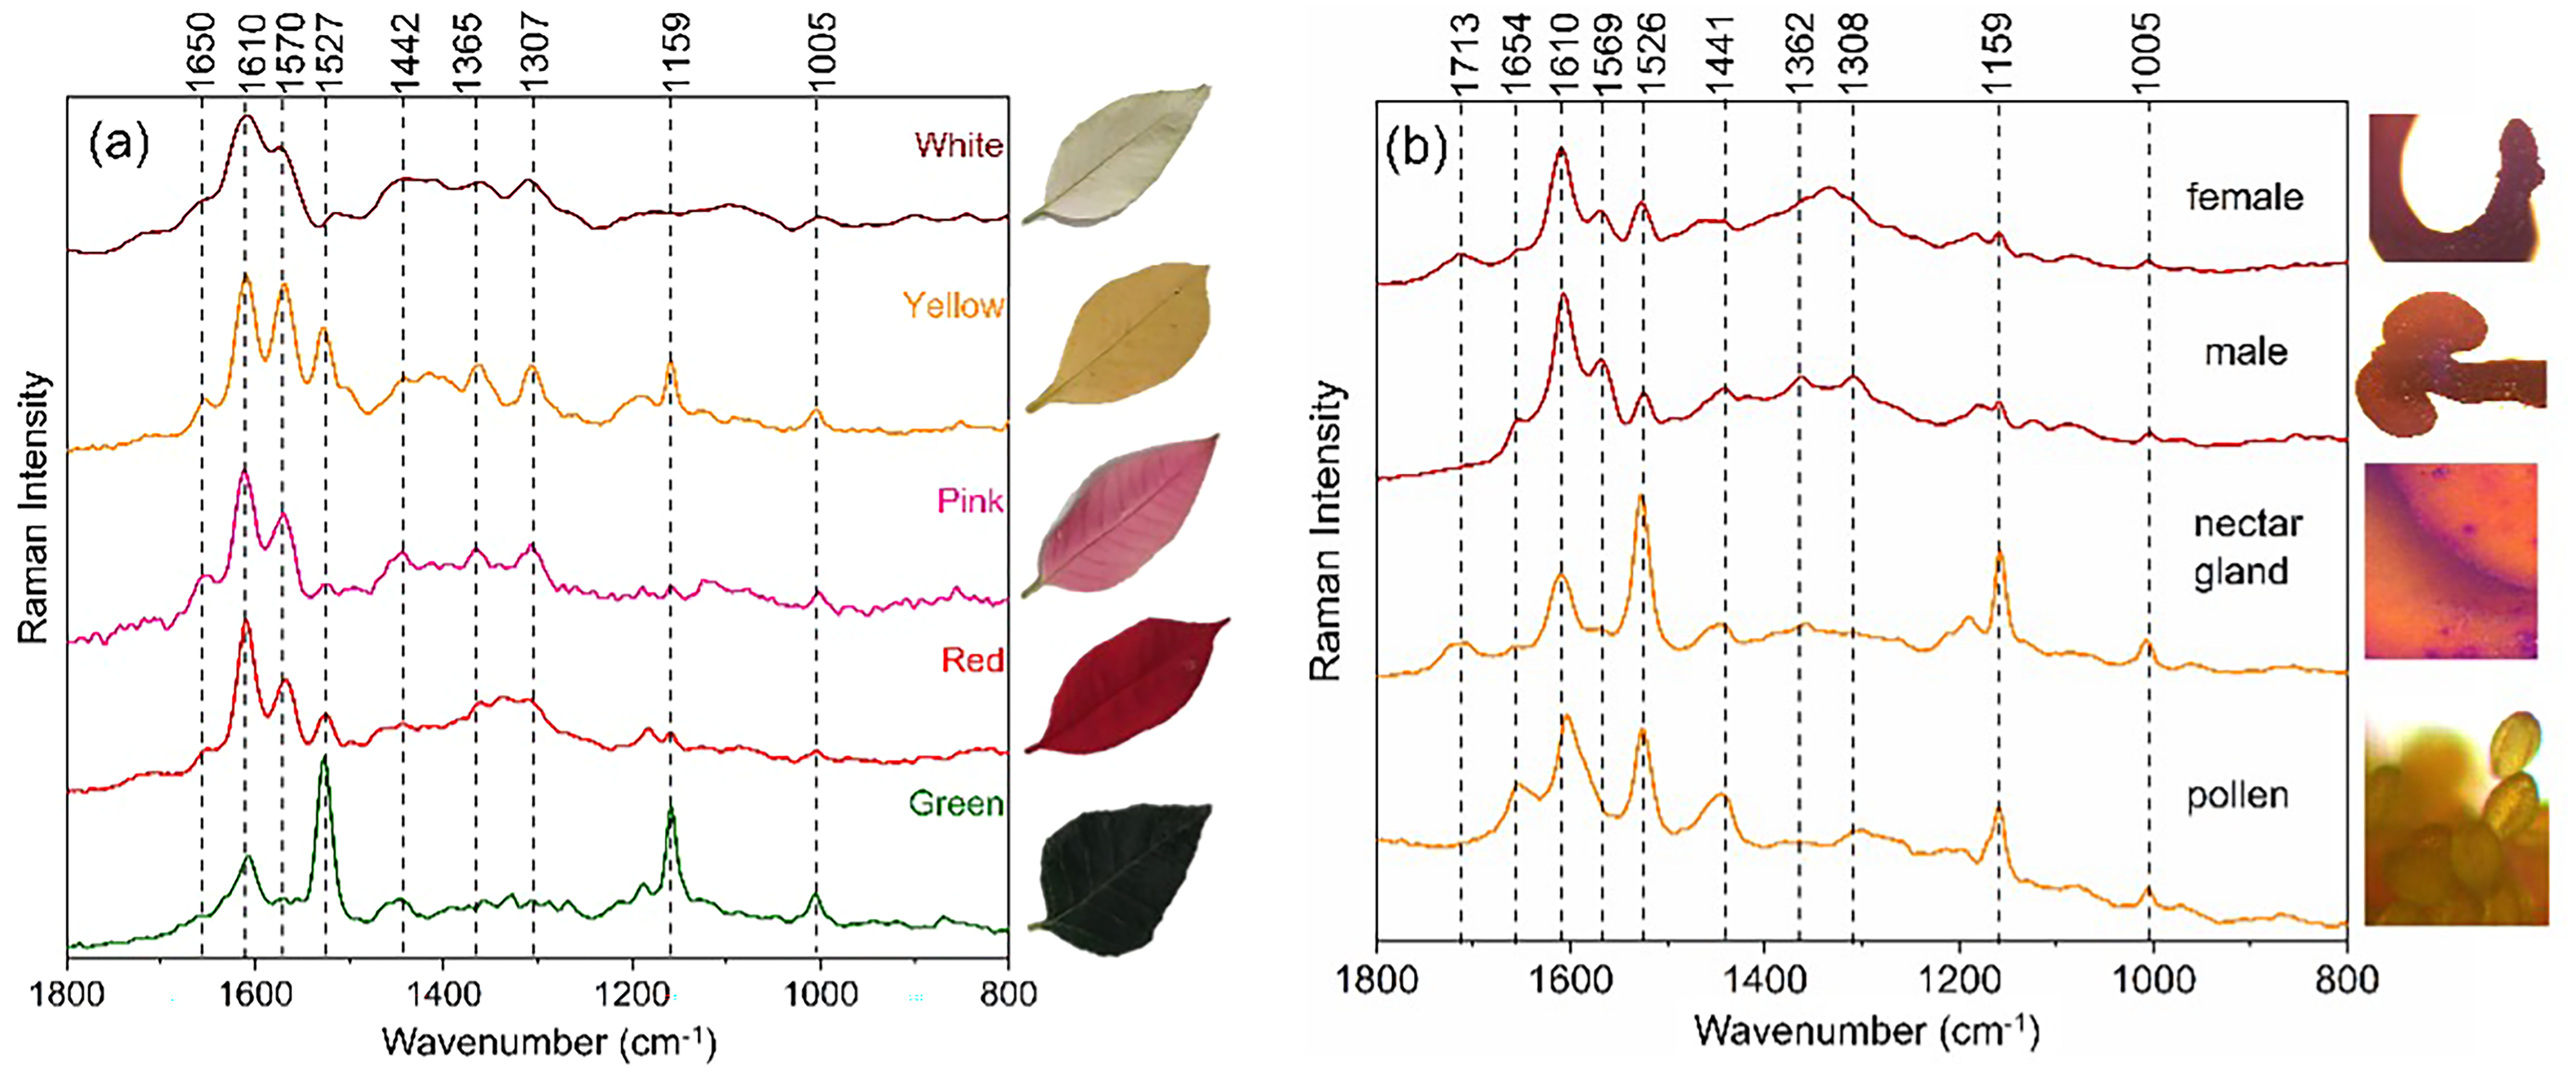
(a) In situ Raman spectra of green, red, pink, yellow, and white bracts from E. pulcherrima. (b) Raman spectra from female flowers (style), male flowers (pedicel/stamen), nectar gland, and pollen with exciting radiation at 1064 nm.
Tentative Raman band assignments (cm–1) for Euphorbia pulcherrima bracts using 1064 nm laser excitation.
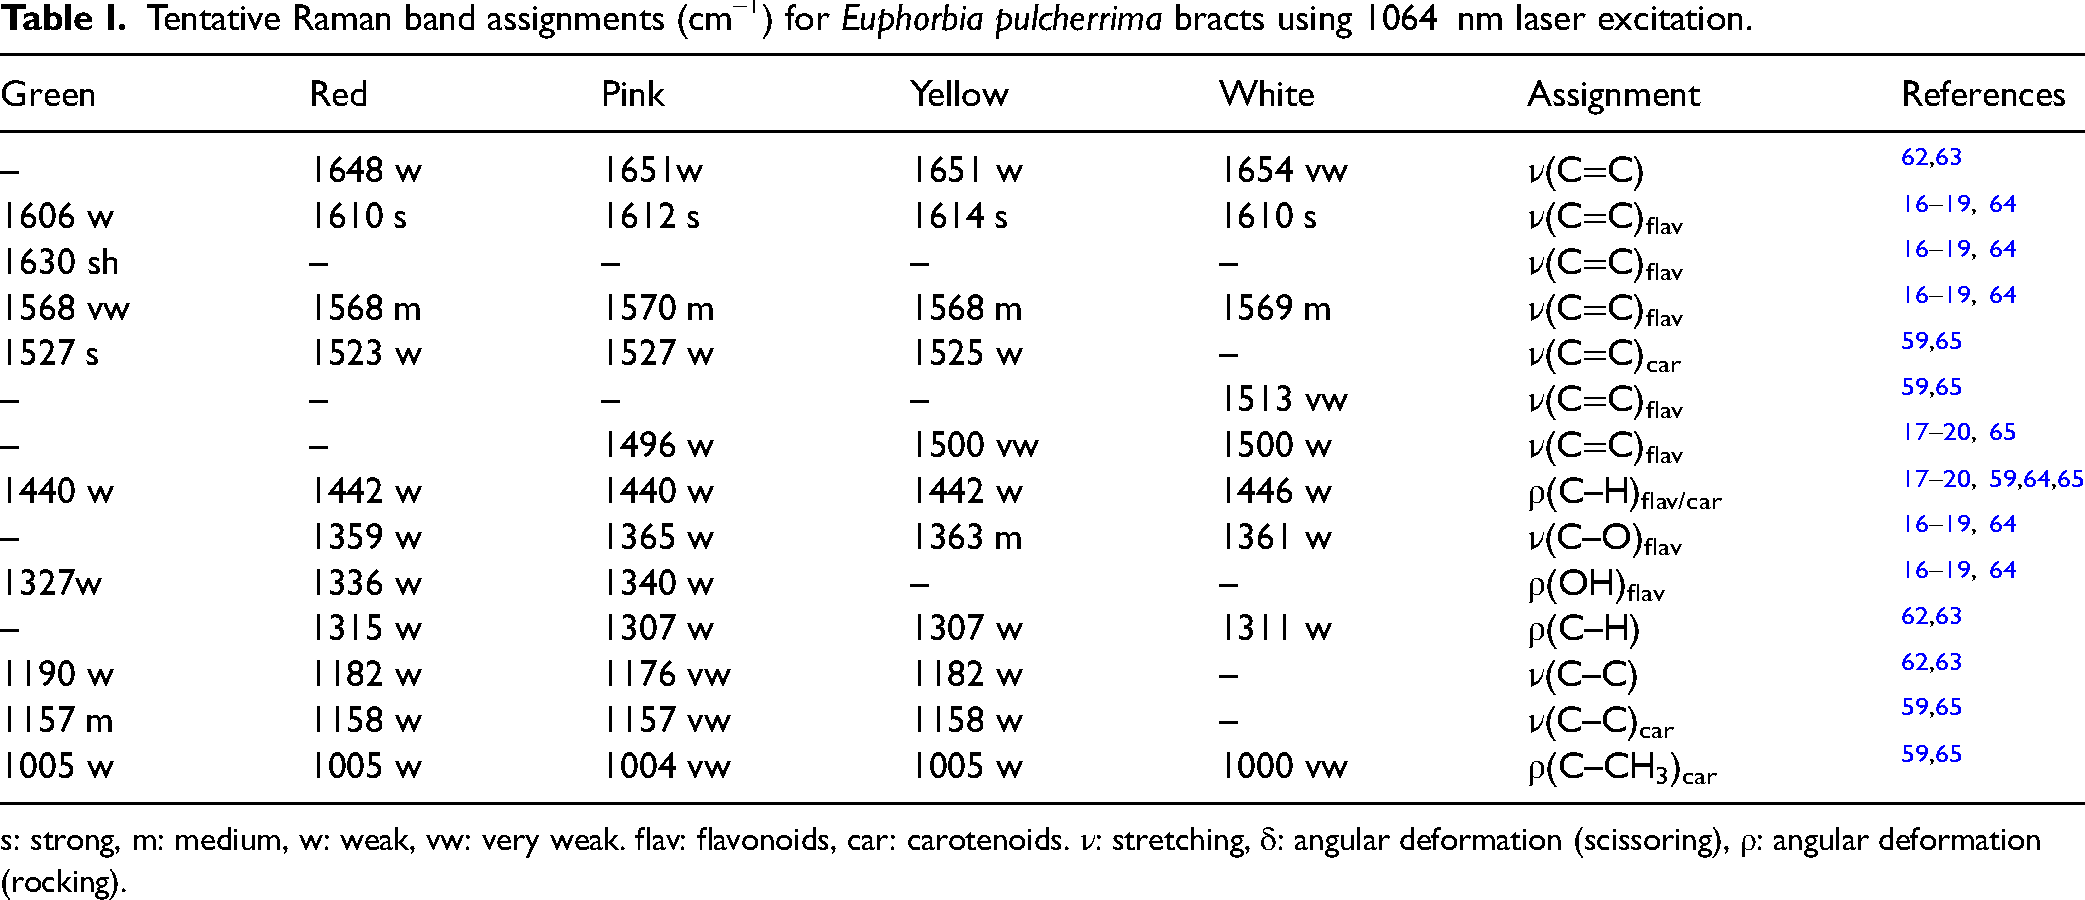
s: strong, m: medium, w: weak, vw: very weak. flav: flavonoids, car: carotenoids. ν: stretching, δ: angular deformation (scissoring), ρ: angular deformation (rocking).
In Situ Raman Analyses of Poinsettia Inflorescence
The poinsettia inflorescence consists of tiny cup-shaped clusters of yellowish-green male and female flowers termed cyathia, which are surrounded by yellow nectar glands. Raman spectra obtained from distinct parts of the flowers also presented carotenoids and phenolic acids/flavonoids with different spectral patterns (Figure 3b).
Spectra from the yellow nectar gland showed major bands of the both classes with predominance of carotenoids at 1526, 1159, and 1005 cm–1 (Table S1, Supplemental Material), while an inverse correlation was observed with those from the dark-red male (pedicel/stamen) and female (style) flowers attributed to phenolic acids/flavonoids at 1610, 1569, 1362, 1308, and 1184 cm–1 (Figure 3b).
Yellow pollen grains showed carotenoid bands at 1526, 1159, and 1005 cm–1 and phenolic compounds at 1640, 1603, 1587, 1445, 1213, and 1169 cm–1 (Table S1, Supplemental Material). This spectral feature may be interpreted as a mixture of sporopollenin and carotenoids.66–68 Sporopollenin is a heteropolymer composed of ferulic and coumaric acids as major building blocks crosslinked by hydroxyl fatty acids present in the outer walls of spores and pollen grains.66,67,69,70 The Raman mapping of a single pollen grain performed with 785 nm laser excitation confirmed the distribution of both carotenoids and sporopollenin throughout the exine (outer layer of pollen wall) (Figure S3, Supplemental Material).
Carotenoids appear to be the primary pigments responsible for the coloration of pollen grains and nectar glands. The identification of carotenoids in pollen from E. pulcherrima is in agreement with literature, which reports that entomophilous species (insect-pollinated) such as E. pulcherrima have highest amount of protein and carotenoid compared to anemophilous species (wind-pollinated). 69
Raman Mapping from Developing Red Bract
Raman mapping of the developing red bract was used to assess the spatial distribution of compounds within the selected area (Figure 4a). Figure 4b displays the characteristic Raman spectra acquired across 25 distinct sites, labeled A through Y, corresponding to the specific locations on the bract where the data were collected. The green part of the bract (Figures 4b–A, B, C, F, G, H, K, L, P, U) displayed a spectral pattern similar to that of the green leaf (Figure 3a); the most intense Raman bands are attributed to carotenoids (yellow stripe, Figure 4b). As the bract develops to red, it can be observed a predominance of the flavonoid bands (pink stripes, Figures 4b–I, J, M, N, O, S, T, X, Y). The integration of Raman bands at selected wavenumbers is shown in Figure 4c and Figure 4d. The multi-trace map (Figure 4c) shows that both classes of compounds occur along the mapped area, with increasing red color gradient assigned to phenolic acids/flavonoids from the margin to the midrib of the bract. The integration of flavonoid (1645–1585/1580–1547 cm–1) and carotenoid (1540–1500 cm–1) marker bands was represented in the heat maps by the magnitude of the Raman intensity. The heat maps show hues of orange color representing the highest Raman intensity, while hues of blue represent the lowest. It can be observed an inverse correlation between the two classes of metabolites as the red color develops (Figure 4d).
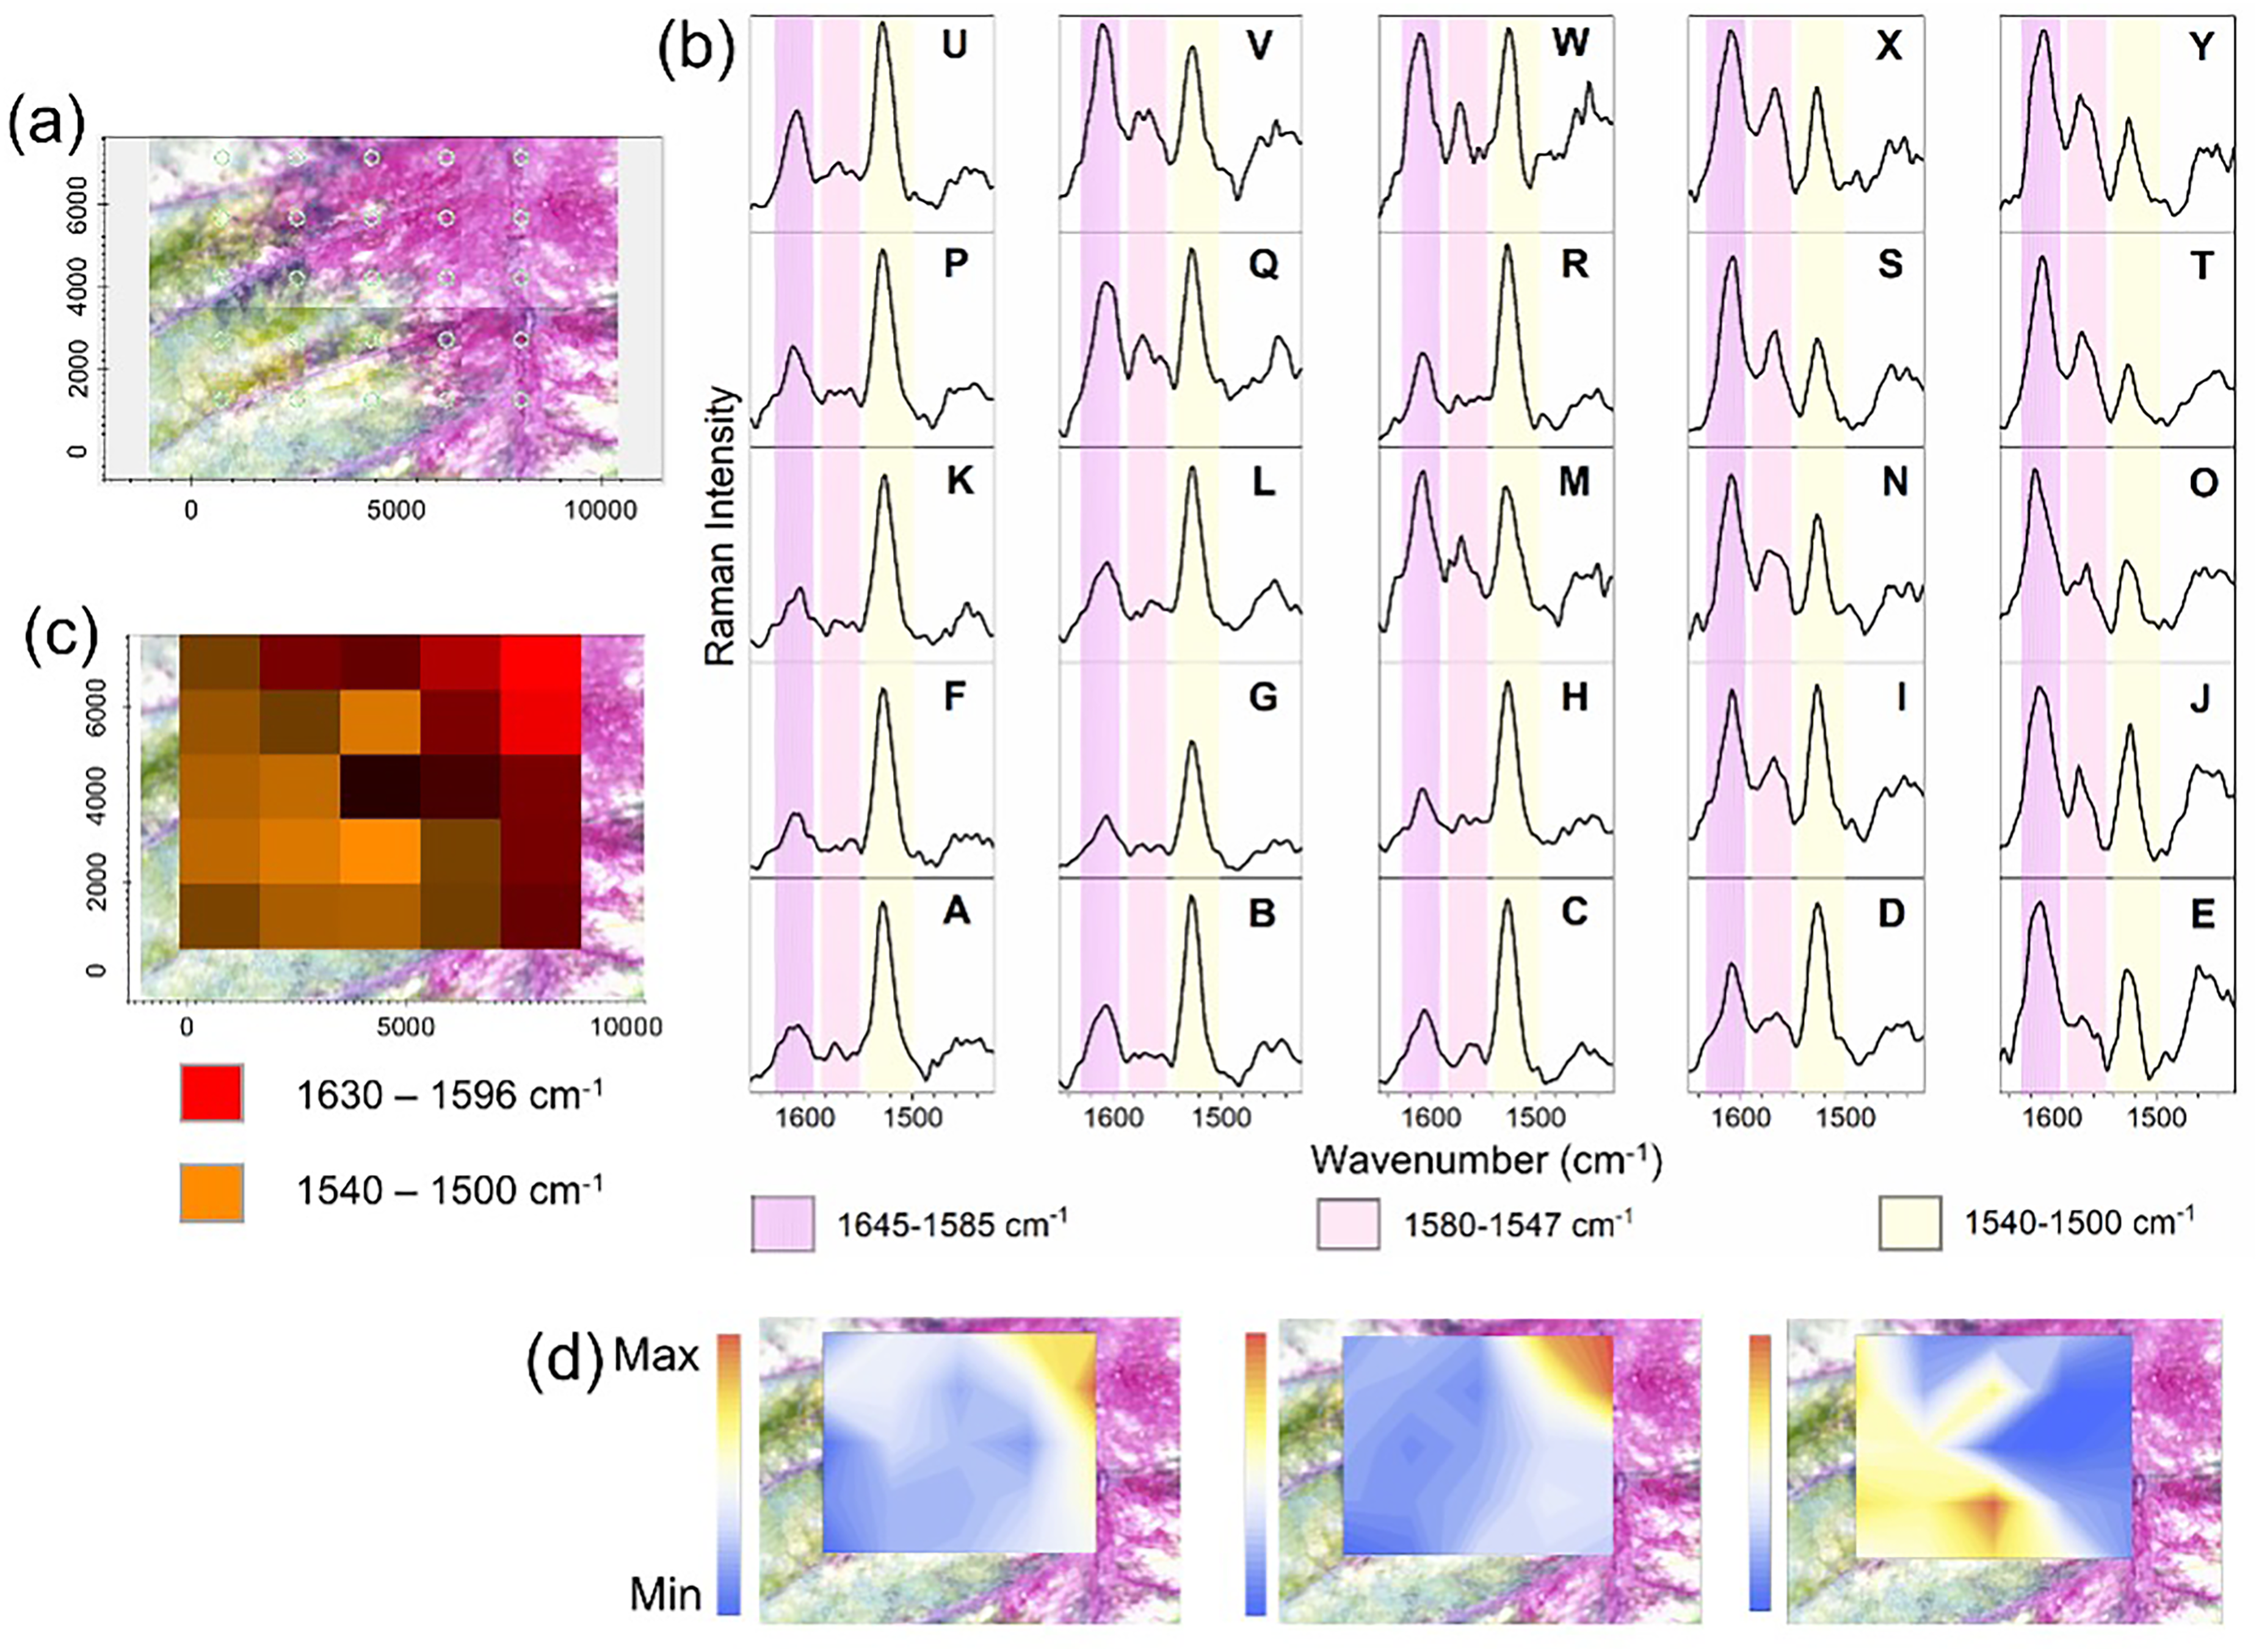
Raman mapping of the partially colored stage of red bract development. (a) Optical image displaying the mapped area. (b) Raman spectra displaying the wavenumber region between 1650–1400 cm–1 of each selected spot (A–Y). (c) Multiple integration of marker bands in the range of 1630–1596 cm–1 (red: flavonoids), 1540–1500 cm–1 (orange: carotenoids) and a combination of both (light to dark brown). (d) The heat map color gradient shows the integration of flavonoid and carotenoid marker bands, the color scale indicates the magnitude of the Raman intensity, where yellow represent the highest Raman intensity while blue is the lowest.
The Raman mapping revealed how ubiquitous carotenoids and flavonoids are in the leaves or bracts, regardless of the developmental stage. Even in the fully colored bract carotenoids are synthesized. Carotenoids were selectively identified in the analysis of crude extracts performed with different solvents discussed below.
Raman Spectral Analyses of Crude Extracts
Two distinct extraction methods were used on the green leaves, yellow, and red bracts of E. pulcherrima to evaluate the carotenoid occurrence in green leaves and non-green bracts. The acetone crude extract of green leaves (Ac-G) yielded the best results, with characteristic Raman bands at 1529, 1159, and 1007 cm−1, when compared to hydroalcoholic mixture (Alc-G) (Figure 5a, Figure 5b, and Table S2). Besides carotenoids, the Ac-G presented very weak bands at 1710 (C=O)ester, 1640 (C=C)allylic, 1618 (C=C)ring, and 1570 cm–1(C=C) assigned to phenolic compounds. On the other hand, the Alc-G showed a significant content of phenolic compounds indicated by broad bands observed at 1691 (C=O)ester, 1630 (C=C)allylic, 1606 (C =C)ring, 1585 (C=C), 1570 (C=C), 1500 cm–1 (C=C). As can be seen in each set of spectra (Figure 5a and Figure 5b), phenolic compounds presented distinct maximum Raman intensities for the stretching vibration of the aromatic rings at approximately 1620 (Ac) and 1610 cm–1 (Alc). The occurrence of phenolic compounds was also revealed by the UV–Vis spectral analyses showing absorption bands at 230, 268, 320 nm (Ac-G), 227, 266, 346 nm (Ac-R), 225, 270, 345 nm (Alc-G), and 227, 266, 346, 510 (Alc-R). Besides, the crude extracts also showed bands of chlorophylls at 667 nm (Figure S4, Supplemental Material).
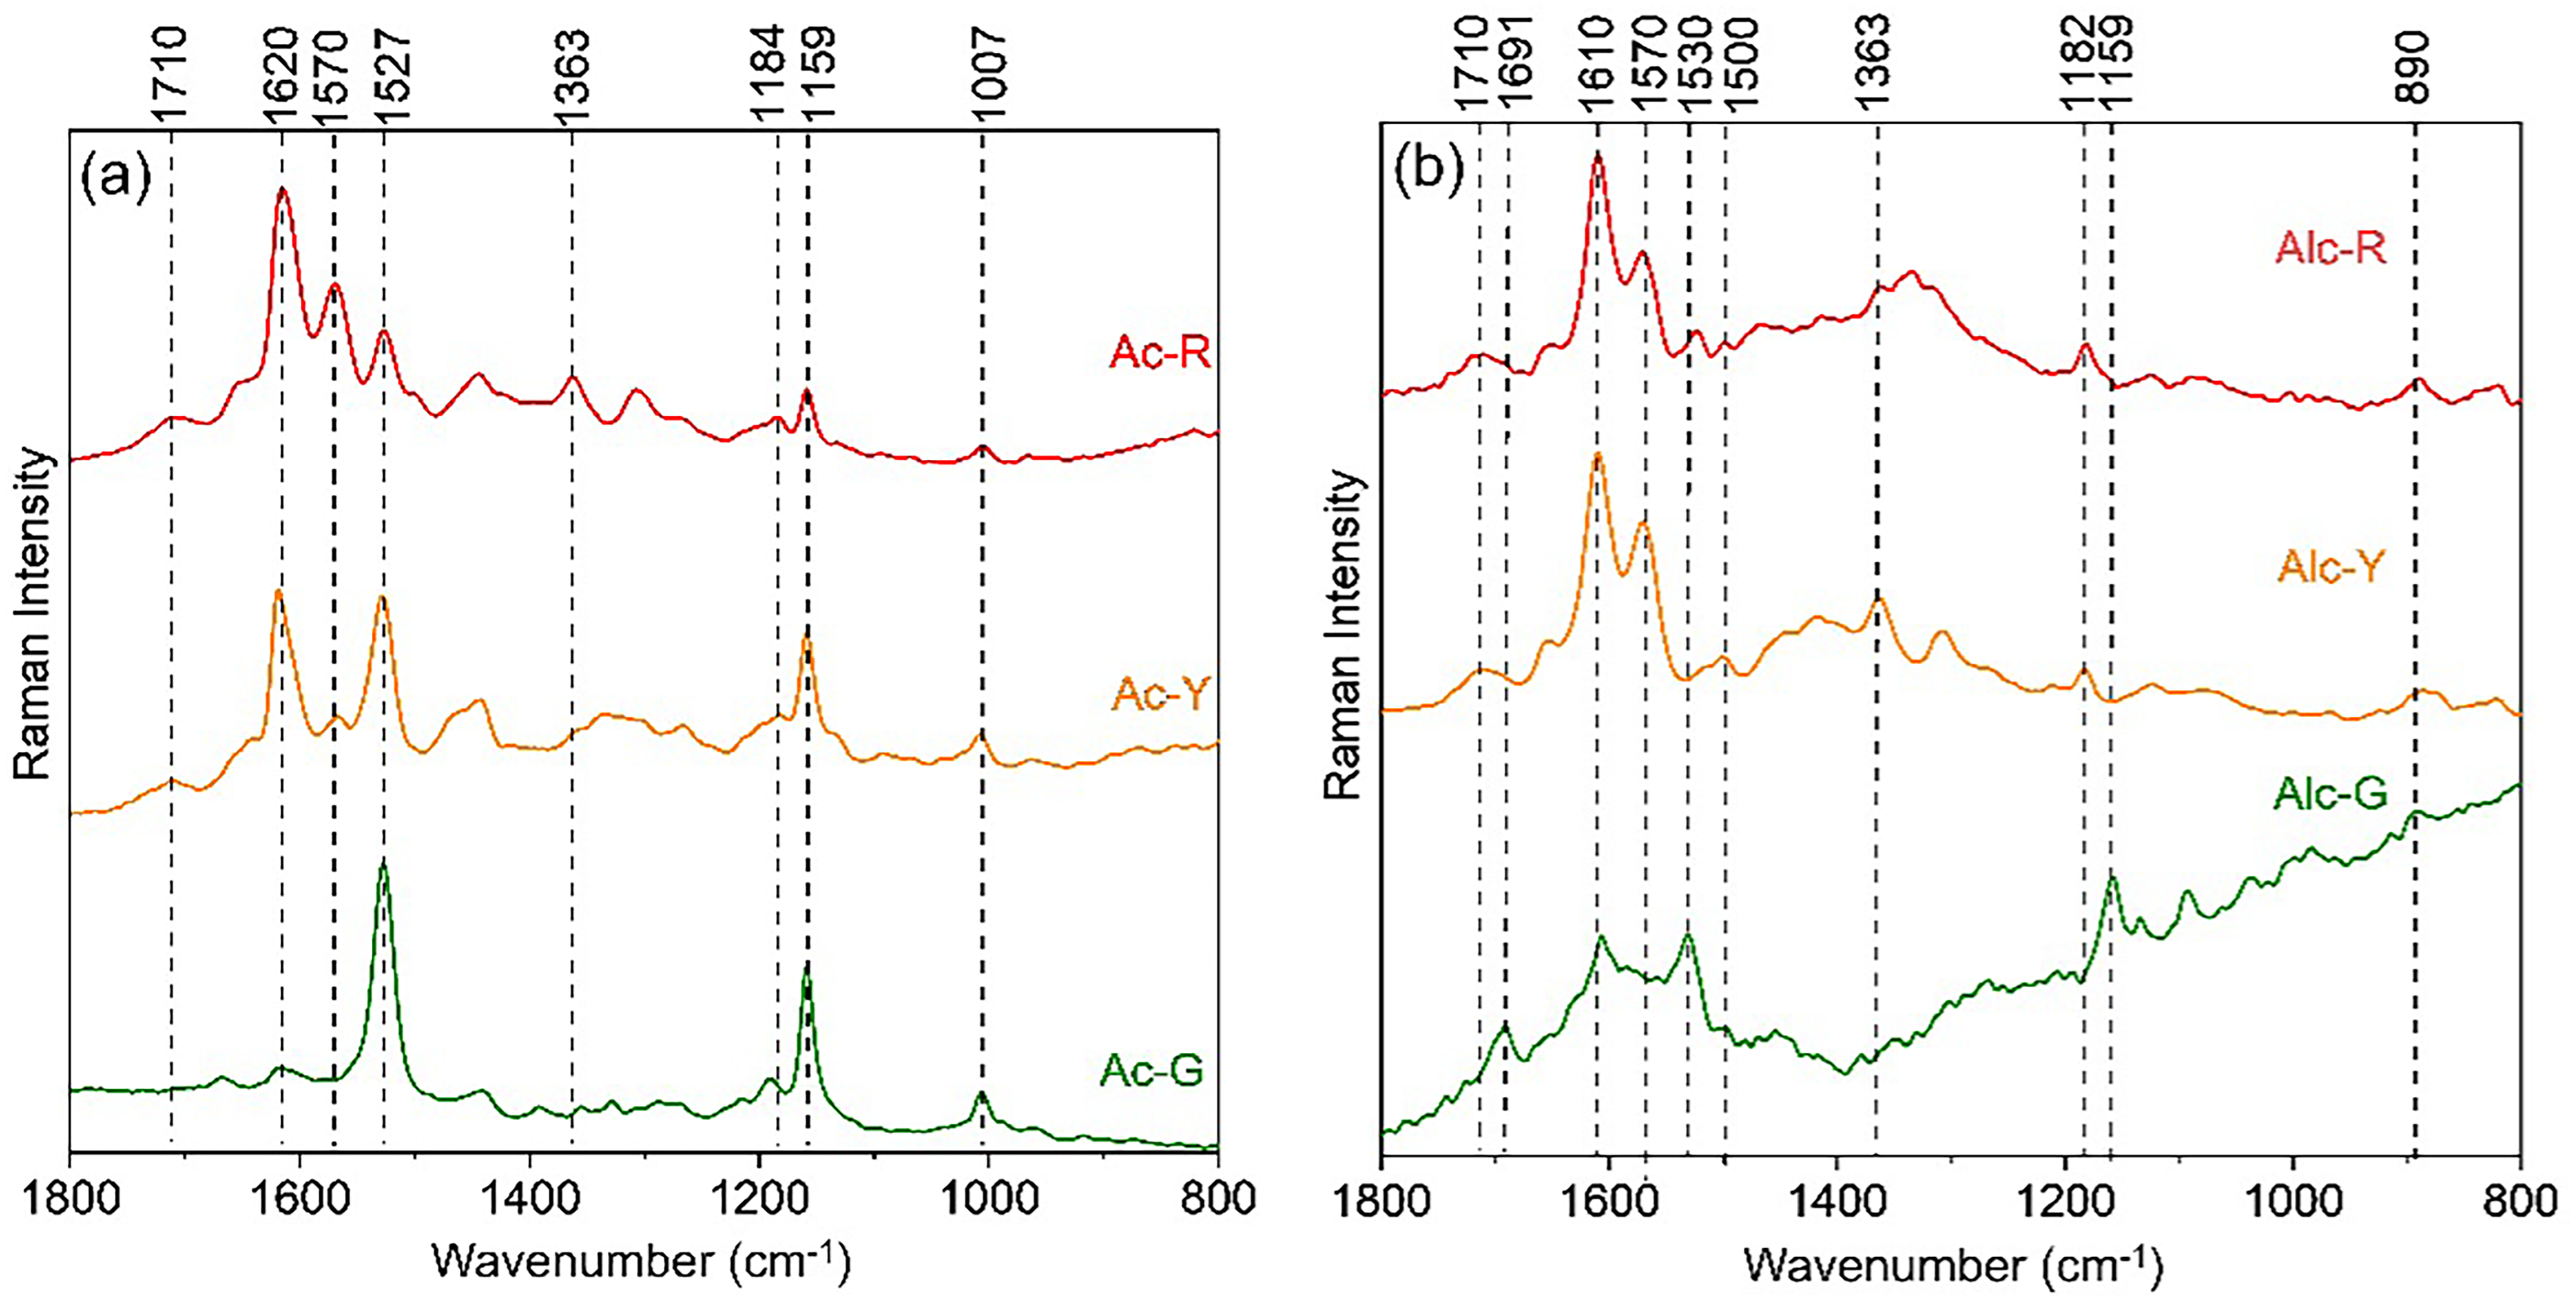
Raman spectra of crude extracts from E. pulcherrima bracts obtained with (a) acetone and (b) hydroalcoholic mixture media obtained using 1064 nm wavelength excitation.
An expressive content of carotenoids was also observed in yellow bracts (Ac-Y: Icar/Ipol = 0.9), and minor amounts in red ones (Ac-R: Icar/Ipol = 0.37) (Fig. 6a). Both in situ and crude extract analyses show variations in Raman intensities (1608–1570 cm–1), suggesting that yellow and red bracts possess distinct phenolic profiles (Figure 3a and Figure 5a). Unlike the green leaf hydroalcoholic extracts (Alc-G), Alc-Y and Alc-R showed no carotenoid signals, though they maintained a similar 10 cm−1 blueshift in the aromatic region. These shifts in band position suggest that each solvent possesses a different extraction efficiency for specific classes of compounds. Decomposition of the broad bands between 1670–1485 cm–1 in both types of crude extracts (Figure S5) confirmed the structural variability and selectivity of the solvent in recovering carotenoids and phenolic compounds. The acetone crude extracts were efficient for carotenoids (1527 cm–1) as well as polyphenols (flavonoids/anthocyanidins) according to marker bands approximately 1650–1660, 1620–1600, 1580–1570 cm–1 (Table S2, Supplemental Material), 60 71–73 while hydroalcoholic mixture favored phenolic acids/polyphenols (1700–1790, 1630–1640, 1610–1600, and 1570–1560 cm–1).16,60,73–75
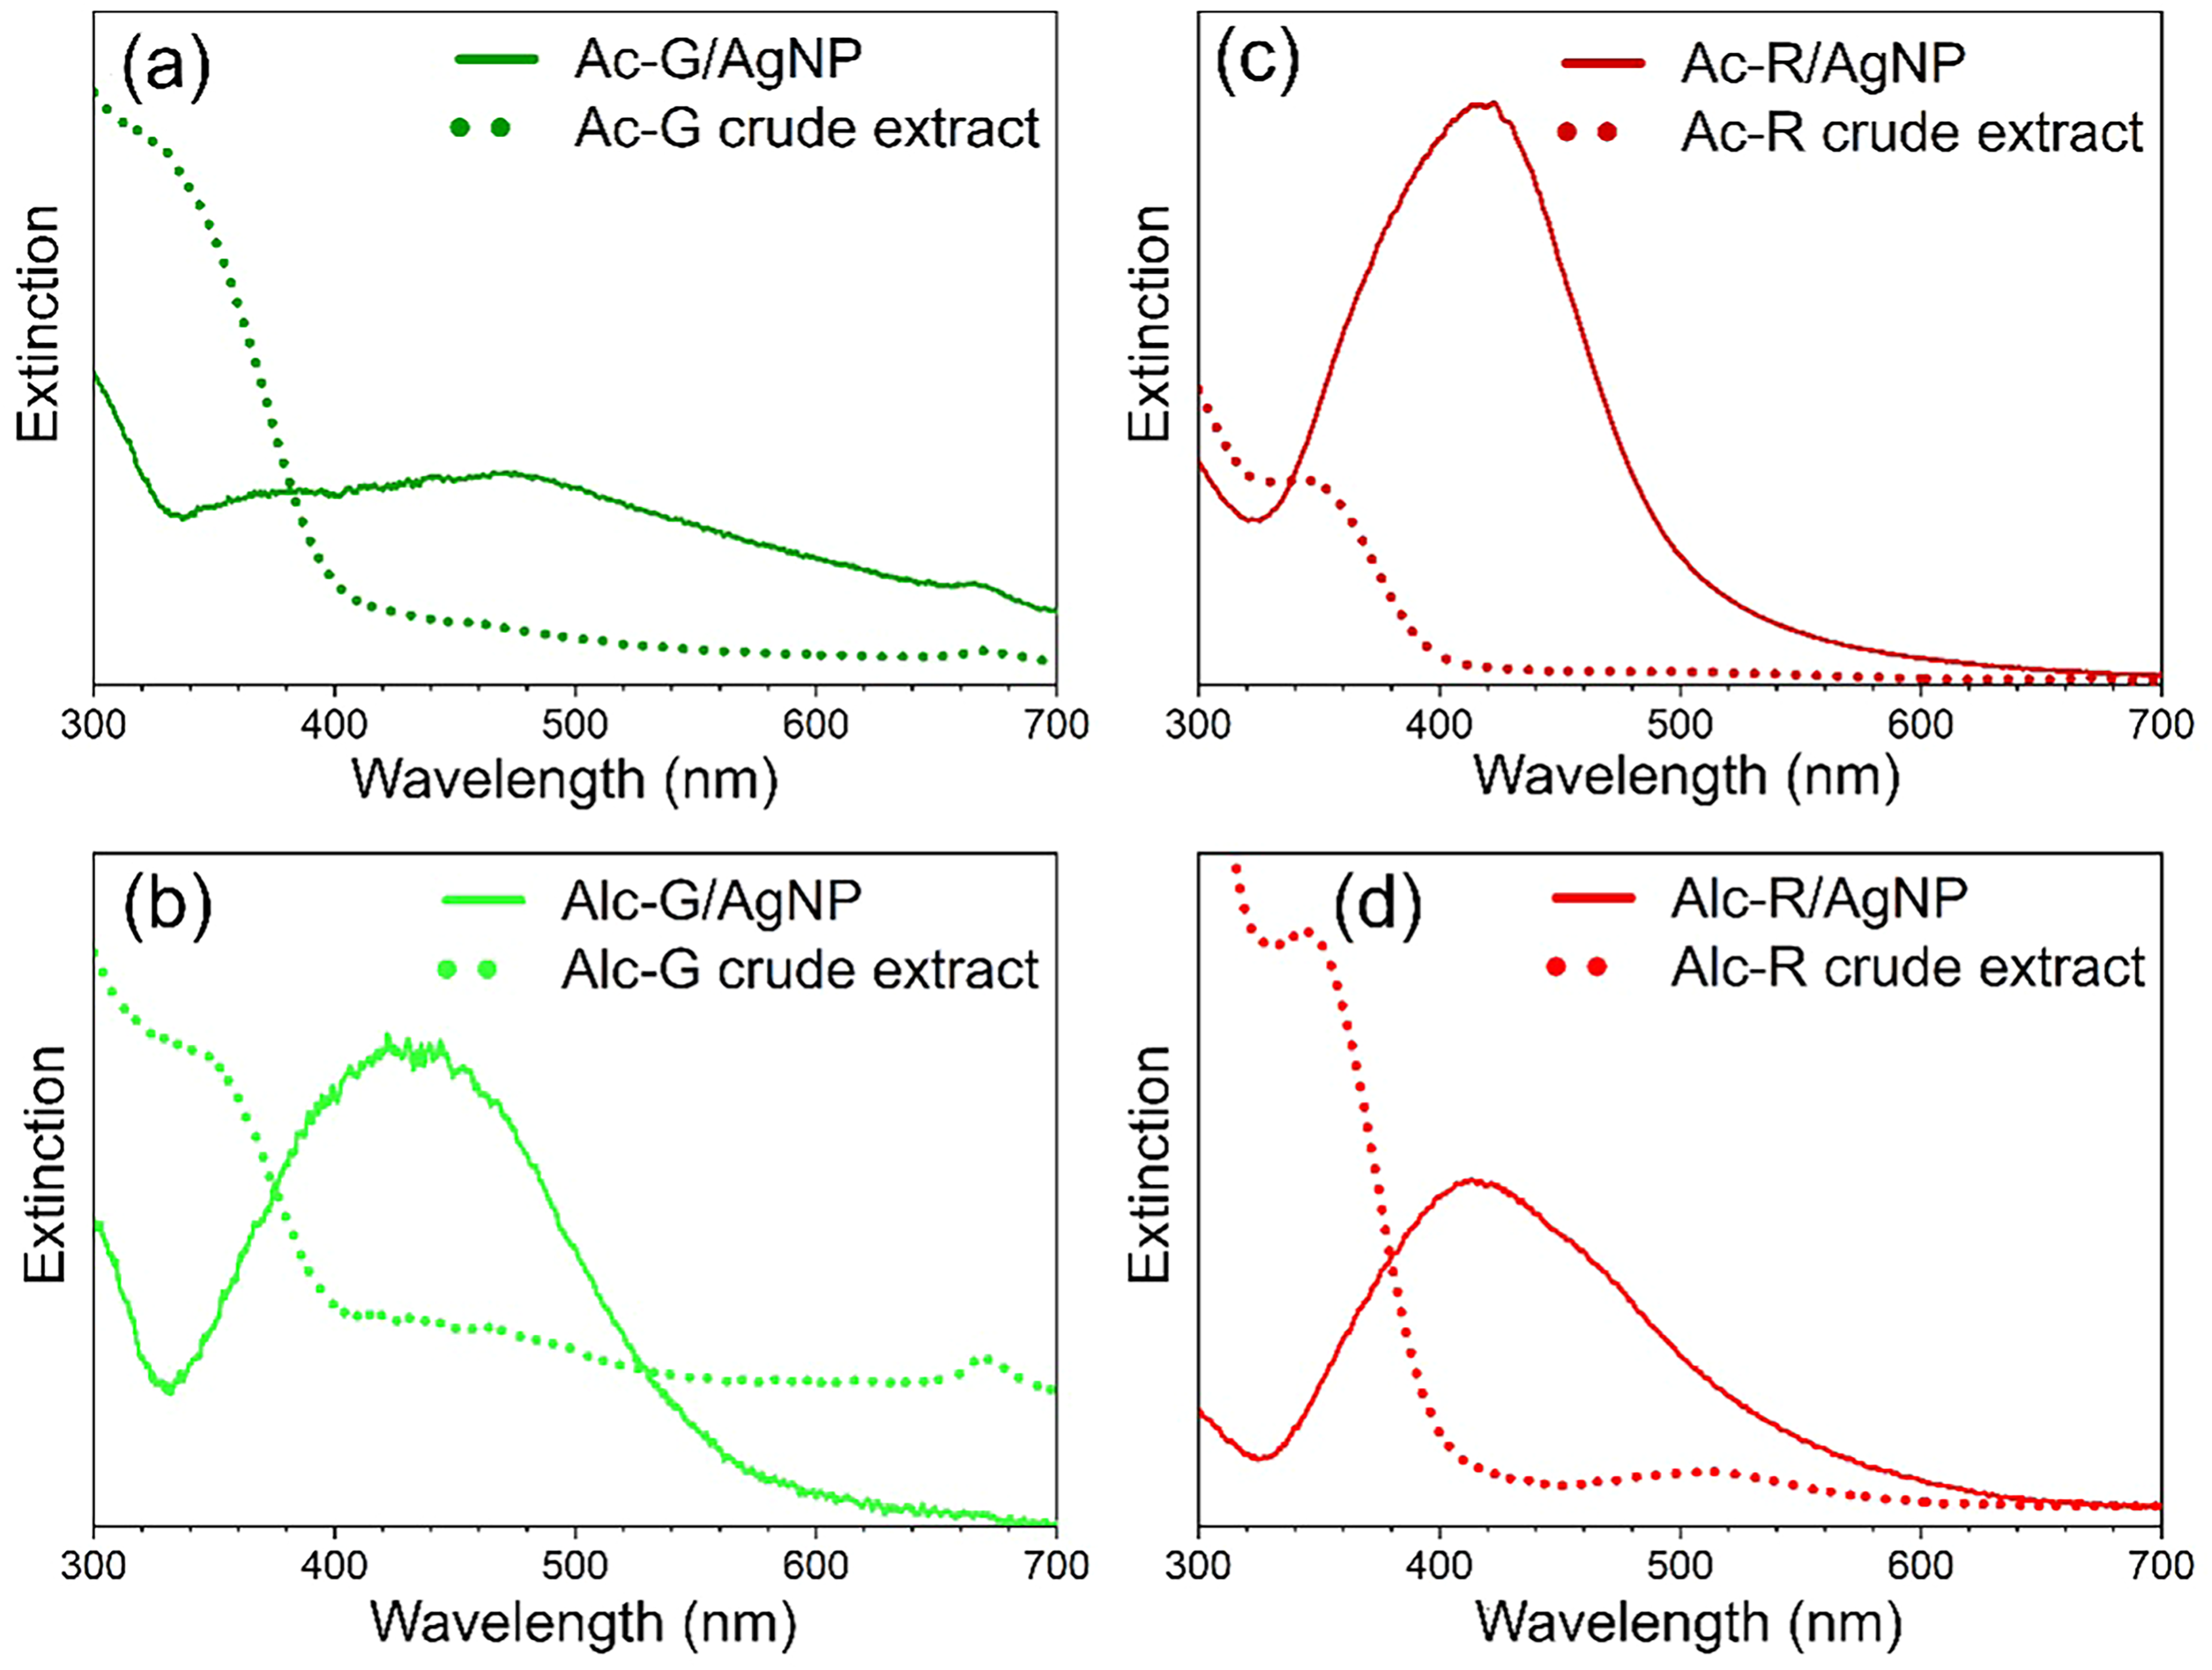
UV–Vis spectra of acetone (Ac) and hydroalcoholic (Alc) crude extracts from E. pulcherrima (Ep). Panels (a) and (b) represent green leaf extracts (Ac-G, Alc-G), while (c) and (d) represent red bract extracts (Ac-R, Alc-R). Solid lines indicate spectra from Ep/AgNP in aqueous solution; dotted lines represent the corresponding crude extracts in aqueous solution.
Gu et al. 11 reported that green bracts extracted with methanol yielded phenolic acids and higher diversity of flavonoid compounds than in red turning bracts, corroborated by spectral results obtained in this study with hydroalcoholic mixture (Alc-G) (Figure 5b). In addition, a study performed with green, reddish and red bracts showed that cyanidin accumulation in red bracts was two-fold higher than in green leaves, while in reddish leaves was 1.4-fold higher than in green ones. 76 The color transition is due to differential vacuolar anthocyanin accumulation, which is influenced by environmental factors such as temperature and photoperiod. 76
According to the literature the red pigmentation of bracts is mainly due to cyanidin followed by pelargonidin, 61 the pink and white bracts being composed of the same anthocyanins but, in a much smaller amount (approximately three times less than the red one), 61 the orange-red bract is based on the prevalent presence of pelargonidin derivatives, 6 however, the characterization of the yellow bract have been overlooked.
The structural diversity of phenolic derivatives in poinsettia bracts, as well as in several other plants, may contribute to the co-pigmentation effect. 8 The co-occurrence of flavonoids, anthocyanins, and carotenoids in the yellow bract could be attributed to the concomitant accumulation during the pigmentation process and/or an intermolecular co-pigmentation. Several examples of co-pigmentation in flowers have been described in the literature,77–81 mainly intermolecular association between anthocyanin and flavonoids; 82 they stabilize and modulate (in particular blue, violet, and red) colors in flowers and berries. Nonetheless, yellow floral pigments are commonly derived from aurones, chalcones, and flavonols. 81 To a lesser extent, carotenoids serve as the primary components, as described for the yellow petals of Rosa spp., 83 Nicotiana rustica L., 70 and Camellia nitidissima, 84 where flavonoids and anthocyanins are present only in smaller amounts. Although E. pulcherrima’s bracts are histologically and morphologically distinct from petals, they share several metabolites. In this sense carotenoid content in the yellow bract of E. pulcherrima could be the major pigment responsible for the coloration.
Green Synthesis of AgNP Using E. pulcherrima (Ep) Crude Extracts
The crude extracts from the bracts of E. pulcherrima were employed in the synthesis of silver nanoparticles (AgNP) to evaluate the potential of Ep/AgNP in green synthesis. The characterization of the synthesized Ep/AgNP was performed by UV–Vis spectroscopy (Figure 6) and confirmed by the observation of surface-enhanced Raman spectroscopy (SERS) effect (Figure 7). The UV–Vis spectra of the complex Ep/AgNP showed a characteristic localized surface plasmon resonance (LSPR) band of silver nanostructures at approximately 400 nm (Figure 6). Bands of crude extracts and localized surface plasmon of AgNP did not overlap, confirming the reaction among polyphenols and Ag+ salt (Figure 6). The Ac-R was the most efficient in forming AgNP, followed by Alc-R, as evidenced by the high intensity of the LSPR band (Figure 6c). In contrast, Ac-G did not favor nanoparticle formation. According to the results, the AgNP formed are suggested to be small particles, since the LSPR band maxima appear in the range of 410–430 nm, similar to citrate-reduced syntheses (Figure S6, Supplemental Material). 85 A large particle size distribution could be inferred for these effective syntheses, as indicated by the broad LSPR band profile and the extension of such bands to wavelengths above 500 nm. 86
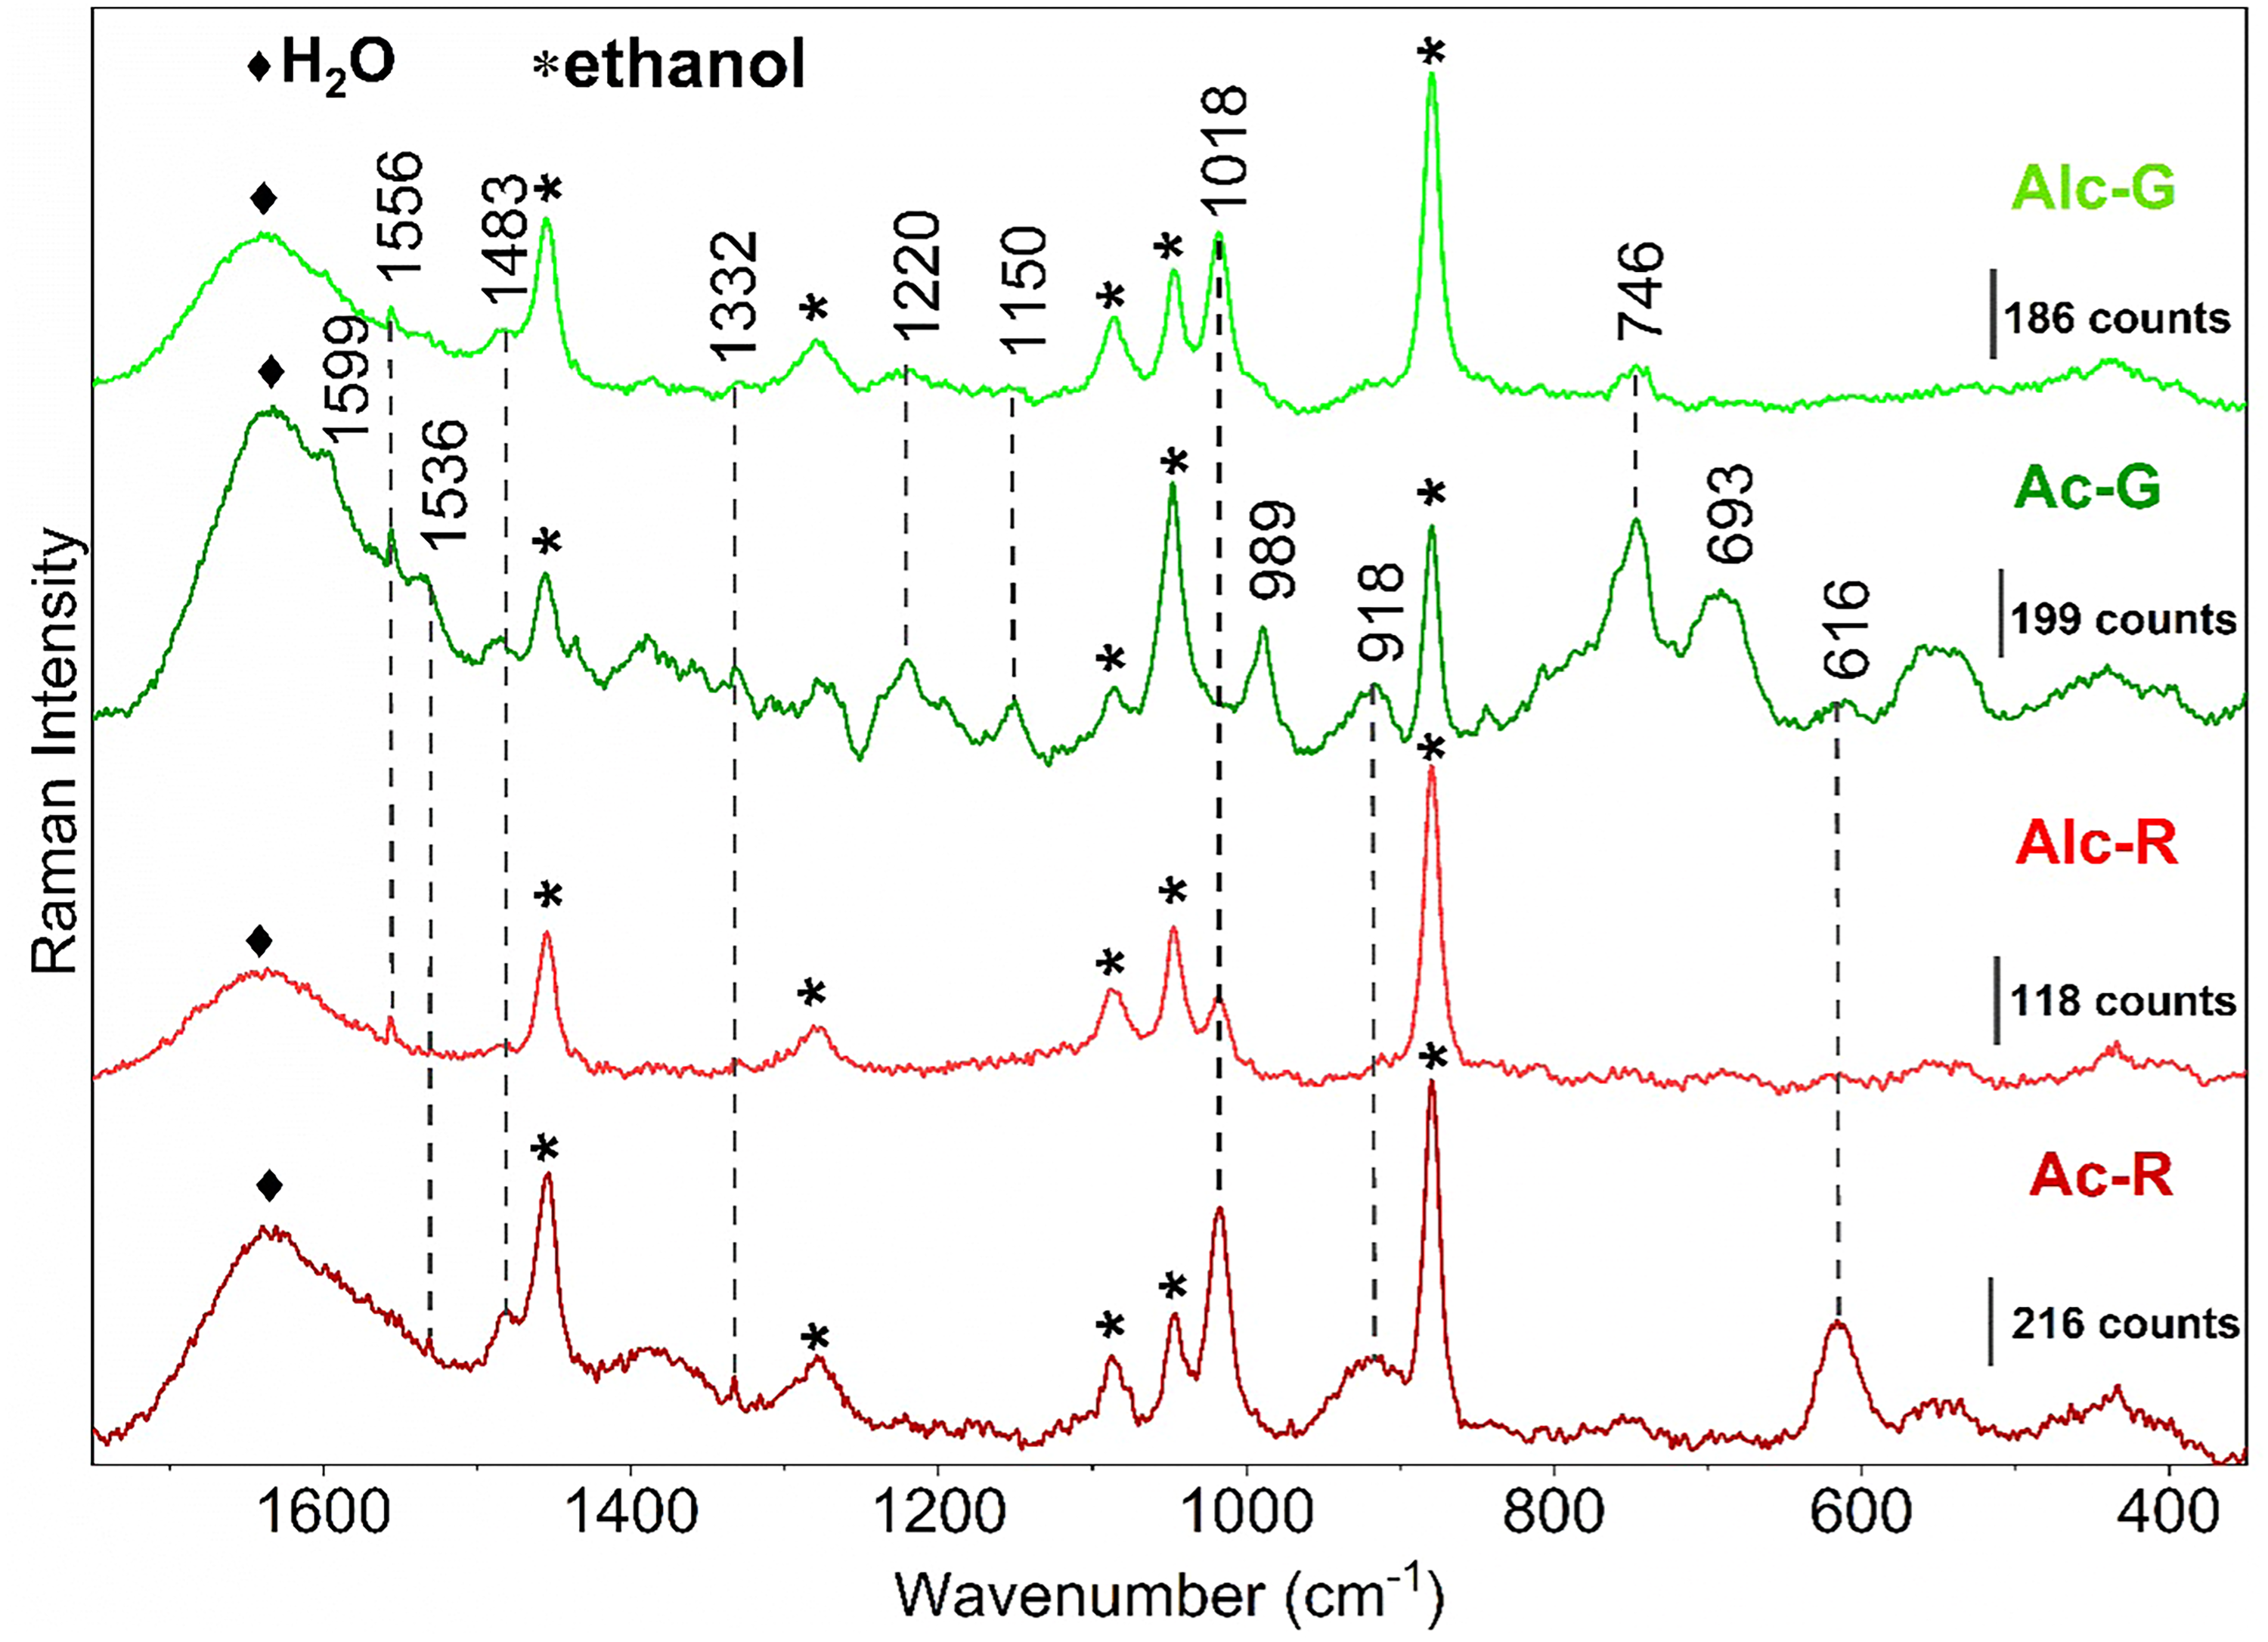
SERS spectra of chemical species present in green synthesized AgNP using E. pulcherrima crude extract of green leaves (Ac-G, Alc-G) and red bract (Ac-R, Alc-R) using 632.8 nm wavelength excitation.
The plasmonic properties of Ep/AgNP were confirmed by the signal enhancement observed in SERS spectra. Figure 7 shows some vibrational bands observed at 1599, 1556 cm–1 attributed to ν(C=C)ar, 1483 δ(C–H), 1332 cm–1 δ(C–O–H), δ(O–H), and 1018 δ(C–H),19,73 which can be assigned to polyphenols species. Raman spectra from dry and aqueous solution crude extracts acquired at 632.8 nm showed only fluorescence backgrounds (Figure S7, Supplemental Material). This confirms that the signal enhancement observed in AgNP-containing samples is a result of the SERS effect provided by the nanostructured silver surface.
The Ac-R is rich in carotenoids and flavonoids/anthocyanidins, while the Alc-R is rich in phenolic acids/flavonoids/anthocyanidins. The higher efficiency of AgNP formation from the extracts of red bracts, especially in an acetone medium (Ac-R, Figure 6) may be due to the flavonoid and anthocyanin contents39,87,88 consequently, their greater reducing efficiency compared to the extract of green leaves (Ac-G, Figure 6). Recent work demonstrated that aqueous crude extracts from E. pulcherrima were effective in reducing silver and silver chloride nanoparticles (EP-Ag/AgCl-NPs). 34 According to Sajjadi et al., polyphenols identified in aqueous crude extracts from Euphorbia peplus were the main compounds responsible for the reduction of Ag– ions; 38 other authors showed that LSPR bands placed near 420 nm could be generated by tea plant (Camellia sinensis), standard polyphenols-mediated Ag+ reduction,89,90 or carotene-stabilized AgNP. 91 Silver nanoparticles synthesized with β-carotene have also been reported, 92 so the combination of carotenoids and flavonoids may have a synergistic effect. Based on the aforementioned literature, it can be concluded that flavonoids and anthocyanins extracted via diverse methods from E. pulcherrima serve as effective natural reducing agents for the synthesis of silver nanoparticles. This green synthesis approach is not only environmentally friendly due to reduced waste generation but also economically advantageous, lowering manufacturing cost. Most importantly, the resulting nanoparticles offer enhanced biocompatibility for biomedical and pharmaceutical applications.93,94
Conclusion
In situ Raman spectroscopy was used to characterize unique vibrational signatures from distinct parts of the plant E. pulcherrima as it occurs in the natural environment. The macro and micro-Raman spectral data collected directly on the plant’s tissues confirmed the occurrence of carotenoids and polyphenols/phenolic acids in the leaves, bracts, and inflorescences. The qualitative identification of these metabolites in green, yellow, and red bracts was performed by Raman analysis of the acetone and hydroalcoholic crude extracts. Carotenoids and polyphenols (flavonoids/anthocyanidins) were efficiently recovered from the acetone crude extracts, while hydroalcoholic mixture favored phenolic acids/polyphenols.
Carotenoids are present throughout the plant regardless of the visual coloration; however, they predominate in green leaves, nectar gland, and pollen. In contrast, in the developing red bract, carotenoids are gradually superposed by polyphenols/anthocyanins. Unlike red and pink bracts, yellow bracts accumulate significant levels of carotenoids, as demonstrated by both in situ and crude extract analyses. This suggests that, despite being an unexpected finding, the yellow coloration may be attributed to these pigments.
The consistent spectral profiles observed between in situ measurements and acetone crude extracts for both green and red bracts demonstrate that direct in situ analysis is a reliable alternative to chemical extraction for compound identification in E. pulcherrima. In situ analysis may serve as a valuable guide for optimizing the extraction methods required for the green synthesis of silver nanoparticles (AgNPs). The distinct chemical profiles among the crude extracts impacted the efficiency and size distribution of the green-synthesized AgNP, as evidenced by the variations in LSPR band intensities and positions. These results validate the dual role of E. pulcherrima bract extracts as both reducing and stabilizing agents in AgNP synthesis. In a broader context, this work underscores the feasibility of utilizing ornamental plants as a valuable raw material for the sustainable development of nanomaterials.
Supplemental Material
sj-docx-1-asp-10.1177_00037028261453405 - Supplemental material for Raman Spectroscopic Characterization of Carotenoid and Phenolic Co-Occurrence in Euphorbia pulcherrima Bracts and Inflorescences
Supplemental material, sj-docx-1-asp-10.1177_00037028261453405 for Raman Spectroscopic Characterization of Carotenoid and Phenolic Co-Occurrence in Euphorbia pulcherrima Bracts and Inflorescences by Lenize F. Maia, Mariana T. C. Campos, Rafael de Oliveira, Howell G. M. Edwards, Eudes da S. Velozo, Antonio Carlos Sant’Ana and Luiz F. C. de Oliveira in Applied Spectroscopy
Footnotes
Acknowledgments
The authors are indebted to the Brazilian agencies CNPq (406853/2021-5, and 303569/2022-0, 403179/2025-4), FAPEMIG (APQ-03079-23, APQ-00887-23), FINEP (0187/22-INFRASPEC), PETROBRAS (TC 0050.0121114.22.9), and CAPES for financial support. We also thank Dr. Linus Pauling Faria Peixoto for the valuable comments and suggestions provided.
Data Availability Statement
The original contributions presented in this study are included in the article/Supplemental Material. Further inquiries can be directed to the corresponding authors.
Declaration of Conflicting Interests
The author(s) declared no potential conflicts of interest with respect to the research, authorship, and/or publication of this article.
Funding
The author(s) received no financial support for the research, authorship, and/or publication of this article.
Supplemental Material
All supplemental material mentioned in the text is available in the online version of the journal.

References
Supplementary Material
Please find the following supplemental material available below.
For Open Access articles published under a Creative Commons License, all supplemental material carries the same license as the article it is associated with.
For non-Open Access articles published, all supplemental material carries a non-exclusive license, and permission requests for re-use of supplemental material or any part of supplemental material shall be sent directly to the copyright owner as specified in the copyright notice associated with the article.
