






Abstract
This study utilizes continuous wave cavity ring-down spectroscopy (CW-CRDS) at a wavelength approximately 1672 nm to detect acetone and methane in exhaled human breath. We employed a commercial distributed feedback diode laser (DFB), which delivered approximately 4 mW of power across a tuning range of 3.5 nm to measure acetone and methane concentrations in exhaled human breath. A detection limit of about 10.5 parts per billion (ppb) was demonstrated. Samples were collected from two distinct population locations, 23 individuals from Doha, Qatar, and 19 volunteers from College Station, Texas. The content of multiple gas mixture components was determined. The developed method for retroactive determination of the laser tuning eliminated the need for online wavelength determination. Simultaneous measurements of acetone and methane in exhaled breath can assist in diagnosing and monitoring diabetes and in assessing metabolic profiles of individuals using this noninvasive technique.
This is a visual representation of the abstract.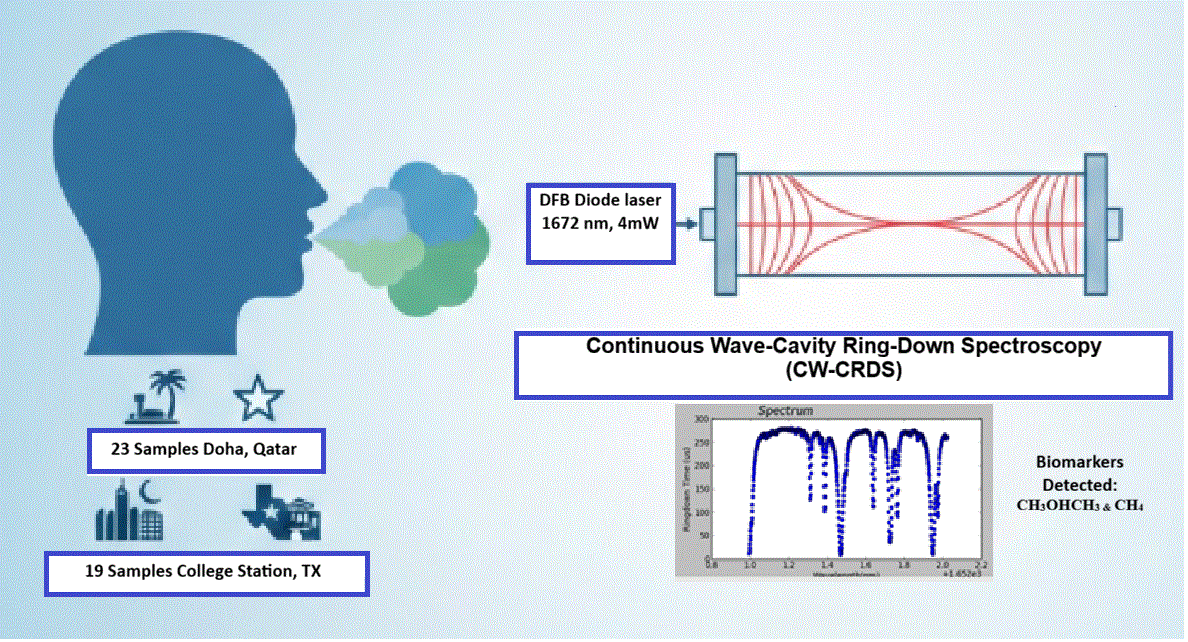
Keywords
Introduction
Researchers utilized various spectroscopic techniques to measure biomarker concentration, along with other gaseous components in the exhaled breath for early disease detection. As a byproduct of the body's metabolism, acetone is a vital biomarker in these measurements. When the body breaks down fats for energy, it produces acetone, which is then exhaled. Historically, a gas component in the breath that created the smell of rotting apples was identified, and it is now understood that this component was mostly acetone.1–3 Subjects with diabetes who have elevated blood sugar levels often have a sweet and fruity breath smell, which can be attributed to the presence of acetone. 4 Researchers have conducted studies over the past 60 years on breath acetone measurements in healthy individuals and those with diabetes. Breath acetone can be considered a potential biomarker for diabetes mellitus, as an increased concentration of breath acetone is a viable indicator of the condition. Diabetes mellitus comprises a range of metabolic disorders characterized by dysfunctions in insulin secretion, insulin action, or both, resulting in elevated blood glucose levels (BGLs). Among the three ketone bodies synthesized in the liver are acetone (C3H6O), acetoacetate (AcAc, C4H6O3), and 3-β-hydroxybutyrate (3HB). Acetone can be produced from two primary pathways: the decarboxylation of acetoacetate and the dehydrogenation of isopropanol. 5 When there is an excess of acetone in the bloodstream, it is removed from the body through exhalation. Individuals with diabetes exhibit higher acetone concentrations in their breath, typically ranging from 1.7 to 3.7 parts per million (ppm).6,7 In contrast, healthy individuals usually have less than 0.8 ppm of acetone in their breath. 8 In a study conducted by Deng et al., 7 gas chromatography–mass spectrometry (GC-MS) and solid-phase microextraction (SPME) were used for on-fiber derivatization to measure acetone levels in human breath. The results showed that the concentration of acetone in the breath of diabetic individuals was higher than 1.71 ppm, whereas it was lower than 0.76 ppm in healthy individuals. 7 Correspondingly, Kalidoss et al. reported that the concentration of acetone in the breath of healthy subjects ranges from 0.3 to 0.9 ppm. In contrast, individuals with diabetes exhale at a higher concentration, exceeding 1.8 ppm. 4 Bicer et al. 9 utilized cavity ring-down spectroscopy (CRDS) to detect acetone concentration in exhaled breath and found that the acetone concentration was higher than 1.8 ppm for individuals diagnosed with Type 2 Diabetes (T2D). In addition, acetone concentration is also considered a biomarker for several chronic and long-term outcomes, such as heart disease,10,11 renal disease, 12 and lung cancer. 3
The ability to detect low levels of biomarkers in exhaled breath with both high sensitivity and selectivity could facilitate non-invasive and real-time disease diagnosis using portable physiological devices, potentially enabling early detection of diseases. Several laser-based techniques exist to detect volatile organic compounds (VOCs) with high sensitivity in exhaled breath. Researchers have employed laser spectroscopy techniques such as photoacoustic spectroscopy (PAS), Raman spectroscopy, tunable diode laser absorption spectroscopy (TDLAS), laser-induced fluorescence (LIF), cavity-enhanced absorption spectroscopy (CEAS), optical frequency comb spectroscopy (OFCS), and cavity ring-down spectroscopy (CRDS) for breath VOC detection. 13
Acetone can be identified using infrared (IR) spectroscopy due to its characteristic vibrational absorption features. The carbonyl (C = O) stretching vibration produces a strong absorption band in the mid-infrared region around 1700–1750cm−1 (≈5700–5900 nm).14,15 While overtone transitions in the near-infrared (NIR) spectral region are usually very weak and cannot be detected by many conventional absorption spectral methods, the cavity ring-down spectroscopy (CRDS), offering high sensitivity and a long effective optical path length, enables the measurement of these transitions. 16
When comparing mid-infrared (MIR) to NIR systems, laser sources and detectors within the MIR range tend to incur higher costs, and the noise levels at room temperature are relatively elevated, necessitating the implementation of cooling for the detectors. In the perspective of CRDS, the achievable reflectivity of mirrors in the MIR region is typically significantly lower than that attainable in the NIR range. As a result, despite the absorption cross-sections in the NIR being approximately 100 times smaller than those in the MIR, NIR-CRDS demonstrates sufficient sensitivity for the detection of acetone in exhaled breath. The primary advantages of the NIR-CRDS approach outlined in this discussion include its relative simplicity, affordability, compact design, and commendable sensitivity and specificity. This is confirmed by our team in measurements of the absorption cross-section of acetone concerning the overtone of the C–H stretching mode within the spectral range of 1671.5–1675 nm. 17 In this work, an empirical fit with six coefficients was utilized to fit the experimental data. Additionally, the capability of the continuous wave cavity ring-down spectroscopy (CW-CRDS) technique, using a high-finesse cavity in the NIR spectral region, was utilized to detect acetone concentration in exhaled breath samples collected from two distinct population locations.
Materials and Methods
Theoretical Background of CW Cavity-Ring Down Spectroscopy
Absorption Coefficient and Concentration Retrieval with CRDS
Direct absorption spectroscopy is a straightforward technique for analyzing sample species based on their absorption spectrum, following Beer–Lambert law. This law describes how laser light intensity decreases as it passes through a sample, where the transmitted intensity (

CRDS requires a stable cavity with highly reflective mirrors. In an empty resonator, light intensity decreases exponentially due to losses from mirror transmission and diffraction. The number of round-trips in a time interval t is

The ring-down time (decay time constant) corresponds to the condition


When a gas sample, such as exhaled breath, is introduced, it absorbs some of the light at the laser wavelength, adding to the total loss in the cavity. The transmitted intensity and the ring-down time change in the presence of an absorbing species, allowing for the evaluation of the absorption coefficient. When the gaseous sample is introduced into the cavity, the ring-down time changes:


We note that
Retrieval of Gas Component Concentrations and Fitting Absorption Data
Bounds et al. 17 introduced an empirical model for the absorption characteristics of low-concentration acetone gas within the wavelength range of 1671.5 to 1675 nm, which includes the methyl stretch overtone absorption band. This model has been experimentally validated through CRDS measurements using a calibration gas and its diluted mixtures with breath samples.
To determine the concentrations of individual species within a gas mixture, the experimentally measured absorption coefficients at various wavelengths are compared to the simulated combined total absorption α(λ) at a wavelength λ:

Here,


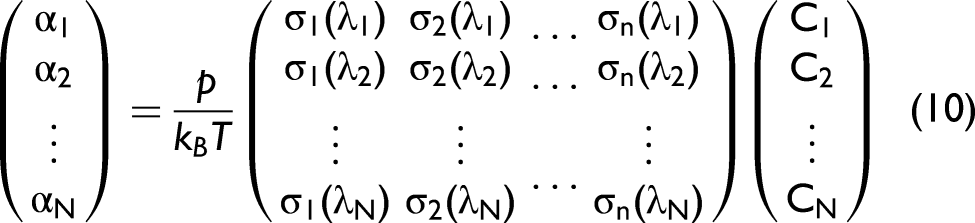
If the N by n matrix in Eq. 10 is denoted by A, then the least squares solution to the above over-determined system is
22
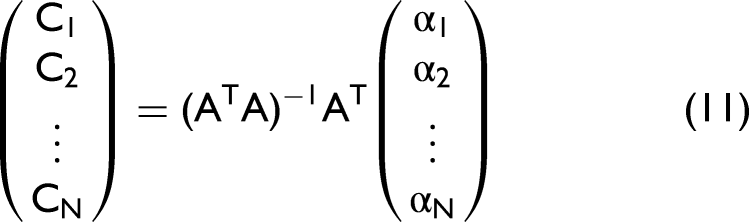
This approach is best suited for fitting absorption data which is homoscedastic that is the variance of the absorption coefficient is not changing with absorption magnitude. The variance of the ring-down time
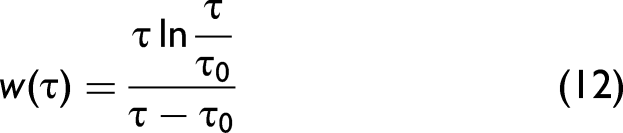
The weight function is applied by multiplying each row of Eq. 10 by the weight function evaluated at the corresponding measured ring-down time, and this new system is solved using the same explicit expression Eq. 11. To account for additional optical losses (e.g., scattering from particulates), artificial absorption cross-sections
The deviation of the concentration values produced by Eq. 11 can be estimated using the law of error propagation on the independent absorption inputs. Let us define the matrix appearing in Eq. 11 as
Retroactive Determination of Laser Detuning
Accurate quantification of gas concentrations from optical absorption measurements critically depends on precise knowledge of the laser wavelength at each data point. During the scan, the laser wavelength is changed by either altering the temperature through the integrated thermoelectric cooler or the diode injection current. In general, the relation of the distributed feedback diode (DFB) laser wavelength to the temperature and current is complicated and includes hysteresis effects. However, it was found that when temperature and current are scanned in a consistent manner, the laser wavelength was predictable and well described by a quadratic model of the temperature and current:
23

The validity of this quadratic model used to describe laser wavelength dependence on current and temperature is illustrated in Figure S4 (Supplemental Material). The right panel of Figure S4 shows the residuals after applying the quadratic model described by Eq. 14, with the remaining deviations significantly reduced. The residual error is consistently below 0.004 nm across most of the tuning range, demonstrating the accuracy and suitability of the quadratic model for predicting the laser detuning.
Suppose the laser current and temperature are recorded in place of the wavelength. In that case, it becomes possible to extract the wavelength information from the spectrum itself, assuming that in the spectral region the cross-sections are well defined. This is done by choosing the

For each evaluation of the optimization function on a given
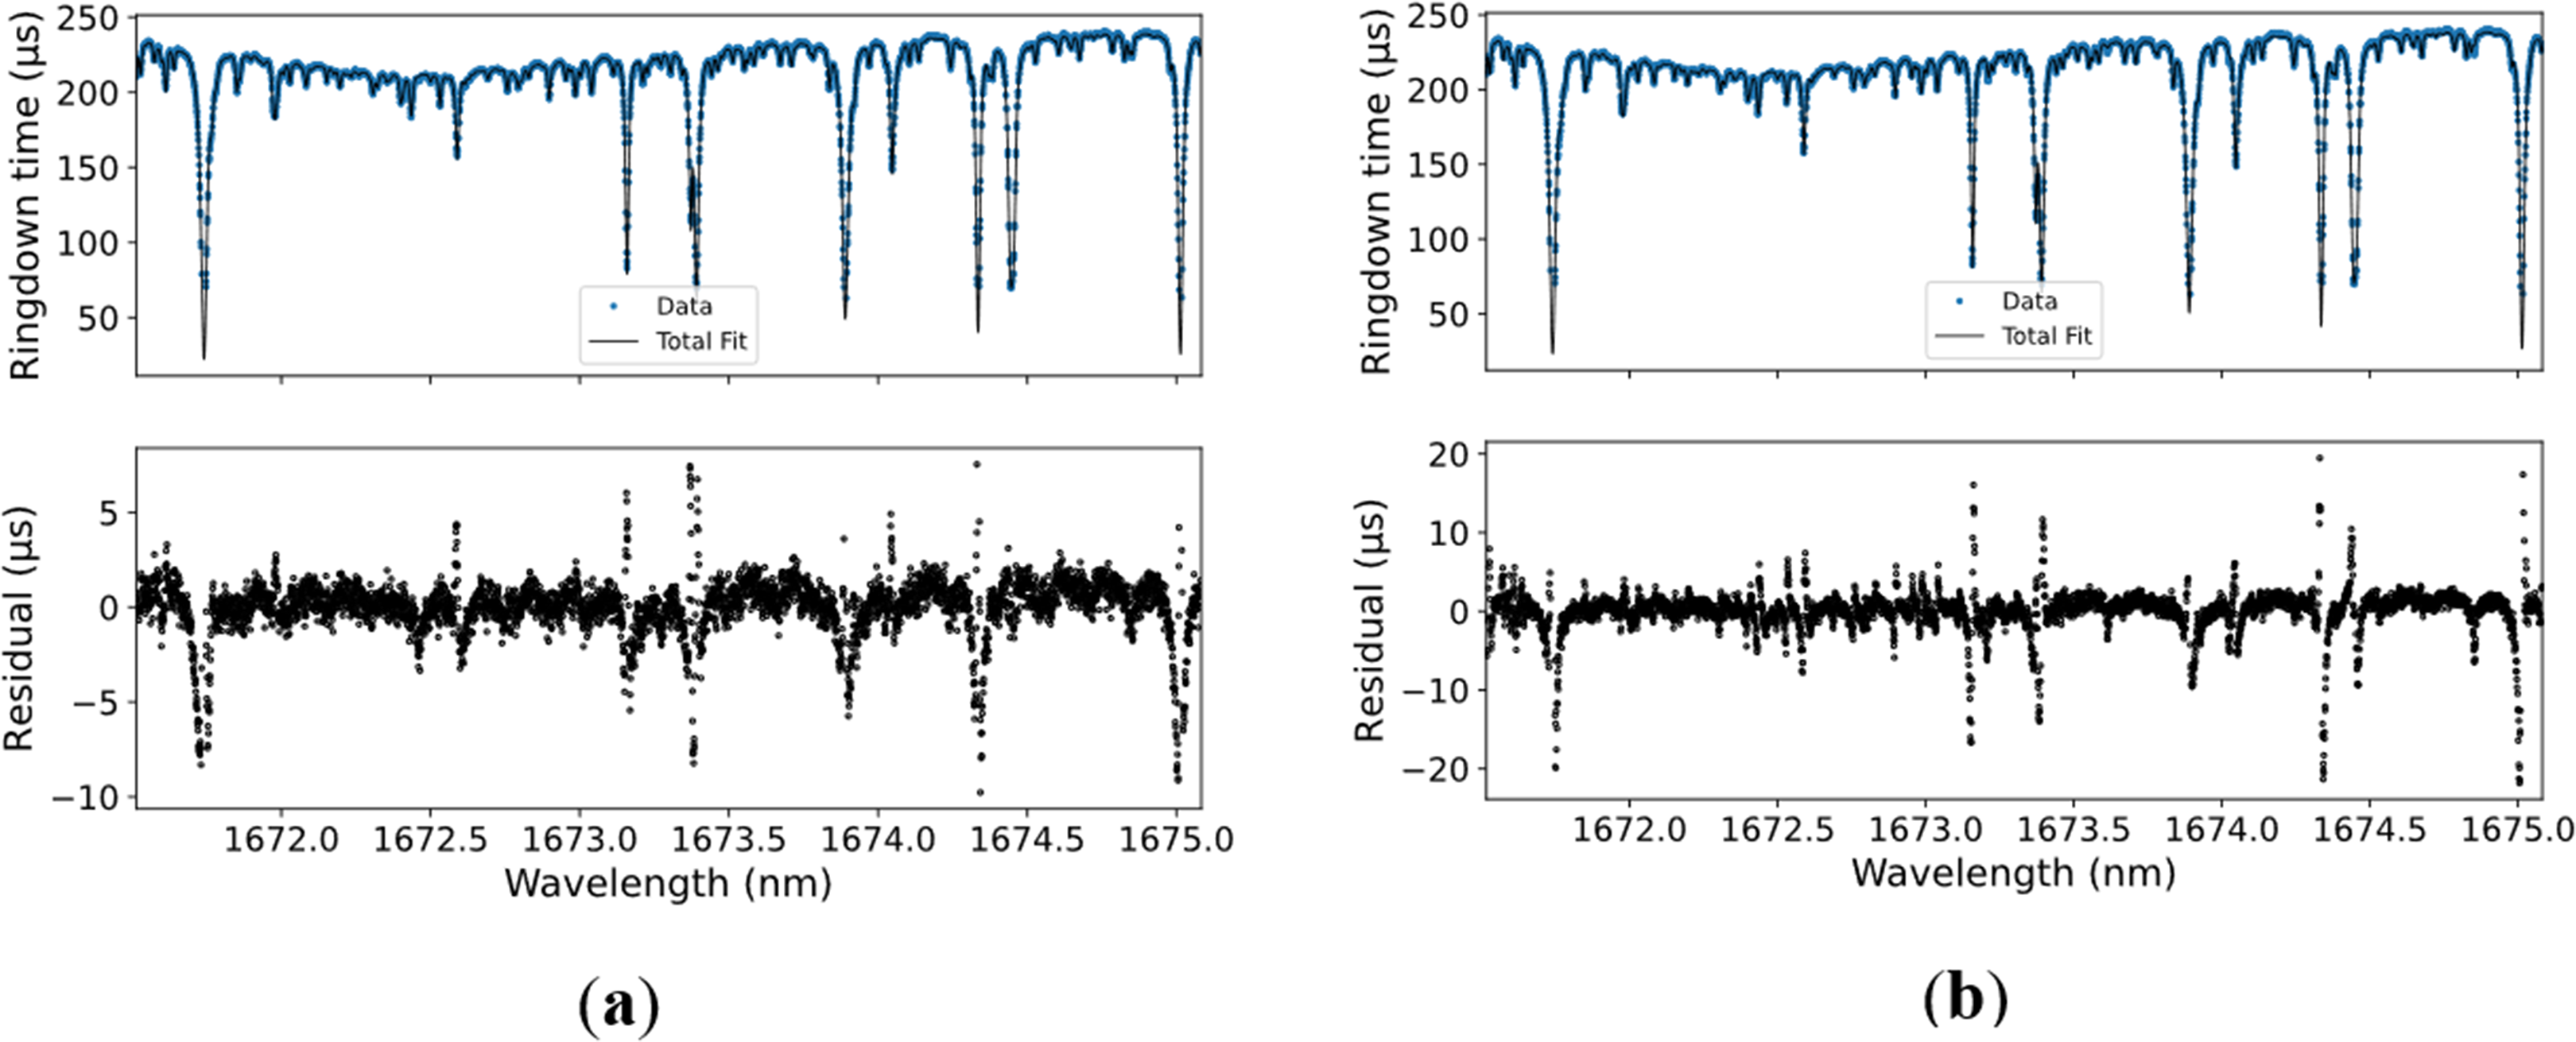
Comparison of directly measuring wavelength (a) and the detuning retrieval method (b) on the fitted spectrum. In the upper portion of both panes, the ring-down time data is shown alongside the fitted spectrum, which has been converted into a simulated instrument response. In the lower row, the difference between the fit curve and the measured ring-down time is shown as the residual. Despite small detuning, the concentrations of the individual species are not noticeably affected.
The comparison of the two fits of a human exhaled breath.

Experimental
Materials and Methods
The experimental setup was as described in Bicer et al., 9 Bounds et al., 17 and Aluauee, 23 and is shown in Figure 2. The optical cavity consisted of an aluminum chamber measuring 192 cm in length, featuring anti-reflective-coated windows to minimize reflection losses. Two high-reflectivity cavity mirrors were placed 172 cm apart. The input mirror was flat, while the output mirror was curved with a 2 m radius of curvature, both with a high reflectivity of around 0.999987. The high-reflectivity cavity mirrors ensured a long ring-down time of up to 441 µs in the evacuated cavity. A piezoelectric transducer was attached to the concave mirror, modulating the cavity length and, thus, the mode frequencies, allowing the cavity resonance always to be obtained within the length scan. The laser source, a distributed feedback (DFB) diode laser (NEL Corporation) with an output power in the near-infrared region of ∼ 4 mW and wavelength ∼1672 nm at a laser current of ∼90 mA (an Eblana Photonics EP1673-7-DM-B01-FM 14-pin butterfly package), was employed to detect acetone concentration in exhaled human breath. The output from the fiber-pigtailed laser was directed through a fiber-coupled isolator (ISO) and subsequently collimated using an optical fiber collimator (OFC) assembly. A rapid acousto-optical modulator (AOM) was essential for utilizing this CW laser source.17,24 The first-order diffraction output of the AOM was used in the ring-down experiment, as it enabled fast optical switching to shut off the laser when a resonance event was detected. When the laser frequency was matched with the resonance frequency of the cavity mode, a high intensity build up in the cavity. Subsequently, turning off the RF power on the AOM shut off the laser light output in the first order, producing a decaying signal on the photodiode while the laser radiation bounced back and forth inside the cavity.
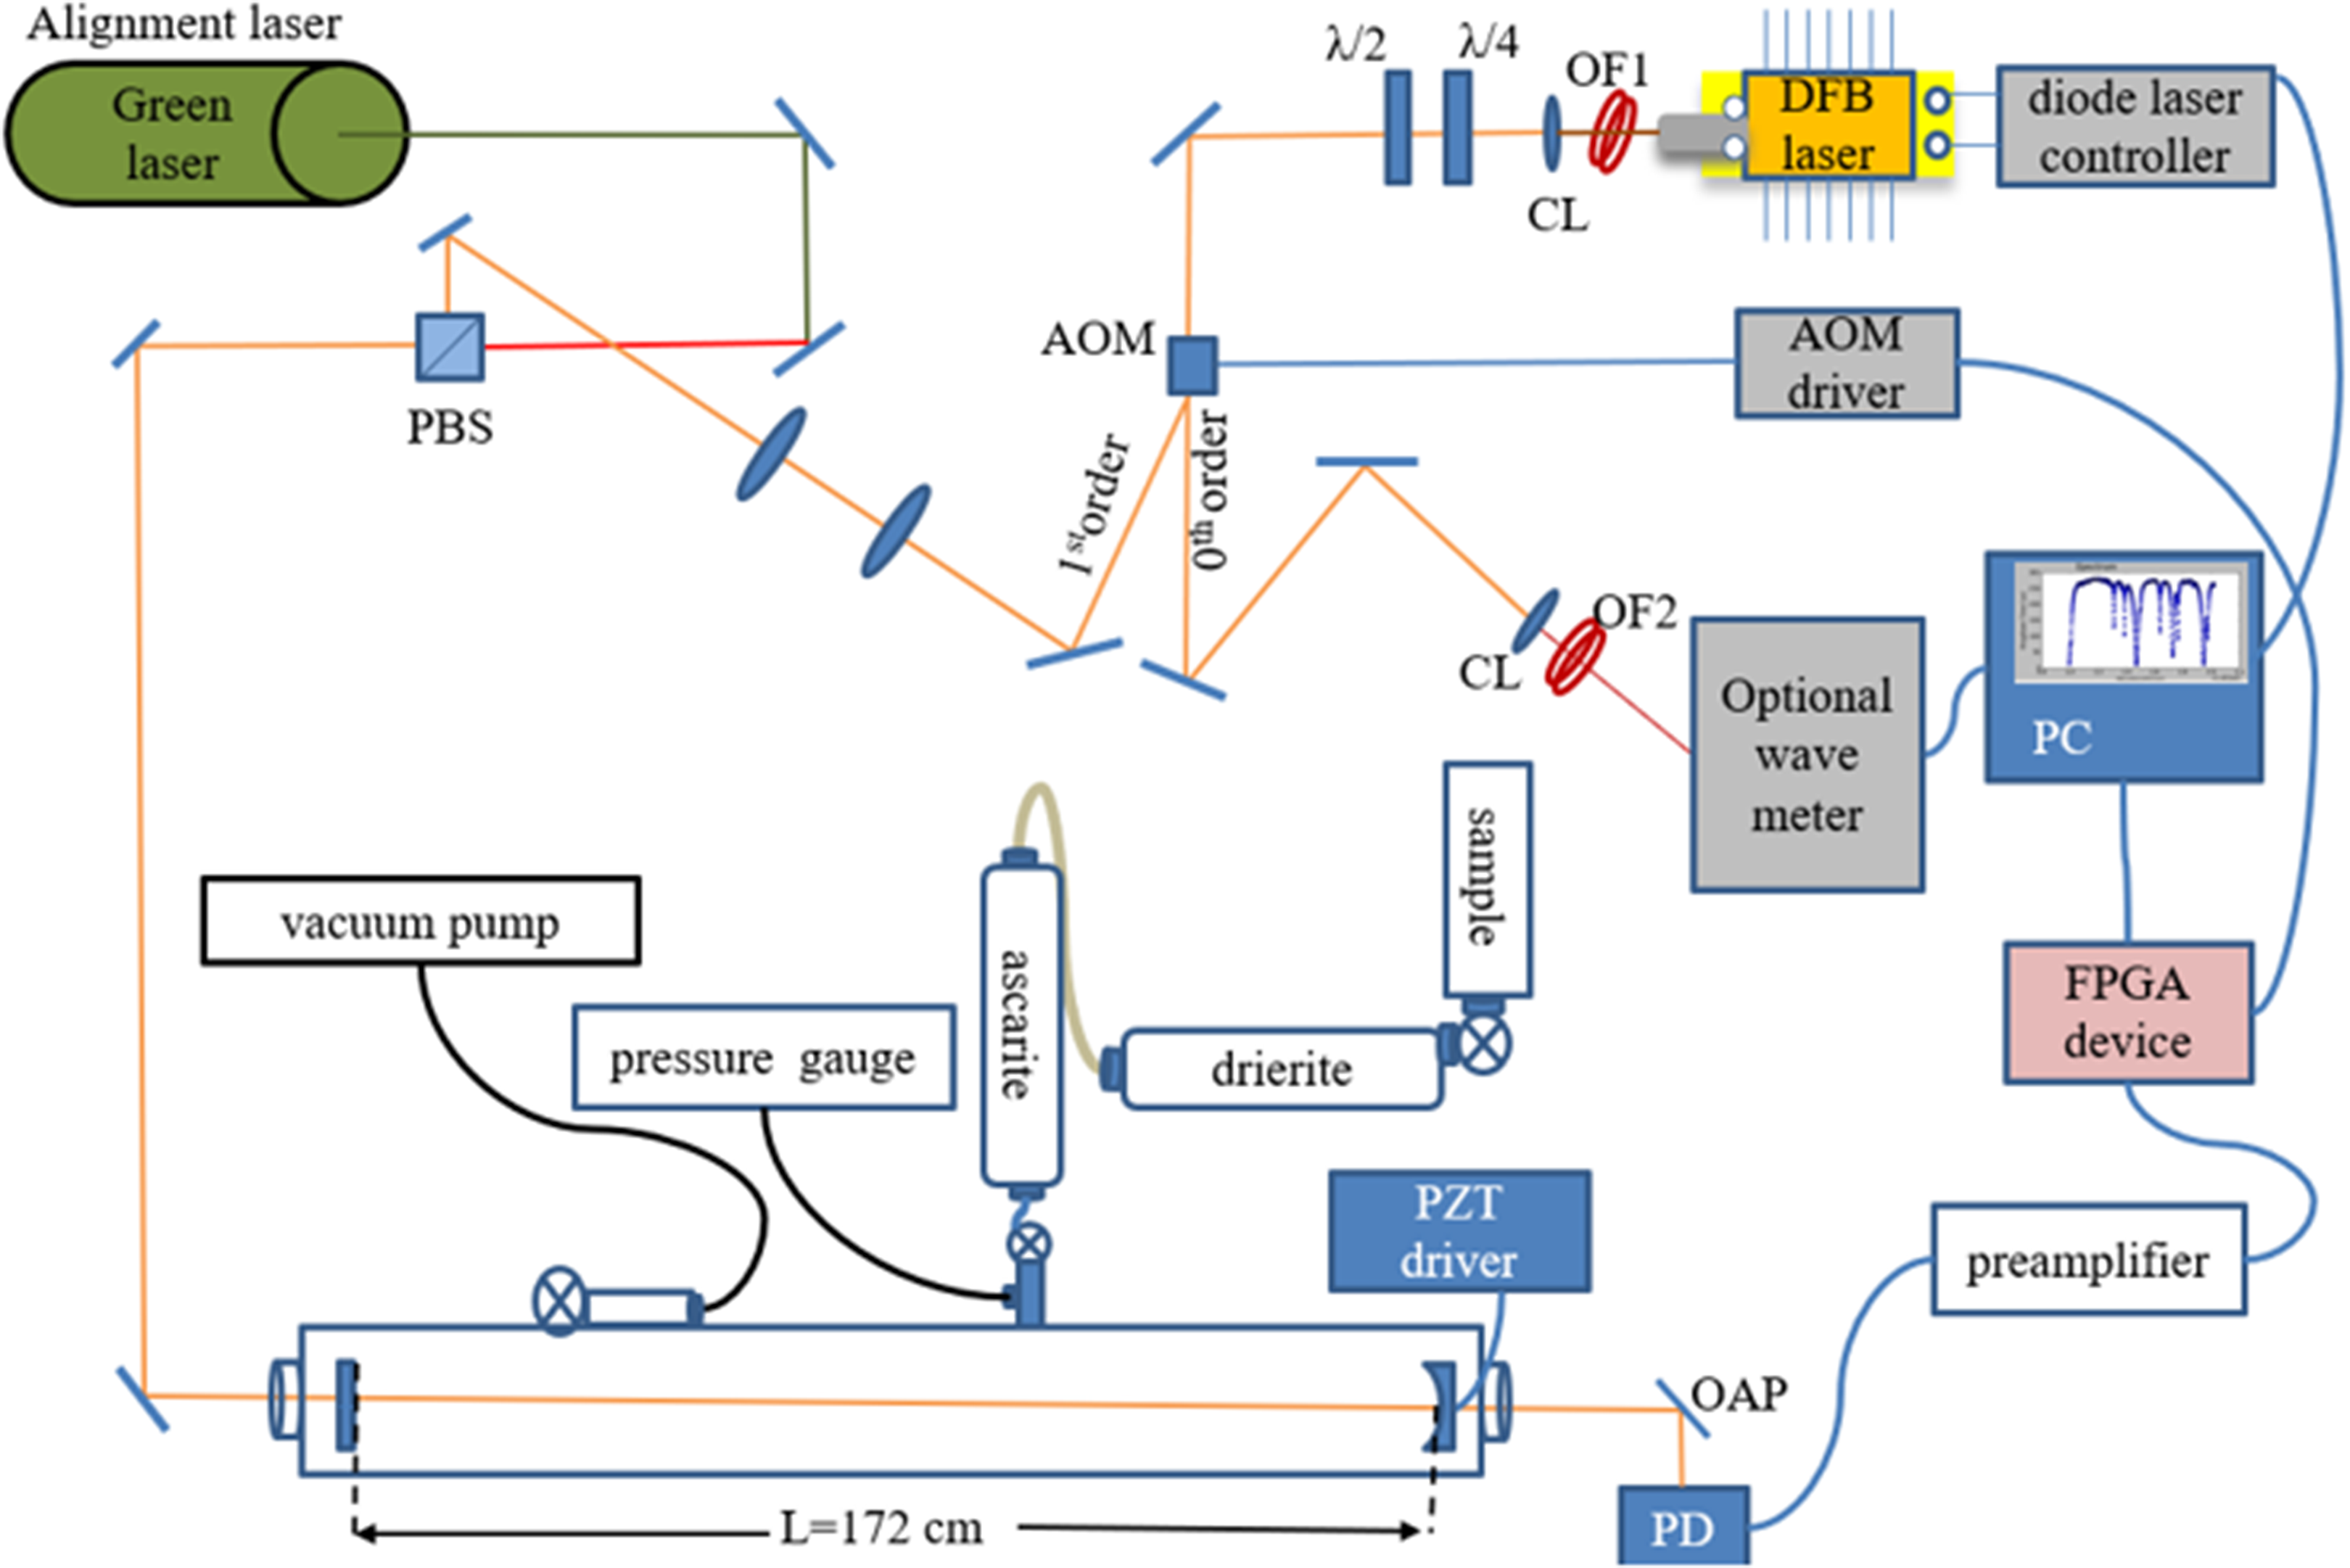
Schematic diagram of the experimental setup. The first-order diffraction of the laser beam is directed to the optical cavity, while the 0th order beam is used for monitoring the wavelength. A green laser was used to align the system. OFC1 and OFC2 are optical fiber collimators, CL1 is a collimating lens, CL2 is a coupling lens, OAPM is an off-axis parabolic mirror, and PZT driver actuates a piezoelectric transducer to scan the cavity length. Reproduced from Reference 23.
The acquisition system utilized a single-board computer equipped with an integrated analog-to-digital converter (ADC) and field-programmable gate array (FPGA). The FPGA generated a low-latency switching signal to the AOM driver, which shut off the laser output in the 1st diffraction order upon detection of a certain intensity buildup level at the cavity resonance. The ring-down signal was pre-amplified, filtered, and digitized at 125 MHz, then down-sampled with additional digital filtering to suppress noise. The processed signal was stored and analyzed using an optimized multi-coefficient fitting algorithm, as was described. 17
Different regimes of fast data acquisition were implemented using a custom Python program that controlled a computer-based data-acquisition system for experimental data collection and analysis. The user could adjust temperature and current settings and record the data for each wavelength. Additionally, certain parameters could be changed from the panel, including the number of ring-down events for averaging at a fixed wavelength and the number of points in the spectrum. Once the measurement was completed, the data were saved automatically.
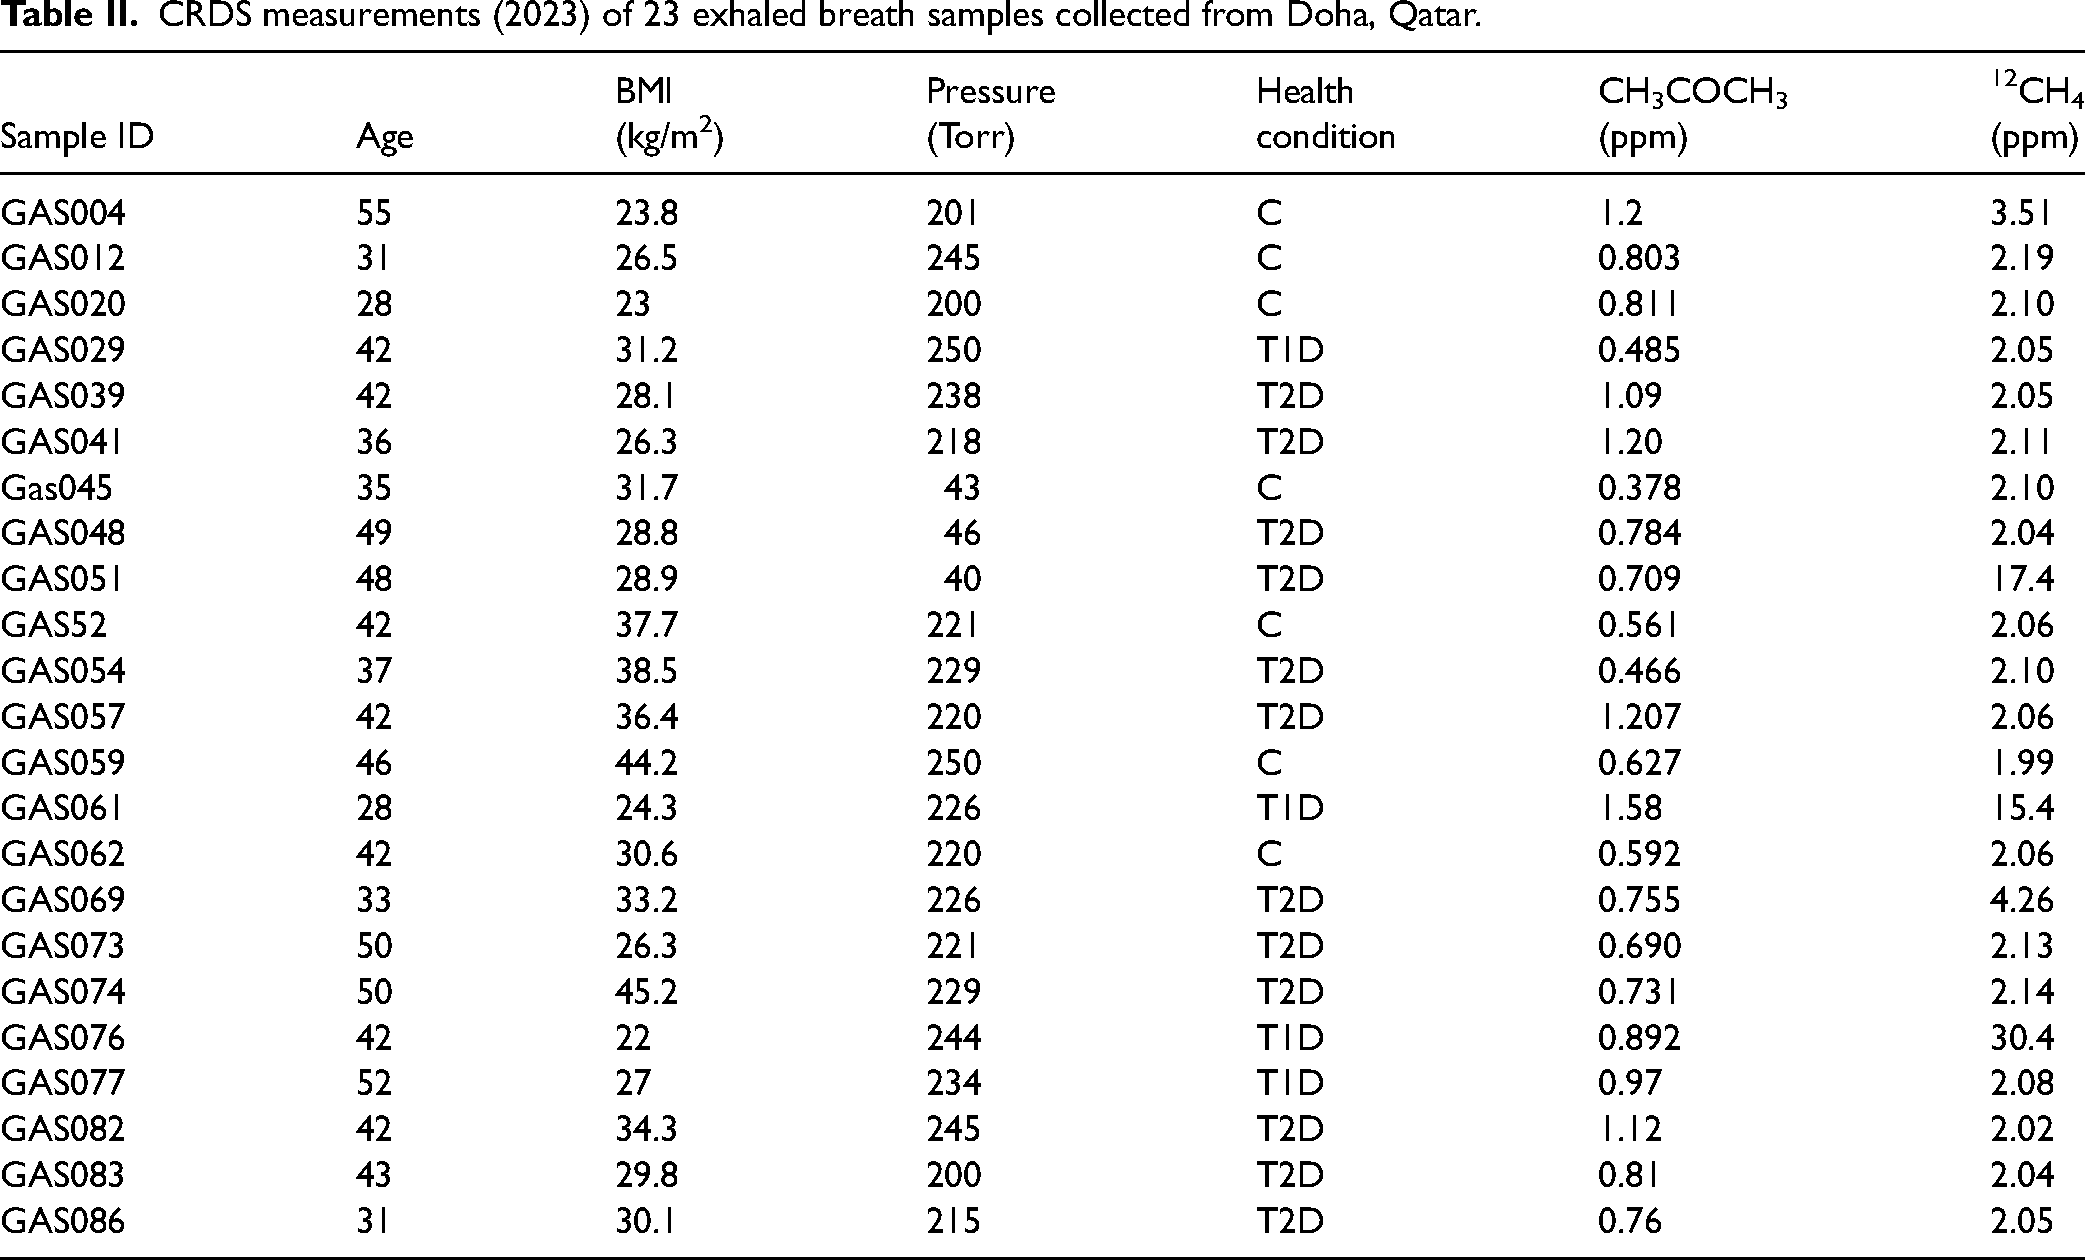
The CRDS measurements of exhaled breath samples were conducted on two distinct sample sets. The first set of samples was collected from participants in Qatar, in partnership with Weill Cornell Medicine Qatar, and the biomarkers were subsequently measured using the CRDS setup described above. The second set comprised individuals from the College Station, Texas, area who volunteered for the study. Table II illustrates the measurements of 23 individuals from Qatar. Each of 23 participants filled five specialized breath collection bags, which were used to fill the CRDS chamber with a sample gas to approximately 200 Torr. For three participants, a single breath bag was filled, resulting in a chamber pressure of approximately 40 Torr. The absorption spectrum spanned a range of 1671.5–1675.0 nm. At each wavelength, 70 RDT acquisitions were performed and averaged. The total time for scanning each absorption spectrum was approximately 1 hour and 30 minutes. The extended scanning time in this pilot study was necessary to cover the full spectral region at high resolution to accurately account for all contributions to the resulting spectra. Approximately 1300 spectral data points were collected to accurately reconstruct the absorption spectrum and ensure reliable spectral fitting and concentration retrieval. This dense sampling enhanced measurement precision. For practical sensing applications, optimizing the number of spectral points (which can be significantly reduced) and the scanning strategy, such as scanning the most informative spectral interval, can significantly reduce acquisition time.
CRDS measurements (2023) of 23 exhaled breath samples collected from Doha, Qatar.
Demographic information, including gender, age, body mass index (BMI), the presence of Type 1 or Type 2 Diabetes (T1D/T2D), and related complications, was recorded for 19 participants from College Station, Texas. A total of 60 exhaled breath samples were collected and measured using the CRDS apparatus. The sampling procedure, which consisted of two distinct steps, was thoroughly explained and demonstrated to participants before sample collection. Each subject inhaled deeply twice before sample collection. Subjects inhaled deeply and held their breath for a duration of 5 seconds, after which they exhaled into a balloon. Measurements were conducted at three different fasting intervals for each participant, i.e., after 12 hours of fasting, 2 hours post-lunch, and 2 hours post-dinner. The entire process of filling the bag with exhaled breath required less than 5 minutes. The study comprised 19 participants, including 11 males and 8 females with varying health conditions. Nine subjects had been diagnosed with diabetes, while ten were classified as healthy individuals.
Results and Discussion
Sensitivity of CRDS to Detect Acetone Concentration at 1672 nm
The present work employed the Allan variance analysis to determine the detection limit of acetone. The Allan variance was initially introduced for its utility in assessing the stability of atomic frequency standards.
25
However, it is also applicable in characterizing the stability of instruments across various fields. Theoretically, the Allan variance represents the mean-squared fluctuations observed when averaging samples of different lengths. The minimum location on the Allan plot indicates the optimal averaging time, while its value indicates the minimum variance achievable through data averaging. For mathematical formulation, assume that a set of N time series data points is recorded over a time period 
Assume that the set of N data points can be subdivided into (m) sub-groups, each containing a set of (p) data points, where m is the largest integer less than or equal to N/p, and also that the N data series can be divided into sub-groups:
Each of these sub-groups can be characterized by the average
The next step is to calculate the squares of differences between successive subgroup averages:
Finally, the Allan variance is determined using the formula
26

The Allan deviation (
The findings derived from the Allan plot analysis offer insights into the sensitivity of the detection system employed in this study. A standard ring-down baseline scan of the evacuated cavity was conducted to evaluate baseline stability. Each data point was obtained by averaging 80 ring-down traces, resulting in an average decay time (τ0) of 417 μs for the evacuated chamber, with a baseline stability measure, (Δτ/τ0) of 3%. The acetone absorption cross-section at atmospheric pressure, room temperature, and a wavelength of 1672.44 nm is 1.22 × 10⁻²¹ cm2 /molecule. 16 The location of the minimum on the Allan plot indicates the optimal averaging time of 1000 samples, while its value indicates the minimum Allan deviation 1.2 × 10⁻¹⁰ cm–1 achievable through data averaging and an estimated fractional detection limit for concentration of about 10 parts per billion (ppb) as shown in Figure 3b.
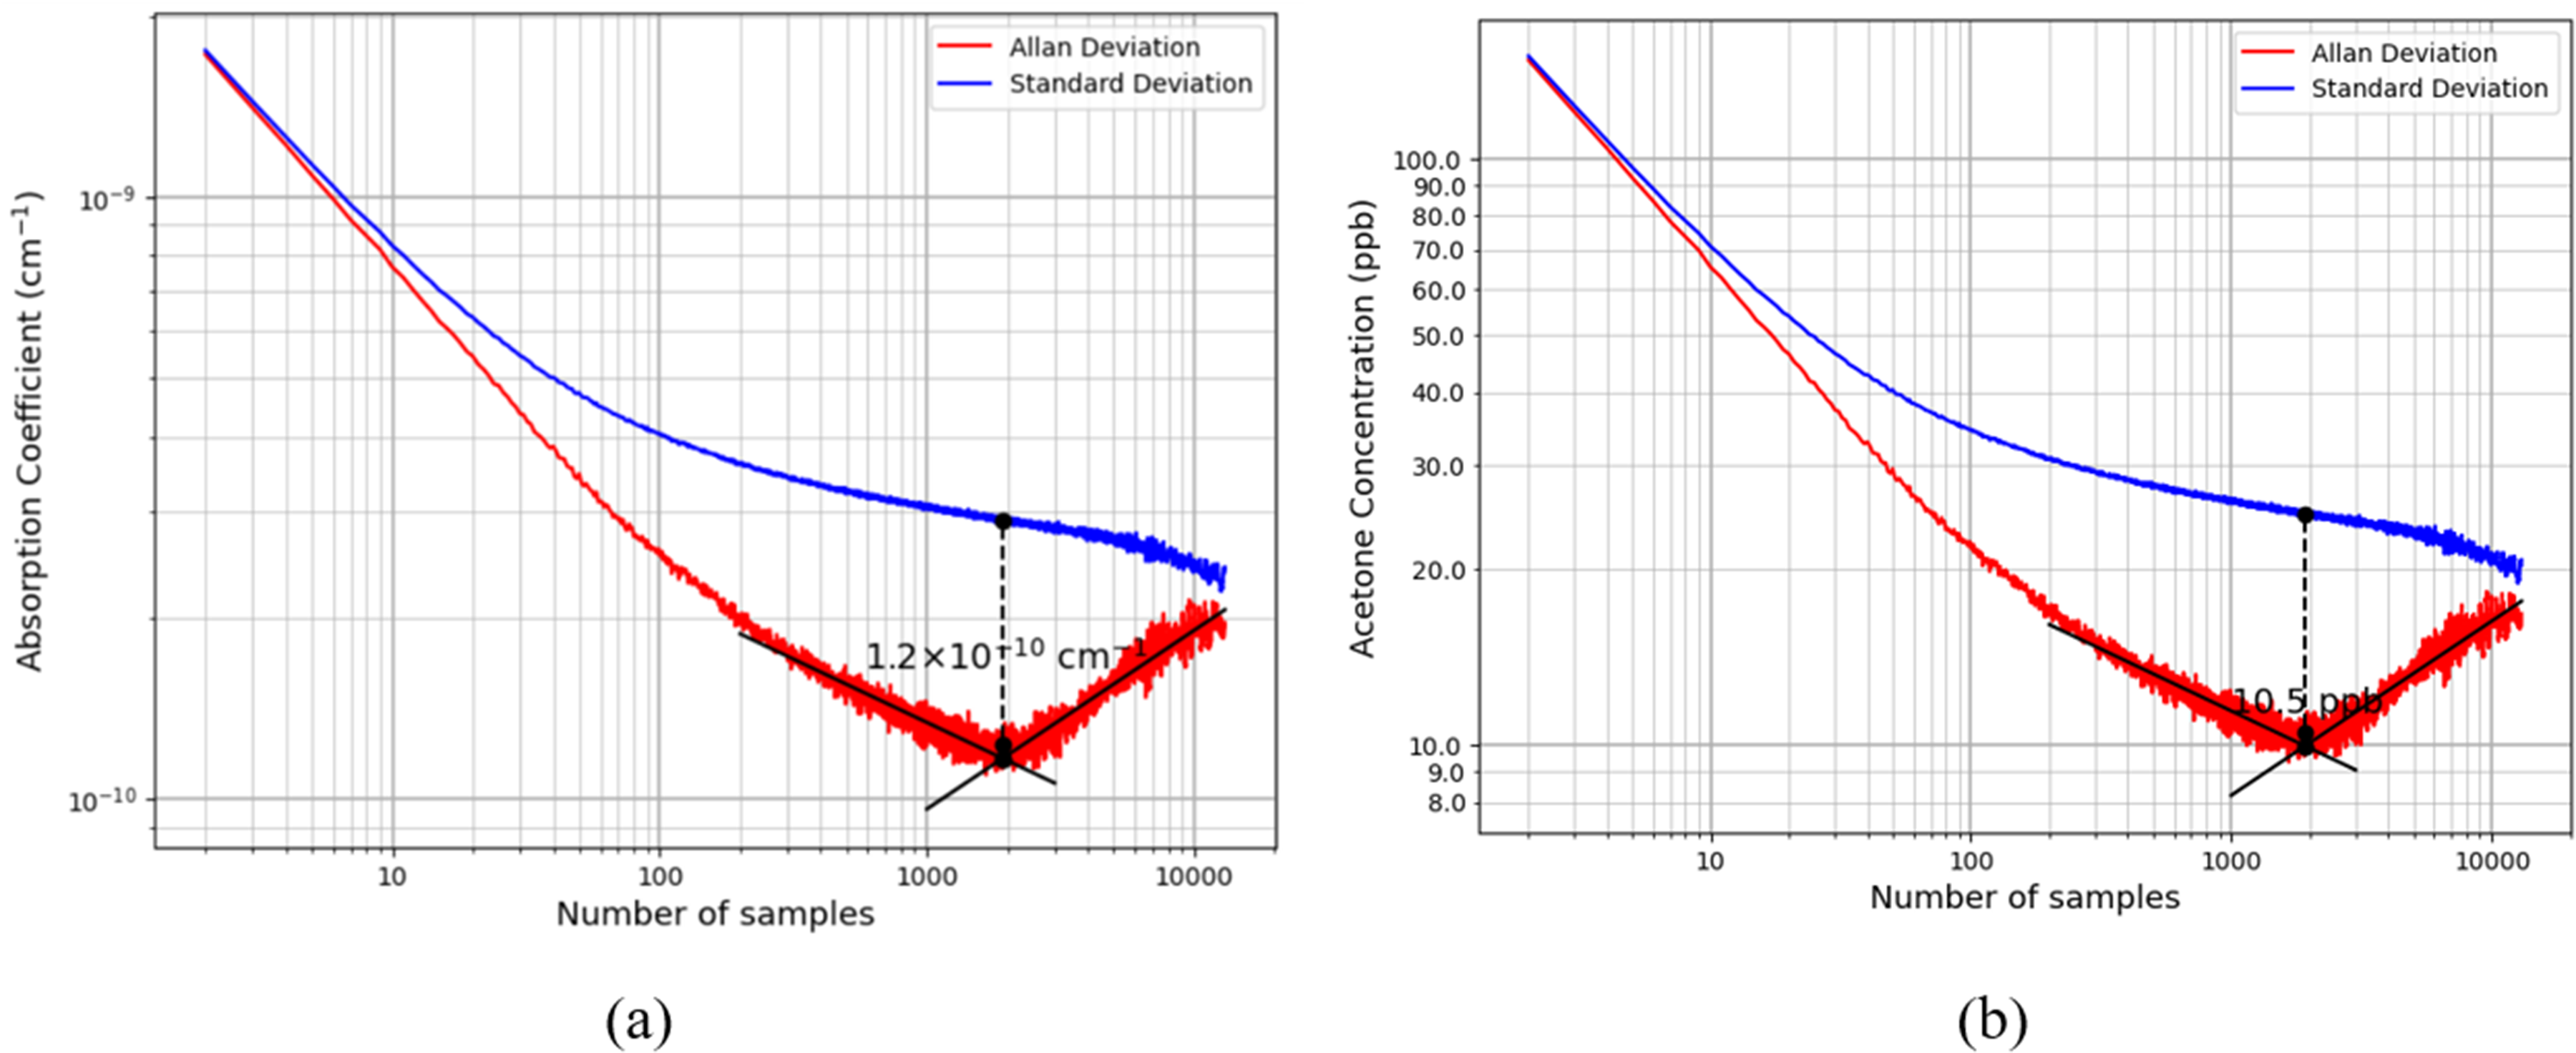
The standard deviation and Allan deviation plots for measurements of acetone values calculated from the sequential ring-down using DFB laser at 1672 nm, (a) Allan deviation recorded with evacuated cavity showing the detection limit for the absorption coefficient of 1.2 × 10⁻¹⁰ cm–1. (b) Allan deviation with the minimum detection limit for the concentration of ≈10 ppb.
Quantitative Analysis of Gas Samples from Doha, Qatar
The results for three categories of individuals are presented in the Table II, (i) four subjects with Type 1 Diabetes (T1D), (ii) seven subjects are healthy controls (C), and (iii) twelve subjects with Type 2 Diabetes (T2D). The ranges of measured acetone concentrations for these three categories were as follows: (i) for control subjects (0.378–1.12) ppm, (ii) for T1D individuals (0.485–1.56) ppm, and (iii) for T2D subjects (0.466–1.2) ppm.
In these samples within the same wavelength interval near 1672 nm, methane concentrations were also measured. Methane is considered a biomarker for bowel disease, digestive disorders, and bacterial overgrowth.27–29 Figure S1 (Supplemental Material) shows the measured breath acetone concentration (ppm) on the y-axis versus methane (12CH4) concentration (ppm) on the x-axis for 23 individuals. Most participants had methane concentrations clustered in the low range (2–5 ppm), with a wide spread of acetone levels (0.3–1.2 ppm), as shown clearly in Figure S1b. However, three subjects were identified, (i) sample GAS051, a T2D subject; (ii) sample GAS061, a T1D subject; and (iii) sample GAS076, a T1D subject, all of whom exhibited methane concentrations above 10 ppm. These elevated methane values are accompanied by different acetone concentrations, indicating possible variability in metabolic and gastrointestinal factors between individuals. Measuring both biomarkers enables the assessment of systemic metabolic status in conjunction with gut microbial activity. Acetone is a biomarker for fat metabolism and is often elevated during hyperglycemia, fasting, or ketosis. In contrast, 12CH4 is primarily produced by gut microbiota and is linked to intestinal motility and carbohydrate fermentation. Elevated methane in exhaled breath is indicative of digestive problems or bacterial infection. 30 A combined analysis provides greater diagnostic specificity than either biomarker alone. The three individuals with high methane levels in their exhaled breath, i.e., GAS051, GAS061, and GAS076, suggest a possibility of a distinct physiological subgroup that may require further analysis.
Correlation of Acetone Concentration and Blood Glucose Level
The quantitative data regarding acetone concentrations in the human breath of individuals with diabetes remain insufficient. Moreover, the relationships between breath acetone levels and important diabetic diagnostic parameters, specifically blood glucose (BG) and glycated hemoglobin (HbA1c), have yet to be elucidated. 31 Different types of correlations, unambiguously positive, negative, or a lack thereof, have been identified across various studies involving individuals under distinct experimental conditions. For instance, Szabo et al. 32 reported a negative correlation between acetone concentration and glucose levels, determined through the use of a commercial acetone gas sensor in a cohort of five individuals with Type 1 Diabetes. Conversely, Turner et al. 33 found a positive correlation between breath acetone concentration and blood glucose levels in eight participants with Type 1 Diabetes during episodes of induced hypoglycemia. Furthermore, Wang et al. 31 established a linear correlation between mean group acetone levels and mean group blood glucose levels in a study involving 34 subjects with Type 1 Diabetes, utilizing a ringdown breath acetone analyzer for measurement.
In the current study, glucose levels were recorded for participants classified as having T1D, T2D, and C, as shown in Table III. Figure S2 (Supplemental Material) illustrates the relationship between blood glucose levels (mg/dl) and acetone concentrations (ppm) in human breath. The measurements performed in 2023 using CRDS at 1672 nm for 23 individuals are shown in Figure S2. This figure reveals a broader spread of acetone concentrations across all blood glucose levels, with some control and T2D individuals exhibiting intermediate acetone levels (0.5–1.0 ppm). This increasing variation may indicate subtle metabolic differences (samples from different bags) or environmental influences at the time of measurement (i.e., the lifetime of storage bags). Possible explanations include differences in diet (e.g., higher fat consumption), climate (which can influence metabolism and hydration), or pre-test fasting duration. Additionally, variations in instrument calibration, mirror reflectivity, or detection limits between the measurement systems could contribute to this shift. In results, T1D subjects consistently exhibit higher acetone concentrations compared to T2D and control groups, especially at elevated blood glucose levels (>150 mg/dl). This aligns with the known pathophysiology of T1D, where insufficient insulin activity triggers increased fat metabolism and ketone production, resulting in elevated breath acetone levels. 34 Control subjects generally maintain low glucose levels (<120 mg/dl) and low acetone concentrations (<0.8 ppm).
The measurements of acetone concentration and glucose level for 23 individuals.
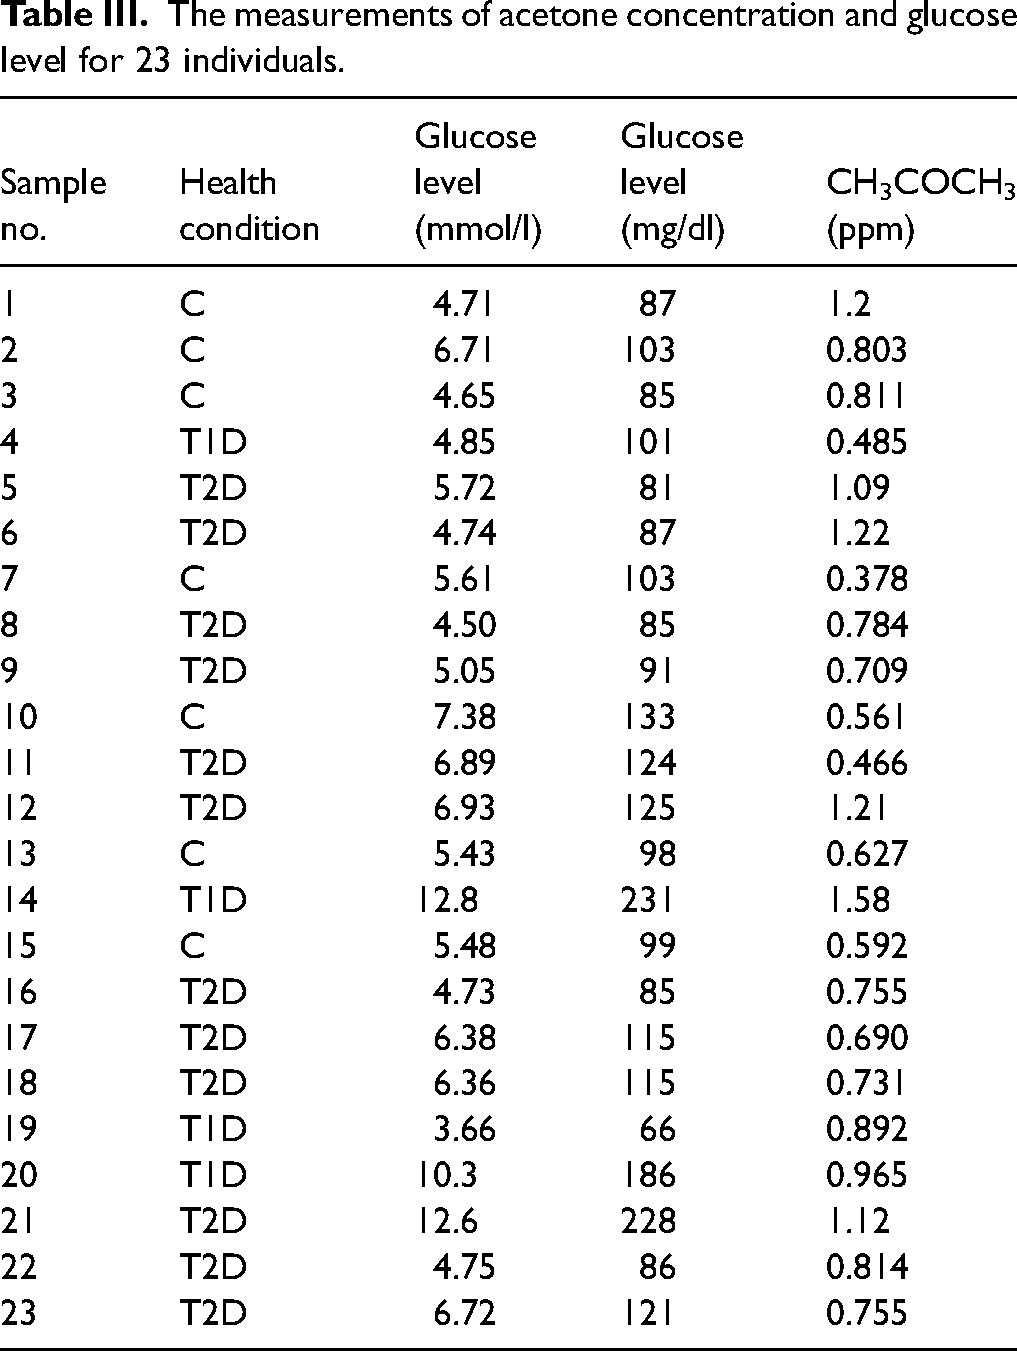
Pearson’s correlation coefficient (r) was used to evaluate the relationship between glucose and acetone concentrations. For the 23 datasets, a moderate positive correlation was observed (r = 0.42, n = 23, p = 0.045). Subgroup analysis revealed a moderate negative correlation in controls (r = −0.53, n = 7, p = 0.22), a strong positive correlation in T1D (r = 0.78, n = 4, p = 0.22), and a weak positive correlation in T2D (r = 0.17, n = 11, p = 0.61). Only the overall correlation reached statistical significance, while subgroup correlations did not, likely due to limited sample sizes.
Results of Measurements of Exhaled Breath for Subjects from College Station, Texas
The results of 19 subjects from College Station reveal that acetone concentrations in non-diabetic individuals ranged from 0.014 to 0.812 ppm. In comparison, individuals with Type 2 Diabetes exhibited acetone concentrations between 0.232 and 1.04 ppm, while those with Type 1 Diabetes demonstrated levels ranging from 0.383 to 3.79 ppm.
Figure S3 (Supplemental Material) illustrates the correlation between acetone and methane concentrations, based on data collected from 19 participants and 60 measurements across multiple days under varying dietary conditions. Each color in the scatter plot corresponds to a subject participant. For instance, the red markers indicate the data for subject 15, whose sample ID (EM, breath sample-T1D) comprises four measurements taken under different dietary conditions. Likewise, the orange dots correspond to 15 measurements from Subject 1 (E-breath sample), which was identified as a control and a methane emitter with concentrations greater than 10 ppm. These findings underscore the potential disparities in acetone concentrations between individuals with and without diabetes, which may have significant implications for the diagnosis and management of the condition. Further research is warranted to investigate the underlying mechanisms and clinical implications associated with these differences in acetone concentrations.
Comparison of the Results Between Non-Diabetic and Diabetic Individuals
A comparative analysis of breath volatile organic compounds (VOCs) between non-diabetic and diabetic individuals was conducted to elucidate metabolic differences by disease state. Figure 4a presents the absorption spectra of a healthy 24-year-old subject (BMI = 24.9 kg/m2) measured at 250 Torr, two hours post-lunch. From the measured breath spectrum (black line), the concentrations of the individual species were retrieved with Eq. 11 after the laser wavelength detuning parameters had been recovered by the minimization of nonlinear Eq. 14. The cross-section of acetone was computed from the empirical model of Bounds et al. 17 and the contributions from the other molecular species, including 12CH4, H2O, 12CO2, and CH3COCH3 were computed using parameters in the HITRAN database. The concentration of 12CH4 was determined to be 1.94 ppm, while the acetone CH3COCH3 concentration was 0.779 ppm. Notably, the absorption contributions from water vapor and carbon dioxide were significantly larger in magnitude than the contribution from acetone. Despite overlapping absorption features, the concentrations of acetone and these other species were accurately retrieved.
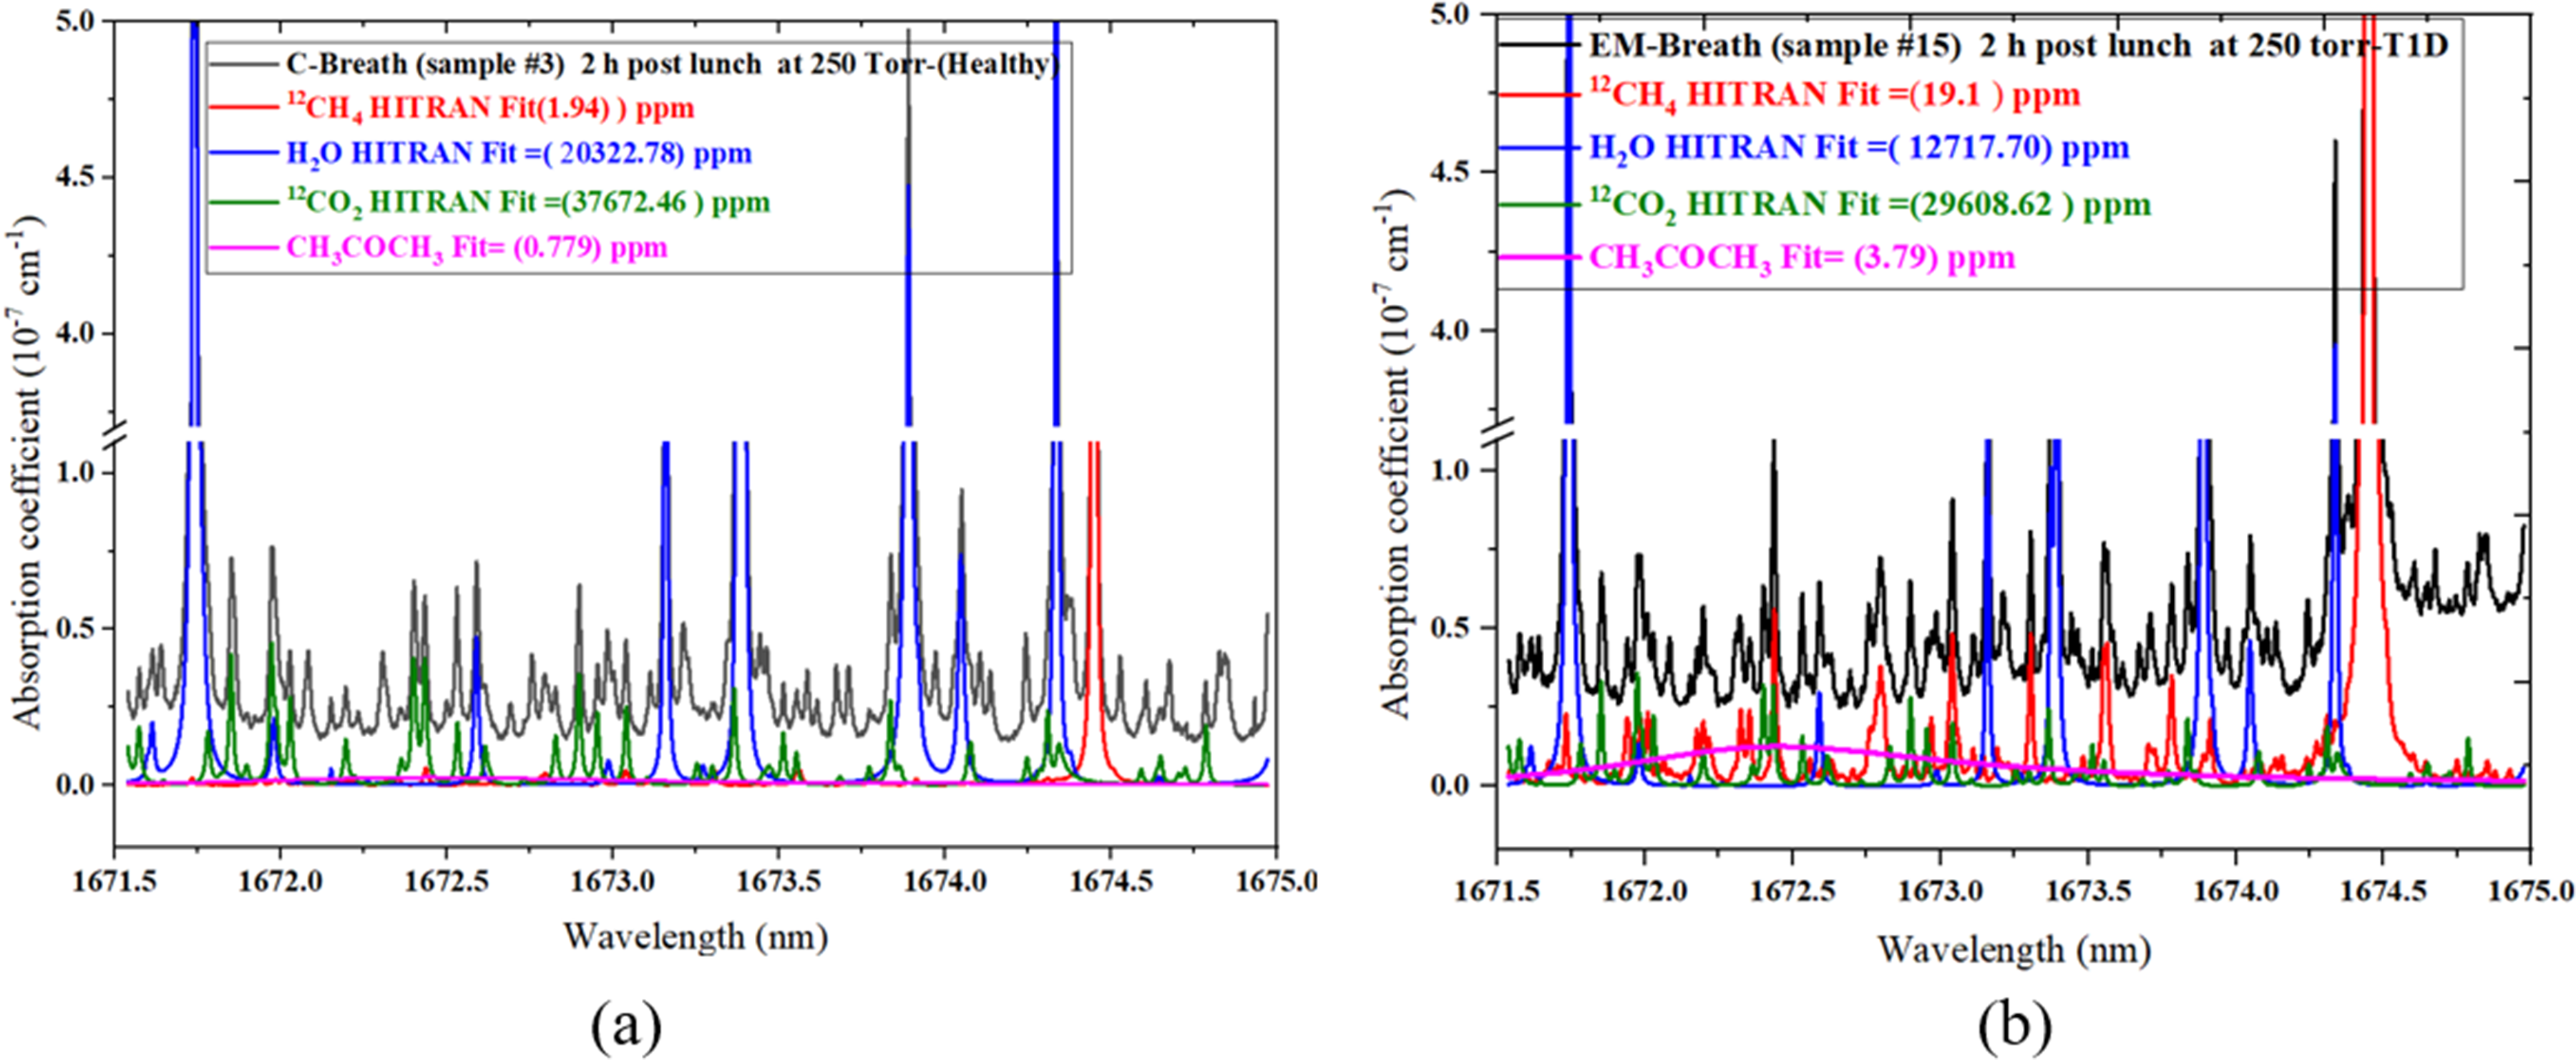
Absorption spectra: (a) of a healthy 24-year-old individual (C-Breath) and (b) of a 43-year-old individual with a T1D (EM-Breath), showing the acetone concentration of 3.79 ppm. The data fit using the linear decomposition Eq. 11 after the laser detuning parameters were retrieved by nonlinear minimization of Eq. 14. The cross-sections of 12CH4, 12CO2, and H2O are computed using parameters in the HITRAN database, and the cross-section of CH3COCH3 is computed with the empirical Eq. 17.
In contrast, Figure 4b illustrates the breath spectrum of a 43-year-old individual diagnosed with Type 1 Diabetes (T1D; BMI = 31.8 kg/m2). This subject displayed a markedly elevated acetone concentration of 3.79 ppm, approximately five times higher than that observed in the healthy subject. Such an increase is consistent with augmented ketone body production due to impaired glucose metabolism. Moreover, the 12CH4 concentration in this diabetic subject was substantially elevated at 19.1 ppm, likely associated with gut microbiota dysbiosis, colon stress, or bacterial overgrowth, 35 which are commonly reported comorbidities in T1D patients. The spectral fitting approach provided a clear delineation of overlapping absorption features, thereby enabling the accurate quantification of trace VOCs.
These comparative measurements underscore the potential of breath acetone and methane as non-invasive biomarkers for metabolic profiling. The elevated acetone levels in diabetic individuals verify the biochemical shift towards fatty acid oxidation and ketogenesis, whereas increased methane levels may indicate alterations in gut microbial activity. These findings highlight the utility of high-resolution CRDS in characterizing delicate metabolic variations and support the broader application of breath analysis in personalized disease monitoring.
Conclusion
Cavity ring-down spectroscopy of the C–H stretch overtone absorption band (1671.5–1675.0 nm) was used to quantify acetone in exhaled breath by applying a simple empirical model of the absorption cross section. We also proposed and demonstrated a fitting procedure that eliminated the need for real-time wavelength measurement, simplifying the setup while maintaining accurate gas concentration retrieval. The observed acetone absorption peak at 1672.442 nm enabled reliable detection, with a demonstrated limit of detection of 10.5 ppb, confirming this approach as a practical and cost-effective method for breath analysis. This methodology is particularly effective for detecting acetone and other absorbing species at low concentrations in the parts per billion (ppb) range in the NIR.
The subjects with diabetes, particularly (T1D), consistently exhibited higher acetone concentrations than healthy individuals, supporting its role as a metabolic biomarker. Moreover, analysis of samples from Qatar revealed no significant correlation between acetone concentration and age or body mass index (BMI). The CRDS at ∼1672 nm can detect methane concentration, a biomarker of digestive problems. Furthermore, in this region, 13CH4, water vapor (H2O, H2O, 17 and H2O18) and carbon dioxide (13CO2, 16O12C18O, and 16O12C17O) can be detected and measured simultaneously.
The results of this study demonstrate the feasibility of using near-infrared cavity ring-down spectroscopy for sensitive detection of acetone in human breath. The developed system provides sufficient sensitivity for trace gas detection and enables reliable concentration retrieval.
Miniaturization of the current system is achievable in future implementations. The existing configuration employs a cavity length of approximately 2 m to achieve high sensitivity and an extended effective optical path length, thereby supporting laboratory validation of the method. For portable applications, more compact cavity geometries may be adopted, such as folded optical cavities or designs that utilize highly reflective mirrors with reduced spacing, while preserving adequate ring-down time. Furthermore, incorporating fiber-coupled optical components, compact diode laser modules, and integrated optical designs can substantially decrease the instrument's physical footprint. These strategies would facilitate the development of a more compact cavity ring-down spectroscopy (CRDS) sensor suitable for portable or point-of-care diagnostic applications.
Supplemental Material
sj-docx-1-asp-10.1177_00037028261454394 - Supplemental material for High-Sensitivity Detection of Acetone in Human Breath Using Near-Infrared Continuous Wave Cavity Ring-Down Spectroscopy
Supplemental material, sj-docx-1-asp-10.1177_00037028261454394 for High-Sensitivity Detection of Acetone in Human Breath Using Near-Infrared Continuous Wave Cavity Ring-Down Spectroscopy by Eshtar Aluauee, James Bounds, Alexandre Kolomenskii, Hans Schuessler and Liam Fernyhough in Applied Spectroscopy
Footnotes
Acknowledgments
The authors would like to express sincere appreciation of the guidance and significant contributions of Professor Hans Schuessler, who passed away after the first draft of the paper was written. His loss is intensely felt, and this paper is dedicated to his memory with great respect and gratitude.
Author Contributions
Conceptualization and methodology: E.A., J.B., A.K., and H.S. Software: J.B. Validation, A.K. and H.S. Formal analysis: E.A., J.B. Investigation: E.A., J.B. Resources: A.K., H.S., and L.F. Data curation, J.B. Writing—original draft preparation: E.A., and A.K. Writing—review and editing, E.A., A.K., and J.B. Supervision, H.S. Project administration: H.S. Funding acquisition: H.S. and A.K. All authors have read and agreed to the published version of the manuscript.
Consent to Participate
Informed consent was obtained from all subjects involved in the study.
Data Availability Statement
The original contributions that are presented in the study are included in the article; further inquiries can be directed to the corresponding author.
Declaration of Conflicting Interests
The author(s) declared no potential conflicts of interest with respect to the research, authorship, and/or publication of this article.
Ethical Considerations
The study was conducted in accordance with the Declaration of Helsinki and approved by the Institutional Review Board (IRB NUMBER: IRB2016-0382D).
Funding
The author(s) disclosed receipt of the following financial support for the research, authorship, and/or publication of this article: This research was funded in part by the Robert Welch Foundation, grant A1546, and the Qatar National Research Fund (QNRF), grant NPRP 8735–1-154.

Supplemental Material
All supplemental material mentioned in the text accompanies this paper online.
References
Supplementary Material
Please find the following supplemental material available below.
For Open Access articles published under a Creative Commons License, all supplemental material carries the same license as the article it is associated with.
For non-Open Access articles published, all supplemental material carries a non-exclusive license, and permission requests for re-use of supplemental material or any part of supplemental material shall be sent directly to the copyright owner as specified in the copyright notice associated with the article.
