






Abstract
Quantitative infrared spectroscopy of liquids often assumes linear Beer–Lambert behavior, although local-field interactions and dipole–dipole coupling introduce intrinsic nonlinearities. We investigate whether a modified Lorentz–Lorenz relation, motivated by electromagnetic theory, can reduce these deviations and restore approximate linearity in binary mixtures. Using benzene–toluene and benzene–cyclohexane as model systems, we evaluate linearity through RMSE metrics, hybrid 2D-correlation analysis, asynchronous residual sums of squares, and complex-valued classical least squares (CLS) regression. While correlation-based measures provide qualitative insights, they fail to reliably identify optimal linearization parameters. In contrast, CLS in the Lorentz–Lorenz–transformed domain, particularly with systematic-error correction, yields clear minima and substantially improves prediction accuracy, reducing mean absolute errors by more than a factor of three relative to the Beer–Lambert domain. These results demonstrate that the modified Lorentz–Lorenz transformation provides a physics-informed chemometric domain in which spectral mixing becomes more linear. The approach suggests extending inverse least square regression, principal component regression, and partial least squares regression into this domain to further enhance quantitative mixture analysis.
This is a visual representation of the abstract.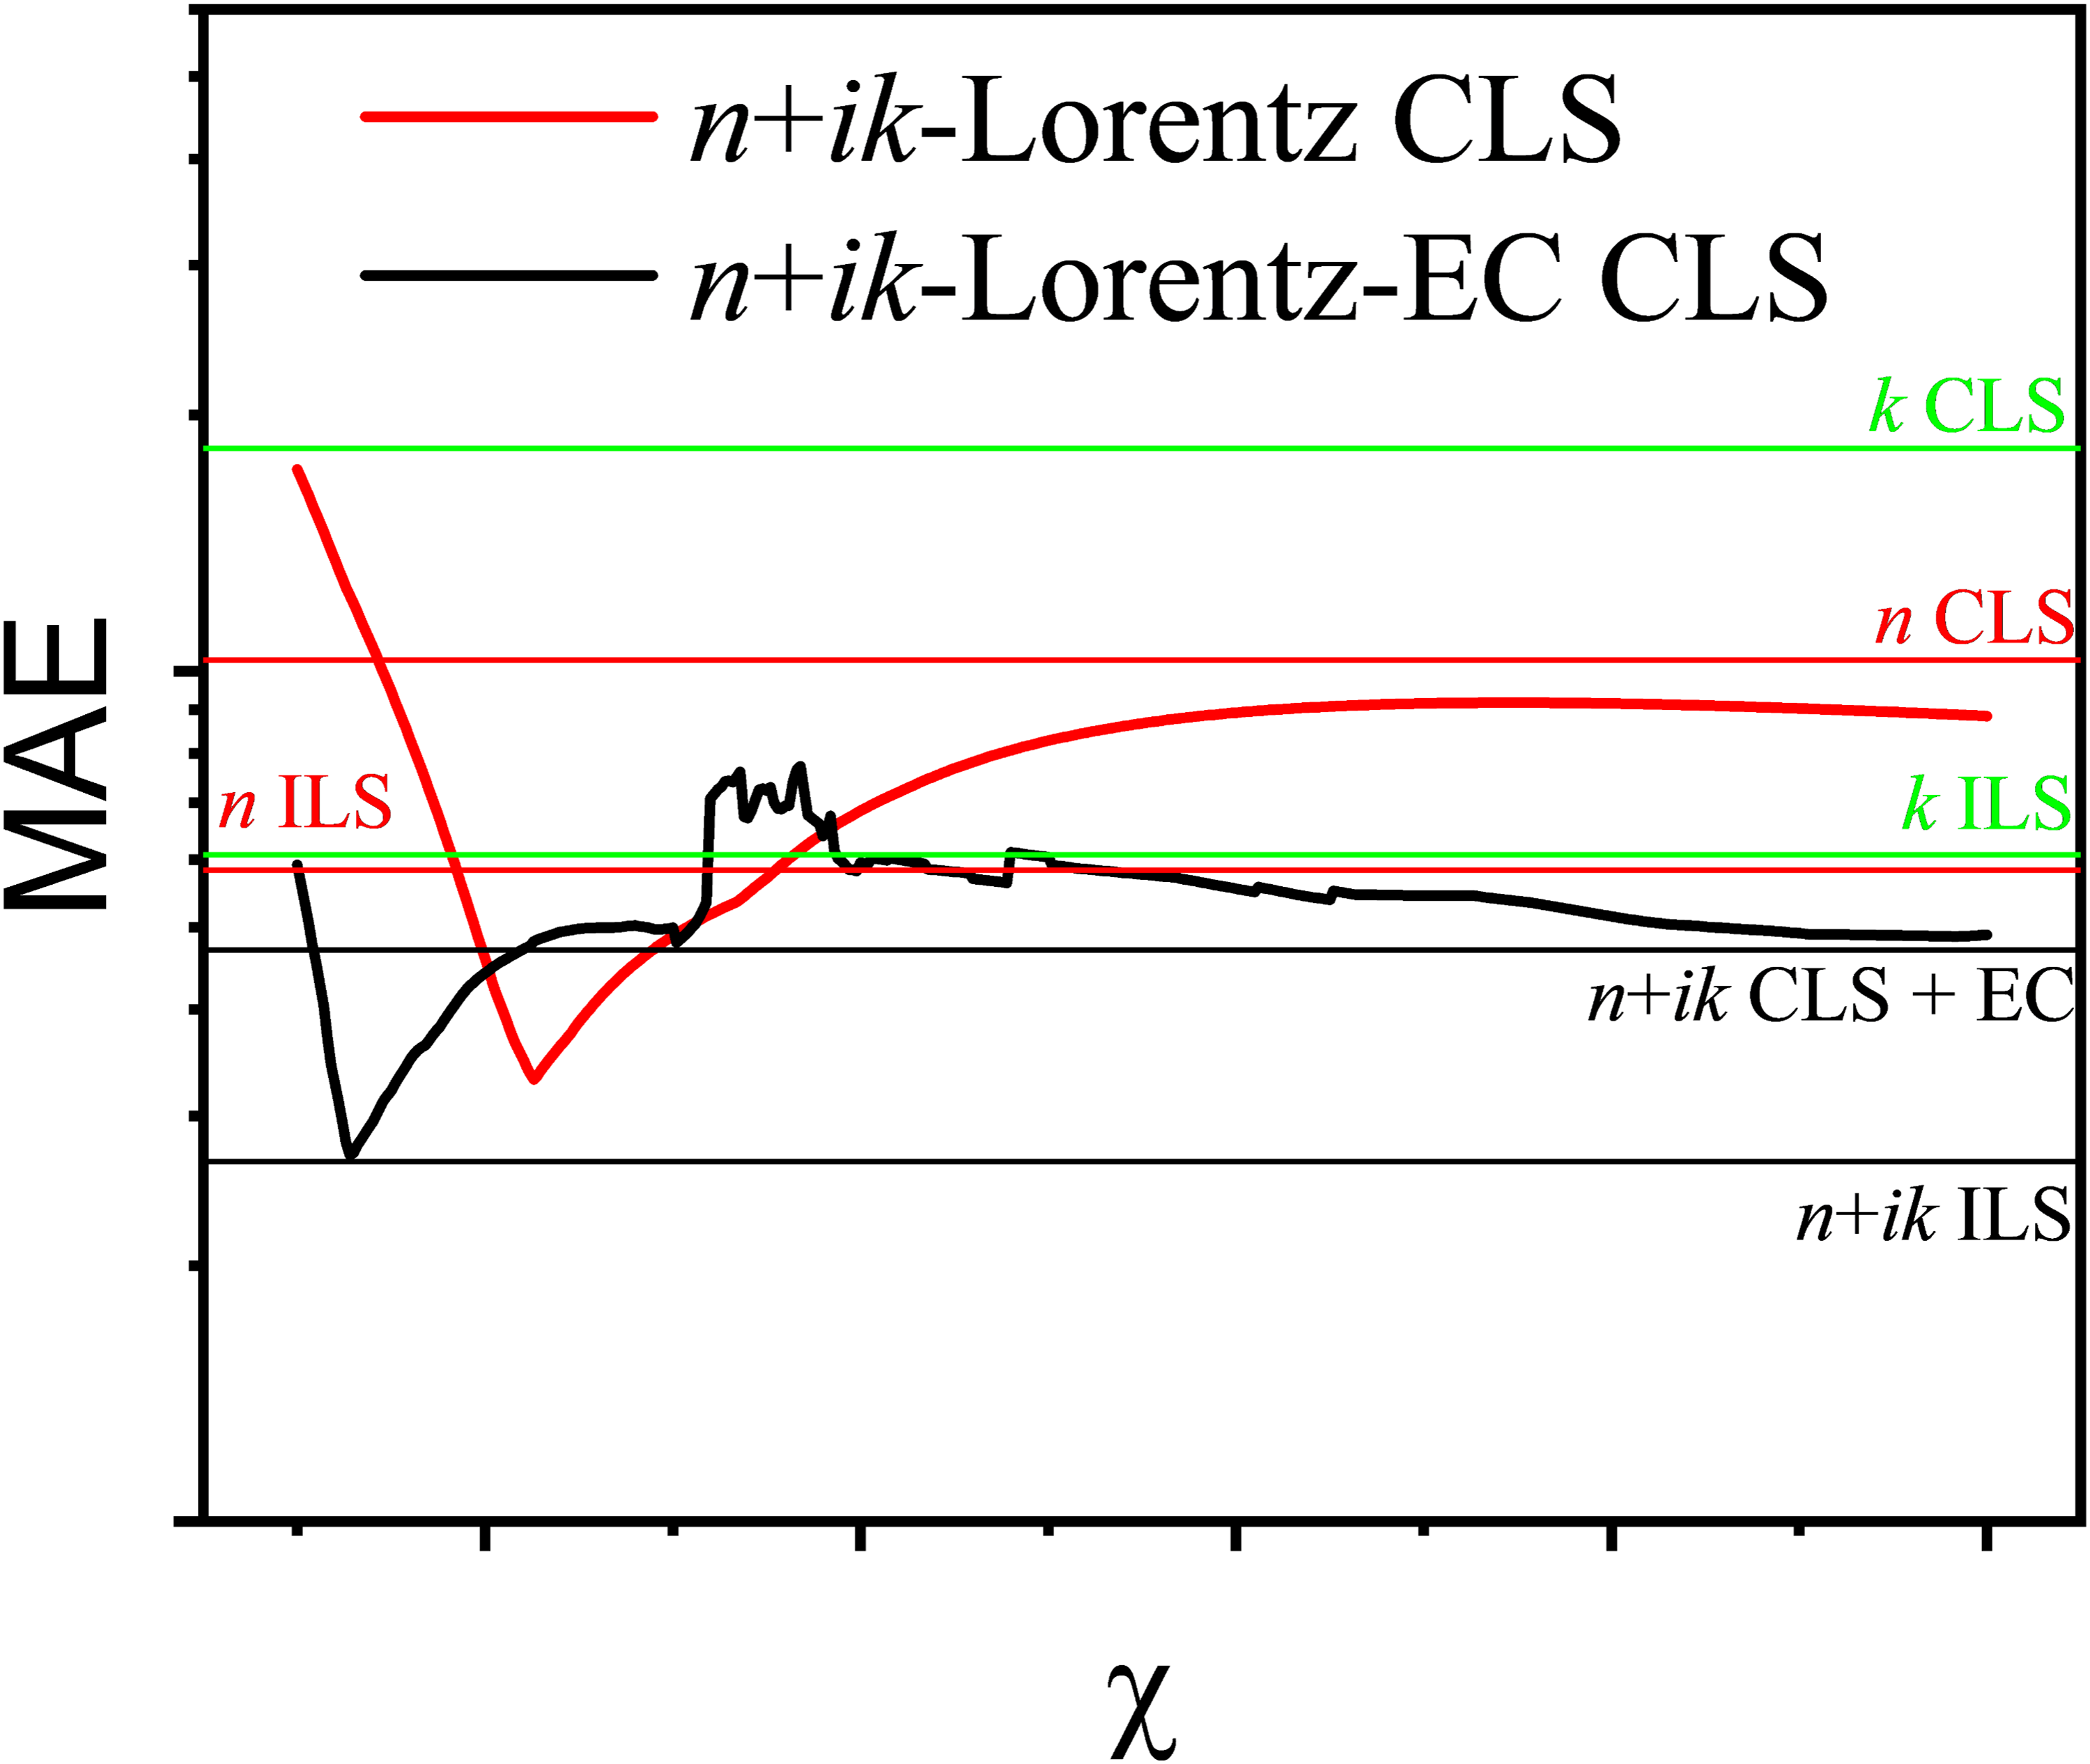
Keywords
Introduction
The quantitative interpretation of light absorption is historically rooted in the Bouguer–Beer–Lambert (BBL) law, one of the earliest empirical attempts to relate optical attenuation to material properties. Its origin reaches back to the 18th century, when Pierre Bouguer observed that light intensity decreases exponentially with path length in a homogeneous absorbing medium.
1
Johann Heinrich Lambert formalized this relation in his Photometria (1760),
2
introducing the expression,


Although the BBL law became foundational in analytical chemistry, it is not exact from the standpoint of electromagnetic theory. Bouguer and Lambert’s exponential decay is strictly valid only for a plane wave traveling through an infinite medium without boundaries. In real condensed materials, interfaces between regions of different refractive index modify amplitude and phase through Fresnel reflection and refraction, leading to deviations from simple exponential behavior.5–9
For ideal gases, however, the assumptions underlying the Bouguer–Lambert law are well satisfied. The refractive index is close to unity, scattering is negligible, and intermolecular interactions are weak. Each molecule experiences an almost homogeneous field, and both light-induced and permanent dipole–dipole interactions can typically be ignored. 10 Hence, the Bouguer–Lambert relation and Beer’s extension hold with high accuracy in low-pressure gas-phase spectroscopy.
In condensed matter the situation differs fundamentally.5,10 Shortly after Beer’s death, Maxwell’s electromagnetic field equations (1865),
11
established the theoretical basis for light–matter interaction. Building on this framework, Hendrik Antoon Lorentz developed a microscopic model linking the macroscopic dielectric function to the microscopic polarizability of atoms and molecules.
12
Independently, he derived the Clausius–Mossotti or Lorentz–Lorenz relation,

The Lorentz–Lorenz relation became a cornerstone for the modern electrodynamics of materials. It guided the development of effective-medium models such as the Maxwell–Garnett (1904) and Bruggeman (1935) formulations,14,15 which describe how the effective permittivity of composite media arises from electromagnetic coupling between constituents. These models explicitly incorporate local-field effects and mutual polarization and remain essential for modeling mixtures, suspensions, and structured materials. 10
The same physical principle, electromagnetic coupling among polarizable entities, also underlies intermolecular forces. London showed in 1930 that instantaneous correlations of fluctuating dipoles produce dispersion forces. 16 More broadly, modern quantum field theory interprets these as arising from vacuum fluctuations of the electromagnetic field. This deep connection between optical dispersion, local fields, and intermolecular forces is emphasized in Paragraph 32 of the Feynman Lectures on Physics, 17 where the Lorentz–Lorenz relation is used to illustrate how microscopic coupling governs macroscopic optical behavior.
Despite this theoretical lineage, most modern molecular spectroscopy diverges from it. In routine practice, condensed-phase systems are often interpreted within the weak-coupling approximation valid for gases. Absorbers are treated as independent, and absorbances are assumed to be additive. This simplification, while convenient, is physically inconsistent for liquids and liquid mixtures, where local-field effects, molecular anisotropy, and microscopic structure strongly influence the electromagnetic response.
Recognizing these limitations, the present work aims to reconnect spectroscopic analysis with its electrodynamic foundation. Because even thermodynamically ideal liquid mixtures cannot be described by a single universal expression, we investigate whether a modified Lorentz–Lorenz relation can better represent their optical behavior. We focus on binary mixtures such as benzene–toluene and benzene–cyclohexane, where refractive index contrasts and local interactions are moderate but measurable. Using hybrid 2D-correlation analysis and complex-valued classical least-squares (CLS) regression, 18 we examine how deviations from Lorentz–Lorenz behavior reflect the underlying light–matter coupling. In doing so, this work seeks to build a bridge from Bouguer, Lambert, and Beer to Maxwell, Lorentz, and Planck—and ultimately to a physics-informed chemometrics framework that accounts for the collective electromagnetic interactions governing even simple liquid mixtures.
Theoretical Aspects
Spectral Mixing in Liquids and Motivation for a Modified Lorentz–Lorenz Relation
Here,
In condensed phases, the optical response cannot be described by simply adding the contributions of isolated molecules. Even in thermodynamically ideal mixtures, the macroscopic refractive index reflects a collective response in which each polarizable unit interacts with the local electromagnetic field generated by its neighbors. For gases under low pressure, these interactions are negligible, but for liquids they introduce systematic deviations from Beer–Lambert behavior.
The Lorentz–Lorenz relation,12,19,20


In the present work, the term Lorentz–Lorenz transformation does not denote a new physical law. It simply refers to rewriting the experimentally determined complex refractive index function


In the classical derivation of the Lorentz–Lorenz relation, the denominator term
Physical Meaning of η
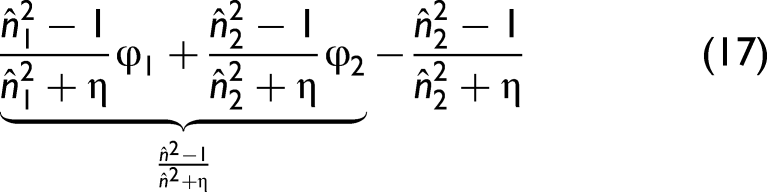
The parameter η introduced in Eq. 5 can therefore be interpreted as an effective depolarization factor that accounts for deviations from the ideal spherical Lorentz cavity. In condensed phases, however, real molecules frequently exhibit:
(i) anisometric molecular shapes, (ii) anisotropic polarizabilities, (iii) non-spherical solvation shells, (iv) packing-induced field inhomogeneities, (v) short-range order
These factors modify the local electromagnetic field acting on each molecule. The parameter
Although
Although η originates from depolarization considerations analogous to effective-medium models, it should not be regarded as a universal constant of the constituents themselves. A binary mixture defines a specific local-field environment that depends on molecular anisotropy, packing constraints, and the solvation structure of both components. Therefore, η is system-specific rather than component-specific; it need not be transferable between two different mixtures that share one of the endmembers. Formally, η could vary with wavenumber because different normal modes experience different local-field distortions. In this work, however, η is treated as constant to obtain a single effective linearization parameter.
We consider a set of m spectra recorded for systematically varied mixture compositions. In the terminology of two-dimensional correlation spectroscopy, such a composition-dependent spectral series is referred to as dynamic spectra. Here, the perturbation variable is the volume fraction (i) the experimentally determined complex refractive indices, possibly offset by the refractive index of the second endmember, (ii) linear combinations such as (iii) terms of the form (iv) linear combinations such as
For clarity, q = 1 denotes experimental spectra in a given domain and q = 2 the corresponding linear model spectra.
Each spectrum consists of n spectral points at the wavenumbers
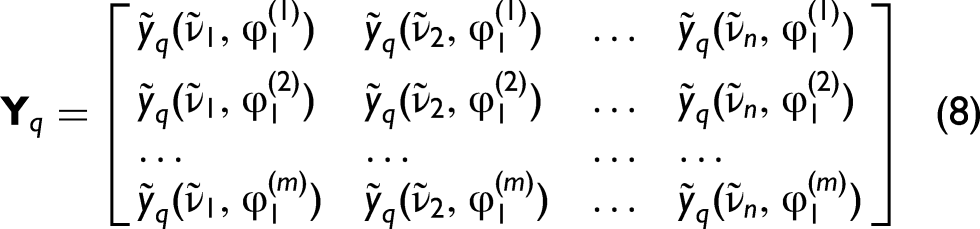
In this work, linearity refers to the condition that the spectral response is a linear function of the perturbation variable (volume fraction φ₁), meaning that mixture spectra can be represented as linear combinations of pure-component spectra in a given spectral representation (e.g., absorbance, refractive index, or Lorentz–Lorenz domain). For the present analysis, the real and imaginary parts of the complex refractive index,
RMSE-Based Linearity Measure
Deviations from linearity can be quantified via the RMSE,

2D Correlation-Based Measures (SES1–SES3)
As an alternative to magnitude-based metrics, 2D correlation-based measures can also be employed. From the matrices Yq, one can compute the corresponding variance–covariance matrices,

As pointed out in Noda and Ozaki,
24
each element of the variance–covariance matrix expresses the similarity between an experimental and a simulated intensity variation at different wavenumbers. In order to calculate the asynchronous spectrum, the Hilbert–Noda transformation matrix N must first be determined.
24
Its elements are defined as:


For conventional 2D correlation spectra or maps, certain symmetry relations apply. Specifically, the asynchronous spectra are always antisymmetric with respect to the diagonal elements

For the hybrid 2D-correlation case, this condition becomes (SES1),

In the hybrid case (
In the present notation, the matrices
If we set p = 2, the term


Such a situation is generally not expected for liquids or solids. Instead, we assume that the following entries,
As an alternative, if the second endmember spectrum is not subtracted,
A further extension can be introduced in the form of the 2T2D smart error sum (hybrid two-trace 2D-COS). In this approach, one spectrum (“s”) corresponds to the experimental spectrum and the other (“m”) to the modelled spectrum. Both hybrid 2D-COS and 2T2D therefore compare the experimentally measured mixture spectra (contained in


Complex-Valued CLS Regression
Finally, linearity can also be assessed by applying classical least-squares regression and comparing the mean absolute error (MAE) or the RMSE as a function of η. To this end, we employ complex-valued CLS, as introduced in Mayerhöfer et al., 18 both with and without error correction. The mathematical framework of complex-valued CLS is identical to that of conventional CLS, except that the Hermitian transpose (i.e., the complex conjugate of the transpose) must be used. The error correction relies on the fact that the volume fraction is inherently a real quantity but becomes complex in the presence of systematic errors, i.e., deviations from linearity. The imaginary parts of the estimated volume fractions closely resemble the deviations between the calculated real parts and their corresponding calibration values, differing only by a common proportionality factor. Hence, by applying a leave-one-out (LOO) scheme and calibrating this common factor, linearity can be improved by subtracting the determined systematic error. The improvement in linearity is then evaluated as a function of η.
Experimental
Fourier transform infrared (FT-IR) spectra of benzene–toluene and benzene–cyclohexane mixtures were recorded using a Thermo Scientific Nicolet iS50 FT-IR spectrometer equipped with an integrated diamond attenuated total reflection (ATR) accessory. The toluene volume fraction varied from 0 to 1 (
The recorded ATR spectra correspond to reflectance at 45° under unpolarized illumination. To retrieve the complex refractive index function
The values of n∞ for pure benzene and toluene were taken from Myers et al., 27 while for the mixtures, n∞ was calculated using the Lorentz–Lorenz relation.18,28 For cyclohexane, n∞ was extrapolated from experimental visible range data using the Sellmeier equation. 29 The same procedure was applied to its mixtures, analogous to the benzene–toluene system. All computations were performed using custom-developed Mathematica programs.
More generally, it is important to recognize that extracting the complex refractive index from infrared spectra involves solving an inverse electromagnetic problem. In infrared spectroscopy, quantitative interpretation ultimately requires access to the complex refractive index
In the present work, ATR spectra are used in combination with a Fresnel-based, Kramers–Kronig-consistent reconstruction scheme (Mayerhöfer et al.
26
) to obtain
A comprehensive treatment of the underlying inverse electromagnetic problem and its connection to wave optics has been discussed in detail elsewhere (see Ref. 10 and references therein) and is not reproduced here.
Results and Discussion
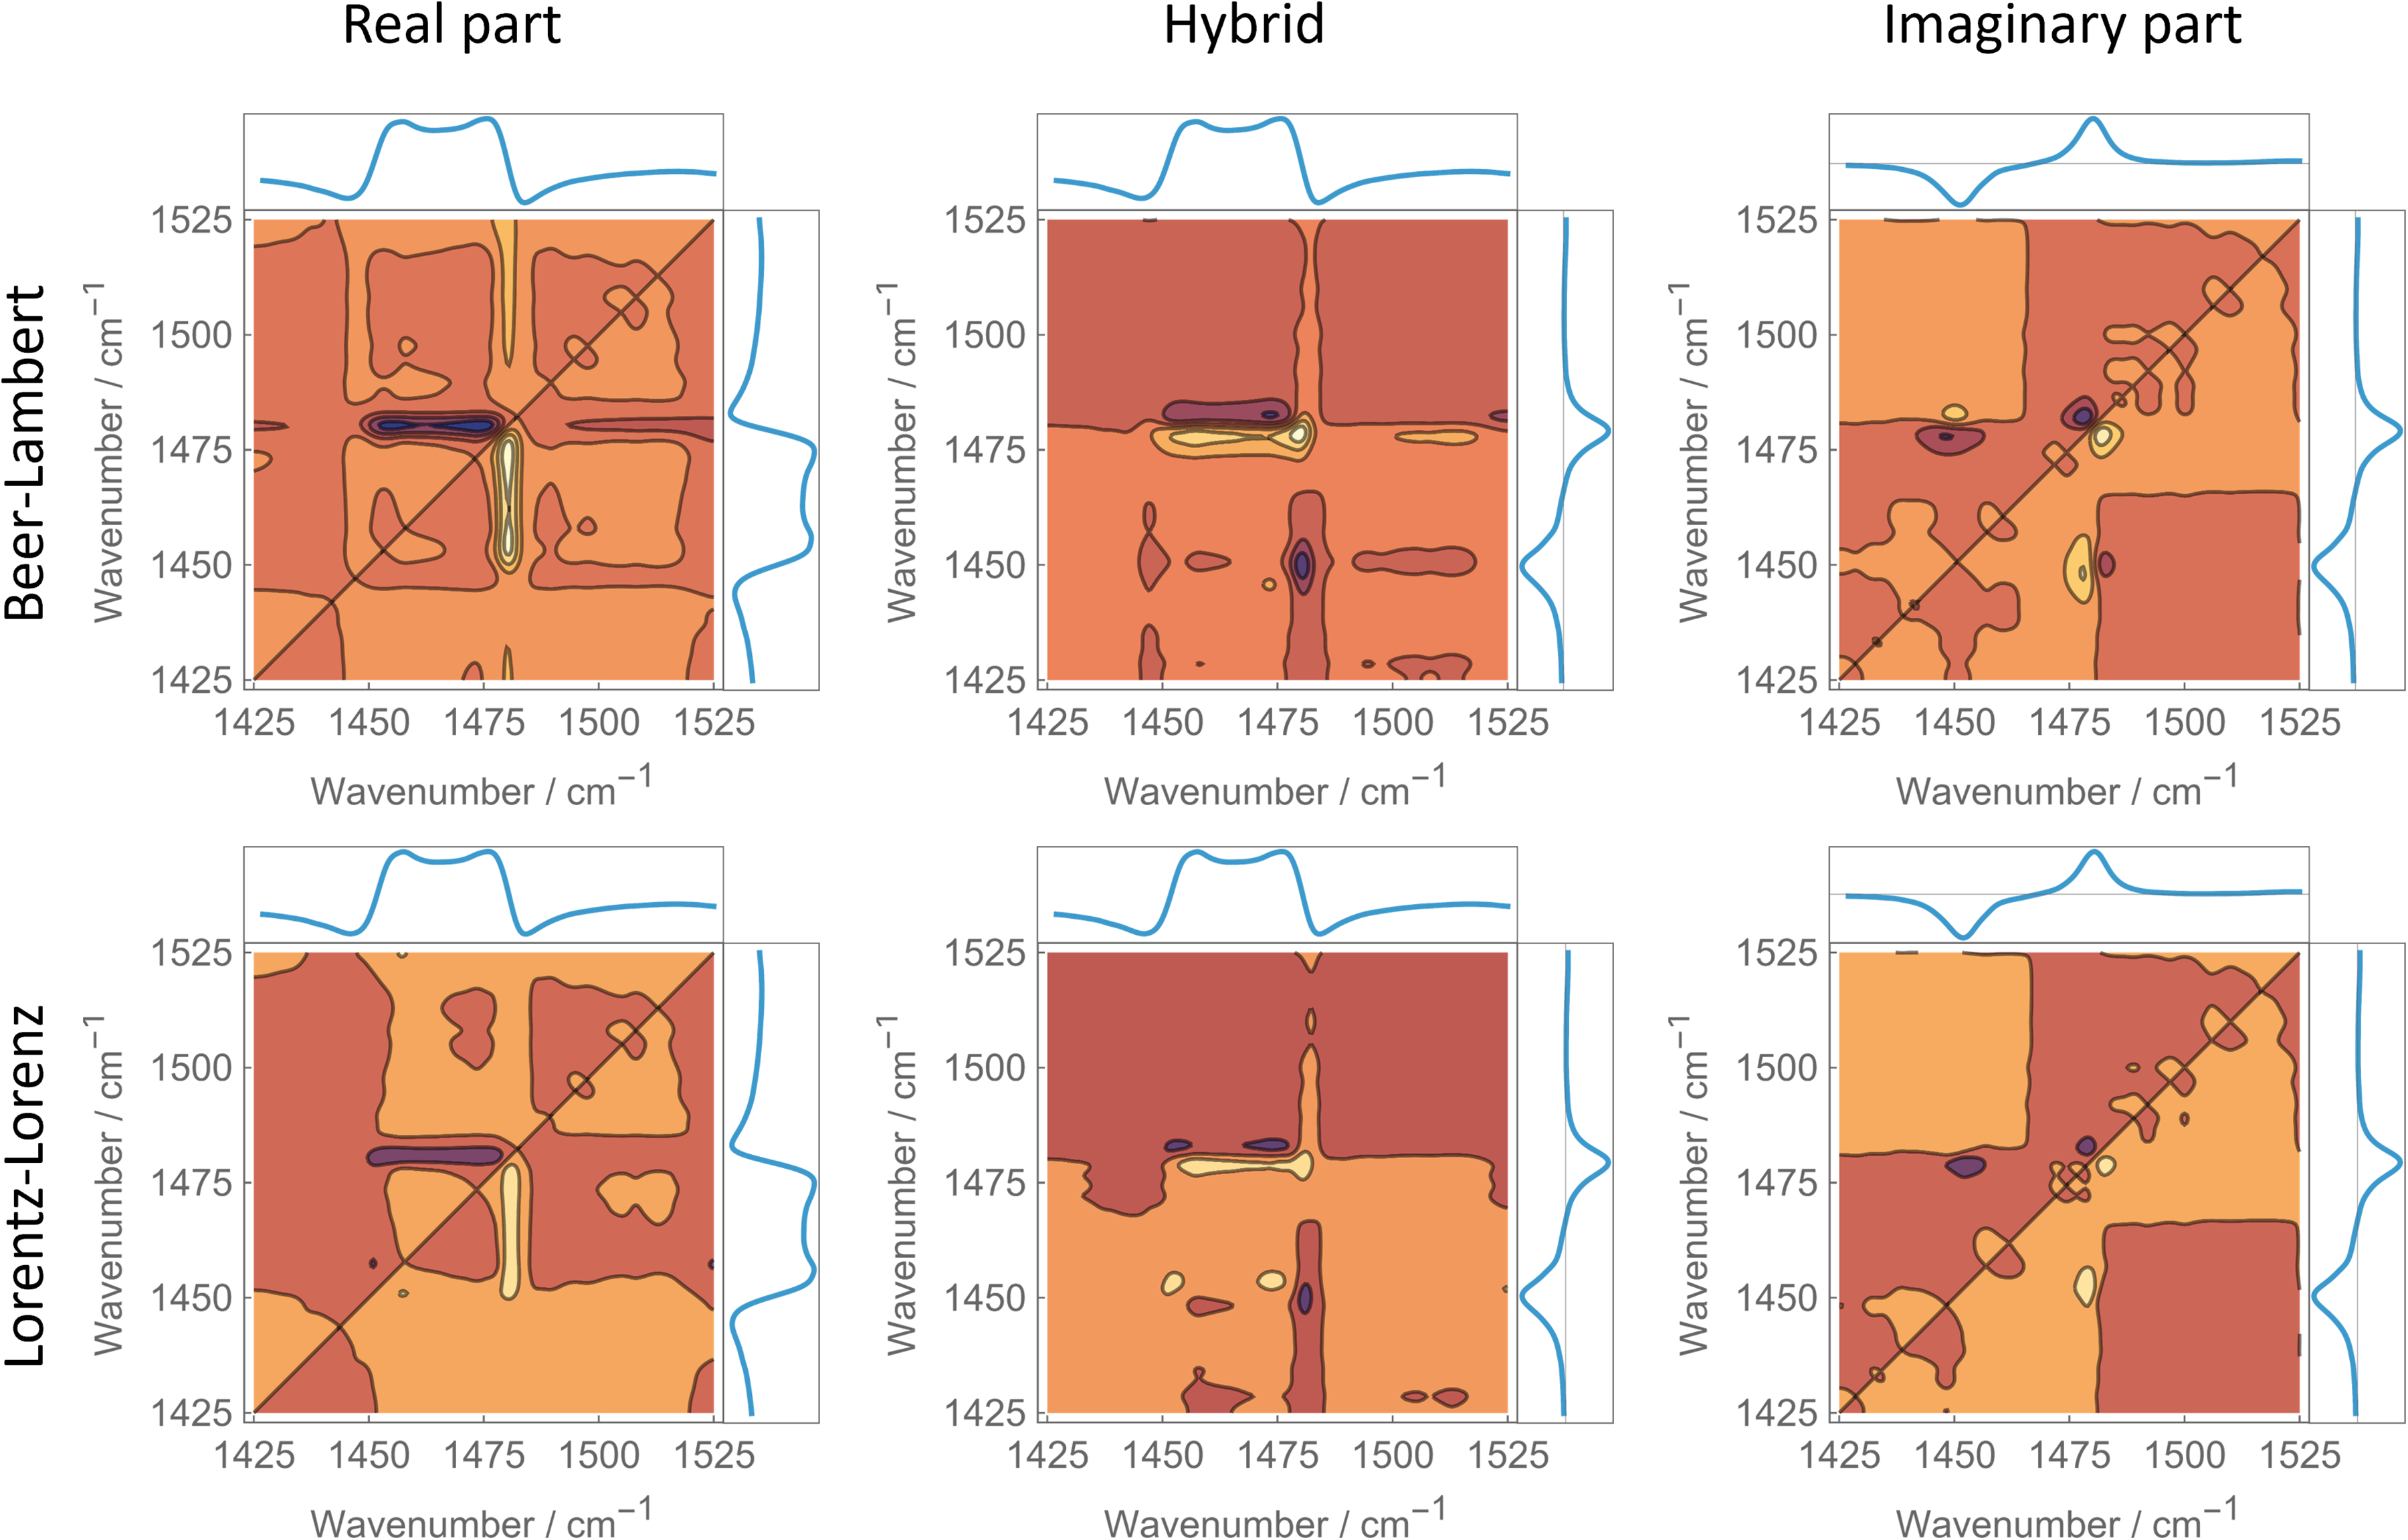
Figure 1 shows hybrid 2D-correlation spectra derived from the real or imaginary parts of the experimental complex refractive index for the benzene–cyclohexane system. In the upper row, the experimental spectra are compared with their corresponding Beer–Lambert linear combinations. In the lower row, the Lorentz–Lorenz–transformed experimental spectra are compared with the respective linear combinations of the Lorentz–Lorenz terms of the pure-component spectra. For the Lorentz–Lorenz transformation, we chose η = 0.45, which—as shown later—minimizes the nonlinearity.
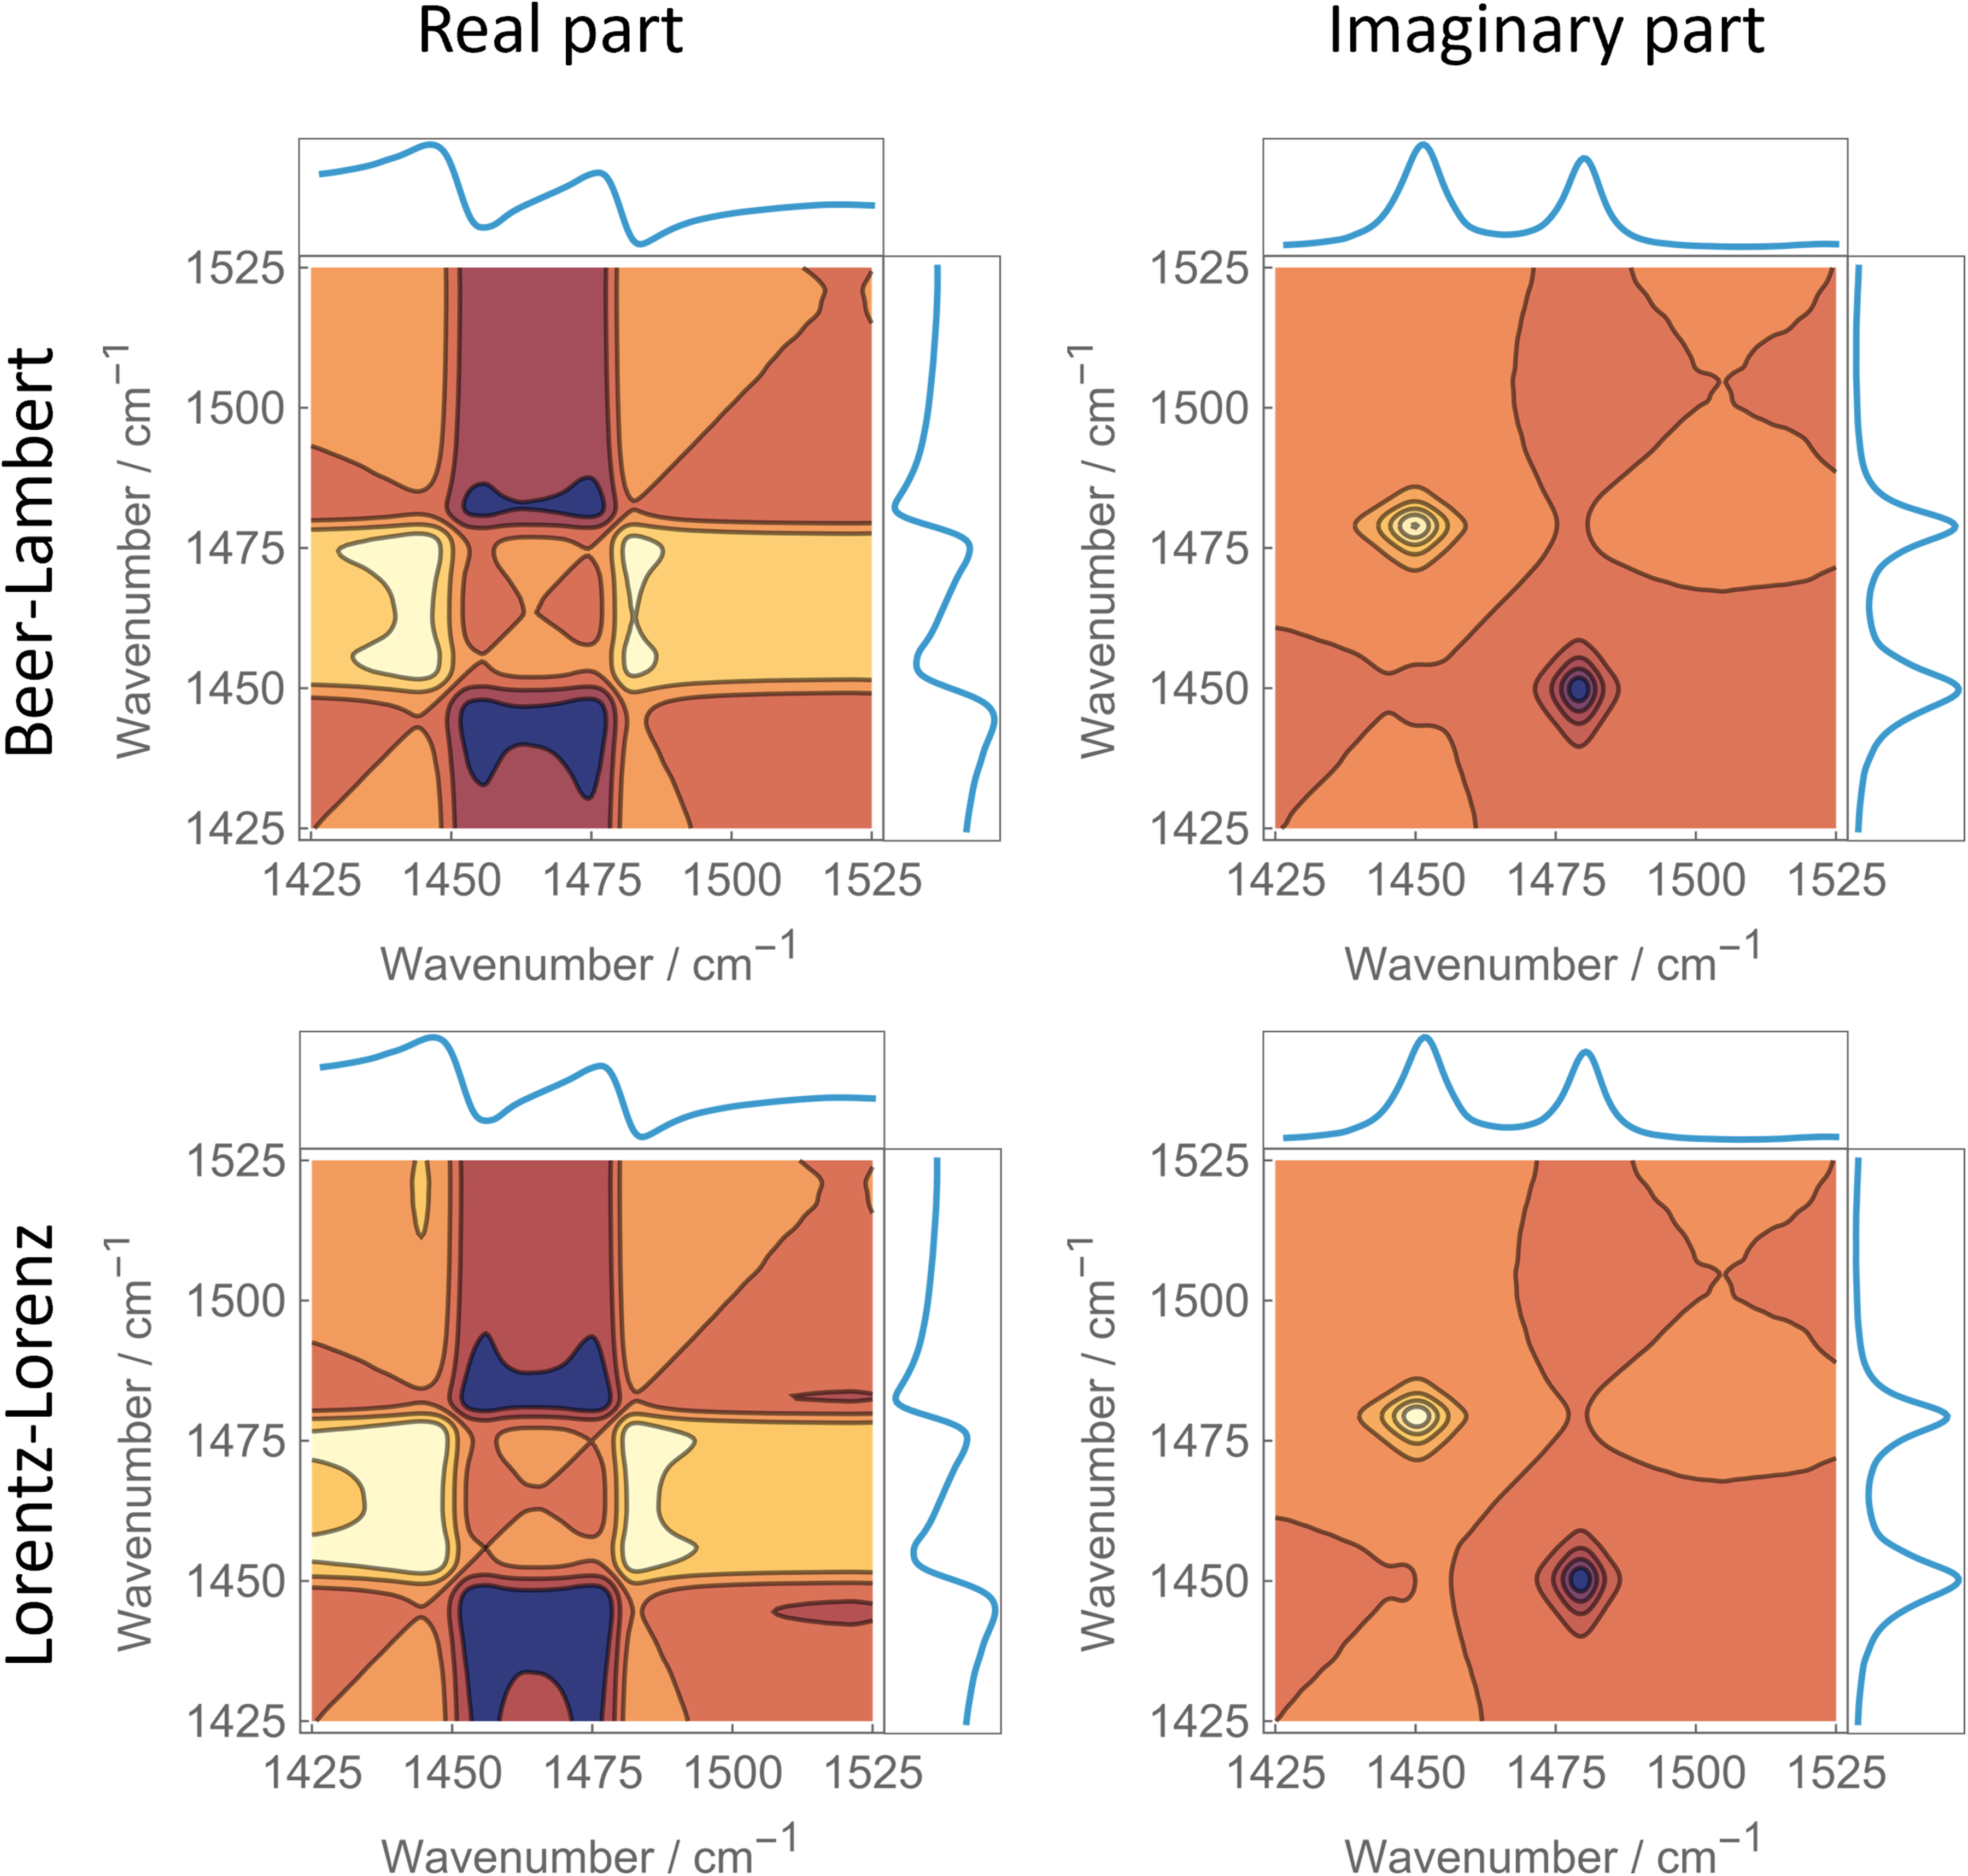
Hybrid 2D-correlation spectra obtained by correlating experimental spectra (
Inspection of the spectra shows that neither approach satisfies the criterion for linearity, namely that points above and below the diagonal (from lower to higher wavenumbers) must be strictly antisymmetric with the diagonal acting as the mirror plane. When considering only features associated with the absorption bands in the imaginary part, the antisymmetry condition appears better fulfilled after applying the Lorentz–Lorenz transformation. This does not hold for the real-part spectra, which exhibit a larger number of features with greater structural complexity. Overall, it seems practically impossible to extract reliable quantitative information from these spectra alone. In Figure 1, antisymmetry of the hybrid asynchronous map is the strict criterion for linear Beer–Lambert behavior because the spectra are compared directly without subtraction. In this representation, deviations from perfect antisymmetry directly indicate nonlinear mixing.
Figure 2 suggests that at least semi-quantitative differences are visible. As in Figure 1, these spectra are obtained from hybrid correlation between experimental and model datasets (Y₁ ≠ Y₂). However, due to the representation used here, antisymmetry is no longer the appropriate criterion. Here, intensity, rather than antisymmetry, is the relevant criterion. This is expected, because spectra based solely on real or imaginary parts obey perfect antisymmetry, whereas hybrid real/imaginary spectra do not. Displaying the hybrid spectrum in the way used in Figure 1 would therefore not be meaningful, since hybrid asynchronous maps are inherently non-antisymmetric. Instead, decreasing nonlinearity manifests as decreasing intensity, which becomes apparent when the modified Lorentz–Lorenz transformation is applied. Nevertheless, whether an optimal η exists cannot be determined reliably from visual inspection alone. It must also be noted that, by the structure of the modified Lorentz–Lorenz relation, the magnitude of all terms decreases for decreasing η, because the denominator increases. Thus, any intensity decrease is only meaningful if it occurs for η < 2.
Hybrid 2D-correlation spectra obtained by correlating experimental spectra (
To compare the different measures of nonlinearity introduced above, we evaluate the RMSE-based and 2D-correlation-based criteria. The SES3 measure corresponds to the 2T2D formulation introduced in Eq. 19 and therefore reflects the two-trace comparison between experimental and model spectra. Figure 3 shows that these expectations are fulfilled, at least for the benzene–toluene system. All methods predict a minimum around
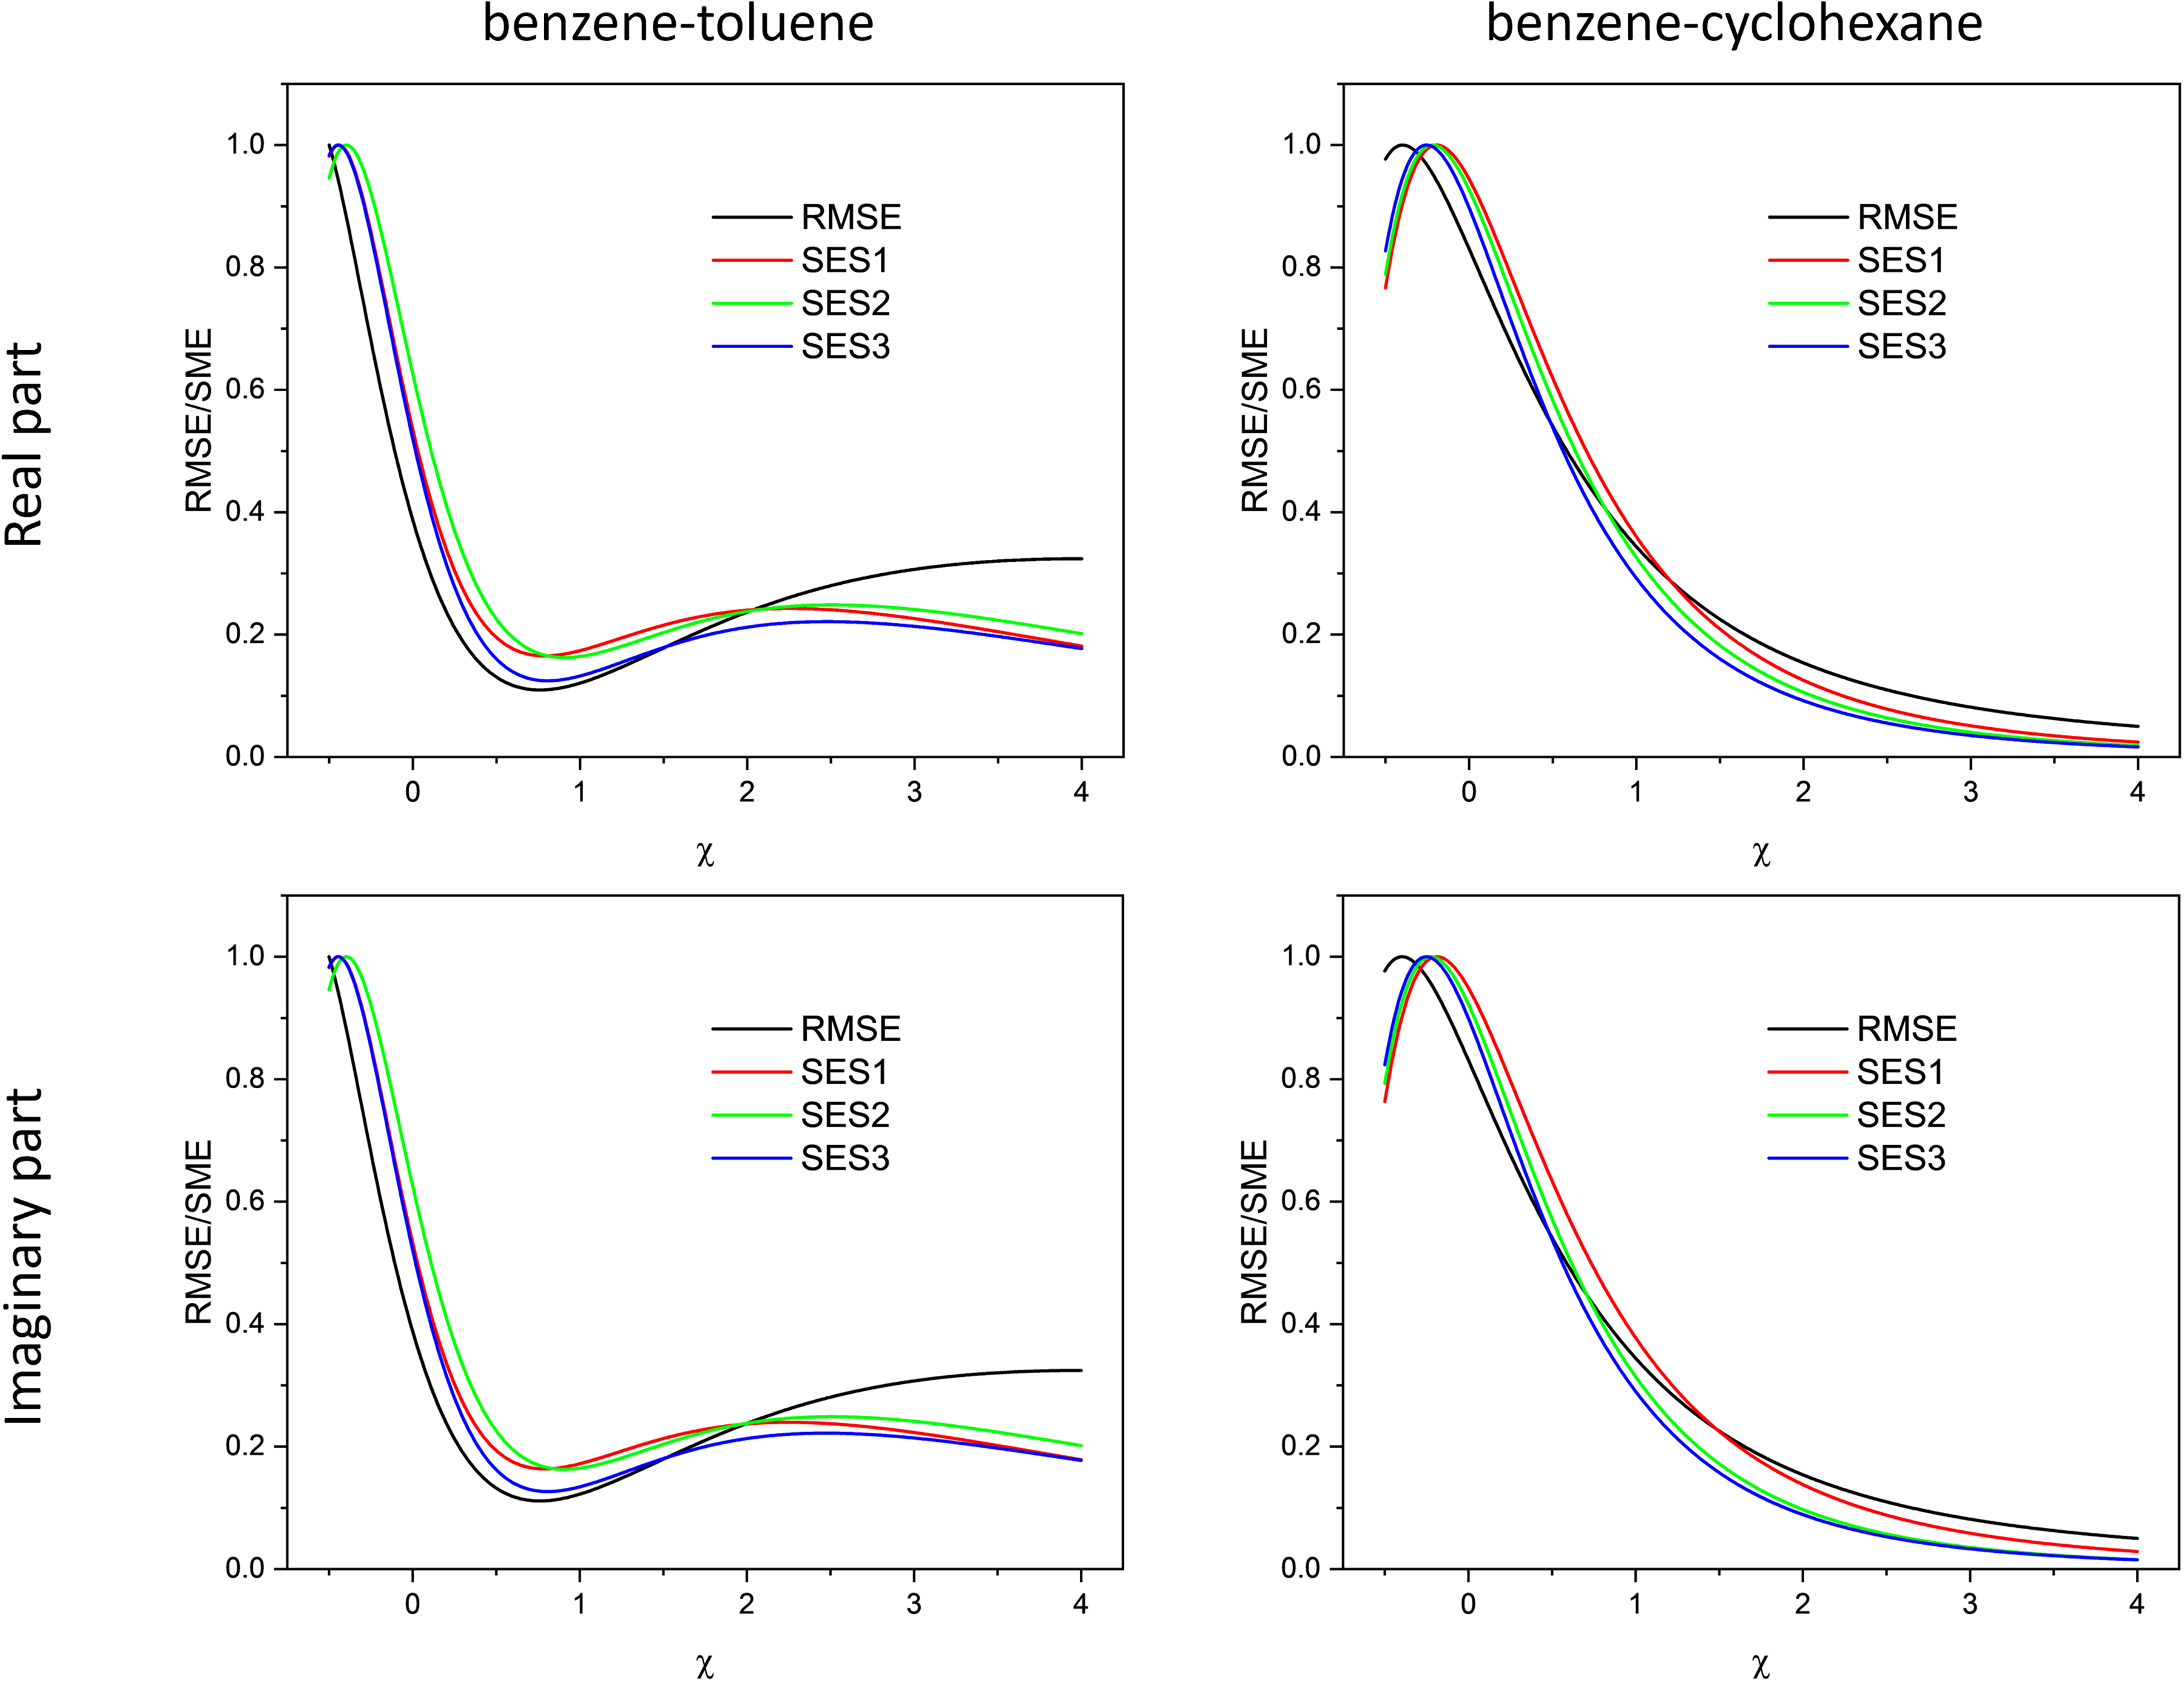
Comparison of the different methods proposed in this work for quantitatively assessing the degree of linearity. RMSE refers to the conventional approach defined in Eq. 9, whereas the 2D-correlation-based methods are denoted SES1-3 (SES1: Eq. 14, SES2: Eq. 16, and SES3: Eq. 19, corresponding to the 2T2D formulation). The comparison is performed for the benzene–toluene and benzene–cyclohexane systems, and separately for the real and imaginary parts of the complex refractive index as well as for the modified Lorentz–Lorenz terms. All curves are normalized to their maximum value for easier comparison.
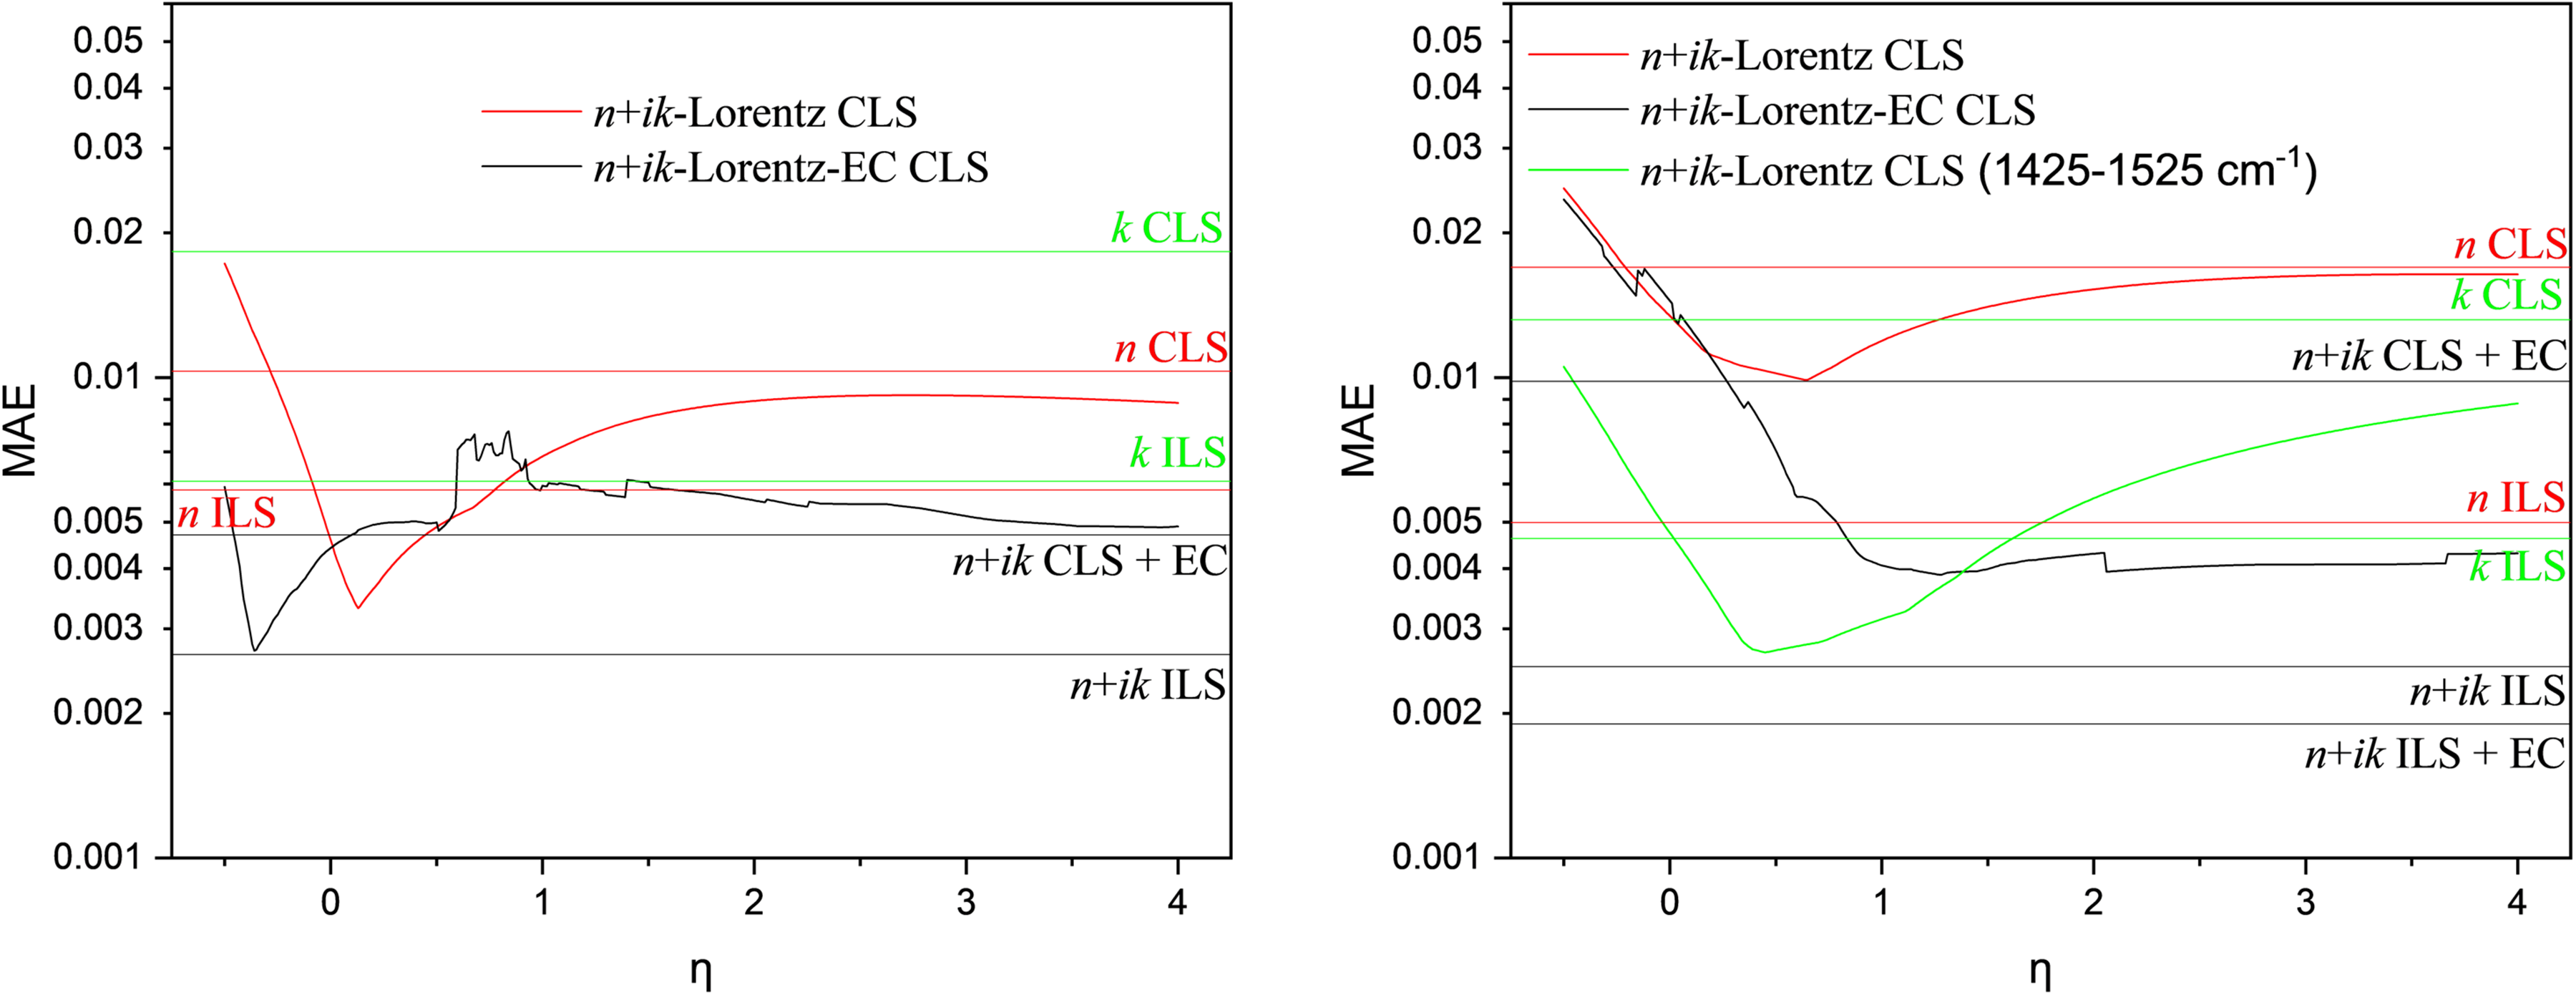
Results of complex-valued CLS regression with (black curves) and without error correction (red and green curves) in the systems benzene–toluene and benzene–cyclohexane in dependence of η. For comparison, results are given for CLS and ILS based on the complex-valued CLS and ILS of the complex refractive index function and its real and imaginary part alone with and without error correction.
Although the real and imaginary parts of the complex refractive index are connected by the Kramers–Kronig (KK) relations, complex-valued regression does not simply duplicate information. The KK transformation used here relies not only on the infrared absorption index but also on independent information about n∞ from the visible range. Its variation with volume fraction is not contained in the absorption spectrum and introduces additional physical information related to the high-frequency response of the mixture. Furthermore, in regression, real and imaginary components behave differently under systematic error, noise, and collinearity. Even when no fundamentally new information is added, the redundancy created by using both components allows systematic deviations to become visible in the imaginary part of the coefficients, enabling their empirical correction. Thus, the complex representation assists chemometrics not primarily by increasing information content, but by creating a domain in which deviations from linearity manifest in a correctable and numerically advantageous manner. This observation shifts the emphasis from purely spectral considerations to regression performance with respect to the perturbation variable itself. At this point, we shifted our focus to a more pragmatic question: Why do we want the nonlinear terms to be as small as possible? The answer is the applicability of the Beer–Lambert approximation and, ultimately, the avoidance of systematic errors when using classical chemometric regression methods. In this spirit, we define the optimal η as the value that minimizes the regression error with respect to the perturbation variable, i.e., the volume fraction. Since the modified Lorentz–Lorenz relation is expected to be linear in this parameter, classical least-squares regression can be used. The corresponding results are shown in Figure 4.
This pragmatic approach substantially improves CLS performance not only for benzene–toluene but also for benzene–cyclohexane, despite the latter not showing favorable behavior in Figure 3. For benzene–toluene, the mean absolute error (MAE) of complex-valued CLS based on the complex refractive index is reduced to less than one third. With error correction, the minimum MAE becomes comparable to that achieved by ILS and conventional PLS, while complex-valued PLS yields a slightly lower MAE. Similar improvements are observed for benzene–cyclohexane. In this system, PLS applied to the real part (refractive index) alone can even outperform conventional PLS because the refractive-index contrast at high wavenumbers is significantly larger than in the benzene–toluene system. For this system, as well as for benzene–CCl₄ (not shown), linearization using the modified Lorentz–Lorenz relation combined with error correction produces MAE values comparable to those obtained from PLS based solely on the absorption index. These results demonstrate that the modified Lorentz–Lorenz relation, together with complex-valued CLS and error correction, offers a practical and effective route toward minimizing systematic errors in spectroscopic mixture analysis.
Practical Workflow
Based on the above considerations, the following workflow summarizes the proposed approach:
Acquire ATR spectra of calibration mixtures spanning the relevant composition range, as well as the corresponding pure-component spectra. Apply a rigorous ATR correction to the measured spectra in order to retrieve the complex refractive index function Apply the modified Lorentz–Lorenz transformation (Eq. 5) to all calibration and unknown spectra. Perform regression (e.g., CLS, ILS, or PLS) in the transformed domain. The optimal value of η can be selected by minimizing cross-validated prediction error, as demonstrated in Figure 4. In this framework, the concentration (volume fraction φ₁) is obtained directly from the regression model applied in the Lorentz–Lorenz–transformed domain, analogous to conventional Beer–Lambert-based calibration but with improved linearity of the spectral response. Apply the resulting calibrated model to unknown samples measured under identical ATR conditions.
Conclusion
In this work, we revisited the problem of spectral linearity in condensed-phase mixtures by explicitly incorporating light–matter coupling through a modified Lorentz–Lorenz relation. Using benzene–toluene and benzene–cyclohexane as representative systems, we systematically evaluated several strategies for quantifying nonlinearity, including RMSE-based metrics, hybrid 2D-correlation analysis, asynchronous residual sums of squares, and complex-valued CLS regression with and without error correction.
Our results show that 2D-correlation-based measures capture qualitative signatures of nonlinearity but do not reliably reveal an optimal depolarization parameter η, particularly for systems such as benzene–cyclohexane where the spectra display monotonic behavior. RMSE-based metrics exhibit similar limitations. A more pragmatic and physically meaningful criterion arises when the modified Lorentz–Lorenz transformation is embedded directly into complex-valued CLS regression. In this case, η can be optimized by minimizing the regression error with respect to the perturbation variable (volume fraction). This approach proved highly robust: CLS errors were substantially reduced for both systems, and with systematic-error correction the results approached or matched the performance of ILS and PLS. Importantly, improvements were obtained even in systems where correlation-based analyses did not indicate any benefit of the Lorentz–Lorenz transformation. Having established that η can be optimized via regression error minimization, we now briefly outline how this framework can be implemented in practical ATR-based mixture analysis.
In conventional quantitative infrared spectroscopy, Beer–Lambert behavior is assumed by directly modeling absorbance spectra as linear combinations of pure-component absorbances, i.e.,


Linearity is then imposed in this transformed domain, where electromagnetic local-field effects are approximately condensed into the parameter η. In this sense, the Lorentz–Lorenz framework replaces Beer–Lambert not at the level of regression methodology, but at the level of the spectral representation in which linear mixing is assumed.
In practical applications, quantitative analysis of liquid mixtures is frequently performed using ATR FT-IR spectroscopy. The present results suggest that such calibration procedures can be improved by performing them in the modified Lorentz–Lorenz domain rather than directly in the Beer–Lambert absorbance domain.
The practical implementation of the approach is summarized in the Discussion section. In this way, the modified Lorentz–Lorenz transformation acts as another physics-informed preprocessing step that reduces systematic nonlinearities before multivariate regression is performed.
These findings illustrate that the modified Lorentz–Lorenz domain provides a physics-informed chemometric space in which spectral mixing is much closer to linear and systematic deviations are greatly reduced. By incorporating physically grounded principles, i.e., local fields, mutual polarization, and wave-optics-based mixing rules, this approach creates a chemometric framework that is not only empirically robust but also consistent with the electrodynamics of condensed phases. The modified Lorentz–Lorenz framework should therefore be regarded as a physics-informed approximation rather than an exact microscopic description. Its purpose is not to eliminate local-field complexity but to condense it into a single effective parameter that restores approximate linearity for chemometric purposes.
Because the transformation restores approximate linearity in a physically interpretable way, it is natural to extend this concept beyond CLS. The results strongly suggest that ILS, PCA, and PLS should be revisited in this physics-informed Lorentz–Lorenz domain, where their calibration spaces may become more linear, more stable, and ultimately more predictive. Such an extension may significantly improve quantitative spectroscopy of liquid mixtures and provide a unified methodology for connecting classical chemometrics with the underlying physics of light–matter interaction. Future work will therefore focus on implementing these physics-informed chemometric methods—CLS, ILS, PCA, and PLS—directly in the modified Lorentz–Lorenz space and systematically evaluating their performance across a broader range of molecular systems.
Beyond its conceptual implications, the modified Lorentz–Lorenz framework introduced here has several practical consequences for quantitative vibrational spectroscopy. Any application that relies on Beer–Lambert-type linearity in condensed phases, such as quantitative infrared analysis of liquid mixtures, process analytical technology (PAT), reaction monitoring, or multicomponent calibration in ATR FT-IR, may benefit from operating in a Lorentz–Lorenz–transformed chemometric domain. In such settings, systematic deviations from linearity often dominate the prediction error and limit the transferability of calibration models. In particular, nonlinear mixing is a major obstacle for calibration transfer across instruments, sampling conditions, or concentration ranges. By condensing local-field effects, molecular anisotropy, and packing-related interactions into a single effective parameter, the present approach offers a pragmatic route to reduce these systematic errors without resorting to fully microscopic modeling.
More generally, the results suggest that physics-informed transformations of spectroscopic data can significantly improve the stability and interpretability of chemometric models. This is particularly relevant for complex-valued regression approaches, where the availability of both real and imaginary components allows systematic deviations from ideal mixing behavior to be detected and corrected. Potential applications therefore extend beyond infrared spectroscopy to other optical techniques that probe complex refractive indices, including Raman spectroscopy, ellipsometry-based analysis of liquids, and broadband optical sensing of multicomponent systems.
Supplemental Material
sj-docx-1-asp-10.1177_00037028261454699 - Supplemental material for Reducing Non-Linearity in Spectral Evaluation via a Modified Lorentz–Lorenz Relation
Supplemental material, sj-docx-1-asp-10.1177_00037028261454699 for Reducing Non-Linearity in Spectral Evaluation via a Modified Lorentz–Lorenz Relation by Thomas G. Mayerhöfer, Isao Noda and Jürgen Popp in Applied Spectroscopy
Footnotes
Acknowledgments and Funding
Financial support from the EU, the “Thüringer Ministerium für Wirtschaft, Wissenschaft und Digitale Gesellschaft”, the “Thüringer Aufbaubank”, the Federal Ministry of Education and Research, Germany (BMBF), the German Science Foundation, the “Fonds der Chemischen Industrie” and the Carl-Zeiss Foundation is gratefully acknowledged.
Declaration of Conflicting Interests
Thomas G. Mayerhöfer is an Associate Editor for Applied Spectroscopy. The authors declared no potential conflicts of interest with respect to the research, authorship, review, and/or publication of this article.
Supplemental Material
All supplemental material mentioned in the text accompanies this paper online. All supplemental material mentioned in the text is available in the online version of the journal.

References
Supplementary Material
Please find the following supplemental material available below.
For Open Access articles published under a Creative Commons License, all supplemental material carries the same license as the article it is associated with.
For non-Open Access articles published, all supplemental material carries a non-exclusive license, and permission requests for re-use of supplemental material or any part of supplemental material shall be sent directly to the copyright owner as specified in the copyright notice associated with the article.
