






Abstract
The study presents score-based quantitative principal component analysis (SQPCA) combined with two-trace two-dimensional (2T2D) correlation spectroscopy as an approach for semi-quantitative analysis of plant extract using attenuated total reflection infrared (ATR FT-IR) spectral data. The SQPCA algorithm was applied to determine the content of four flavonoids, baicalin, baicalein, wogonin, and wogonoside, in a series of extracts from Scutellaria baicalensis Georgi roots. Due to the complex nature of the spectral profiles, characterized by congested, overlapping bands, appropriate data preprocessing was necessary to enhance the quantitative performance of the SQPCA procedure. A slice of the 2T2D disrelation spectrum was used to construct a multiplicative filter, i.e., disrelation filter (DF), to derive signals corresponding mainly to the analytes of interest. The concentrations of analytes calculated by SQPCA and SQPCA-DF were compared with those determined using the high-performance thin-layer chromatography (HPTLC) method. For the analyzed flavonoids, a reasonable spectral resolution was achieved, making the combined approach especially useful for the identification and quantification of analytes in the presence of interferents.
This is a visual representation of the abstract.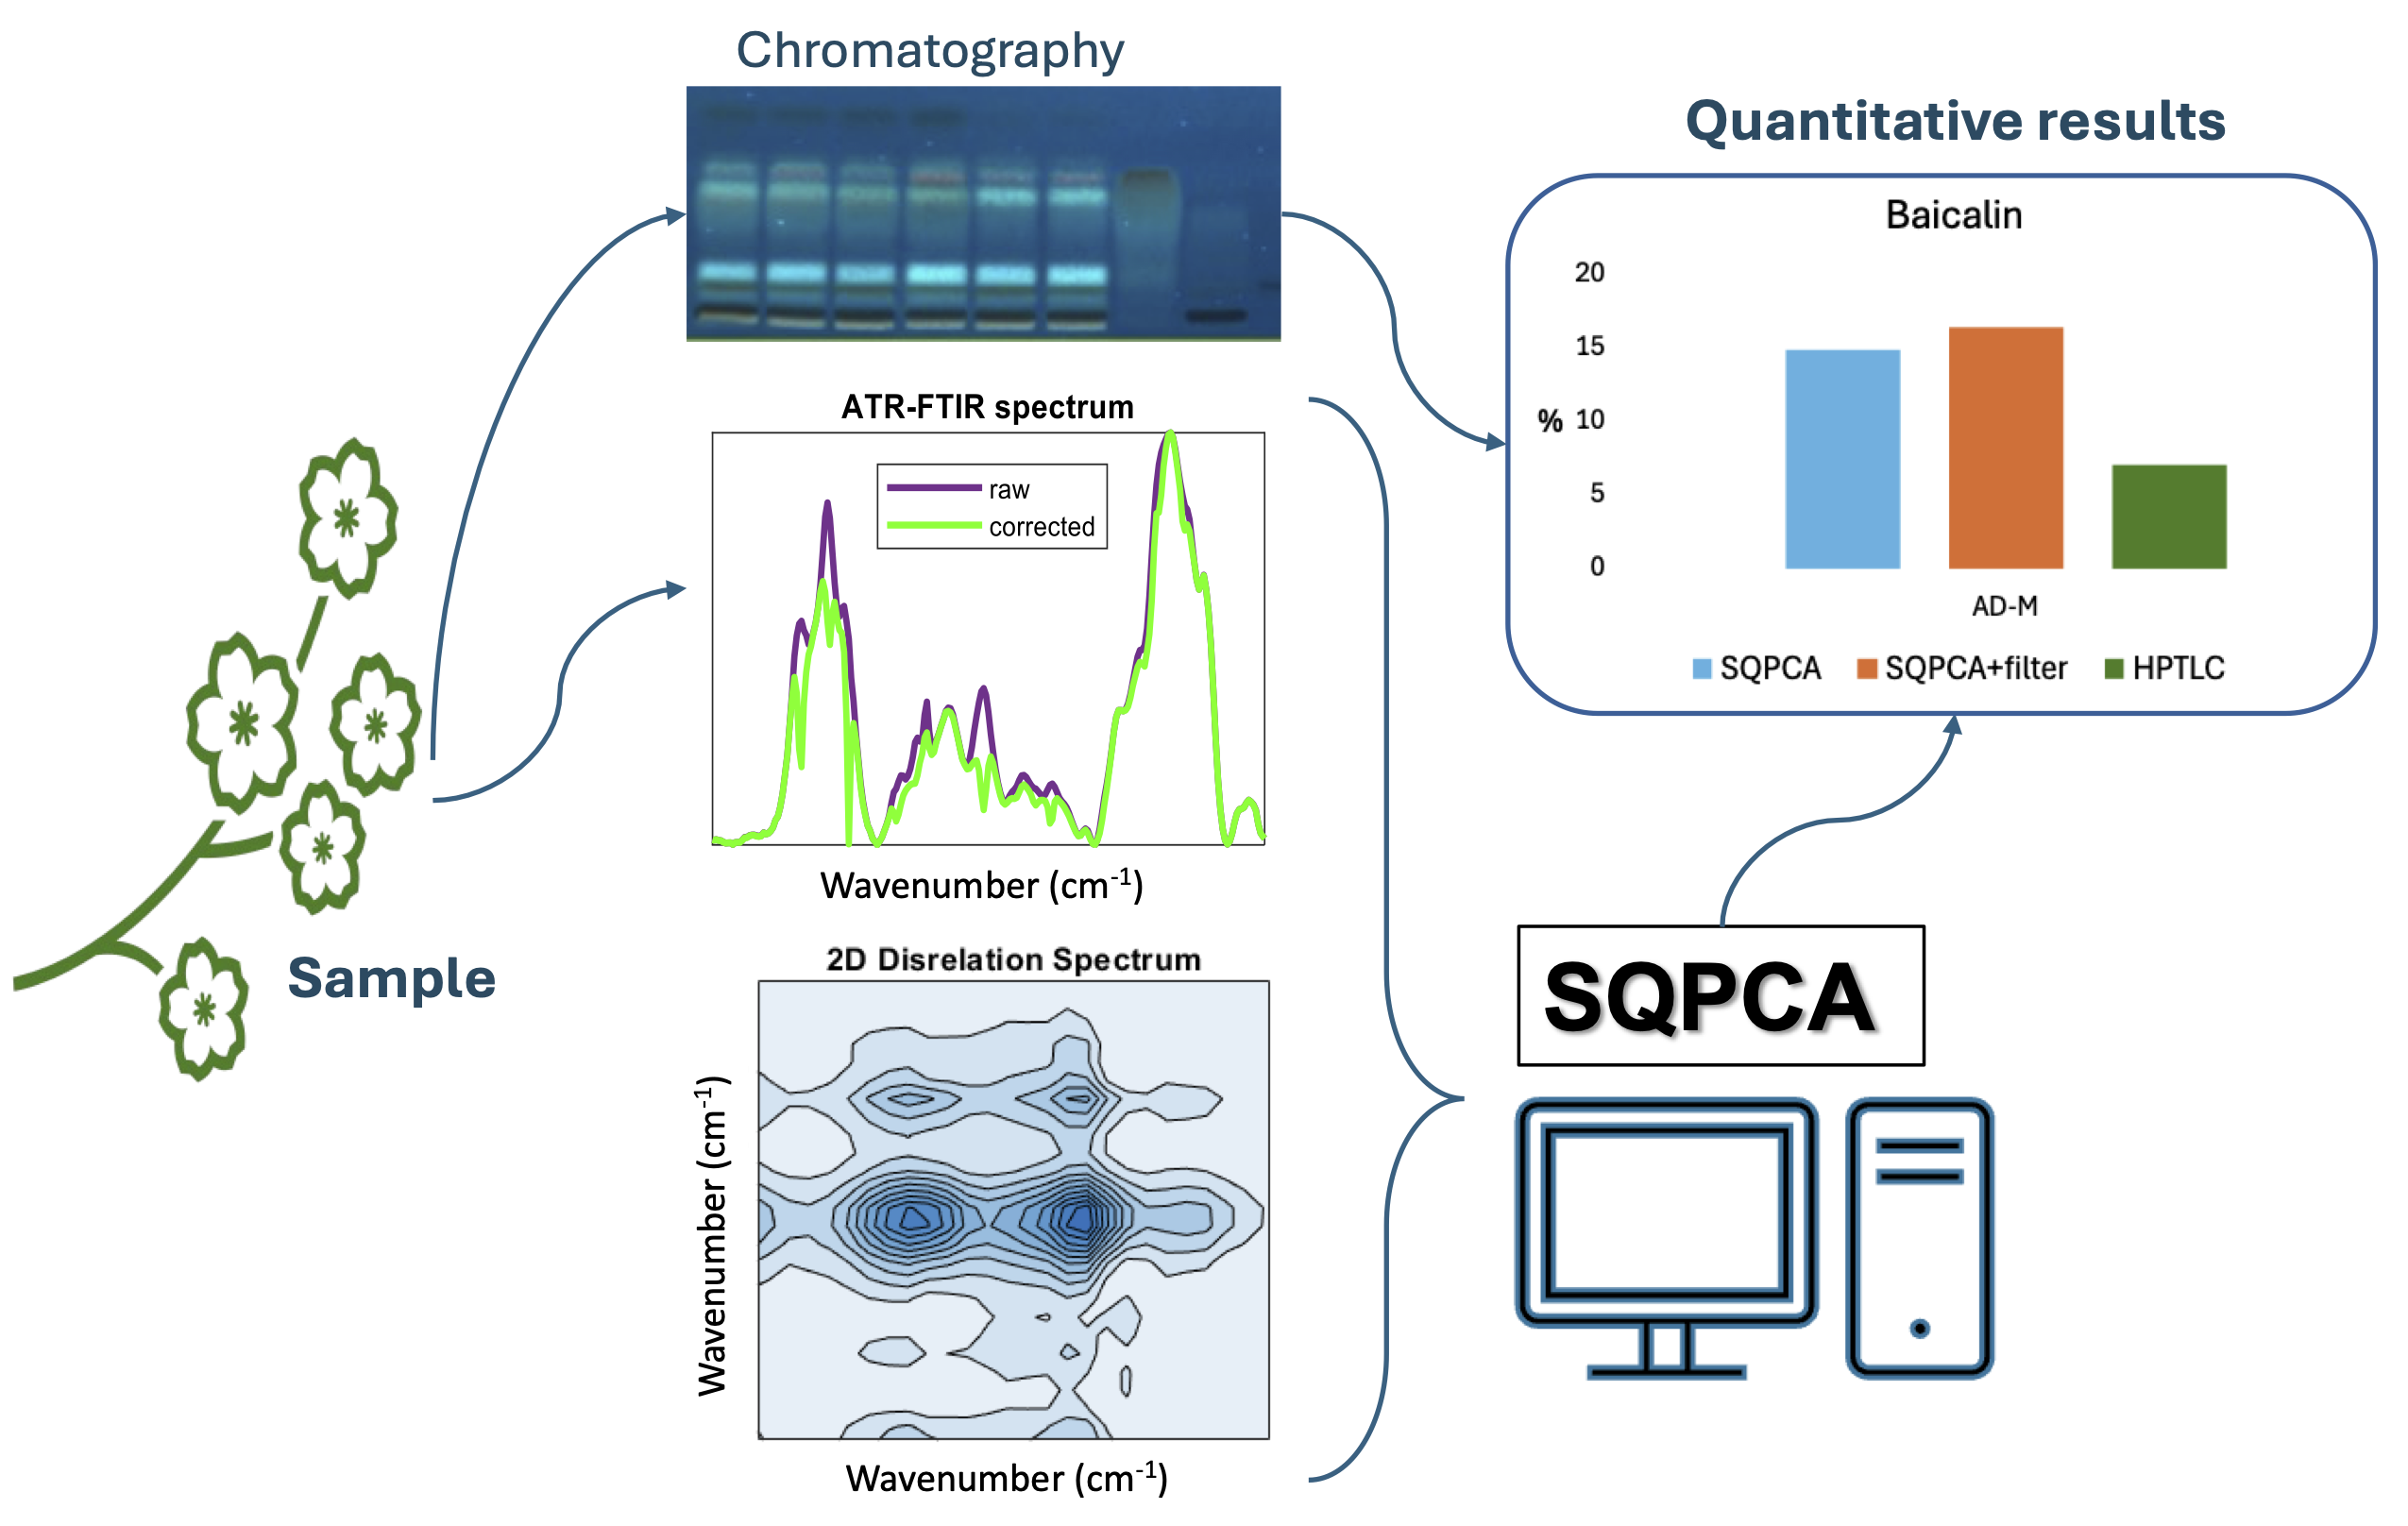
Keywords
Introduction
Instrumental signals obtained from complex chemical systems can be considered as fingerprints of the analyzed samples, bearing useful information mixed with useless information and experimental noise. To achieve a deeper understanding of these systems, it is necessary to apply dedicated data analysis strategies. Chemometric techniques have proven particularly useful for the analysis of multicomponent samples, as they address challenges including noise reduction, and identification and quantitation of individual constituents in complex mixtures. Among chemometric approaches, matrix decomposition techniques based on bilinear models, for example principal component analysis (PCA) and self-modeling curve resolution (MCR), play a central role.1,2 PCA is primarily used for dimensionality reduction and exploratory data analysis, enabling the detection of patterns, trends, and outliers in high-dimensional datasets. MCR focuses on resolving multicomponent signals, i.e., spectra, into estimates of pure component spectra and their corresponding concentration profiles, thereby facilitating the interpretation of complex chemical systems in terms of quantitative analysis.3,4
The use of PCA for quantitative analysis of multicomponent spectra has remained limited, due to the lack of a dedicated methodological framework enabling such applications. In previous papers,5,6 we introduced a general method of quantitative analysis, named score-based quantitative principal component analysis (SQPCA), which is based on PCA, and reveals its potential advantages in this context. SQPCA is a mathematical procedure that has been proposed as a supportive tool for spectroscopists, enabling routine screening to obtain information about the composition of analytes of interest in complex mixtures in the presence of interferents, which remains a significant analytical challenge. Despite its promising character, SQPCA has certain limitations. In many situations, experimental spectral profiles of the analytes have overlapping peaks or are quite similar, which can lead to misinterpretation, and this procedure becomes impractical. Since the proposed SQPCA method is relatively new, several additional areas need to be considered when many congested profiles, which are irrelevant from a quantitative analysis perspective, are present in the spectrum.
Preprocessing the data prior to performing PCA is a common procedure that often simplifies the subsequent data modeling. However, in spectroscopic data analysis, it should be used cautiously, as it can significantly affect the principal component space. A natural approach to improving data for analysis is the application of scale-preserving transformations, such as digital filters, which can greatly aid in the extraction of informative features. On the other hand, building an appropriate filter is a challenging task for the quantitative analysis of spectral data.
In the pursuit of suitable filters that accentuate the spectral features of interest while suppressing redundant contributions, two-dimensional correlation spectroscopy (2D-COS) emerges as a potentially valuable analytical tool. 2D-COS, first introduced in 1986 by Isao Noda and continuously developed over the subsequent four decades, constitutes a powerful technique for the examination of perturbation-induced spectral data sets (Noda 7 and references therein). The two orthogonal axes of spectral variables define a 2D map yielding synchronous or asynchronous spectra of correlation between spectral intensities measured at two separate spectral variables (e.g., wavelength, frequency, or wavenumber). In 2018, Noda introduced and, in 2020, expanded a modification called two-trace two-dimensional correlation spectroscopy (2T2D-COS).8,9 This new idea of 2D-COS modification sparked the rapid development of applications that require only two spectra for analysis, without the need for perturbations. Over the last five years, comprehensive reviews10–14 have been published that mark the accelerated growth of 2D-COS and 2T2D-COS applications that span food and pharmaceutical analysis, biomedicine, environmental science, polymer chemistry, and beyond. Furthermore, 2D-COS is frequently combined with chemometric techniques. The role of 2D-COS and 2T2D-COS in chemometric workflows is primarily that of a feature extraction and variable selection tool. Both synchronous and asynchronous 2D correlation spectra, as well as disrelation and discrimination maps, are used to identify characteristic wavenumbers or wavelength regions, which are then employed as input data for various chemometric models, including partial least squares regression (PLSR) and its variants, support vector machines (SVM), principal component analysis, linear discriminant analysis (LDA), and deep learning architectures such as residual neural networks (ResNet) and convolutional neural networks (CNN).
In this paper, we propose a robust SQPCA approach to quantify components when they are similar in terms of characteristics and spectral profile behavior. Inspired by the work of Noda et al., 15 we designed a multiplicative filter, i.e., disrelation filter (DF), to selectively attenuate the contributions of interfering profiles. The filter function is proposed as a type of spectral data pretreatment before quantitation analysis. Such pre-processing improves spectral data resolution, enabling more accurate results obtained with SQPCA. The performance of the proposed SQPCA-DF approach has been tested on complex signals derived from attenuated total reflection Fourier transform infrared (ATR FT-IR) spectroscopy. For testing purposes, we used extracts from Scutellaria baicalensis Georgi (SB) roots prepared in our recent study. 16 The Scutellaria baicalensis root contains several biologically active compounds, primarily flavonoids (including free flavonoids and their glycosides). The most prevalent are baicalin, baicalein, wogonin, and wogonoside, and our quantitative analysis focused on these four analytes.
Experimental
Materials and Methods
In this study, we used selected samples from our previous experiment, whose results were published in Światły-Błaszkiewicz et al. 16 The roots of Scutellaria baicalensis Georgi were collected from the Medicinal and Cosmetic Plants Garden at Collegium Medicum, Nicolaus Copernicus University in Torun, Poland.
Before extraction, roots were dried using two methods: (i) freeze-drying (FD) at –20 °C for three days and (ii) air-drying (AD) at 21–25 °C for four weeks. Dried roots were ground to a powder and then extracted using three techniques, reflux extraction (RE), maceration (MA), and ultrasound-assisted maceration (UAE). The detailed sample preparation is described in. 16 In this study, we used roots collected in September, yielding six samples prepared in triplicate. The dried extracts were stored at –20 °C before analysis. In addition, the sample set included one commercially available product, a powdered extract from SB roots with a reported baicalin purity of 95% (as provided by the manufacturer).
HPTLC Analysis
All flavonoid standards were prepared in a concentration of 1 mg/mL in methanol. The chromatographic separation was performed on silica gel 60 F254 high-performance thin-layer chromatography (HPTLC) plates (10 × 10 cm). Samples were applied as bands (5 µL, band width 10 mm) using a Linomat 5 applicator (CAMAG, Switzerland). Chromatogram development was performed in a classical twin-trough chamber containing 30 mL of the mobile phase. The chamber was saturated with the mobile phase for 30 min prior to development. The mobile phase consisted of chloroform:ethyl acetate:methanol:formic acid 7:3:1:1 (v/v/v/v). The separation distance was 70 mm, and the process was carried out at room temperature. Plates were scanned before and after derivatization with a mixture of FeCl3 or NP, with PEG or AlCl3, and heated at 105 °C for 5 min. Chromatographic images were recorded using a TLC Visualizer 2 (CAMAG) at wavelengths of 256 nm and 366 nm, as well as under visible light. The obtained chromatograms were digitally processed and analyzed using the HPTLC software VisionCATS 3.1 (CAMAG). Linear calibration curves for baicalin, baicalein, wogonin, and wogonoside were established over the range of 0.1–6 μg. The determination coefficients (R2) ranged from 0.955 to 0.998, and the coefficients of variation (CV%) ranged from 3.36% to 13.99%.
ATR FT-IR Measurements
The FT-IR spectra were recorded using a Shimadzu 8400S spectrometer (Japan) equipped with an ATR germanium crystal accessory (Pike Technologies, USA). A small amount of the sample (dried extract) was placed on the ATR crystal and pressed by a clamp with constant pressure. Absorbance mode was used for the measurements, within a wavenumber range of 4000–650 cm–1, with a nominal resolution of 2 cm–1. A total of 30 scans were averaged to achieve an optimal signal-to-noise ratio. After each measurement, the crystal was cleaned with ethanol, and a new background scan was performed. Spectra were corrected using the instrument-default correction, and the same procedure was applied to all spectra. The incidence angle in the ATR tool was 45°, and the light was non-polarized.
Data Analysis
Data analysis was carried out in Matlab 2024a (The MathWorks Inc., USA) using in-house-written scripts and the PLS Toolbox (Eigenvector Research Inc., USA). Data visualization was made using Matlab and MS Excel 2025 (Microsoft, USA).
Prior to SQPCA and 2T2D correlation, baseline correction using the automatic Whittaker filter (λ = 100, p = 1 × 10⁻⁵) was applied to spectral data. Further analyses were performed on the corrected spectra in the wavenumber range of 1800–900 cm–1.
Theory
In spectroscopy, most quantitative studies involving multivariate statistical methods have used two basic approaches, classical least squares (CLS) or multivariate linear regression techniques. These methods generally assume a linear relationship between absorbance and component concentration or optical path length. The CLS method assumes the Beer’s law model, in which the absorbance at each frequency/wavenumber is proportional to analyte concentration, and the absorbance of a mixture equals the sum of the absorbances of the components. In matrix notation,
17
Beer’s law model for a set of multicomponent spectra,

It should be noted that the Bouguer–Beer–Lambert (BBL) law is only an approximation to the full electromagnetic description of light–matter interactions, even for homogeneous and chemically non-interfering systems, as discussed in the recent literature.18–21
If the pure component spectra are known, the concentrations for a new sample can be estimated using the CLS solution

A major limitation of the CLS approach in multicomponent analysis is that it requires prior knowledge of the spectra of all components present in the system, including potential interfering species. If the pure component spectra are unknown, Eq. 1 can still be resolved using self-modeling curve resolution methods, such as MCR, 2 which do not require explicit prior knowledge of all component spectra. The most widely used implementation is MCR-ALS,3–4 which iteratively optimizes concentration and spectral profiles in an ALS framework. However, due to rotational ambiguity, these profiles are not uniquely defined and lack an absolute scale unless additional constraints or calibration steps are introduced. Therefore, MCR is typically combined with regression-based calibration or applied under suitable constraints (e.g., non-negativity, closure) to enable quantitative interpretation. Despite these limitations, MCR offers significant advantages, particularly in complex systems, due to its ability to exploit the second-order advantage and resolve analytes in the presence of unknown interferences. Recent studies emphasize that increasing the signal contribution of each component can reduce systematic errors in quantitative analyses caused by rotational ambiguity, and the accuracy of results obtained from self-modeling methods can be significantly improved. 4
An approach provided by PCA
1
does not rely on explicit physicochemical model such as Eq. 1. The concept of PCA in spectroscopic applications provides an approximation of the data matrix,

In contrast to self-modeling approaches, PCA does not suffer from rotational ambiguity, as the solution is defined by the orthogonality constraint imposed on the principal components and the maximalization of explained variance and thus generally unique. It should be realized that although PCA model can provide crucial chemical information, it does not discover the real concentration of the analytes straightforwardly. To obtain this information from a multicomponent spectrum in the presence of unknown interfering compounds, we have developed a novel chemometric method, named SQPCA.5,6 SQPCA provides a direct solution via singular value decomposition, which is entirely free from rotational ambiguity and from sensitivity to initial estimates. Furthermore, SQPCA achieves the second-order advantage, that is, the quantification of an analyte in the presence of unknown interferents using exclusively first-order spectral data. The ability to extend this advantage to single-vector, first-order data is, in our view, a substantive methodological contribution. Finally, the calibration set in SQPCA is generated in silico from experimentally obtained pure reference spectra, requiring no additional laboratory measurements of reference mixtures.
The SQPCA Algorithm
For a comprehensive description of the SQPCA algorithm, we refer to Balcerowska-Czerniak and Kupcewicz
5
and Balcerowska-Czerniak,
6
which provide a flow diagram illustrating the procedure. Here, we outline only the main idea of the algorithm. The starting point of the SQPCA method is the assumption that a spectrum of mixture of pure component spectra, for example, three, A, B, and C, of non-interacting analytes, can be expressed as a linear combination

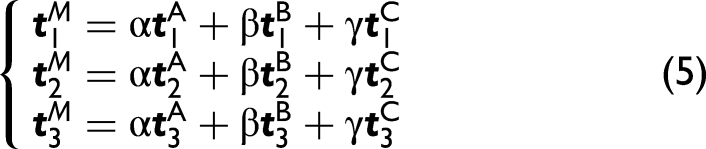
If the pure chemical spectra A, B, and C are known, the concentrations of each component in the mixture M can be obtained from

This algorithm for finding the concentration vector c can be generalized to a larger number of pure components/reference spectra. It should be noted that in the SQPCA algorithm, the number of reference spectra, z (z = 3 in this case), determines the dimension of the score space and the appropriate number of PCs to use in the analysis. It contrasts with the typical use of PCA modelling, where the main task is to find the optimal PC subspace of a certain fixed dimension.When analyzing a real complex sample, the full set of spectral components is usually not known in advance, and only a few are typically of interest. The SQPCA approach is specifically designed for such cases. The PC model is therefore expanded to z + 1 dimensions, regardless of the number of interfering spectral components, and a new mixture spectrum (Mnew) is represented as

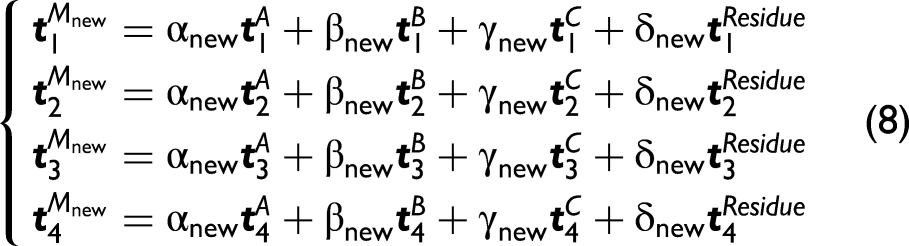
This model can be used to predict the interested reference analyte concentrations αnew, βnew, γnew, and δnew. To solve the system of equations (Eq. 8), the spectral shape of the pure components A, B, C, and Residue should be known. In practice, the SQPCA method requires only reference spectra of the analytes of interest (A, B, and C) in an unknown mixture, whereas the Residue spectrum is determined within the SQPCA procedure. This is possible because the procedure employs a machine-learning scheme in which a PCA calibration model is first constructed using reference-based spectral mixture simulations with concentrations randomly varied from 0% to 100%. Therefore, the approach eliminates the need to prepare empirical mixture datasets for calibration purposes.
It is also worth noting that the SQPCA method does not rely on the strict validity of the Bouguer–Beer–Lambert law in the spectral domain. Rather, this approach presumes that PCA scores exhibit approximately linear relationships between component contributions in principal component space. Nonlinear optical effects can be included in the Residue when the pure spectra do not strongly overlap, and the nonlinear effects remain small. When spectral band overlap is strong, results are more accurate for narrow spectral lines. Moreover, if the mixture spectra are congested by too many interfering bands, the use of SQPCA requires considerable caution, and external validation is recommended.
2T2D Correlation Spectroscopy
As originally proposed by Noda,8,9 two-trace two-dimensional (2T2D) correlation spectra between a pair of spectra


A disrelation spectrum is a powerful tool to classify spectral features arising from different species.13,14
Disrelation Filter (DF)
In many spectroscopic data applications, only specific portions of the information are relevant for analysis. For a complex mixture spectrum (M) with the analogy to Eq. 7, this can be briefly described by

Since the main aim of this study is to demonstrate the potential of SQPCA as a tool for quantitative analysis of mixtures, the M should be transformed to maximize information about the analyte of interest while minimizing contributions from residual components. This is not a trivial task when spectral signals from different analytes overlap.
In the study, we propose using the 2T2D disrelation spectrum (Eq. 10) to distinguish spectral features arising from different species and for separating spectral information into a structure part related to the analytes and a part associated with irrelevant species. During the analysis, it was found that the slice spectrum at the characteristic band position
The initial step in constructing the filter transfer function is to calculate the 2D disrelation spectrum between the sample spectrum M, denoted as

The filtered (corrected) mixture spectrum

Results and Discussion
ATR FT-IR Spectra
Under the experimental conditions mentioned in the Experimental section, six extracts from Scutellaria baicalensis roots and Baicalein 95% powder sample were prepared in triplicate. ATR FT-IR spectra for samples and four flavonoid standards were recorded in the same way. Figure 1a shows the FT-IR spectra for the analyzed flavonoids, while Figure 1b displays the average spectra of six extracts from Scutellaria baicalensis roots. The analysis was focused on the wavenumber range of 1800–900 cm–1, selected to include the most distinctive spectral bands. FT-IR spectra (Figure 1a) highlight the structural differences among flavonoids; however, when the structures are similar, distinguishing them using vibrational spectra becomes challenging. Another demanding process is the identification of flavonoids in mixtures and in plant material, in the presence of components that significantly interfere with flavonoid signals as shown in Figure 1b.
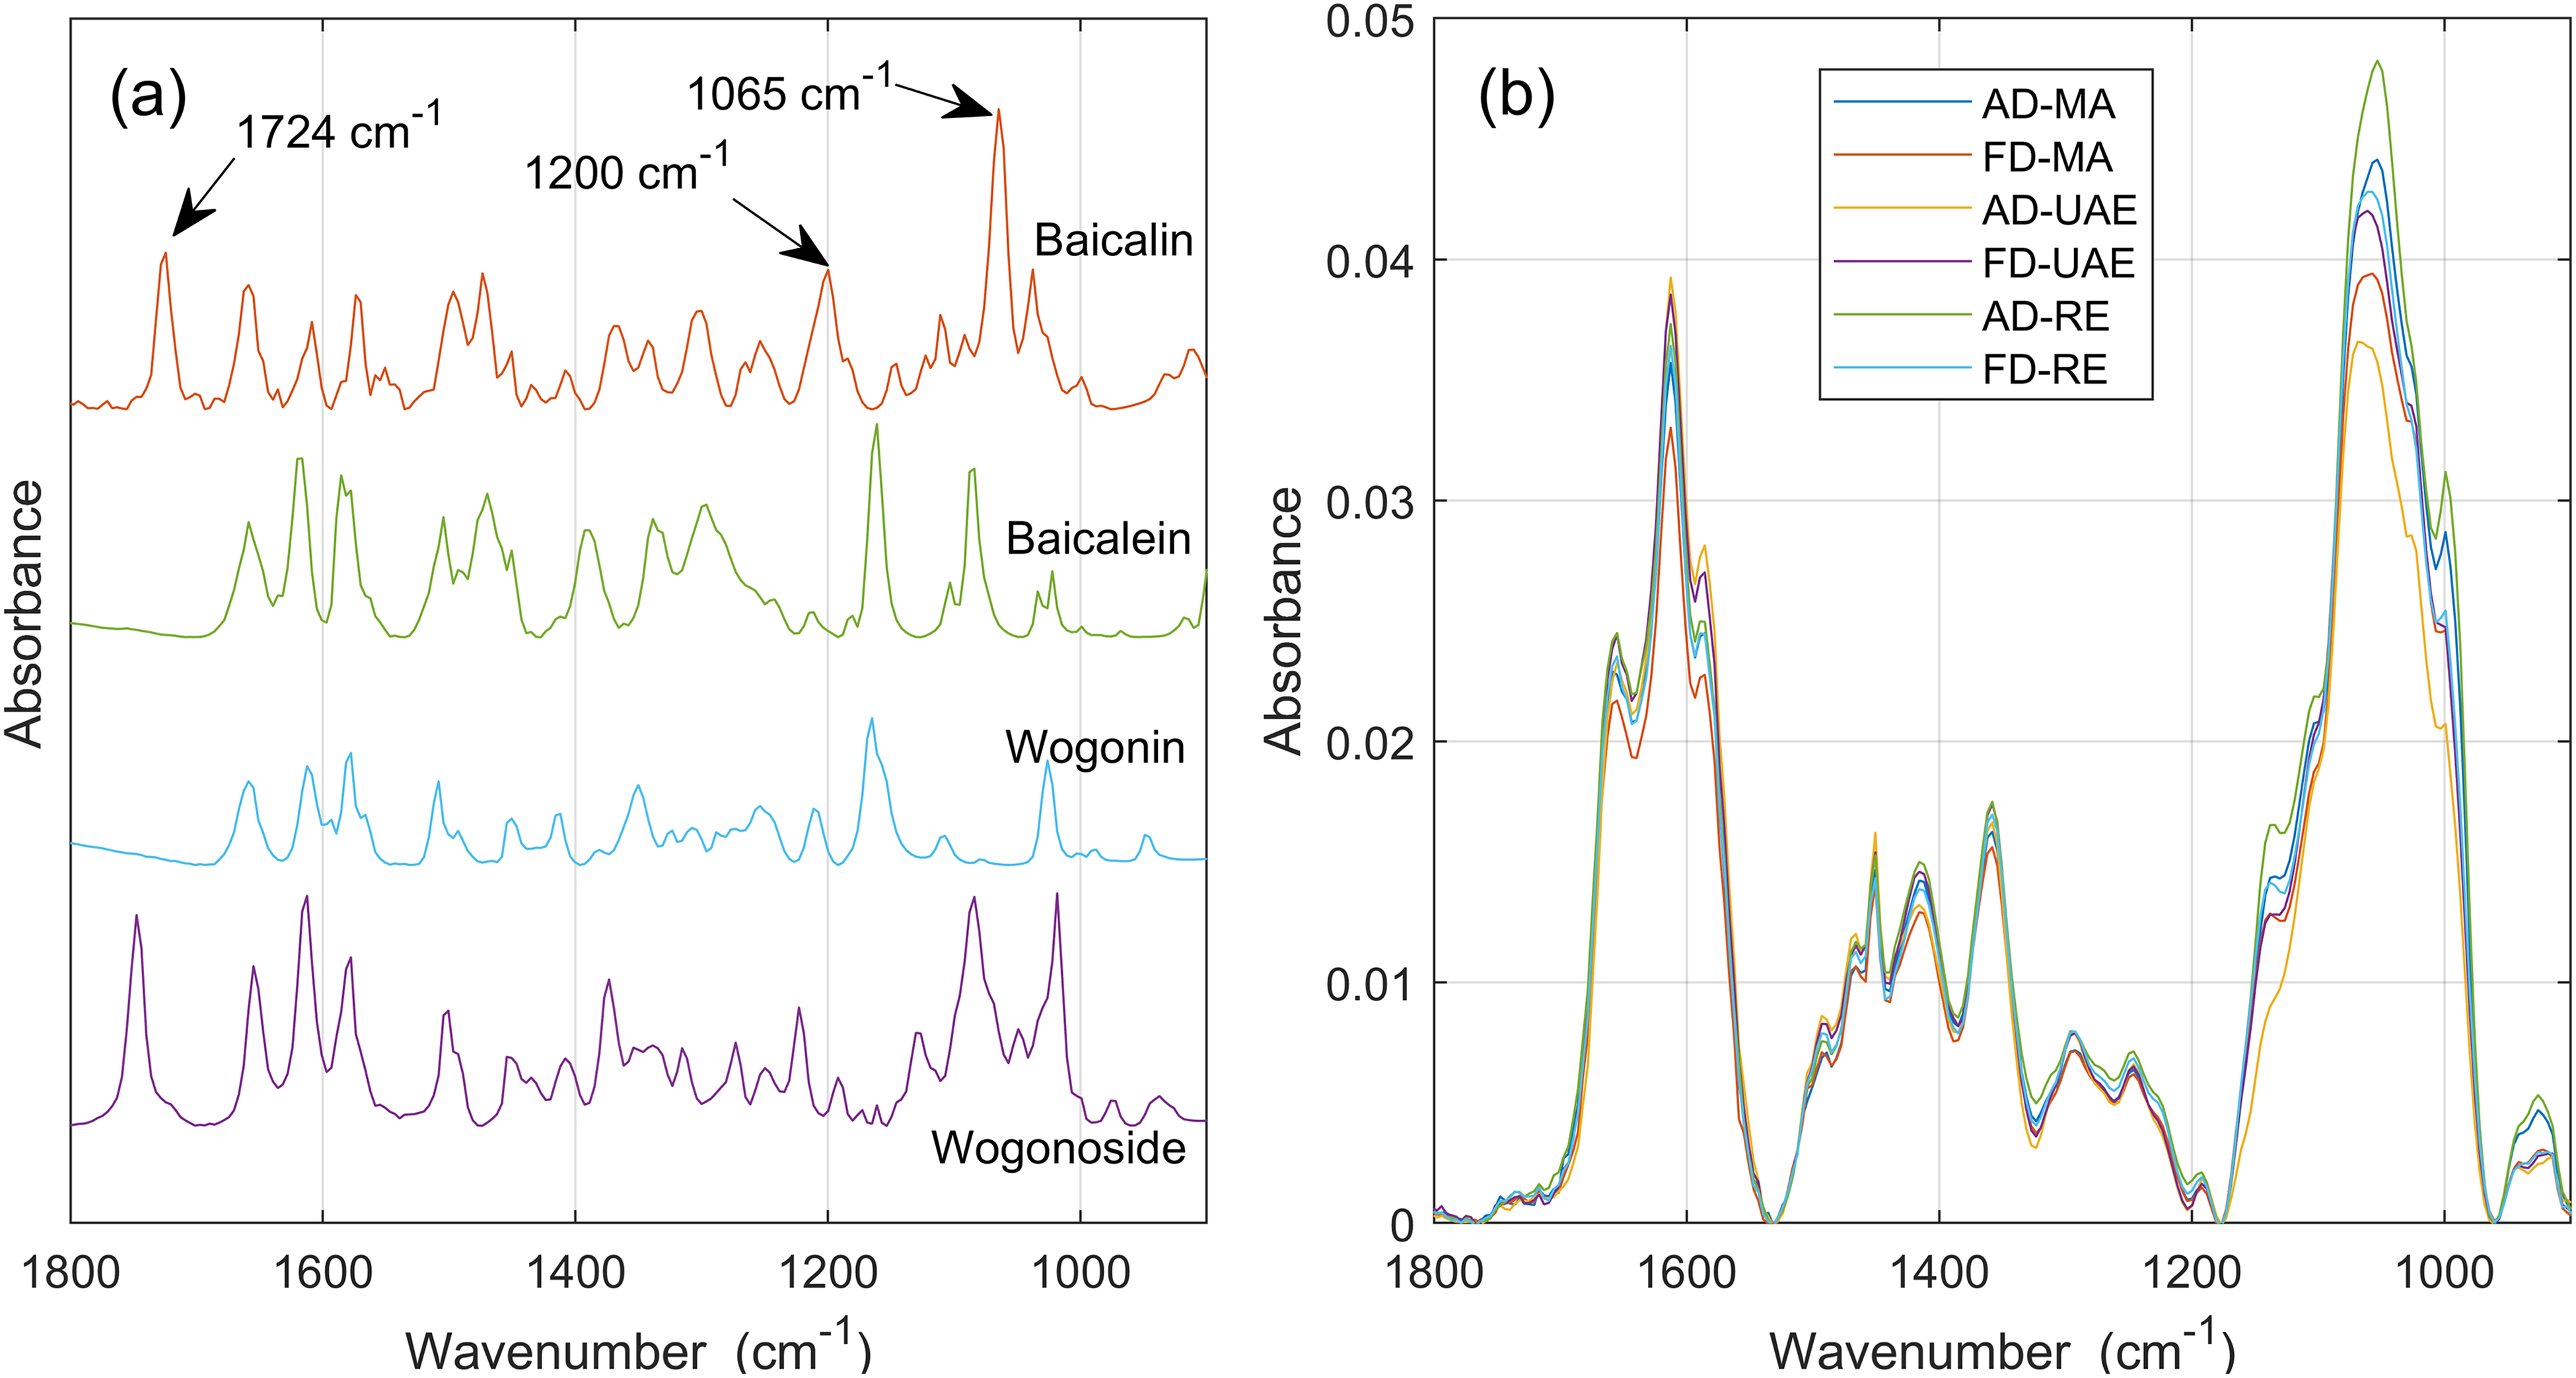
(a) ATR FT-IR spectra of flavonoids baicalin, baicalein, wogonin, and wogonoside. (b) Spectra of samples–extracts from Scutellaria baicalensis Georgi roots.
The subject of analysis remains the same raw plant material (SB root), and differences in sample composition may arise from variations in drying methods, i.e., air-dried (AD), freeze-dried (FD), and extraction conditions, e.g., maceration (MA), ultrasound-assisted extraction (UAE), and reflux (RE). As can be seen, the spectra contain wide, congested bands which are remarkably similar, particularly within the wavenumber range of 1800–1200 cm–1. This observation may suggest that the samples have comparable compositions, including flavonoid concentrations.
Plant material presents a naturally complex matrix, resulting in both vibrational and UV–Vis absorption spectra with strongly overlapping bands, making the identification of constituents difficult. To address these challenges and enhance spectral resolution, 2T2D-COS may be employed.8,9 In our previous research,22,23 we used 2T2D correlation spectra, subsequently analyzed by multi-way principal component analysis (MPCA), to successfully discriminate between samples containing extracts of Ginkgo biloba leaves adulterated with flavonoids. In this study, 2T2D correlation spectra were also demonstrated to be useful.
SQPCA Integrated with the Disrelation Filter
Based on the pure spectra of the flavonoids (Figure 1a), the SQPCA model was developed to quantify an individual component in root extract samples, whose ATR FT-IR spectra are shown in Figure 1b. The baicalin 95% powder sample was also subjected to quantitative analysis as a validation sample (Sample1). According to the adopted SQPCA scheme, synthetic model mixture spectra with randomized flavonoid concentration values was used for calibration. Then, the concentrations of baicalin, baicalein, wogonin, and wogonoside in each sample (mixture M) were predicted individually. In this study, we compare SQPCA results for raw data and data initially filtered by DF with those obtained by HPTLC analysis.
The SQPCA-DF proposed approach includes four steps for data preprocessing:
(i) Construction of 2T2D disrelation spectrum ( (ii) Finding the coordinates ( (iii) Using the selected slice to construct a multiplicative disrelation filter according to Eq. 12, (iv) Preprocessing (correction) the data following Eq. 13.
For demonstration purposes, we select two samples: baicalin powder (Sample 1) and AD-MA extract (Sample 2). Figures 2 and 3 illustrate the DF construction process for Sample 1 and Sample 2, respectively. Figure 2a shows the disrelation spectrum with baicalin powder as
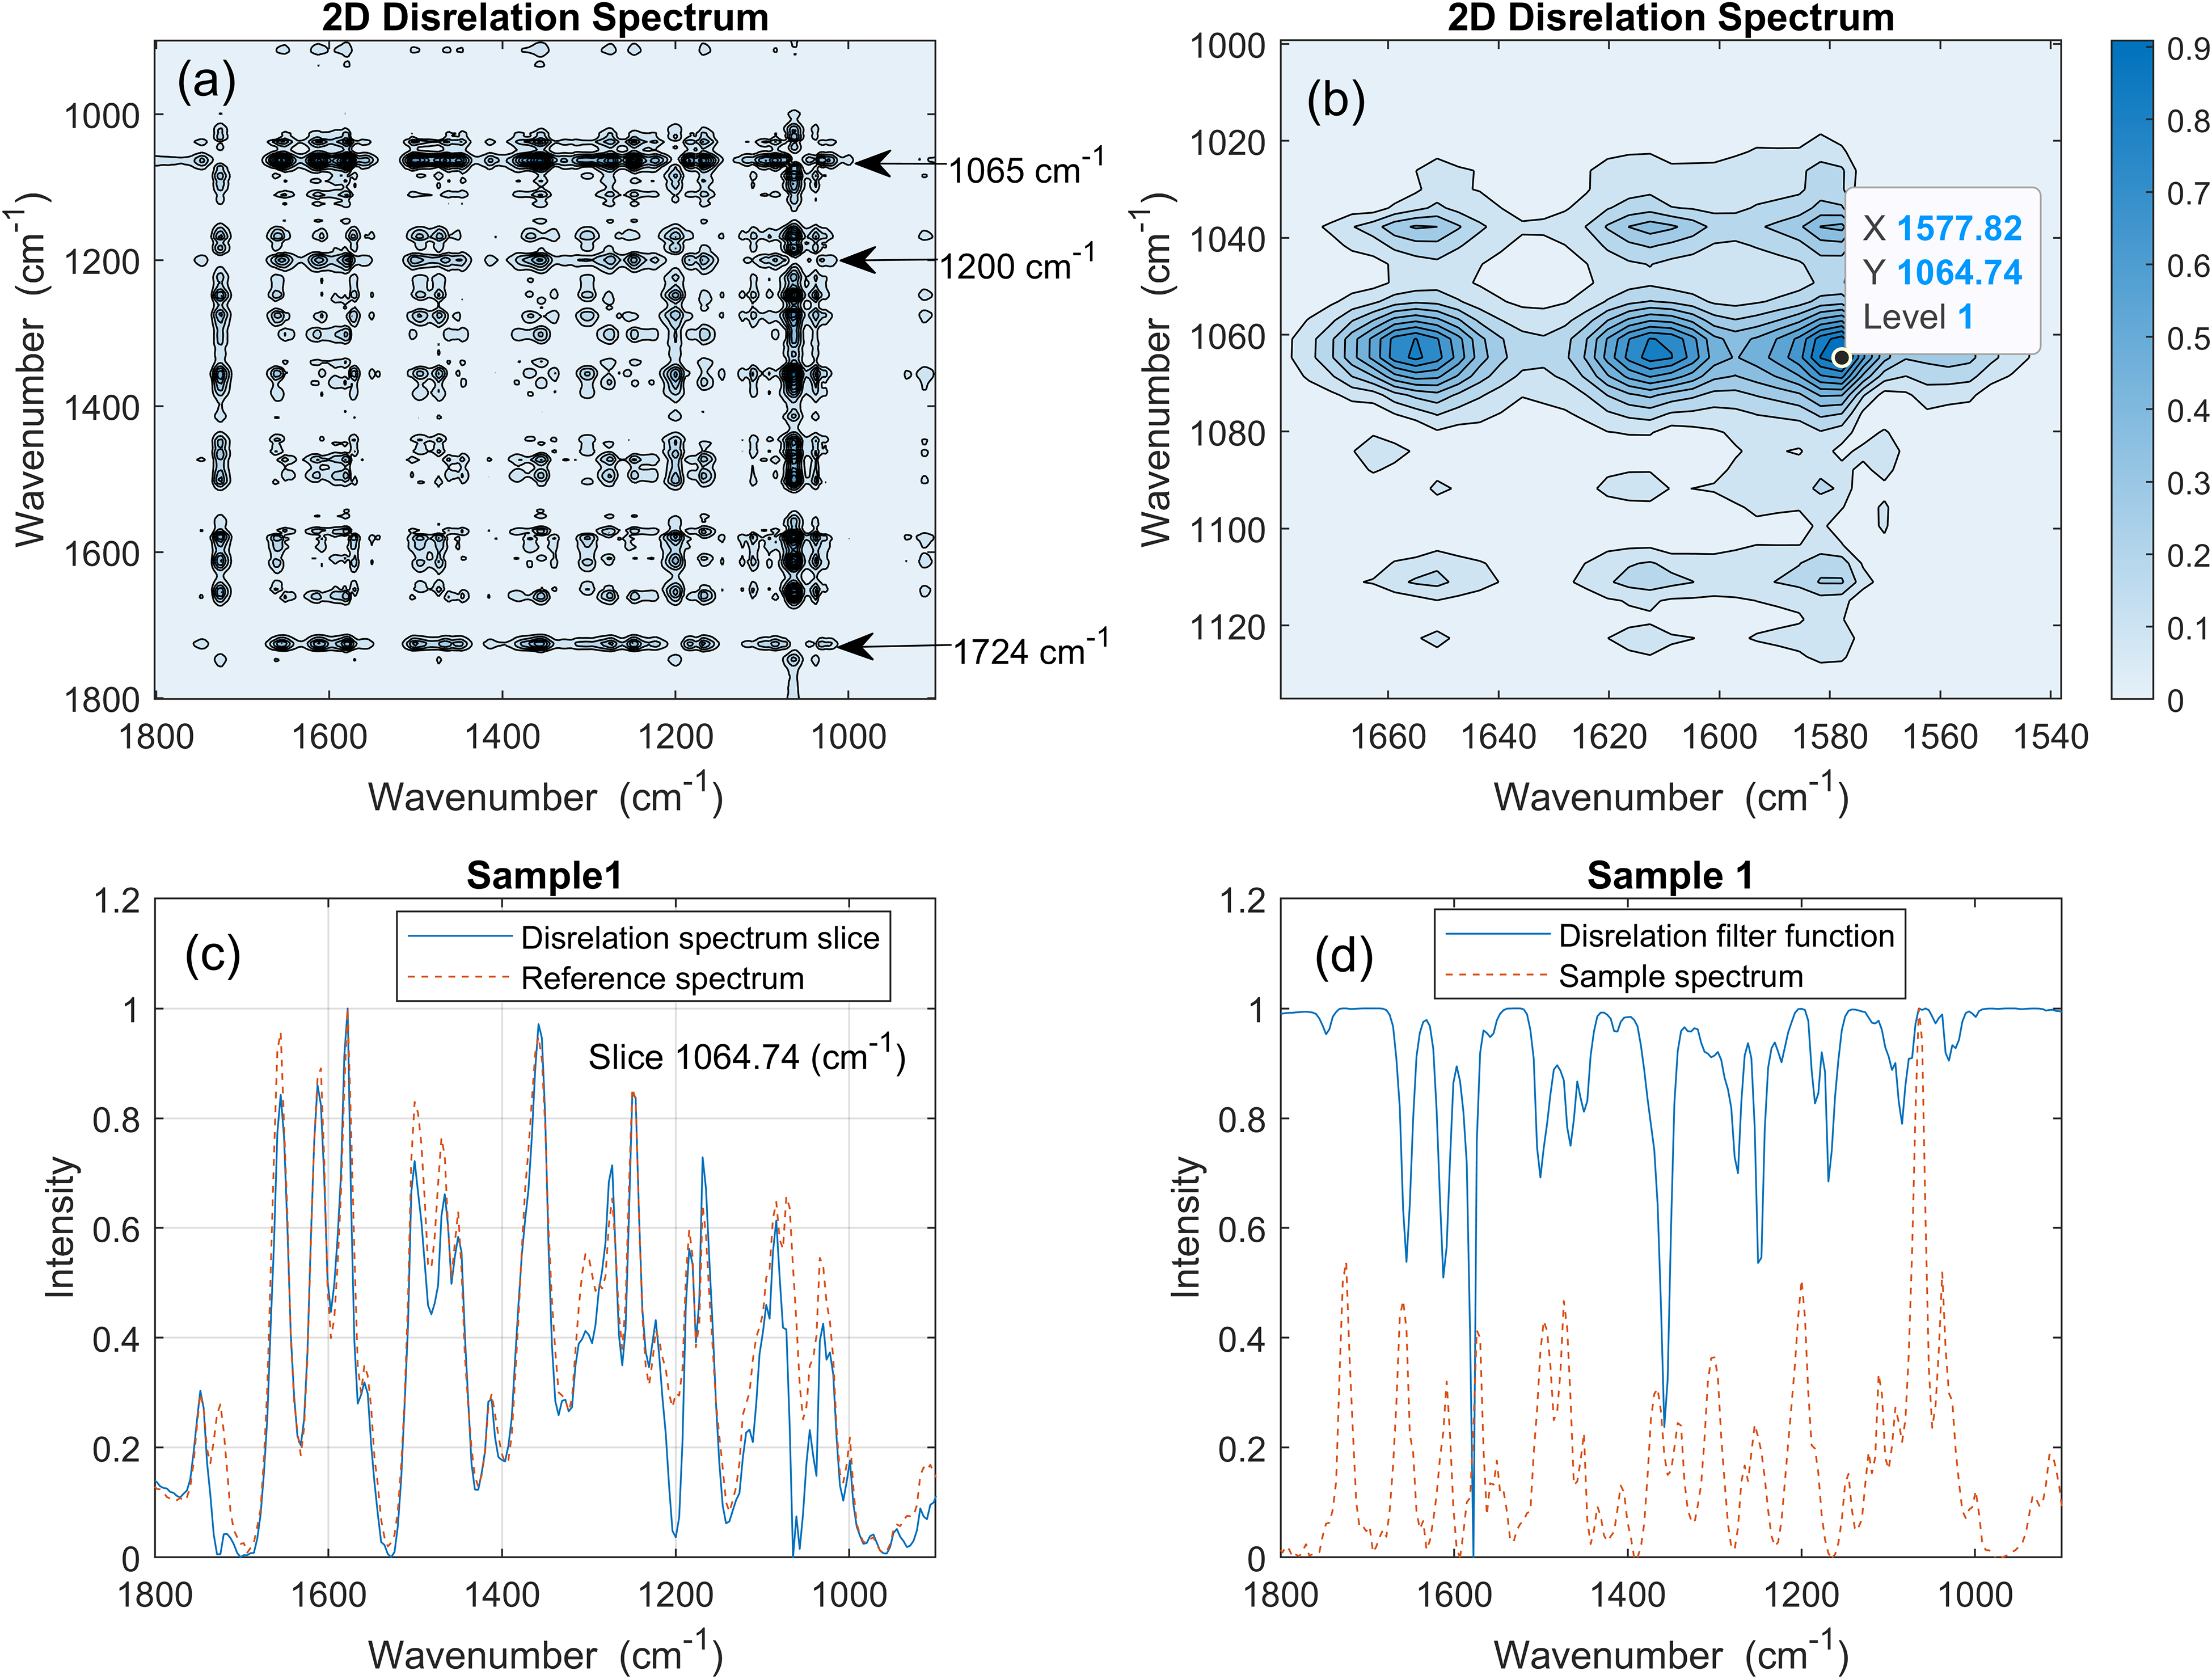
(a) 2T2D disrelation spectrum of Sample 1 (commercially available baicalin 95%) versus Reference spectrum average spectrum of flavonoids, and (b) close-up of the strongest cross-peak. (c) The horizontal disrelation spectrum slice at 1064.74 cm–1 for Sample 1 and Reference spectrum. (d) Visualization of the disrelation filter function and the Sample 1 spectrum.
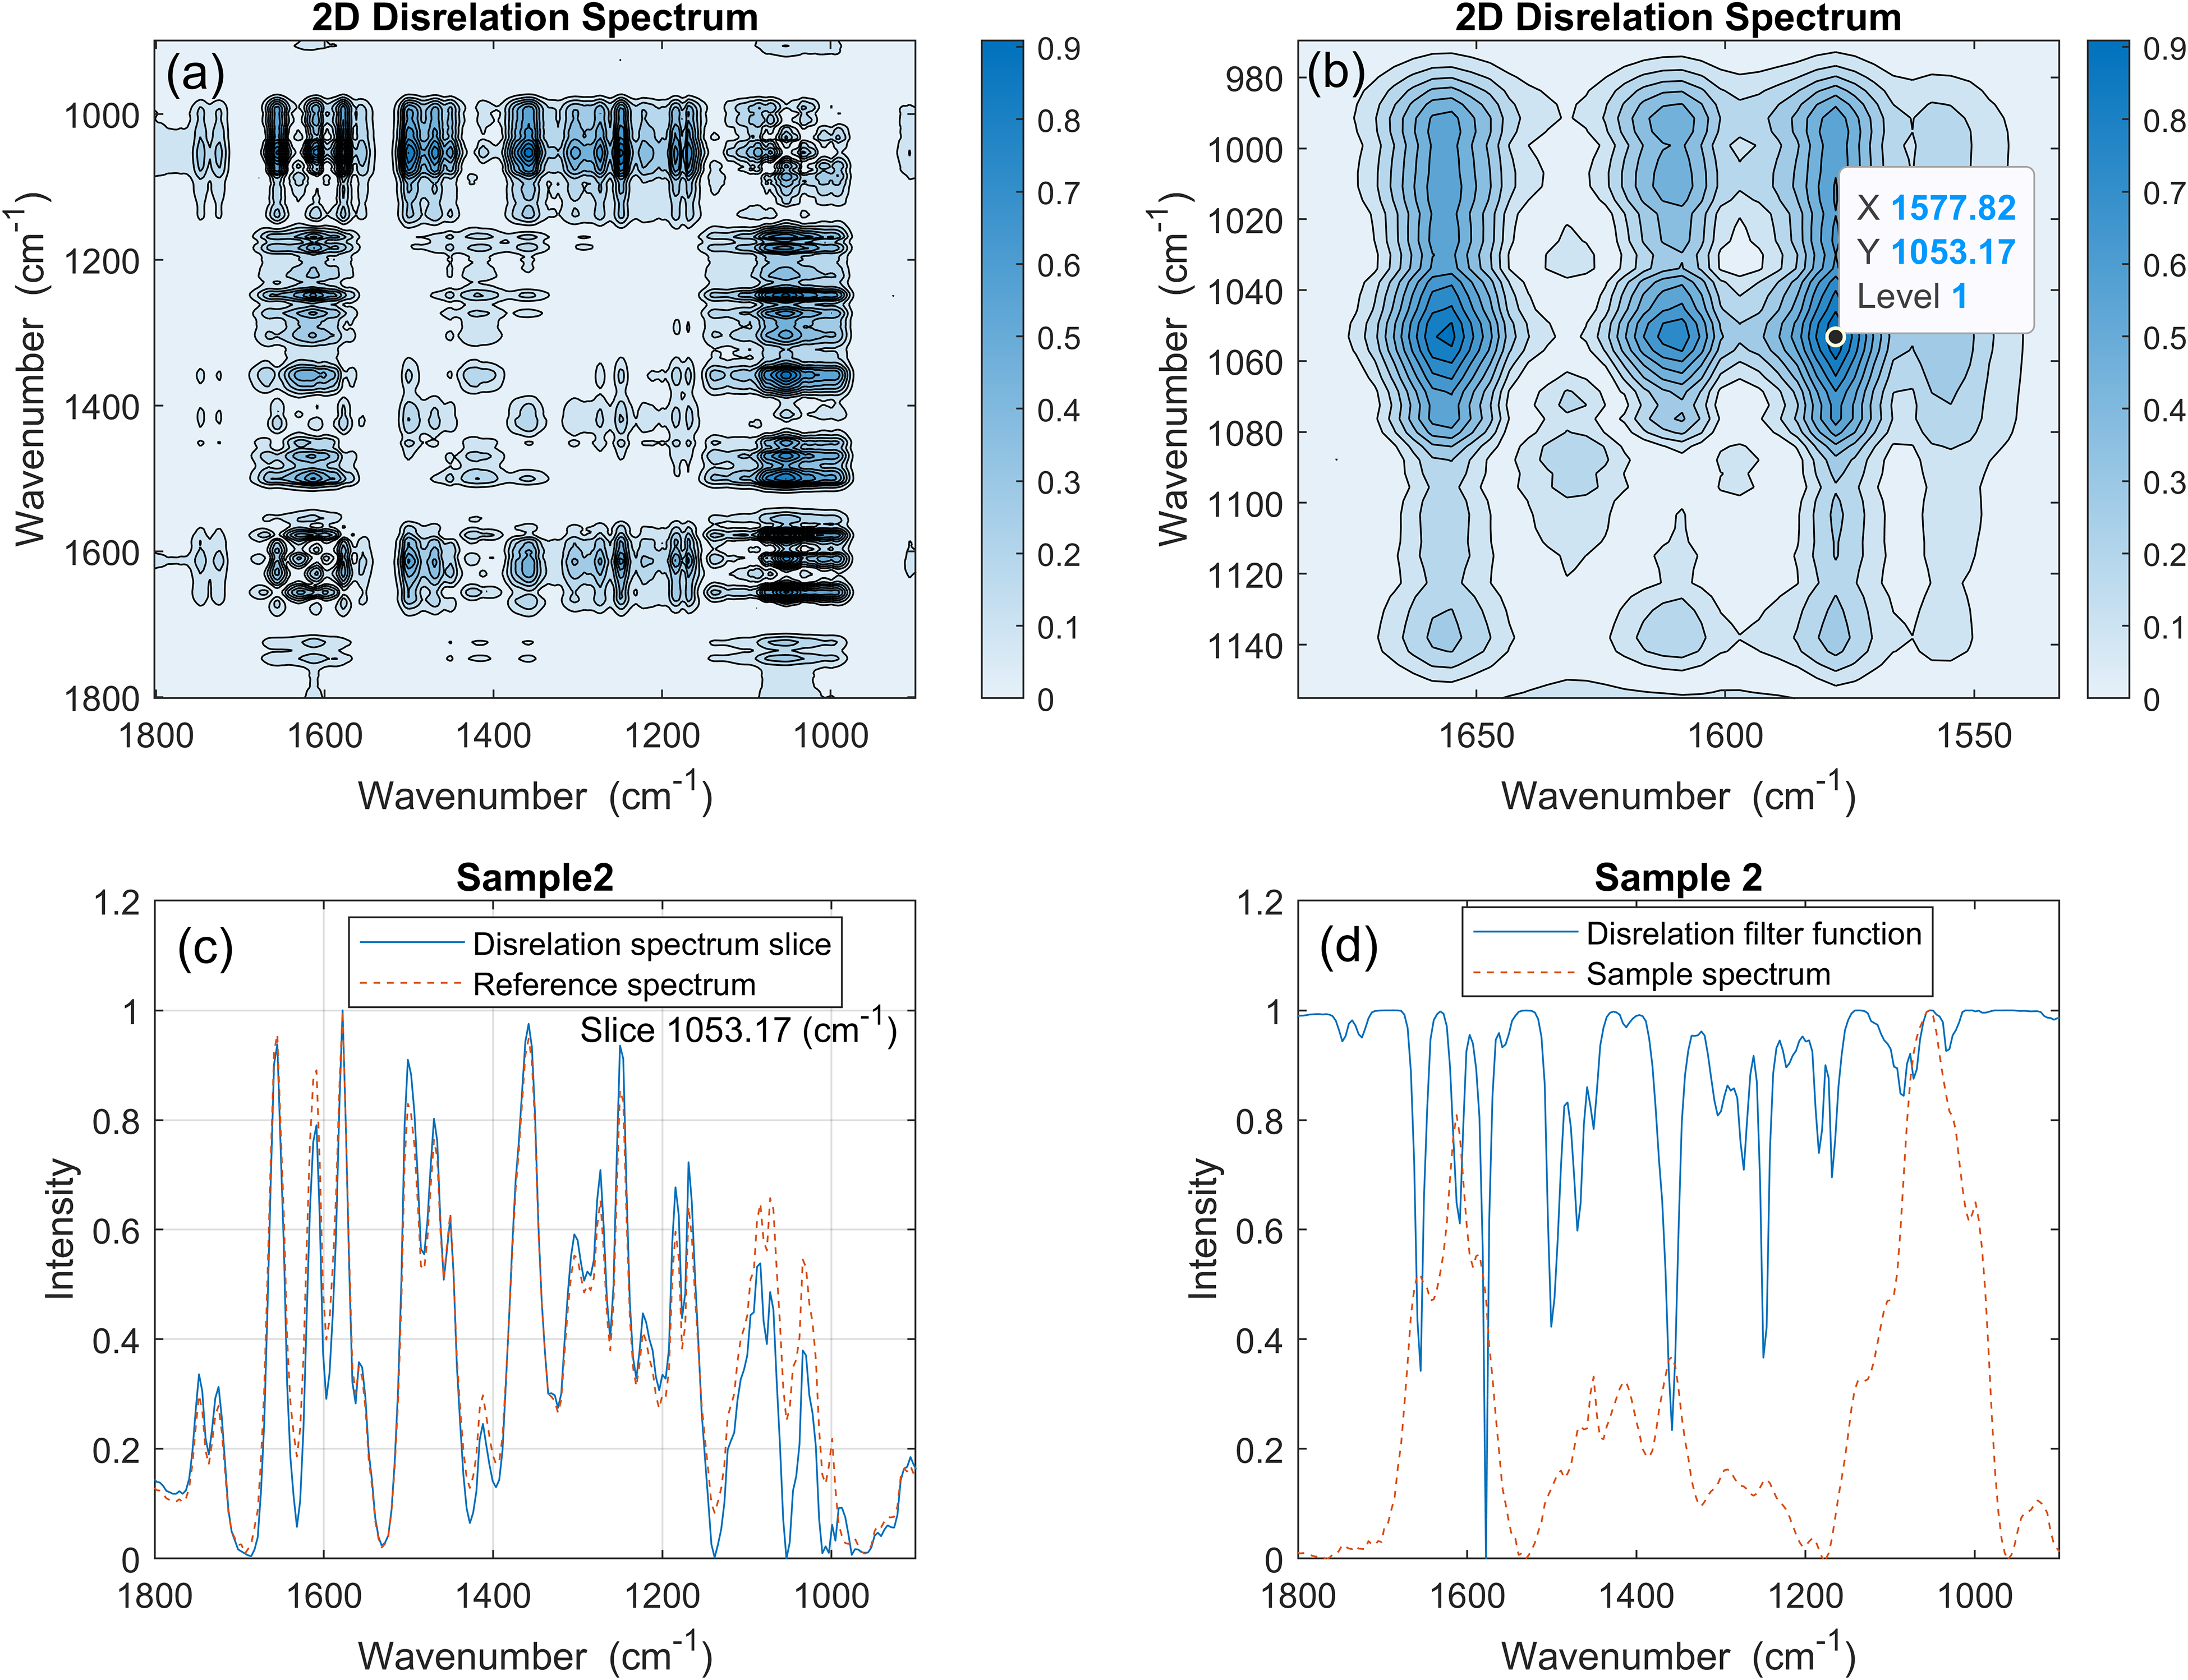
(a) 2T2D disrelation spectrum of Sample 2 versus Reference spectrum, i.e., average spectrum of flavonoids, and (b) close-up of the strongest cross-peak. (c) The horizontal disrelation spectrum slice at 1053.17 cm–1 for Sample 2 (AD-MA) and Reference spectrum. (d) Visualization of the disrelation filter function and the Sample 2 spectrum.
In turn, the shape of the disrelation filter function superimposed on the sample spectrum allows identification of which spectral bands of the sample will be modified or removed (Figure 2d). The values of each filter function range between zero and one, and they represent the portion of the spectral intensities of the sample spectrum to be retained (one), deleted (zero), or corrected (intermediate values) for characteristic spectral bands. Analogous plots for AD-MA extract (Sample 2) are presented in Figure 3. As a filter transfer function is constructed individually for each mixture spectrum M, a cross-peak for Sample 2 appears at the coordinates (1577.82, 1053.17).
Figures 4a and 4b present a comparison between the raw sample spectrum and the spectrum processed using the disrelation filter. As Sample 1 consists of 95% pure baicalin, one of the quantified flavonoids, we expect that the filtering should not significantly alter its shape, as demonstrated in Figure 4a. The corrected Sample 2 reveals some features with increased spectral resolution, some of which are selectively attenuated.
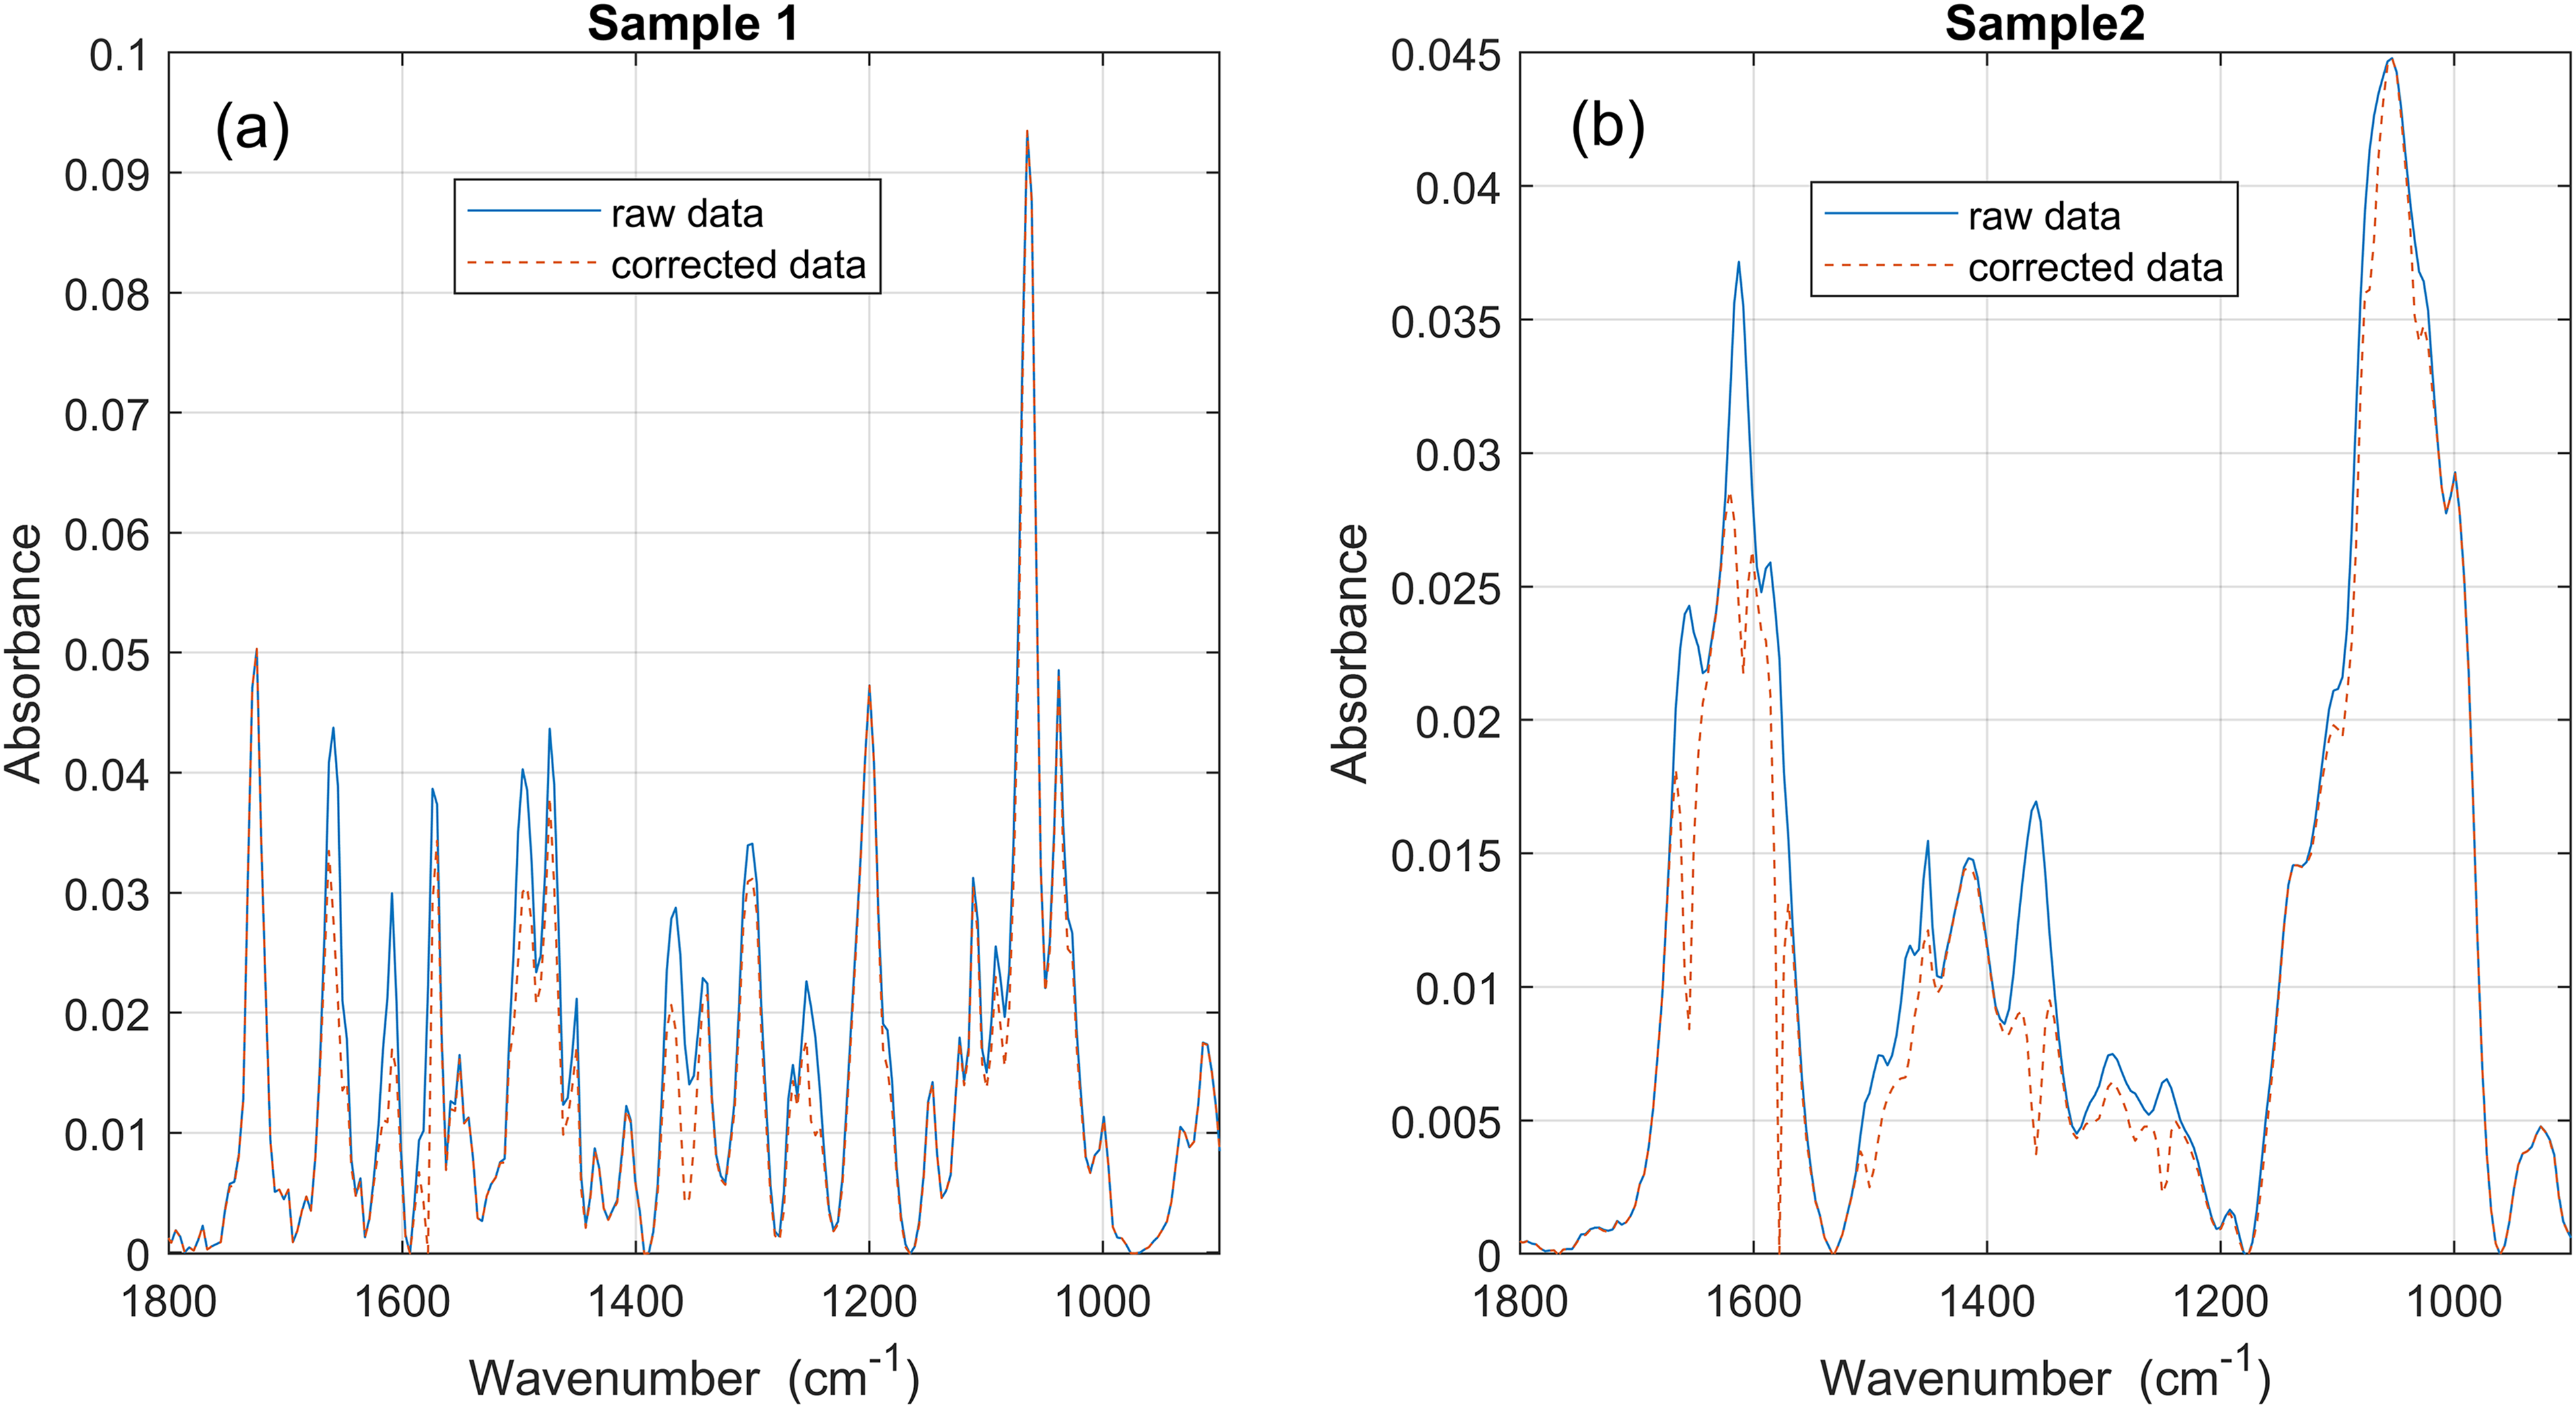
Raw ATR FT-IR spectrum and spectrum corrected by the disrelation filter for (a) Sample 1 and (b) Sample 2.
The situation described above, i.e., the construction of the disrelation filter based on selecting the strongest cross-peak in the 2T2D disrelation spectrum, is considered intuitive and appropriate for the system studied. As shown in Figures 2a and 3a, high disrelation values are also observed at other slices (wavenumbers). Therefore, it is worthwhile to analyze those slices as potential candidates for constructing the filter function. For Sample 1, the quantitative analysis of baicalin concentration was performed on the set of slices, spanning the entire spectral range, and the results are presented in Figure 5 as star symbols. The analysis based on a slice at 1065 cm–1, corresponding to the strongest disrelation peak, yielded the highest estimated baicalin concentration of 97%, compared with the manufacturer's reported value of 95%. As seen in Figure 5, the results for the slices at 1724 and 1200 cm–1 yield estimated concentrations close to 95%, indicating that both slices are also good approximations in finding the filter function.
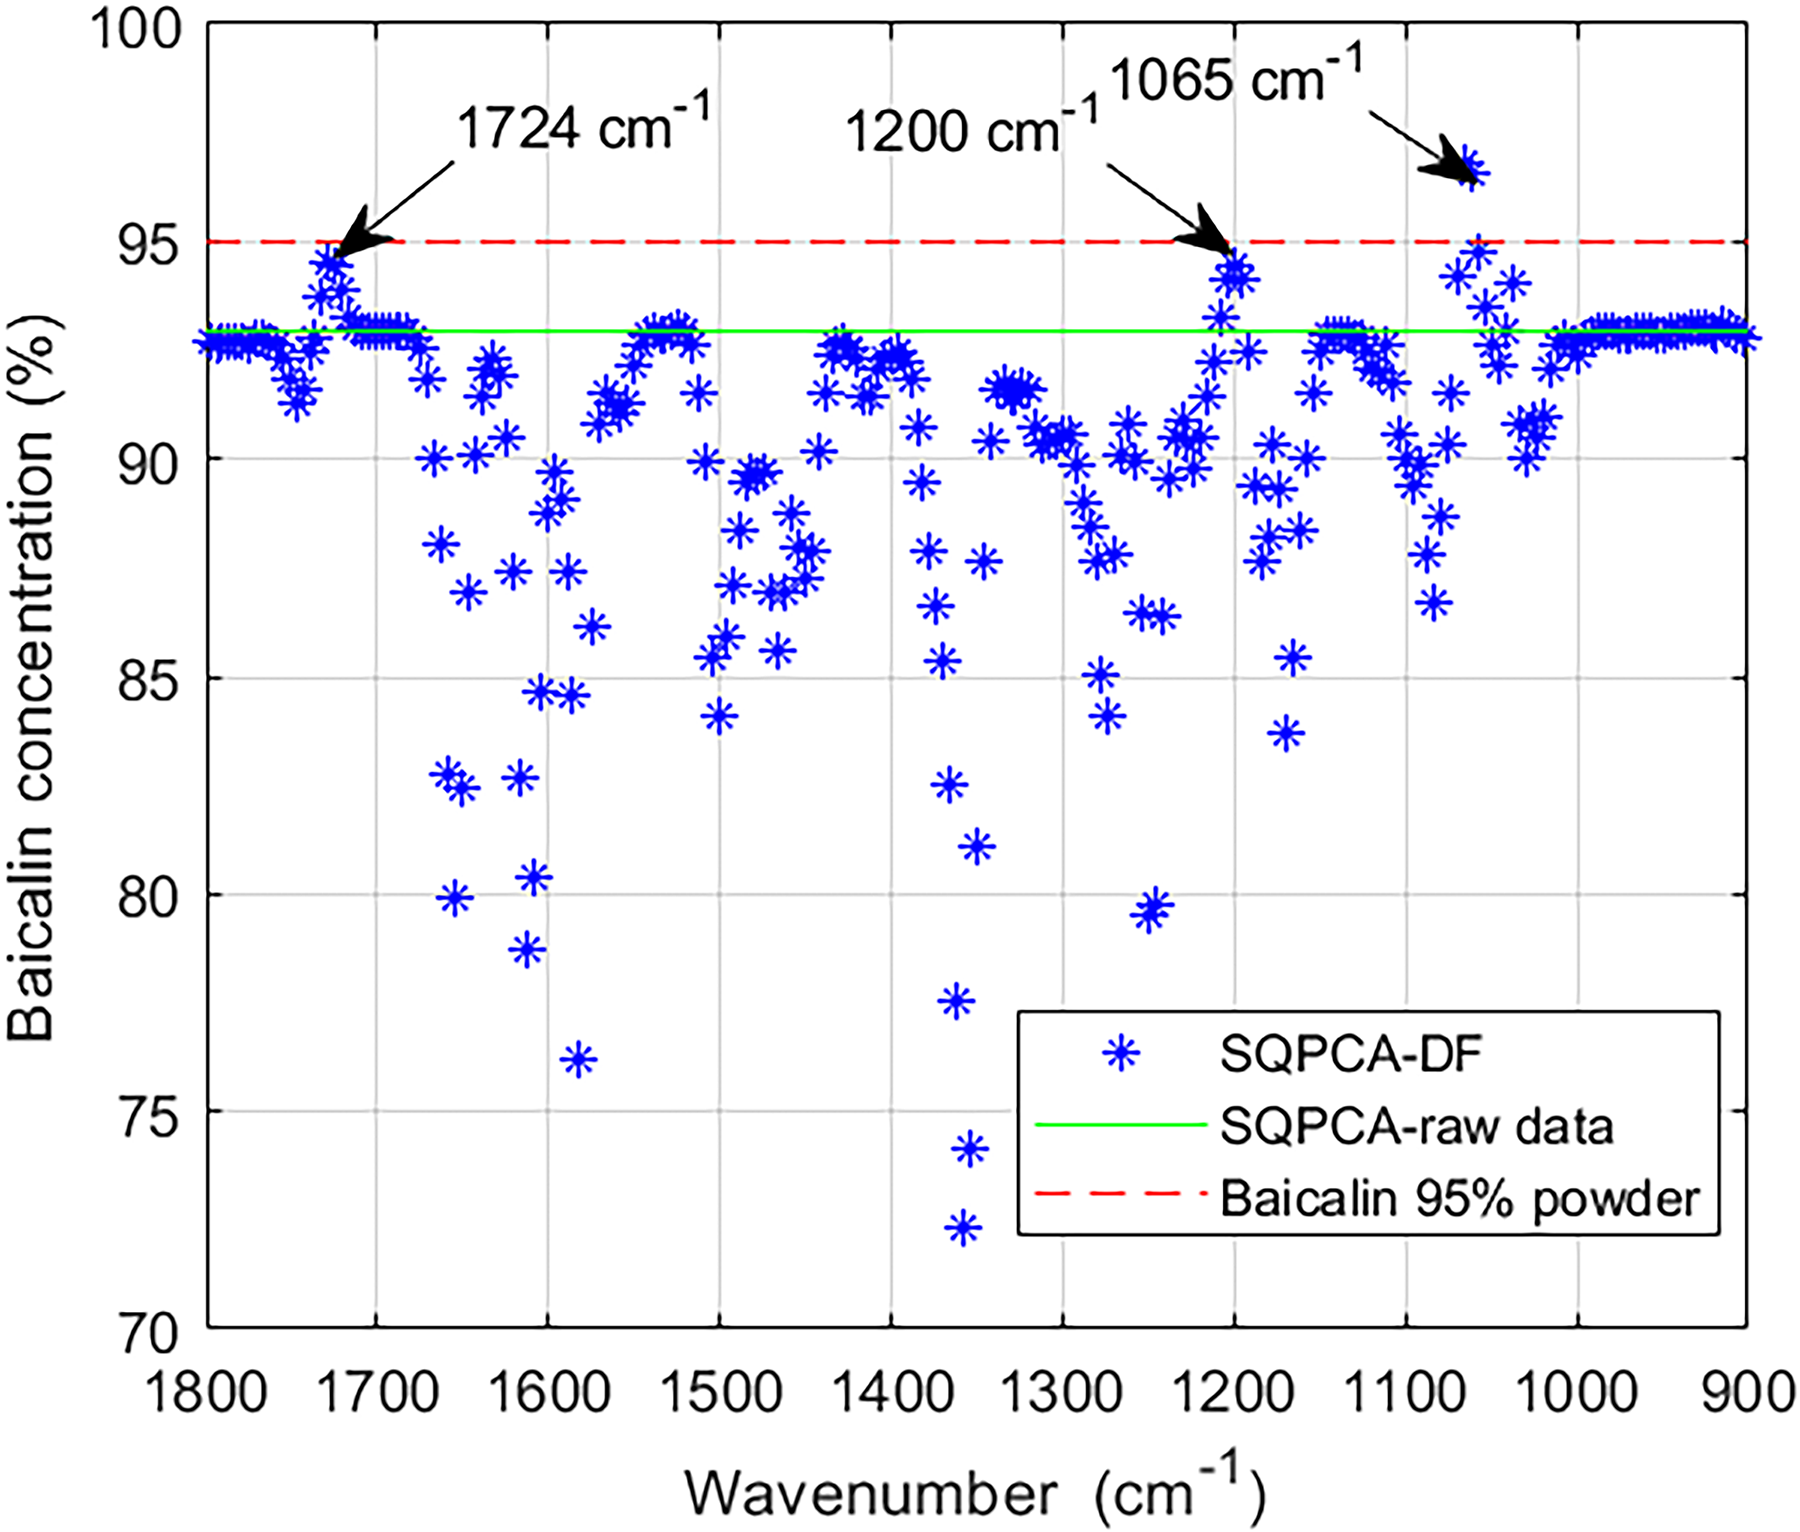
Baicalin concentration (%) in Sample 1 calculated from the full set of spectral slices (wavenumbers) across the disrelation spectrum (individual values marked with asterisks). The reference value provided by the manufacturer and the value obtained without filter-based preprocessing are shown as solid lines, red and green, respectively.
After selecting the most useful slices at 1065, 1200, and 1724cm–1, it is possible to verify whether they correspond to spectral features characteristic of the pure baicalin spectrum. Comparison of these wavenumbers with those highlighted in Figure 1a reveals a clear correlation, confirming the chemical relevance of the selected slices for Sample 1.
Comparison of Quantitative Results
The quantitative results derived from FT-IR spectra using SQPCA and SQPCA combined with the disrelation filter (SQPCA-DF) were then compared with chromatographic data obtained through HPTLC analysis. Table I presents the concentrations of total flavonoids and the Residue (%), as calculated using SQPCA and SQPCA-DF, and estimated by HPTLC. The results indicate that, across all samples, the predictive performance of SQPCA-DF is better than that of SQPCA without DF filtering. The differences between the results obtained by the SQPCA and SQPCA-DF compared to those obtained using the HPTLC method may be due to the fact that the chromatographic techniques separate a mixture (on a column or plate) into individual components before quantitative analysis. Well-separated chromatographic bands yield more accurate results, typically via UV–Vis scanning. Conversely, ATR FT-IR method analyzes samples in a raw state, capturing a fingerprint of all components together, which can lead to overlapping spectroscopic signals and in consequence different quantifications.
The sum of flavonoid concentration (%) obtained by HPTLC, total flavonoids, residue calculated in SQPCA and SQPCA-DF.
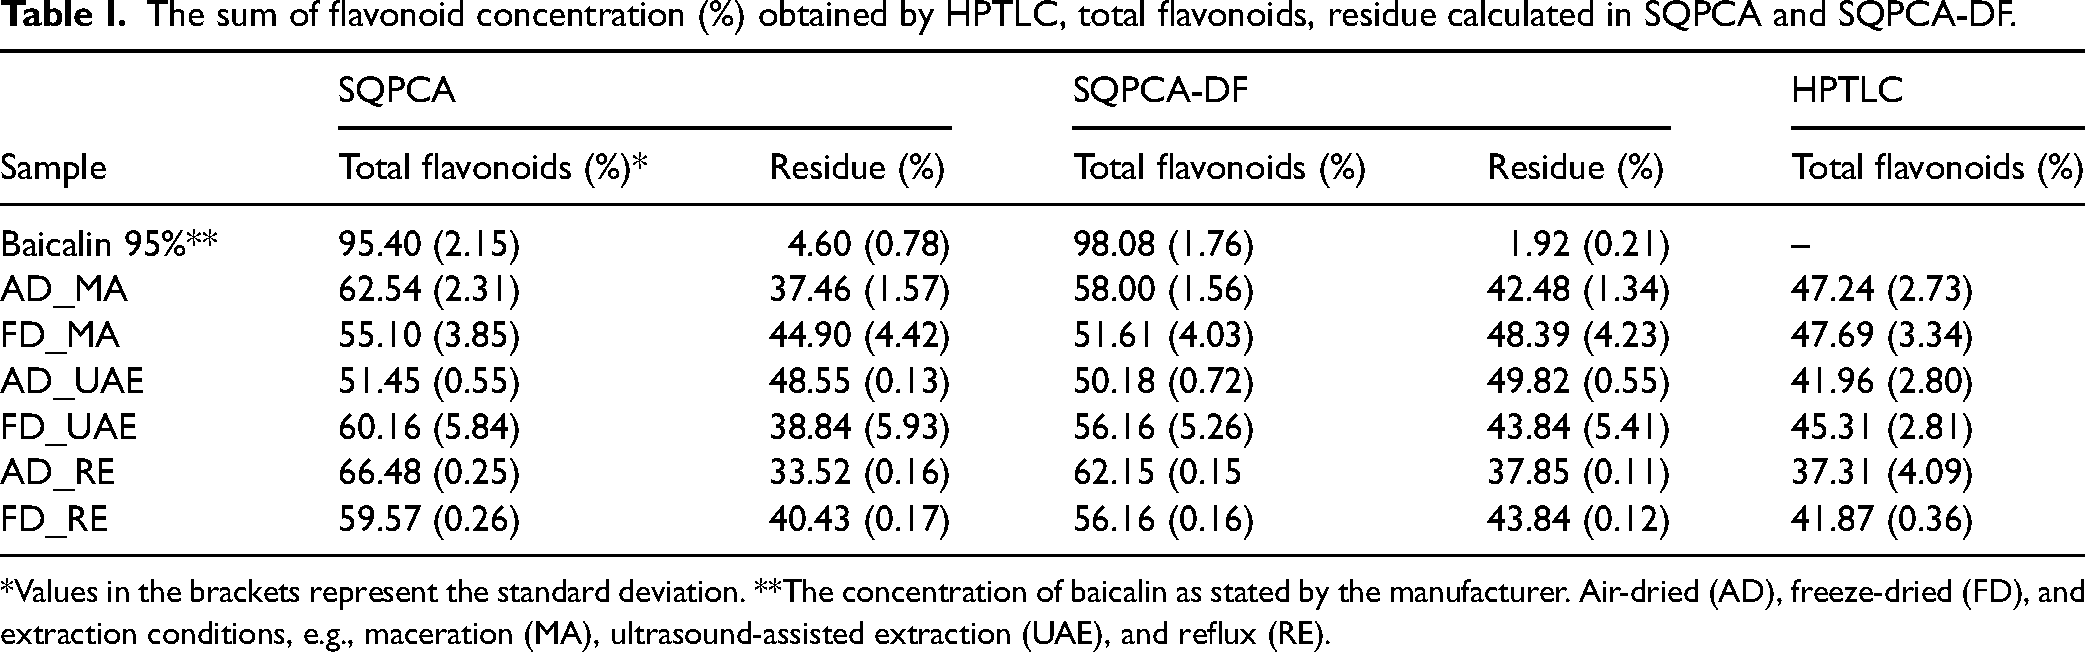
*Values in the brackets represent the standard deviation. **The concentration of baicalin as stated by the manufacturer. Air-dried (AD), freeze-dried (FD), and extraction conditions, e.g., maceration (MA), ultrasound-assisted extraction (UAE), and reflux (RE).
Figure 6 presents a comparison of the quantitative results of three analyses, SQPCA, SQPCA-DF and HPTLC, for each flavonoid separately. The figure indicates that no clear trend is evident in the obtained results. More detailed information is presented in Table II, which reports the ratios of analyte concentrations obtained via ATR FT-IR followed by SQPCA-DF to those obtained by HPTLC, as a measure (estimator) of differences between the two techniques. This way of expressing the error clearly reveals the systematic tendency of SQPCA-DF approach to yield higher total flavonoid concentrations than HPTLC (ratio > 1). However, analysis of the detailed results for each flavonoid in Table II shows that the higher concentrations obtained by ATR FT-IR compared to HPTLC did not apply to all four analytes across all samples. The ratio was either greater or lower than 1 depending on the sample type and was below 1 for all samples only in the case of wogonin. The most desirable ratio values (close to 1) were obtained for wogonoside, which is the most abundant component in the samples. This may suggest that the SQPCA method provides more accurate results for components at higher concentrations.
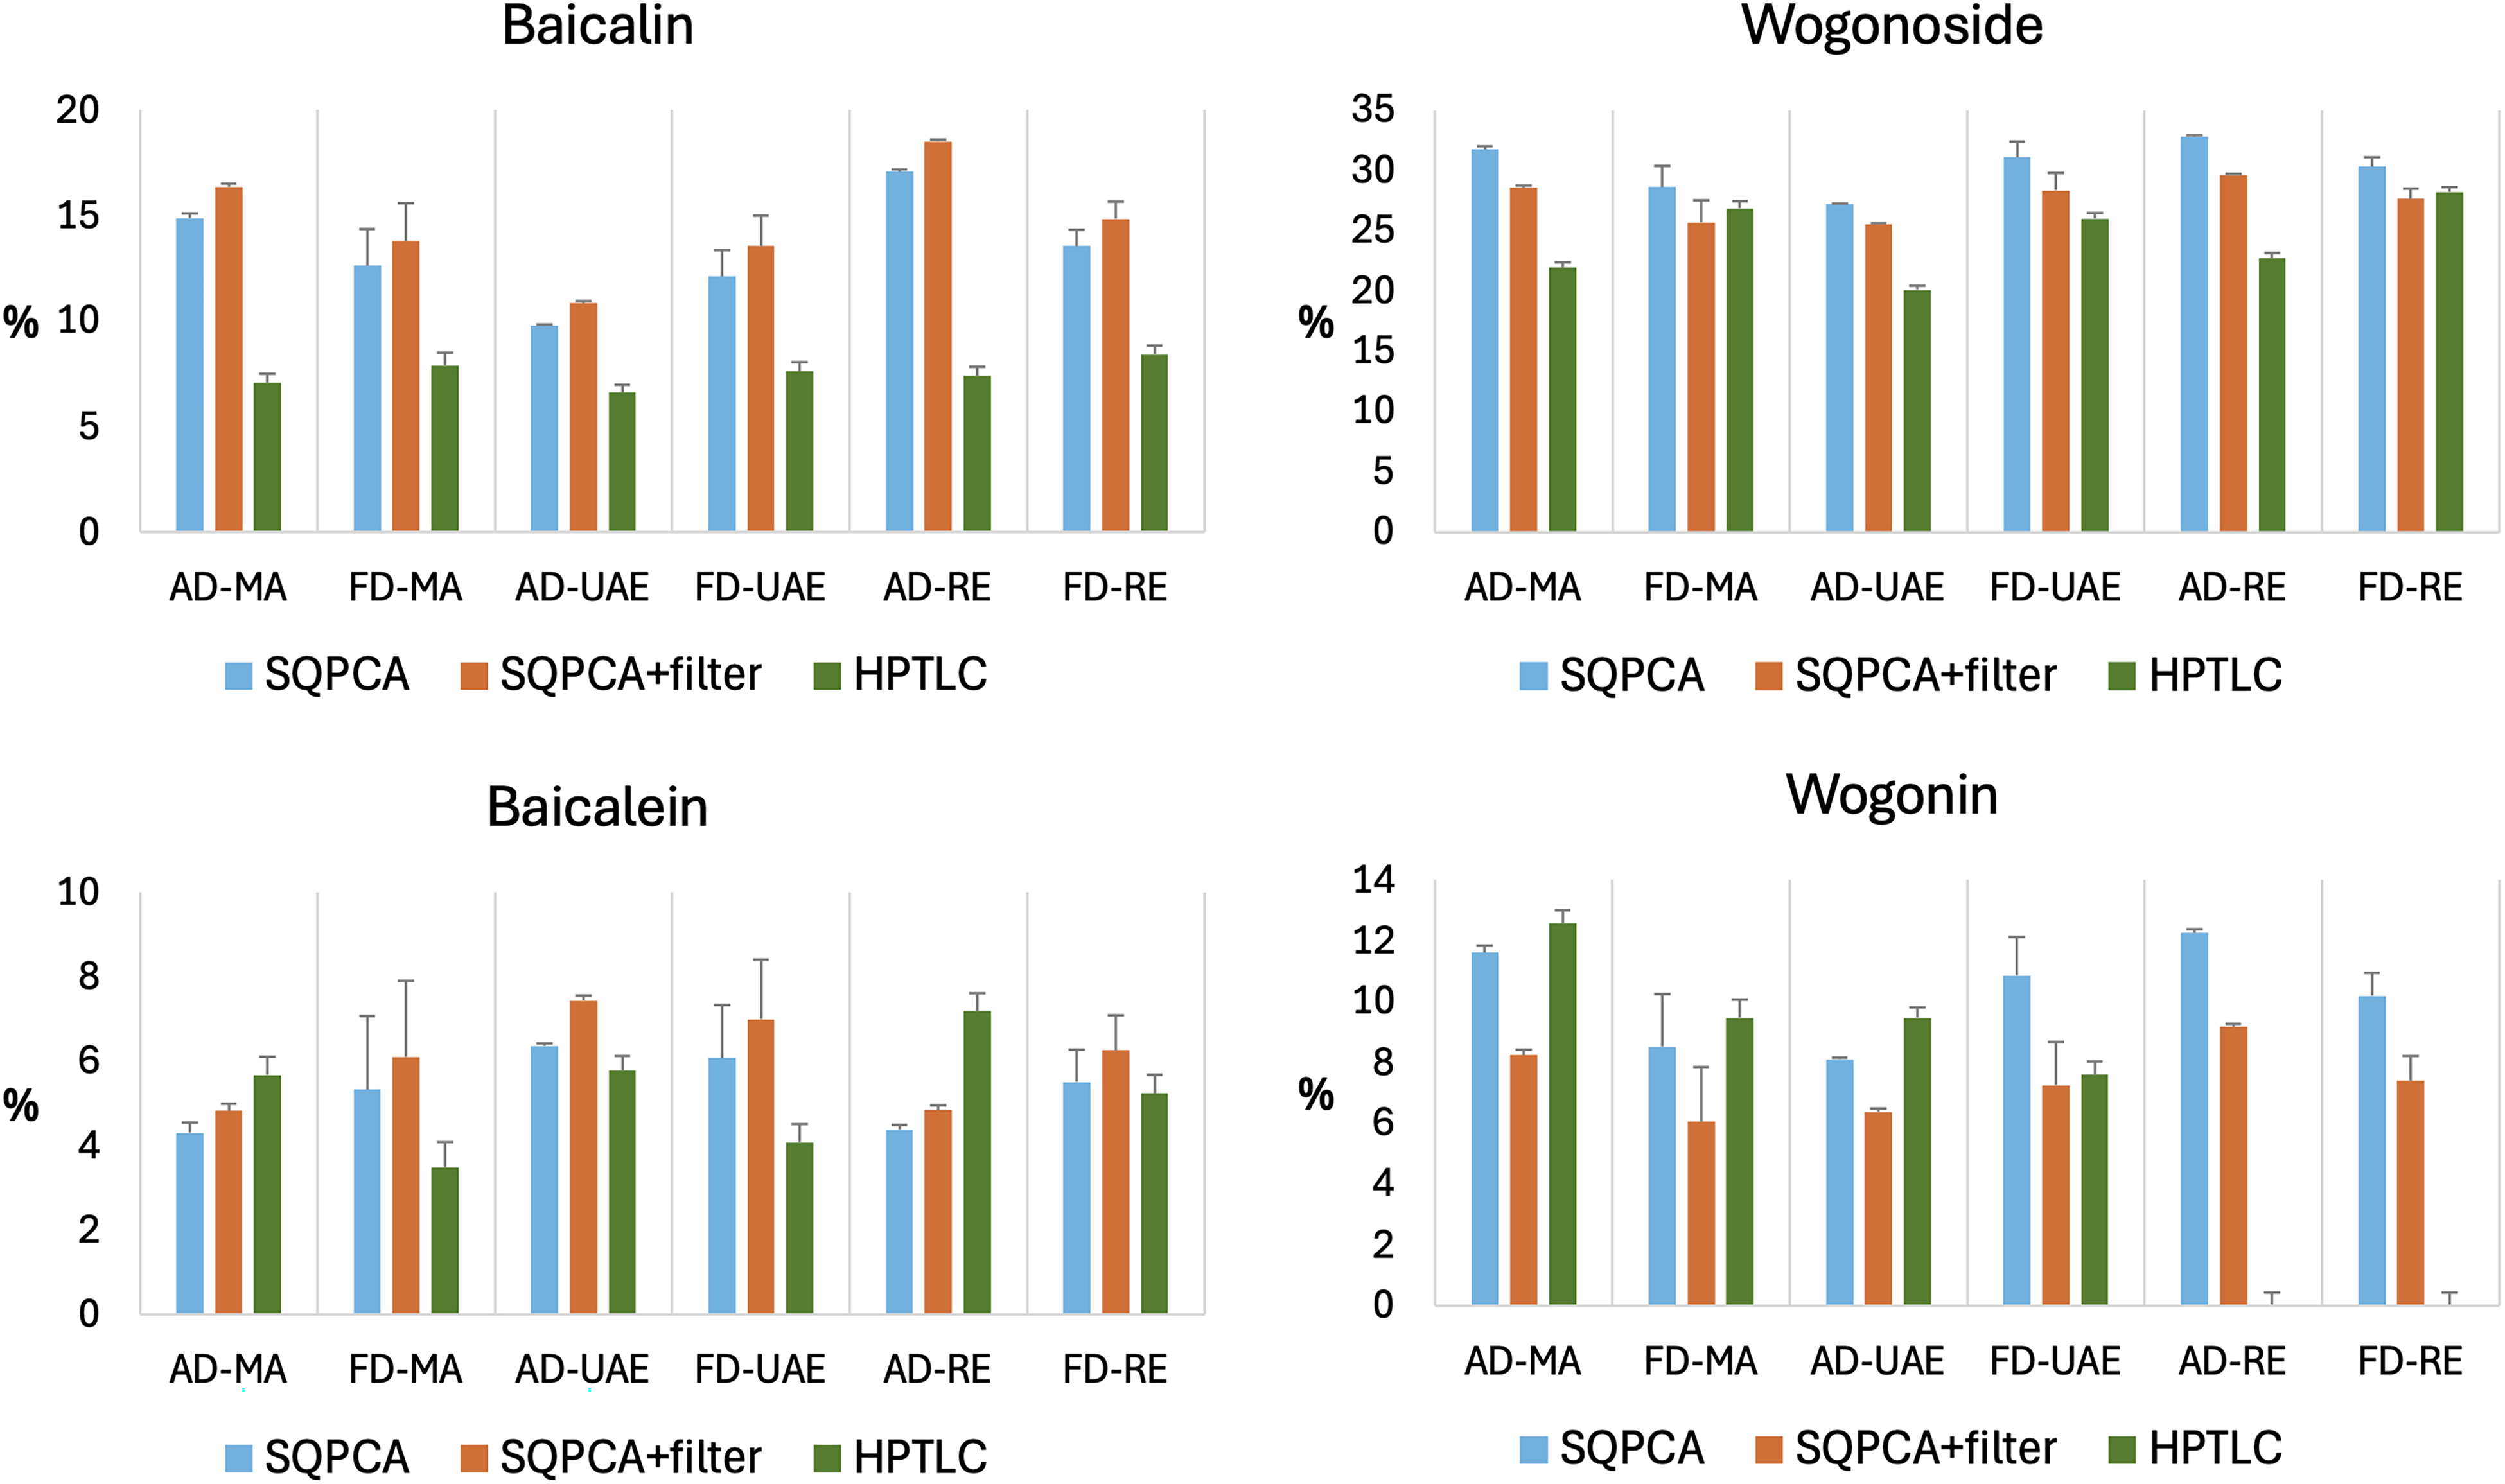
Percentage content of baicalin, baicalein, wogonoside, and wogonin in extracts from Scutellaria baicalensis Georgi roots, determined using three methods: SQPCA, SQPCA combined with disrelation filter, and HPTLC. Air-dried (AD), freeze-dried (FD), and extraction conditions, e.g., maceration (MA), ultrasound-assisted extraction (UAE), and reflux (RE).
The ratio of analyte concentrations obtained using ATR FT-IR combined with SQPCA-DF to those obtained using HPTLC.
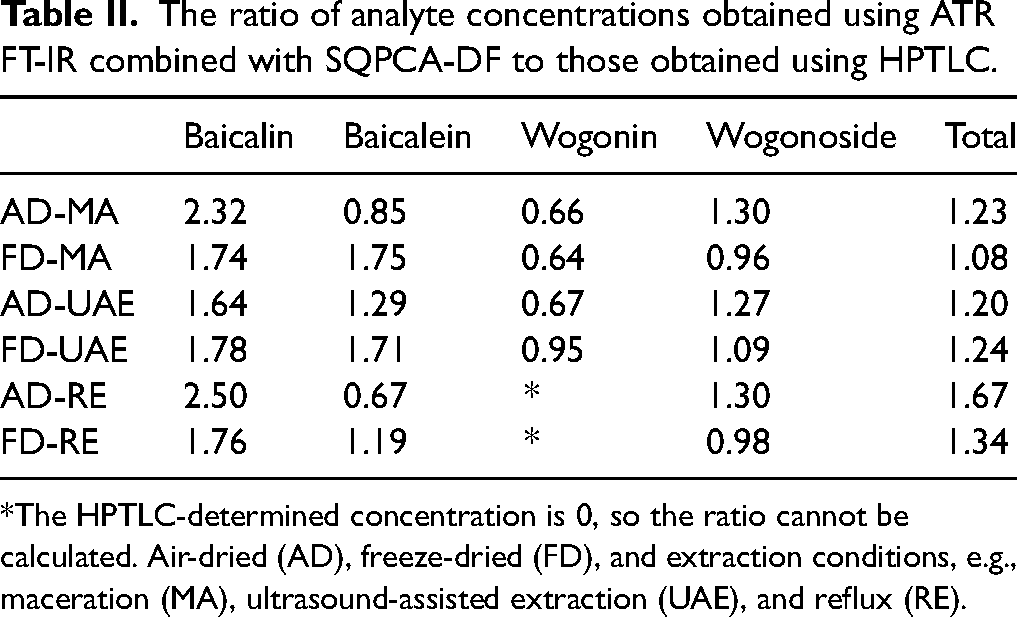
*The HPTLC-determined concentration is 0, so the ratio cannot be calculated. Air-dried (AD), freeze-dried (FD), and extraction conditions, e.g., maceration (MA), ultrasound-assisted extraction (UAE), and reflux (RE).
We believe that further work on this topic, such as modifying the SQPCA model to account for nonlinear effects already at the calibration stage, could improve the results.
Conclusion
The present work aims to integrate 2T2D correlation spectroscopy with recently proposed score-based principal component analysis (SQPCA) to improve quantitative analysis of flavonoids in complex plant samples. We have shown that the composition information derived from the SQPCA procedure can be improved when the data are pre-processed by a digital filter constructed based on an appropriate slice of the 2T2D disrelation spectrum. The results demonstrate the robustness of DF-based correction applied to six samples with comparable compositions. This approach is presented here for the first time; therefore, additional validation is necessary. The development of further simulation procedures and the analysis of other samples are currently in progress.
Footnotes
Acknowledgements
The authors would like to thank the anonymous reviewers for their constructive comments and valuable suggestions, which substantially contributed to improving the quality of this paper.
Consent for Publication
All authors have read and approved the final manuscript and consent to its publication.
Declaration of Conflicting Interests
The authors declared no potential conflicts of interest with respect to the research, authorship, and/or publication of this article.
