






Abstract
Hair is primarily composed of proteins, notably keratin and keratin-associated proteins (KAPs), forming a complex composite material with important structural functions in nature. Its mechanical behaviour is intricate and includes conformational changes, notably the transition of keratin from α-helix to β-sheet structures. However, the precise conditions under which this transition occurs during stress–strain experiments and the influence of humidity on this process remain unresolved. In this study we use two structurally sensitive methods, Raman spectroscopy and wide-angle X-ray scattering (WAXS), to study the changes in situ as a function of strain under controlled conditions of humidity. The results are analysed by two-dimensional correlation methods, two-dimensional correlation spectroscopy (2D-COS) and perturbation correlation moving window two-dimensional correlation spectroscopy (PCMW2D), which clearly relate molecular changes to the strain. The results show for the first time for both methods, that two main α-helix to β-sheet transitions are generally observed, and that these shifts in position with changing humidity. Also, these transitions go via a disordered state. It is concluded that water modifies the matrix of the hair, which then determines at what strain the intermediate filaments unfold. These results are discussed in terms of the present proposed models of hair mechanical behaviour.
This is a visual representation of the abstract.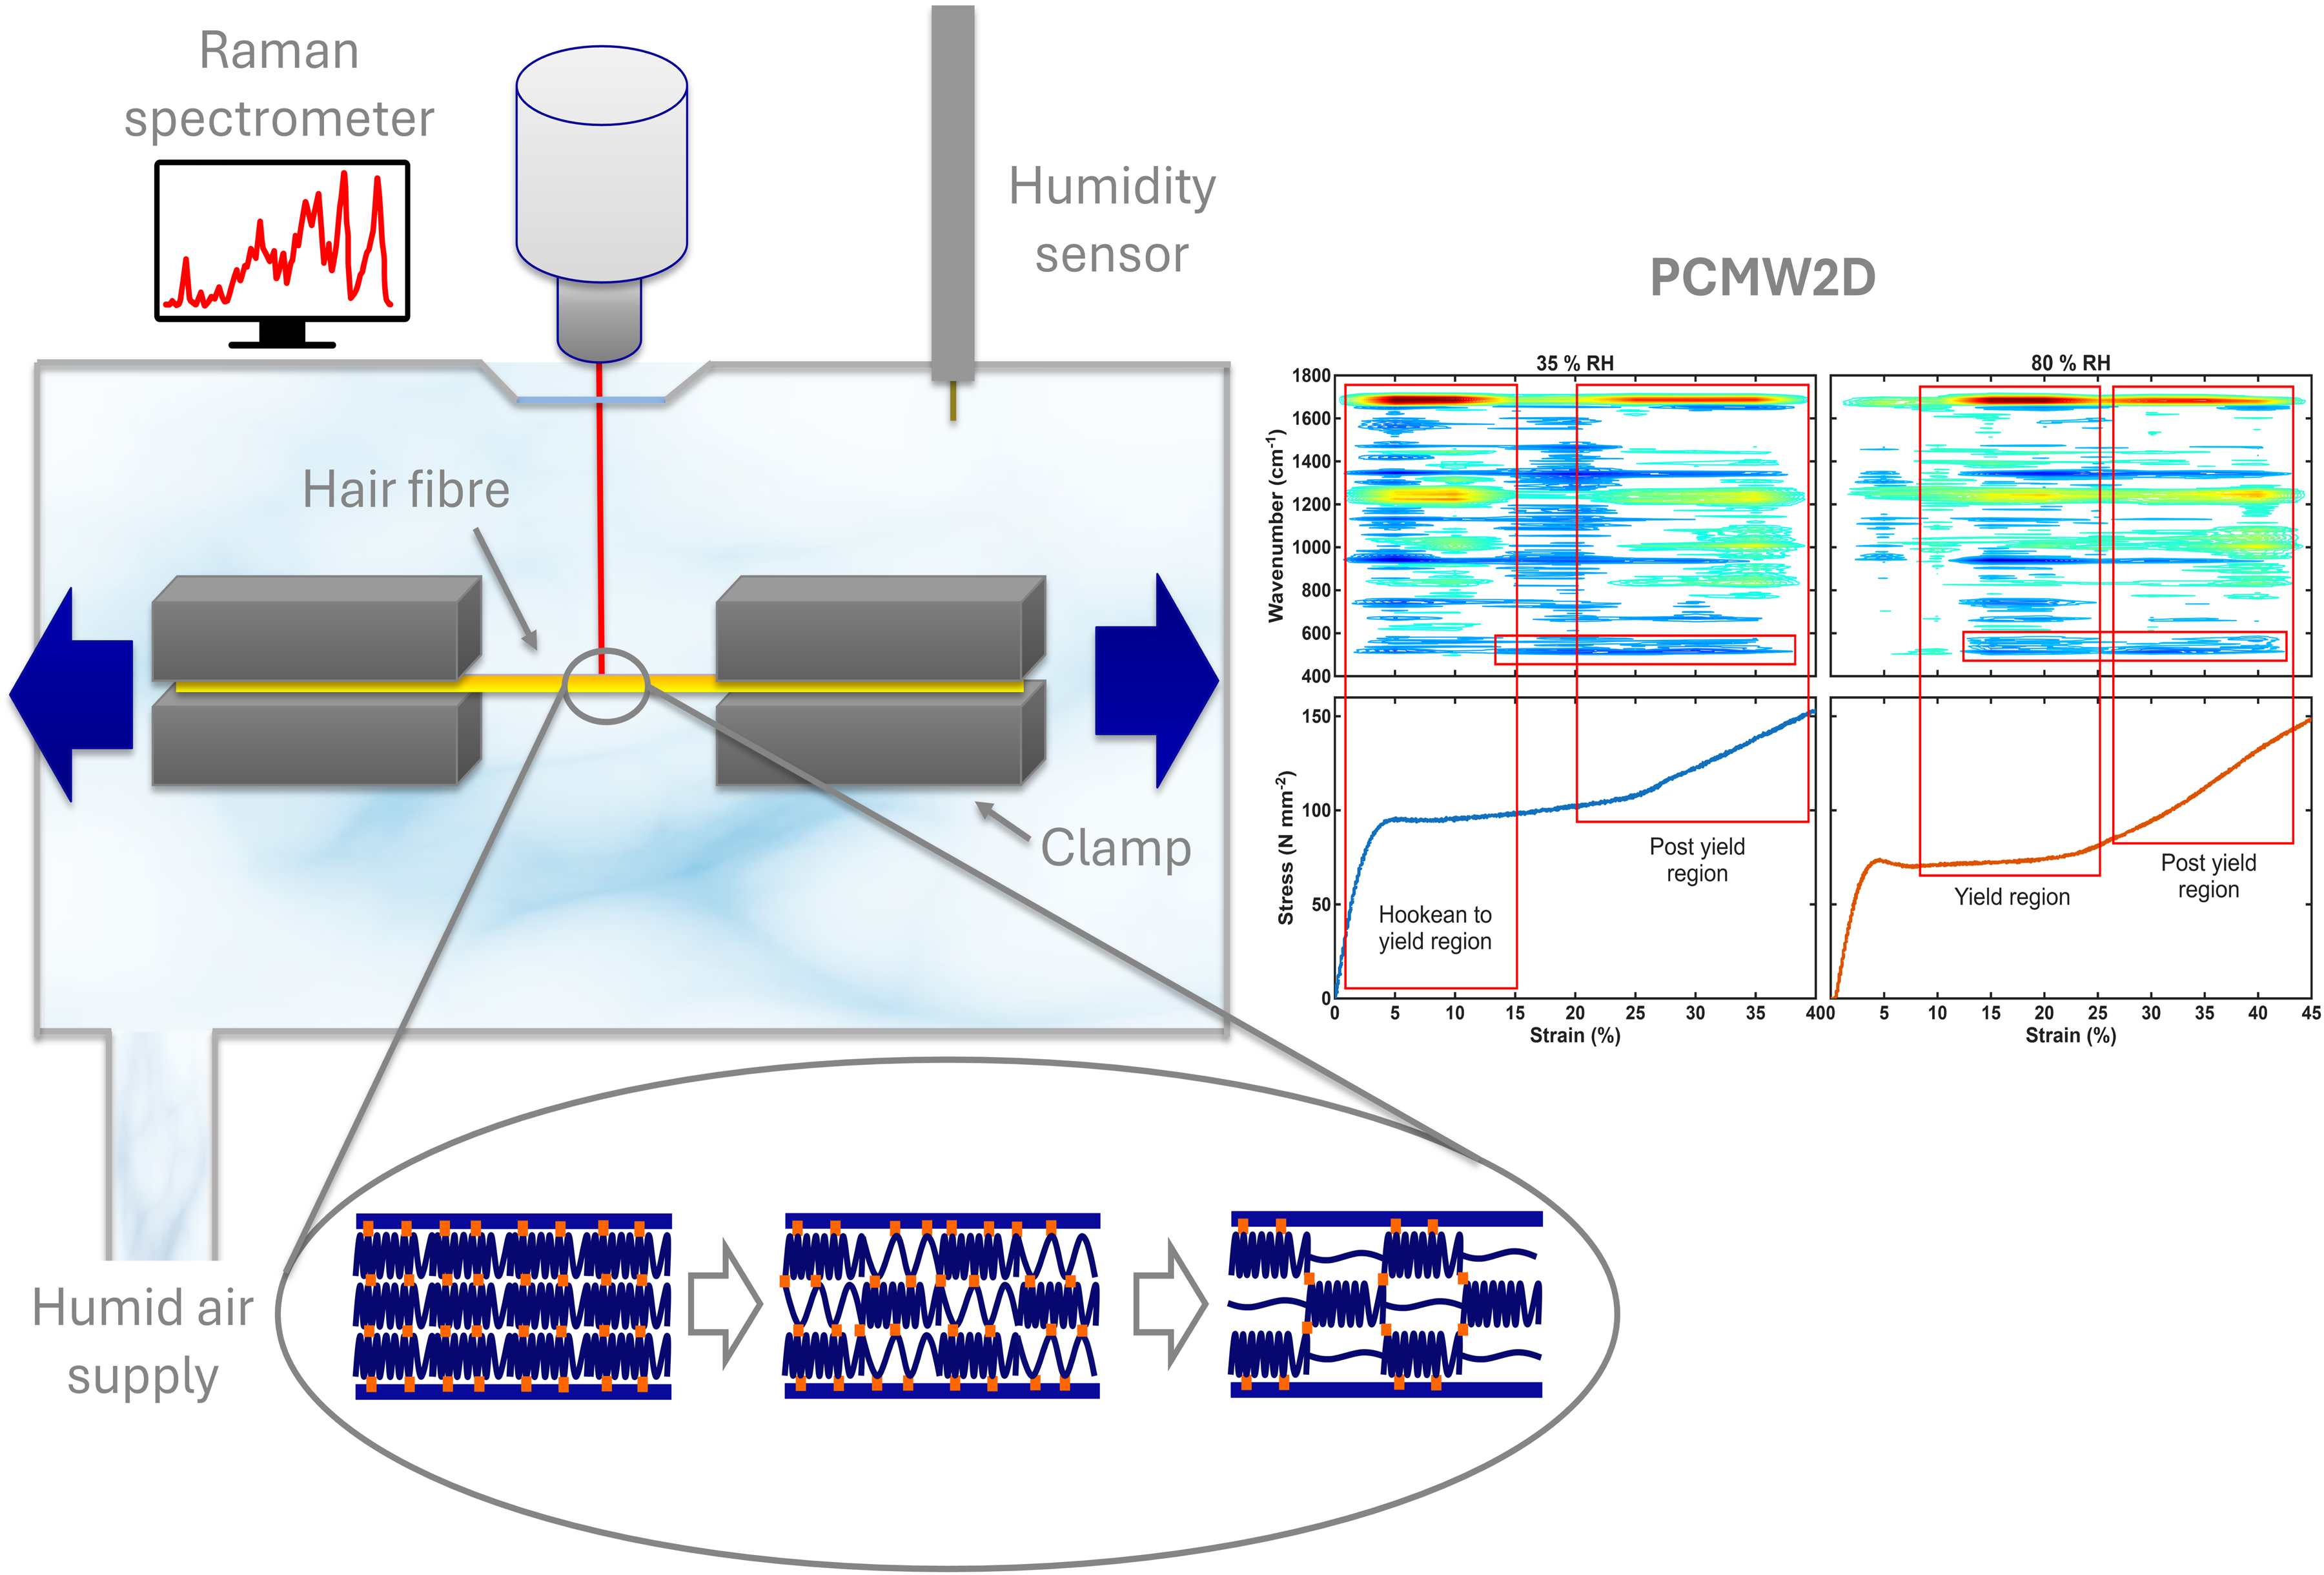
Introduction
Keratin represents one of the most abundant and important structural proteins in animals. 1 Keratins are components of composite materials that form highly hierarchical structures with strong and complex mechanical properties. It is multifunctional, playing many roles in nature and because of its flexible structure and functional properties it is also a source of bioinspiration. 2 In this paper we study an α-keratin based structural material: human hair. Hair is one of the defining characteristics of mammals where it is an appendage from skin. 3 It has multiple functions many of which have diminished in humans, but it has had significant importance through history as a symbol of strength, power, and beauty. Today, given how much time people spend cleaning, colouring, and styling their hair its properties are of great interest to the cosmetic industry.
Hair is thus predominantly a proteinaceous composite material composed of keratin and keratin associated proteins (KAPs) in three main gross regions, cuticle, cortex, and medulla. 4 The cortex is the bulk of the hair and is responsible for its tensile strength. In the cortex there are keratin intermediate filaments (IFs), also known as microfibrils, which assemble into macrofibrils arranged approximately parallel to each other depending on the type of cortex cell. 5 The intermediate filaments are embedded in a matrix containing globular proteins (the KAPs). KAPs have a high percentage of sulphur due to a high cysteine content, this gives rise to a high number of S–S bonds. 6 The presence of KAPs distinguishes keratin fibres from other structural fibre proteins such as collagen and silk. Hair fibres also contain water, and they are hygroscopic. Thus, hair absorbs water and the amount in hair varies significantly with relative humidity, resulting in a content of up to ∼30%. This also leads to swelling, which is highly anisotropic, being ∼15% radially but only 2% longitudinally. 3 The water is adsorbed in the matrix and is associated with KAPs but does not go into the IFs.
Due to its inherent structural function, understanding the mechanical behaviour and relating it to molecular changes has been looked at over a very long time. It was found in the 1930s that keratins including hair undergo a α-helical to β-sheet transition. 7 It remains uncontroversial to this day that this happens during a stress–strain experiment. However, the literature differs regarding when this occurs along the stress–strain curve (i.e., at which strain values) and in the details of the unfolding mechanism. There are also different accounts of if, when, and where S–S bonds break.
To understand the mechanical behaviour of hair, various models have been proposed to account for hair's stress–strain behaviour in terms of the contributions made by the different structural components (IFs and KAPs) and the various bonding between them. 8 The merits of these different models are still debated today, for a review of the models see references.9,10 All of the models involve α-helical to β-sheet transitions (i.e., the unfolding of α-helical regions and formation of β-sheets) in the IFs above a certain strain level. The series-zone model involves a second set of transitions in the strain hardening region of the stress strain curve. 9 Other differences between the models involve the role of the matrix. For example, the Chapman–Hearle model includes a tensile stress in the disulphide bonds (between matrix globules, and between matrix globules and IFs) at strains below the strain hardening region. This is claimed to originate from stress transfer between the intermediate filaments and the matrix. By contrast, the series-zone model treats the matrix as being thixotropic, affecting ease of deformation and opposing both folding and unfolding of the α-helices. 11 The series-zone model identifies two zones (X and Y) which unfold in different strain regions. A further development of the series-zone model is the Wortmann–Zahn model, which attributes the X and Y zones to specific locations in the structure of the keratin intermediate filaments. 10
Much of the experimental work that could test these models has been done under a variety of conditions that were either not controlled accurately or not maintained during the measurement (for example samples being fixed by steaming and measured later).12,13 Hence there is still a need to get consistent data on the behaviour of hair during stress strain experiments under well controlled conditions. Raman spectroscopy has been used for many years to examine the structure of proteins, especially their secondary structures. 14 It is particularly effective when studying proteins in their natural conditions. It has been used to study keratin, 15 hairs and whole hairs,16–21 including how their behaviour changes under various conditions. 22 Raman has been used previously to look at molecular changes within hair as the hair fibre is strained with changing humidity. 23 The α-helix content was found to decrease with strain while the β-sheet content was found to increase with strain, indicating an α to β transition. Other changes in the spectrum were observed including the reduction of S–S bonds intensity. However, in both cases the conditions were not well controlled, with experiments carried out between 40–60% humidity (a wide region in which differences in mechanical properties may occur) and “100% humidity”mpa#rdquo;, which was provided by a drop of water on the hair. However, this work does clearly show how Raman can be used to monitor the molecular behaviour during the stress–strain experiments of hair.
X-ray scattering techniques such as wide-angle X-ray scattering (WAXS) have been used to look at the secondary structure of keratins for many years.7,24,25 It was the first method to show the α to β transition with refined more contemporary studies having been carried out.25–28
Thus, this paper uses both Raman spectroscopy and WAXS to study these transitions as a function of strain and relative humidity (RH), to investigate the contributions made by the intermediate filaments (IFs) and matrix proteins to the stress–strain behaviour of hair fibres. This work differs from some of the previous studies in that we measure whilst still under these conditions (rather than “fixing” the hair) and conduct the experiment under accurately controlled relative humidity. These measurements are on relevant “in-use” timescales that hair is likely to experience in the real world. These results were then analysed using 2D correlation methods, especially perturbation correlation moving window two-dimensional correlation spectroscopy (PCMW2D) analysis, 29 this method clearly relates the perturbation applied (i.e., strain) to any changes observed. These combined results are then discussed in the context of the present proposed models for hair behaviour.
Experimental
Materials and Methods
Both experimental techniques used white virgin European hair fibres purchased from International Hair Importers.
Raman and Tensile Set-Up
A Linkam TST-350 tensile testing cell for microscopes has been combined with a Surface Measurement Systems GenRH Humidity Generator to control the humidity during tensile experiments; the RH was controlled within +/–1% RH. A WiTec Alpha 300R Confocal Raman Spectrometer with an Olympus 20×/0.35 mm long working distance objective was used with a diode pumped 532 nm laser at 10 mW. The tensile cell was placed on the microscope stage of the Raman spectrometer. A schematic of the set-up is shown in Figure 1. Individual white virgin hairs were fixed to paper clamps using neoprene glue, this was to stop the fibre slipping under tension. The paper clamps were set 15 mm apart, the hair fibre was placed in, and was at a constant orientation relative to, the laser. The hair fibre was left for 2 hours to equilibrate to the humidity. All experiments were carried out at room temperature (∼ 20 ◦C +/–1) and at two different relative humidities (RH) – 35% RH (low humidity) and 80% RH (high humidity) +/–1%. The work of the present study was carried out using strain rates of 50 µm·s–1 (20% min–1) and a relaxation time of 2 minutes. Unless otherwise stated, the spectra were acquired at 5% strain intervals. For each measurement, spectra were obtained from approximately the same location on the hair fibre and just below the surface (∼ 10 μm) to ensure that the spectra were from the cortex. Quite a large spot was used within the cortex, resulting from the use of a 20× objective, and changes in the refractive index in the light path. 16 A data acquisition time of 15 minutes was used to get very good signal to noise spectra. At least three experiments were carried out for each of the conditions and averages used for the stress–strain curves.
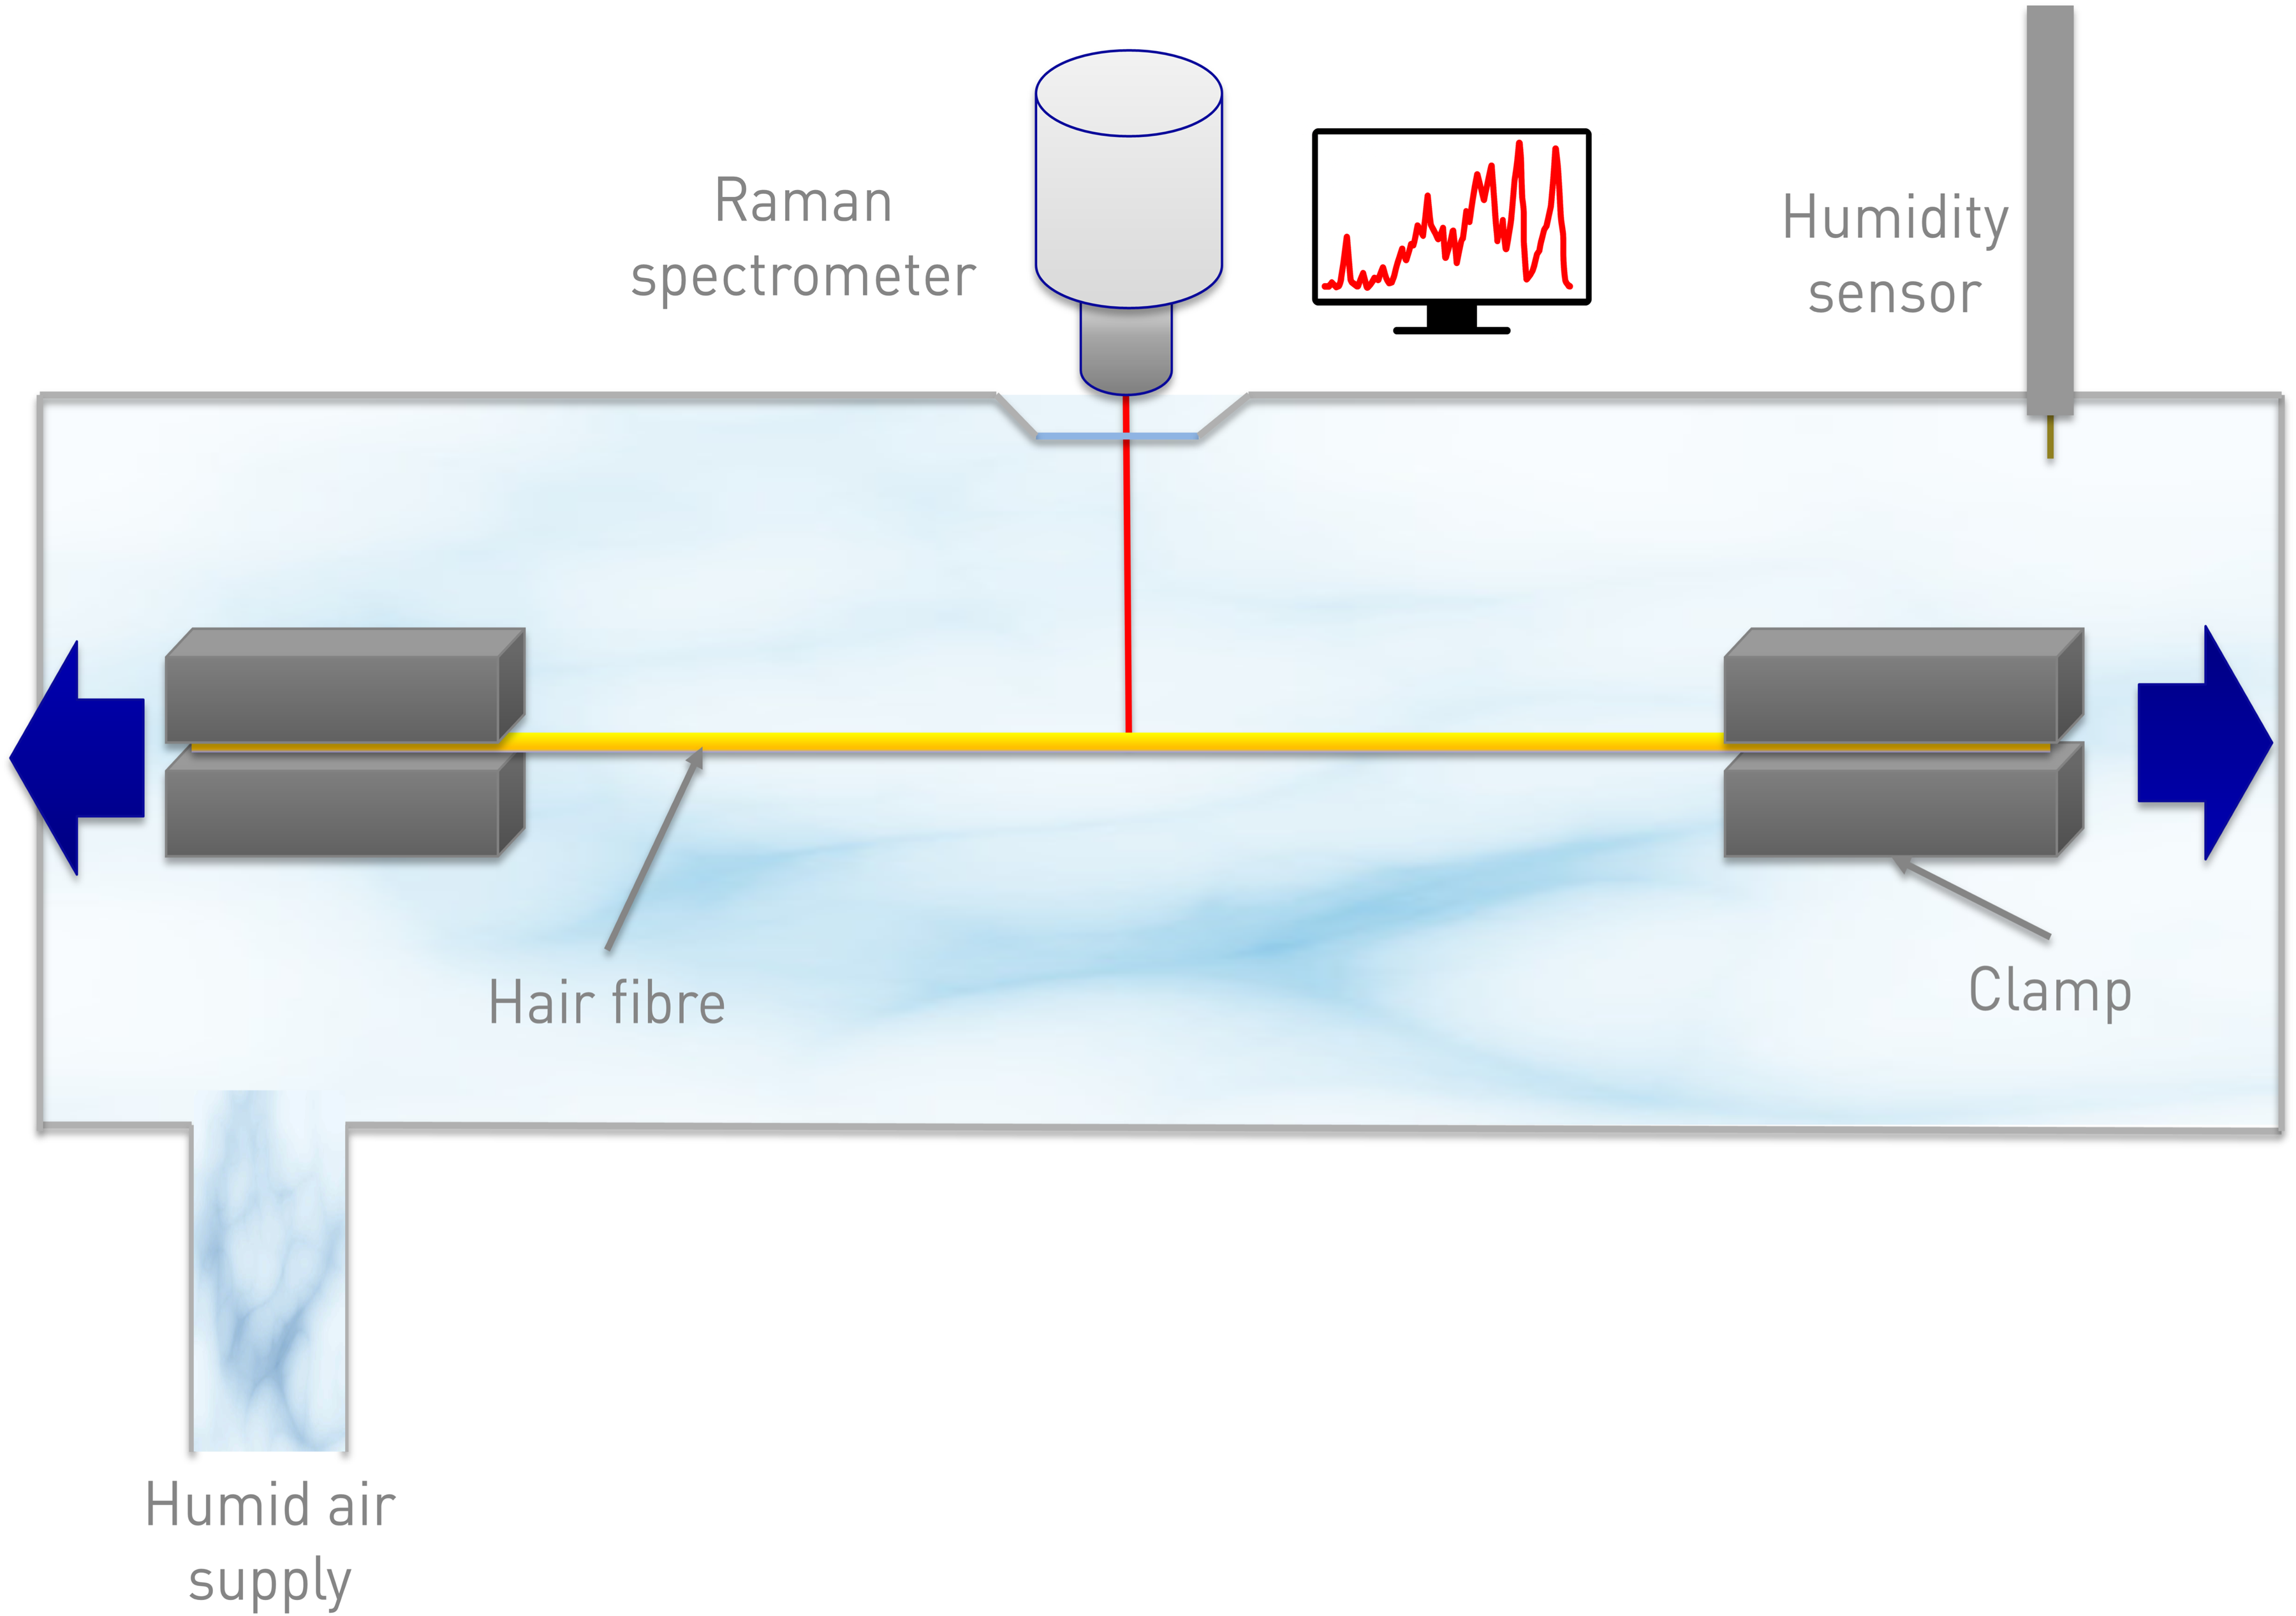
Schematic of the set-up used for the Raman/tensile experiments.
All pre-treatment of data was performed in Matlab. The spectra were first truncated to a spectral range of 300–1800 cm−1. The spectra were then baselined by subtracting a linear baseline, where the baselining parameters were kept the same for all spectra. Spectra were normalised to the CH2 bending mode peak at 1445 cm−1, as this is considered a stable peak which does not change through the sample. 30
Wide Angle X-ray Scattering (WAXS)
Wide angle X-ray scattering experiments were conducted at the high-brilliance ID02 beamline of the European Synchrotron Radiation Facility (ESRF) in Grenoble, France. The incident X-ray wavelength, λ, was 0.0995 nm for all experiments. The sample to detector distance was set to 12.56 cm, allowing collection of WAXS data in the range 8.38 < q (nm–1) < 34.2, where q,

Hair strain was achieved in a controlled manner by a tensile rig in a similar manner to the Raman experiments. The rig is sealed with mica films and the whole cell is coupled to a humidity controller with a precision within 1%. Hair fibres were cut to an average length of 5 cm. The fibres were first equilibrated at the desired RH (35% and 80%) for two hours, before mounting into the tensile rig. The ambient temperature was 22–23 °C. Measurements were conducted at three time intervals after each strain step (2, 4, and 10 minutes), to verify whether structural changes are time dependent.
Data Analysis
Raman
A Raman peak intensity is directly proportional to the concentration of the species causing that peak. 31 In other words the Raman peak intensity can be used to measure the amount or concentration of a species giving rise to it, assuming the absence of confounding experimental factors. In this case, spectra were normalised as described above or were indicated differently in the text. Then peak intensities of various Raman bands have been plotted against strain.
WAXS
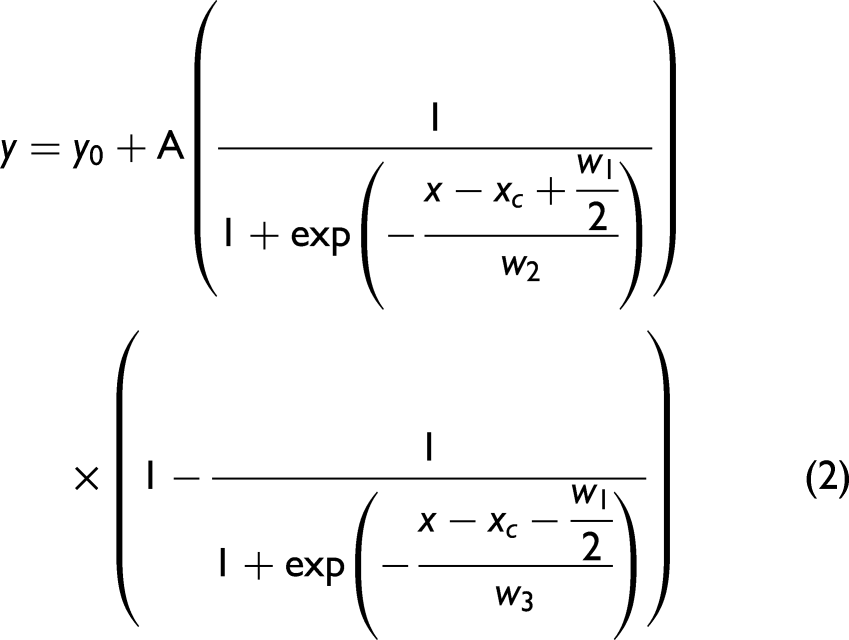
The WAXS patterns for all strain experiments were integrated in the selected region as indicated in Figure 6a to observe the evolution of the specific α-helix reflection at 0.51 nm. The appearance of the β-sheet feature upon hair stretching is highlighted in the WAXS pattern presented in Figure 6b. This formation of the β-sheet spot is clear in the two-dimensional image representation. Extraction of one-dimensional profiles was performed by integrating pixel intensity in a series of 25 pixel-lines along x- and y-axes of the image (shown in Figure S3, Supplemental Material). The β-profile along the y-axis of the pattern-image was subjected to lineshape analysis by means of an asymmetric double sigmoidal (Eq. 2), which provided the best fit.
2D Methods
To analyse complex data like Raman spectra and other analytical techniques such as WAXS which have been subject to a perturbation, a group of two-dimensional correlation methods have been developed from the work of Noda. 32 These have been well documented and widely used in the literature so will only be briefly explained here.29,33–36 Two-dimensional correlation spectroscopy (2D-COS) is an extremely powerful technique for analysing changes that occur within Raman spectra of a sample. 37 It has been used to look at many complex systems before, such as analysing polystyrene and polyethylene mixtures, 37 proteins, and the effect of concentration on the structure of mucins.30,38–40 Although previously 2D-COS had been applied to Raman data of hair under stress, 23 the more recently developed PCMW2D has not. 41 This is especially useful in these studies as it shows clearly when changes occur relative to any perturbation applied, in this case the strain, and not only what has occurred. Very few WAXS studies have used 2D methods at all.42,43 The studies that have used them employed 2D-COS and not PCMW2D.44–46 2D methods have been used for compression testing with WAXS but as far as we are aware not using PCMW2D. 47
The 2D-COS technique looks at how changes within a system correlate when the system is subjected to an external perturbation. It is essentially a measure of the phase between two functions. It aims to analyse the similarities and dissimilarities in the behaviour of two independent wavenumbers in response to an external perturbation. A synchronous and an asynchronous spectrum are calculated which are usually represented as contour maps across a two-dimensional wavenumber space. The synchronous spectrum yields information on spectral changes which occur at the same perturbation level. Thus, if two peaks vary at the same perturbation level they will appear on the synchronous spectrum, if the two peaks both vary with the same directional change in intensity (both increasing or both decreasing) they will present a positive peak. Whereas if these peaks vary with opposite directional changes in intensity (one increases and the other decreases) they will present a negative peak. The synchronous spectrum therefore provides information on the similarity in behaviour of two wavenumber values across the perturbation. 48 The asynchronous spectrum arises from a consideration of the behaviour between two wavenumber values at different levels of perturbation. This is a measure of the out of phase behaviour of two wavenumber values, with the sign of the resulting peak dependent on the sequential order of wavenumber changes along the perturbation. Thus, highly overlapped peaks which vary out of phase can be resolved. Therefore, by comparing both the synchronous and asynchronous plots, the order of changes due to the perturbation can be determined.
In order to more closely relate the spectral changes to the perturbation, the method of PCMW2D can be employed. 41 This type of analysis allows the location of changes within a system to be viewed. It is based on the idea of 2D-COS and moving window 2D analysis (MW2D). 49 It is calculated by subdividing the spectra into “windows” which are small snapshots of the data and analysing them separately before putting the analysed “windows” back together. These are typically displayed as contour plots with a spectral axis and a perturbation axis, i.e., in this case strain. Thus, using a combination of PCMW2D and 2D-COS analysis, the location and mechanism of changes within a system can be identified.
Results
Raman/Tensile
The typical macro-mechanical behaviour of hair fibres up to fibre fracture is shown in Figure 2 and is consistent with previously published work.1,23 There is a clear difference between the mechanical behaviour of hair fibres at low and high humidity. The main observations to be made are that there is a decrease in the overall stress of the fibre at high RH. Other differences to be noted are that the gradients of curves in the Hookean and post-yield regions are slightly different and that the fibre fractures at a higher strain value at the higher RH. However, it is clear that the unique shape of the stress–strain curve is still maintained at both humidities. These stress–strain experiments were then carried out at the different humidities whilst collecting Raman spectra as described in the experimental section. A typical plot of the Raman spectra of the hair as the fibre is strained is shown in Figure 3. The Raman spectrum of keratin is well understood and is typical of a protein spectrum. The spectra in Figure 3 are consistent, and the assignment of bands used are taken from previous publications.15–17,50 The spectra clearly undergo change as the hair fibre is strained, the main changes are highlighted. The bands sensitive to the secondary structure all show a change from α-helix to β-sheet, i.e., the amide I shifts to higher frequency (∼1655 cm–1 to 1675 cm–1), the amide III band loses intensity at 1340 cm–1 and gains at ∼1240 cm–1, the C–C α-helix band at 930 cm–1 loses intensity. So, all three indicate a loss of α-helix and increase of β-sheet. Also, the S–S band decreases and there are changes to the tyrosine side chain Fermi doublet ratio (defined as I850/I830), which has been shown to give an indication as to the hydrogen bonding environment. 51 A similar plot can be made for the data collected at the different humidities.
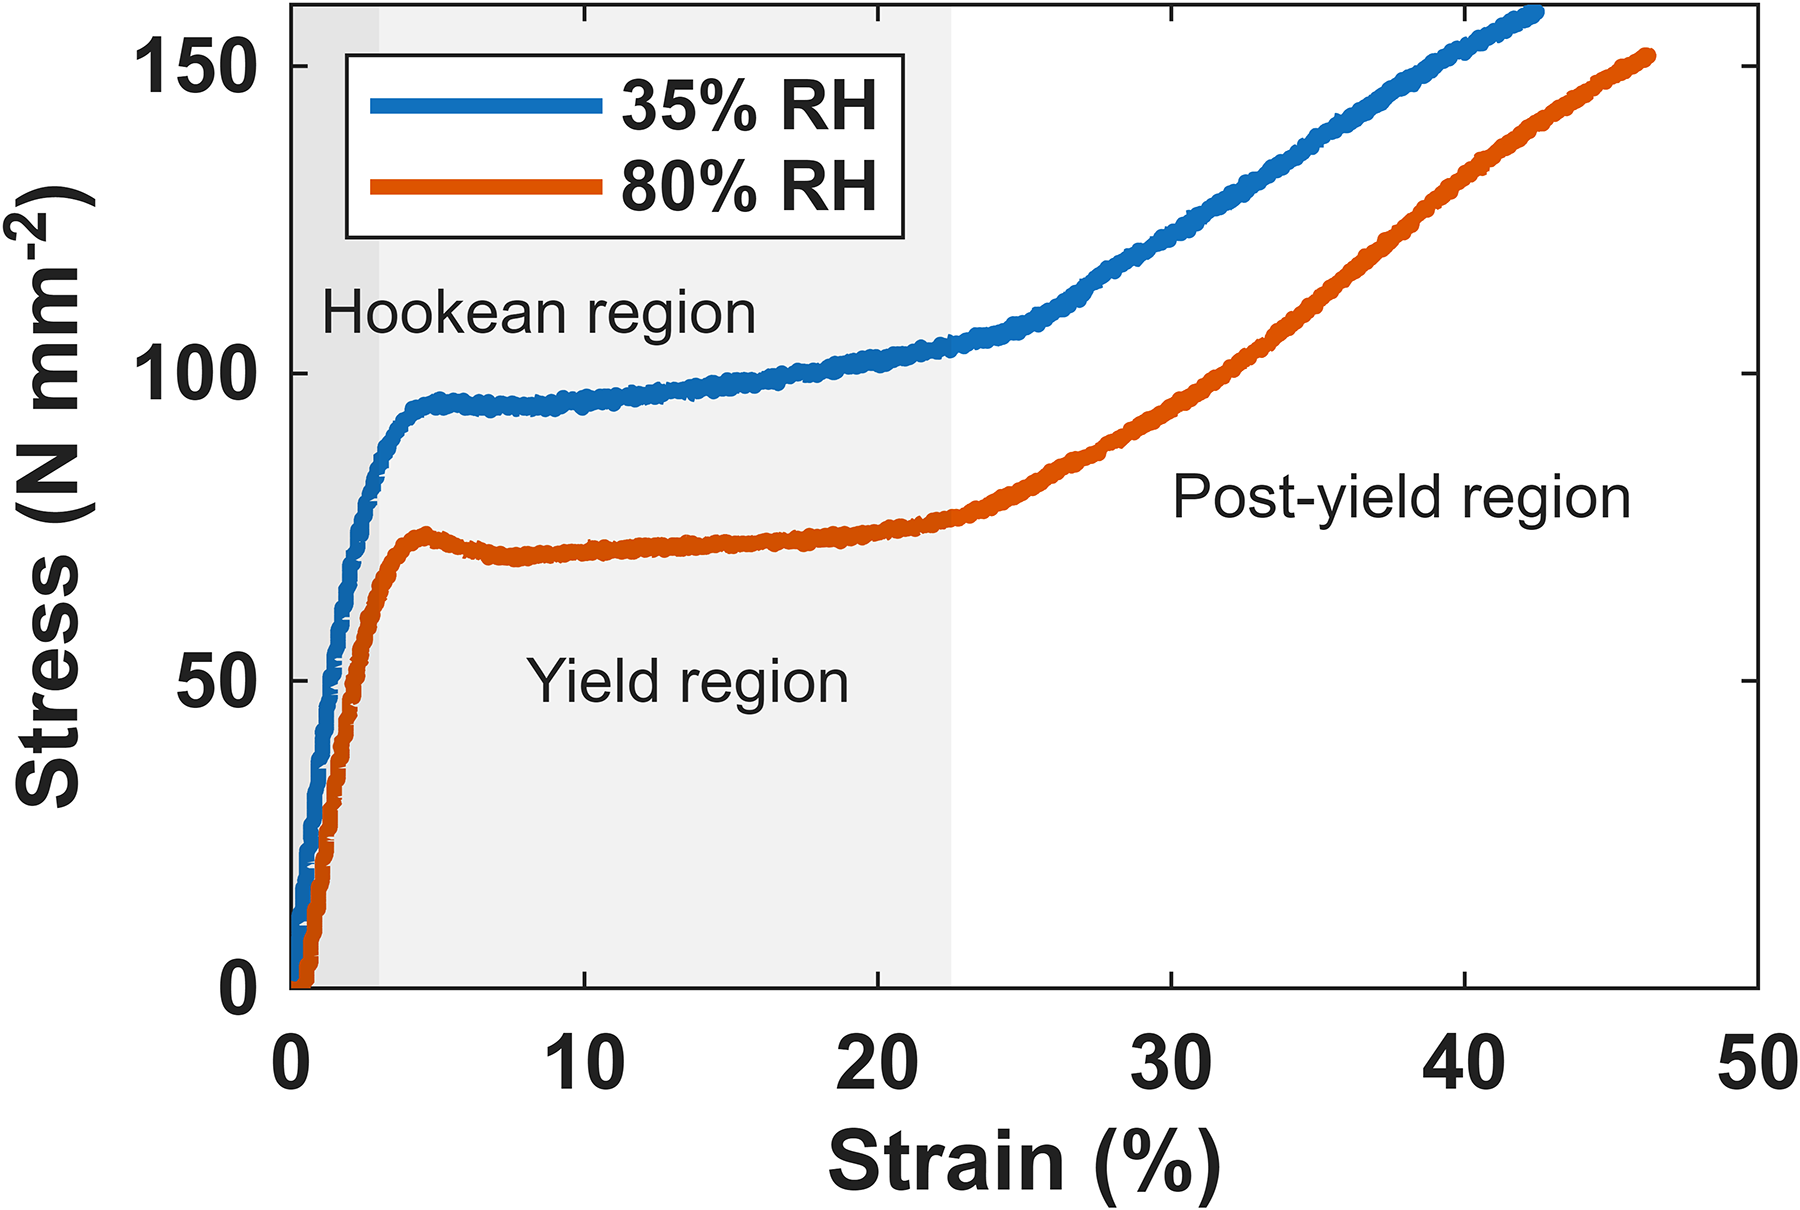
Average of four stress–strain curves for virgin hair fibres at 35% RH (blue) and 80% RH (orange). Fibres were extended at a rate of 5 µm·s–1 up to the point of fibre fracture.
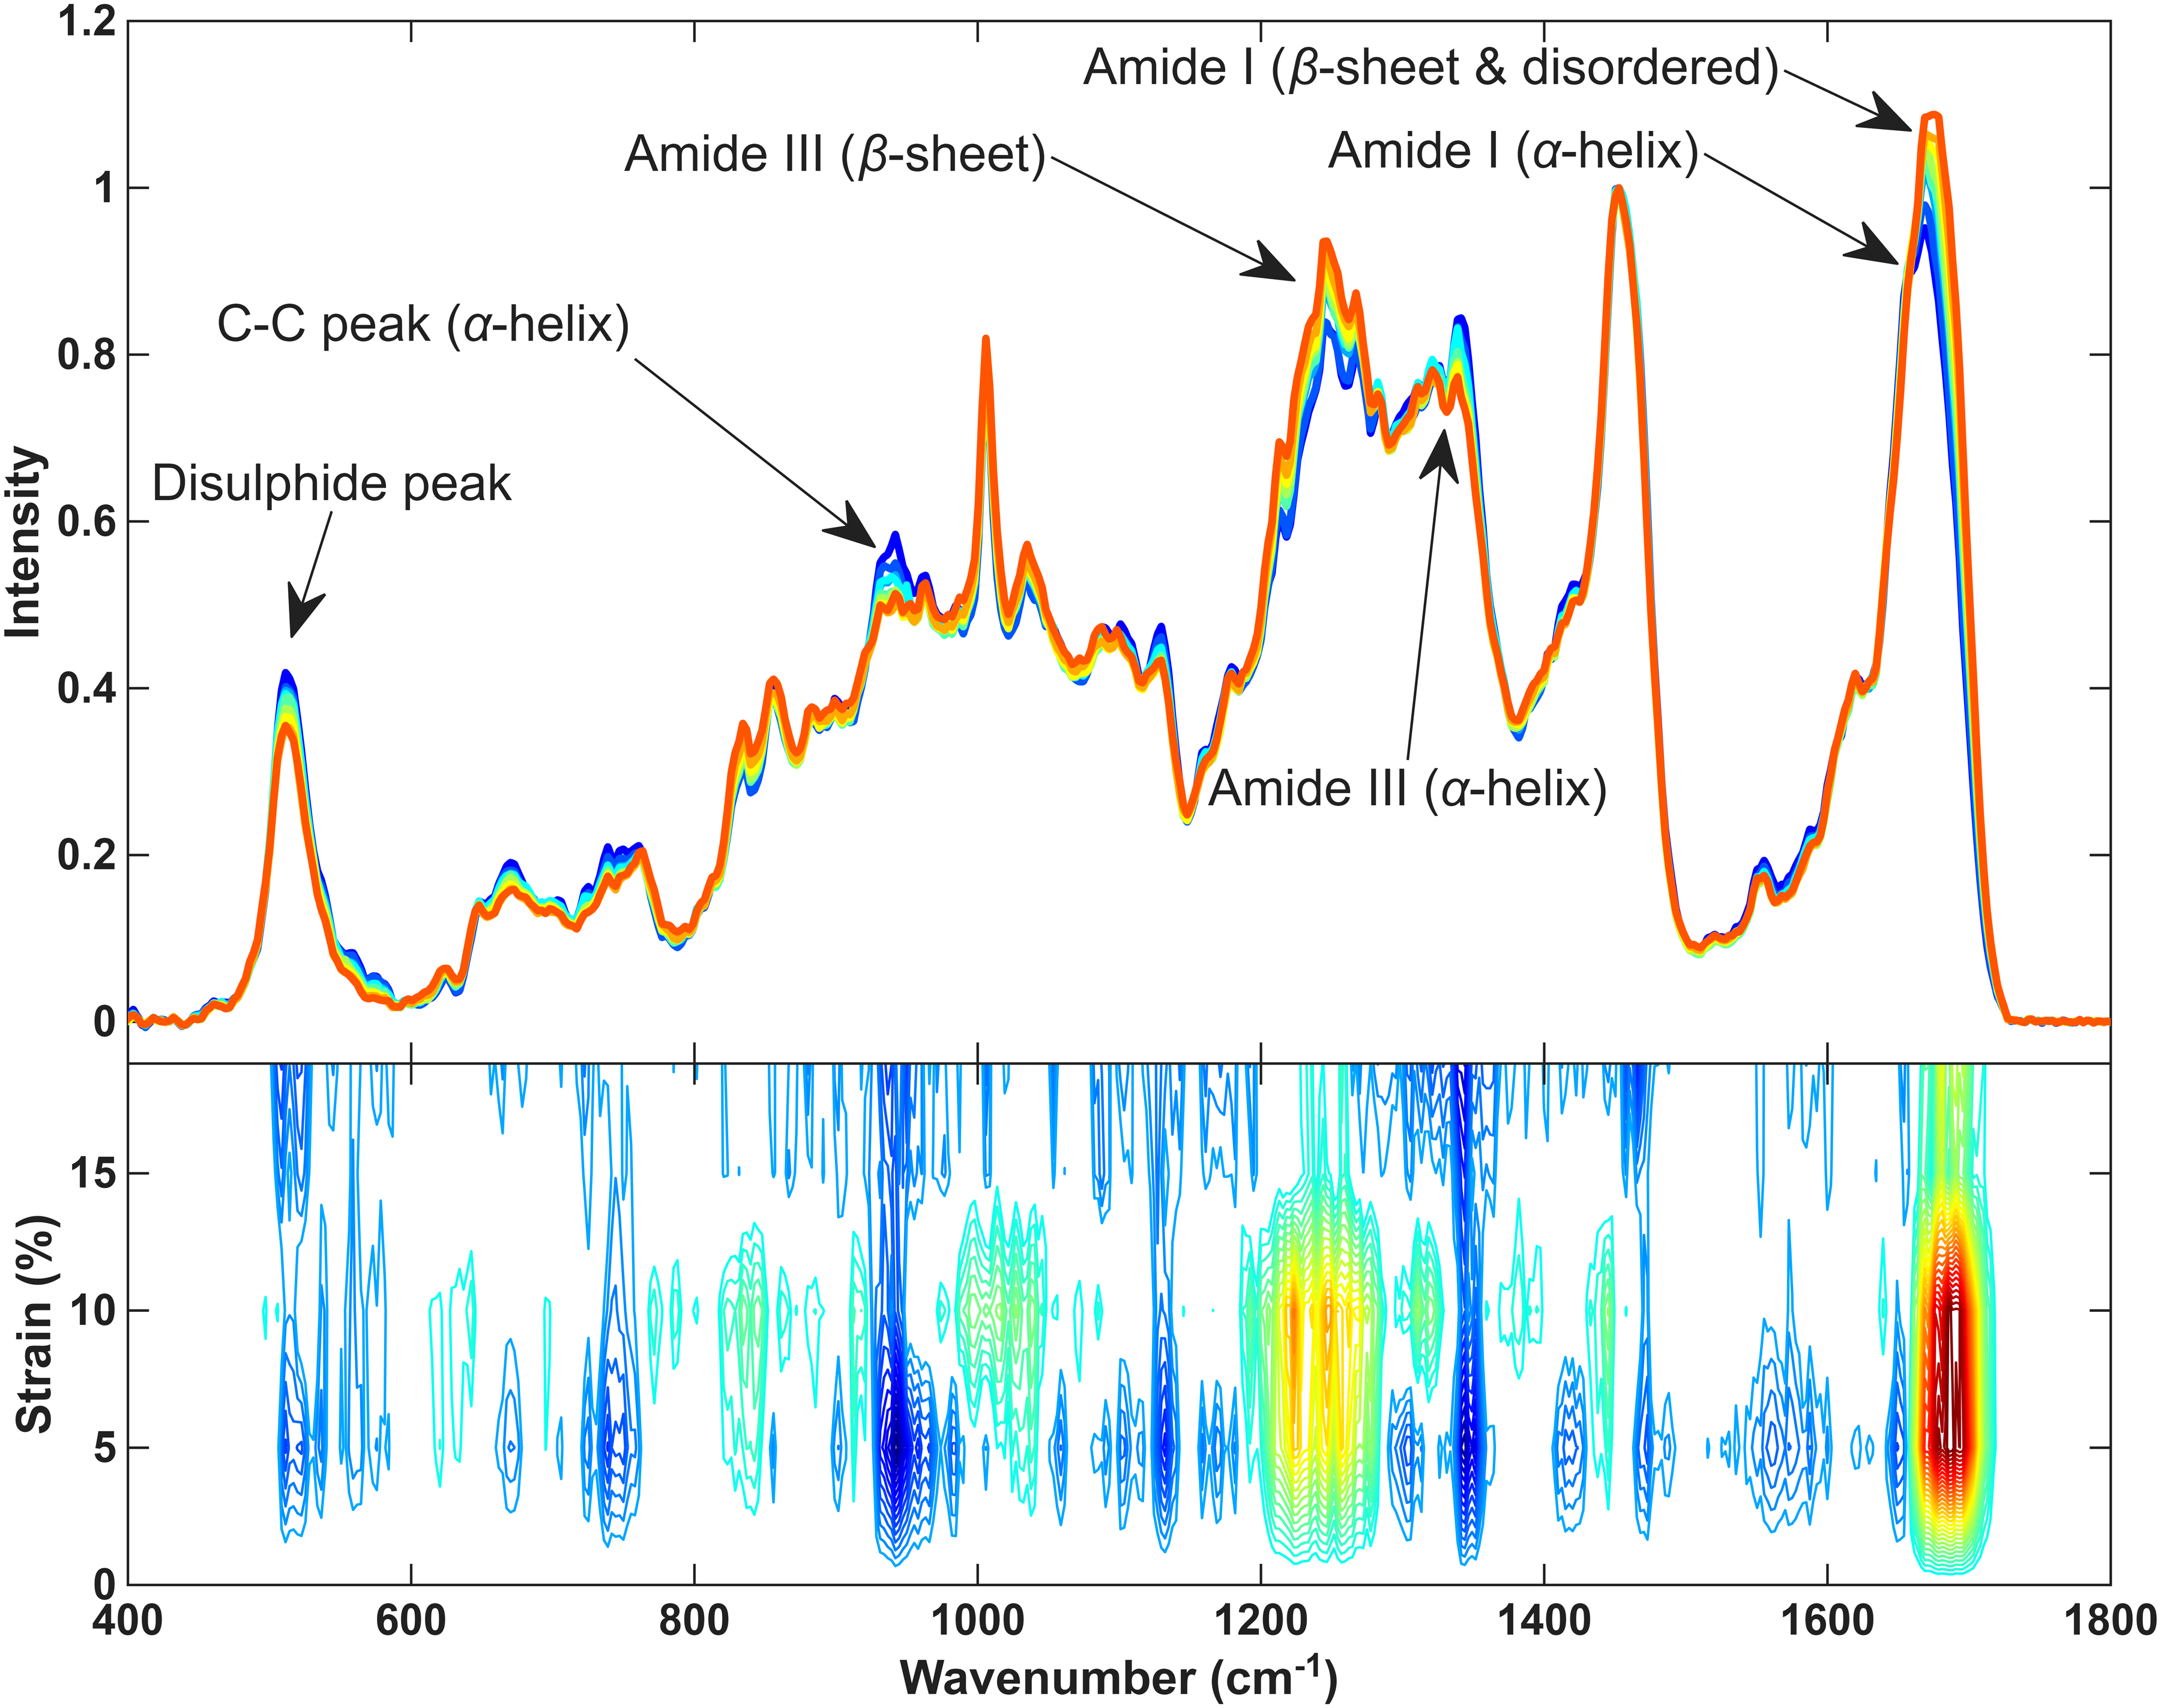
(a) A Raman spectral dataset collected as the fibre was strained at 35% RH. Blue spectra represent low strain moving up to red spectra which represent high strain. Specific areas of change within the spectrum are highlighted. (b) An example PCMW2D plot, relating spectral changes to strain for the first part of a dataset. Blue represents decreasing intensity and red increasing. It also shows how the changes are correlated across the spectrum.
To compare the data from different humidities the initial approach is to look at individual bands that are changing. Figure 4 shows a comparison of how two bands change at 35% and 80% RH. In Figure 4a, a plot of the C–C α-helix band at 930 cm–1 versus strain is shown, the peak intensities have been normalised to the phenylalanine peak at 1003 cm–1. This shows the amount of α-helix present in the sample. It can be observed that at both humidities there is a reduction in α-helix intensity as a function of strain, as expected. It should be noted, however, that some α-helix remains at the end of the stress–strain curve, as indicated by the amide I band, which still shows intensity near 1650 cm–1. However, this intensity change occurs at different points within the stress-strain experiment for the different humidities, with the 35% RH data showing a reduction early in the stress–strain experiment but the 80% RH showing a delayed onset at higher strain. For each individual strain value there is no significant difference found between the two humidities. However, applying statistical methods that use the whole of the data to separate out the effects of humidity and strain, the effect of humidity is significant. The intensity at 80% RH, being significantly higher than at 35% RH.
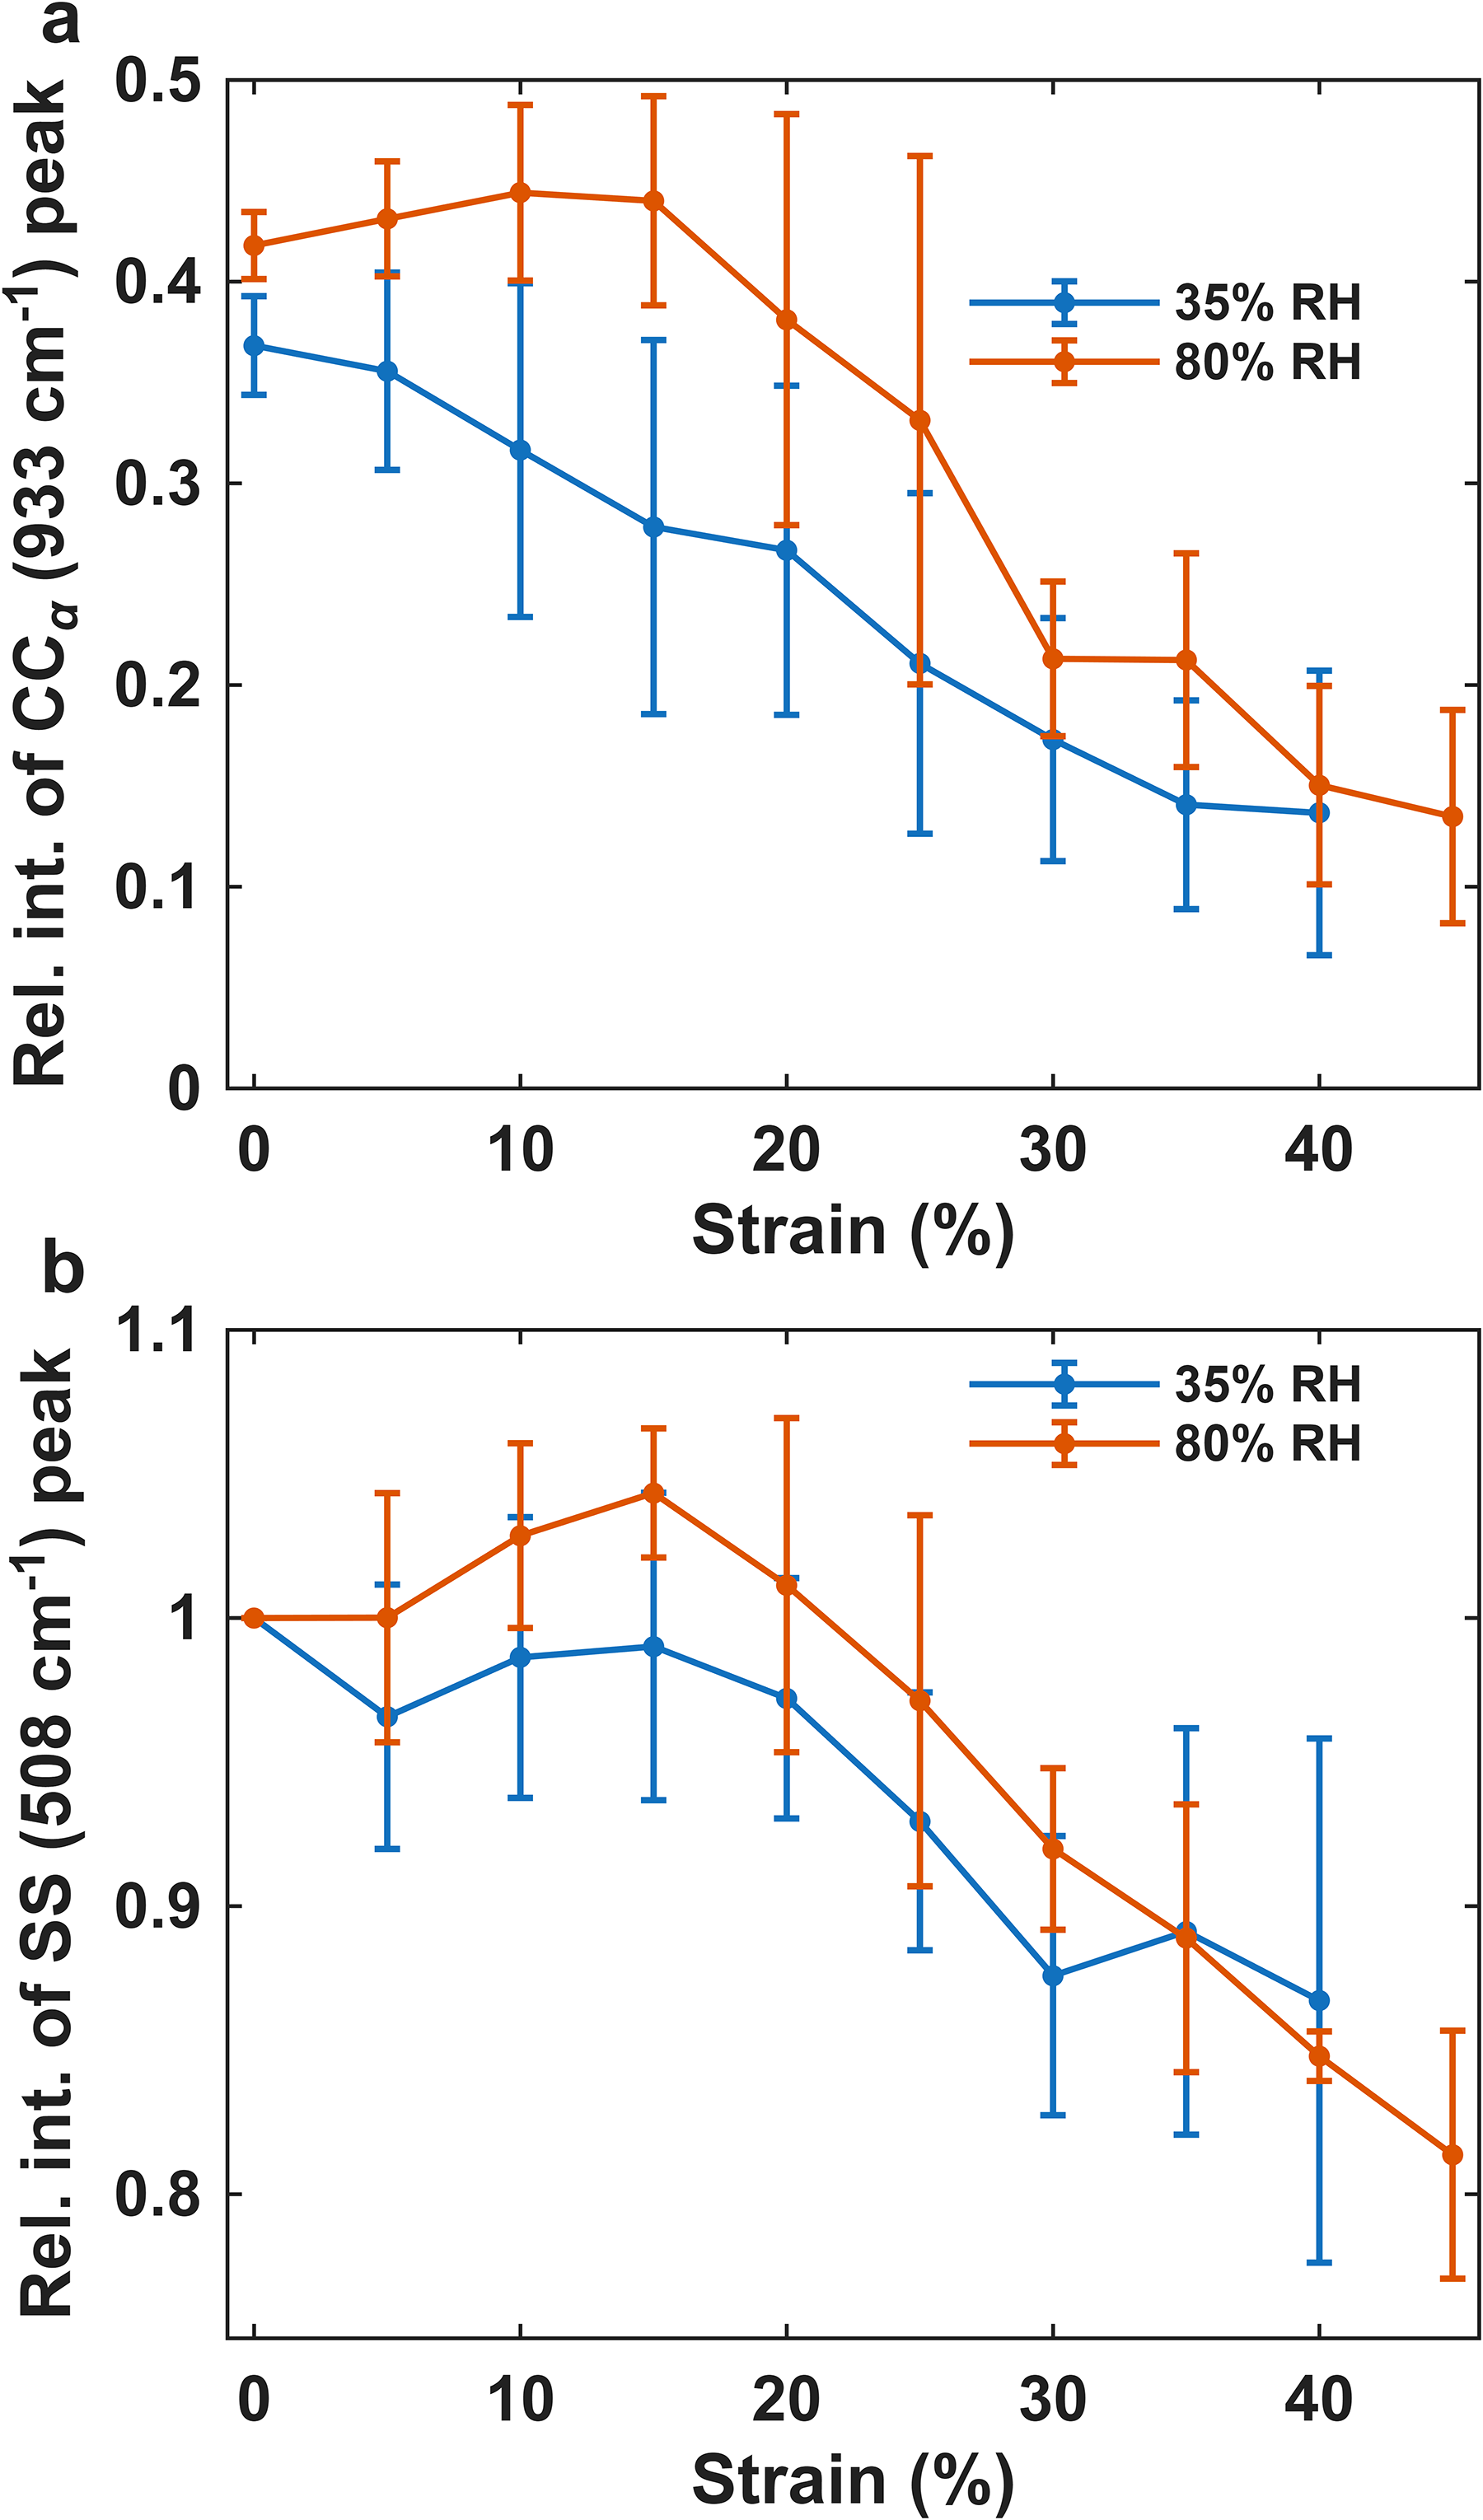
(a) A plot of the peak intensity of the 933 cm–1 band against strain. At 35% RH (blue) and 80% RH (orange). The values at each humidity are an average of four datasets and the errorbars displayed are the standard deviation of the average. All the peak intensities have been normalised to the phenylalanine peak at 1003 cm–1. This indicates the amount of α-helix present in the sample. (b) A plot of the peak intensity of the 508 cm–1 band against strain. This is a measure of the number of S–S bonds in the sample. The values at each humidity are an average of four datasets and the error bars displayed are the standard deviation of the average. All the peak intensities have been normalised to the peak intensity at 0% strain.
In Figure 4b, the S–S band at 508 cm–1 is plotted, an overall decrease in the peak intensity of this band as the strain increases is observed. This suggests the breakage of disulphide bonds with a maximum of 20% lost. The major decrease in S–S peak intensity is observed at higher strain, in the later part of the plateau region and the strain hardening region. In the case of the S–S band there are no significant differences found between the two humidities either when considering individual strain values or looking at all of the data simultaneously.
The results were then analysed using PCMW2D. This is a technique used to look at the changes that occur within the spectrum as a function of the perturbation variable, in this case strain. 41 Figure 5 shows PCMW2D contour plots across a full stress–strain curve of hair fibres at 35% and 80% RH. The blue regions of the contour plot show decreases in spectral intensity, whereas red areas show increases in spectral intensity. These plots show how the spectrum of the hair fibre changes as a function of the strain. The two plots are consistent with the one-dimensional (1D) analysis plots. The decrease of the 508 cm–1 disulphide bond peak is only seen at higher strains. Also, the decreases in the α-helical band at 933 cm–1 begin at different strains, i.e., early for 35% humidity and later for 80% humidity. However, what we also see is that the amide I and amide III bands change at the same point as the 933 cm–1 band, as would be expected, thus giving further confidence in the method.
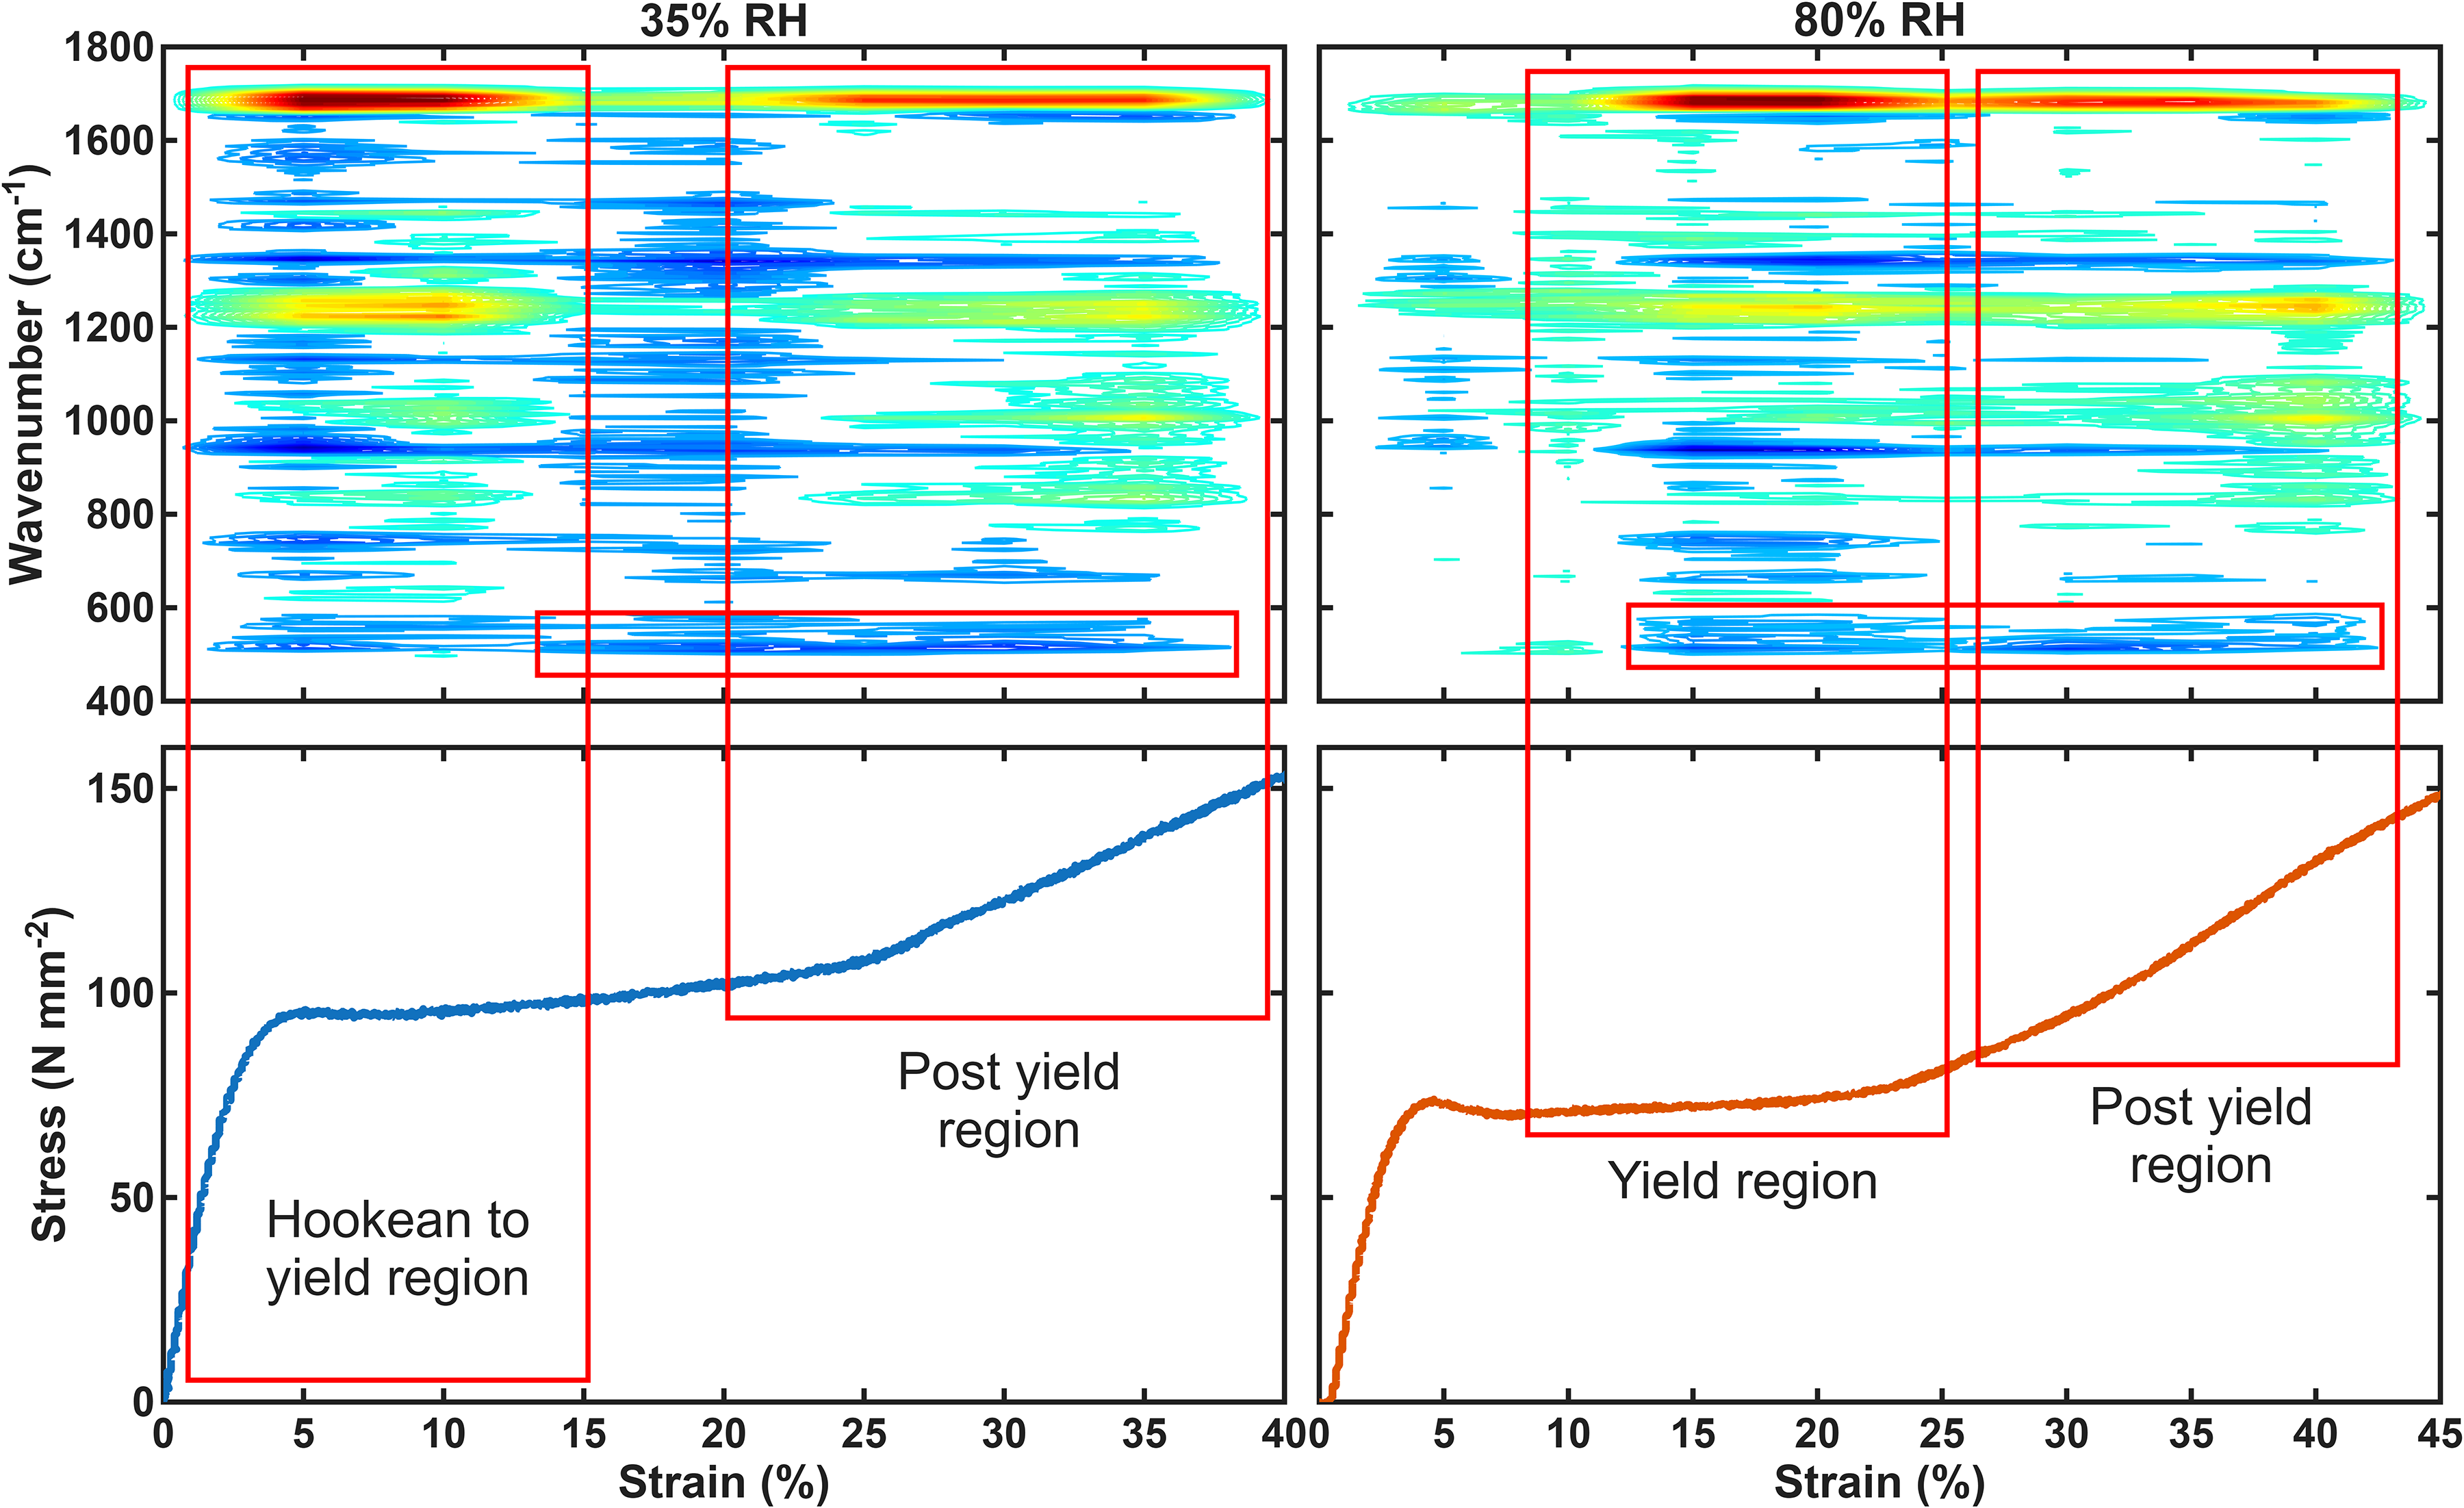
PCMW2D typical contour plots of the synchronous spectrum at each humidity (35% and 80% RH) plotted with the respective continuous stress–strain curves. The red boxes indicate the position of α-helical to β-sheet transitions, and loss of S–S bond intensity.
Focusing on the amide I band region 1620–1700 cm–1, two regions of change can be observed. The first region is a decrease (blue area) in the spectral intensity at 1650 cm–1. As discussed before, this area of the amide I band is assigned to the α-helix conformation of keratin. The second region of change shows an increase in spectral intensity at 1665–1695 cm–1. The β-sheet and what has been defined as the disordered conformation are assigned to 1670 cm–1 and 1685 cm–1, respectively. The decrease in the α-helical region, along with the increase in the β-sheet and disordered region, suggests an α-helix to β-sheet transition. This is consistent with previous work and also with the changes observed in the amide III region. The nature of this α-helix–β-sheet transition is analysed further below.
It can also be clearly seen that there are two separate areas of change. At 35% humidity the first occurs with a mid-point at 8% strain and the second occurs at 25% strain. The average transition locations (% strain) are given in Table I along with the start and finish of the transition. These two distinct regions of change clearly show two α-helical to β-sheet transitions occur as the hair fibre is strained. At 80% humidity two transitions are also clearly observed however these two areas occur at different strain values. These changes are similar in nature to those at 35% humidity, i.e., α-helix to β-sheet transitions.
The positions (% strain) of the different transitions from the Raman measurements of the tensile experiments obtained from PCMW2D analysis. An average of at least three experiments in each case.

The midpoints of both transitions move to higher strain by similar amounts (14% and 13%) at the higher humidity, the first transition occurs at 22% strain and the second transition at 38% strain at 80% RH. These shifts in strain values corresponding to the transitions, suggest that humidity has a significant effect on the mechanical behaviour of the hair fibre on a molecular level.
In the 80% RH data there is a suggestion of a weak transition at low strain. To look at this in more detail the experiment in the low strain region (up to ∼25% strain) was repeated using 2% strain intervals. Figure S1 (Supplemental Material) shows the PCMW2D plot of this 2% interval data compared with the 5% interval data. It can be seen that this transition appears in this data as well, confirming that this is a real feature. Examining the amide I band (data not shown) shows a slight shift with this low strain but still within the α-helical region. This suggests that the bonds are strained, altering the ψ and φ Ramachandran angles of the amide bond and thereby shifting the band, without a change in secondary structure.
The PCMW2D analysis is very good at showing where changes/transitions occur with regard to the perturbation, in this case strain. To examine in more detail what changes are occurring within a transition, a different analysis method from within the 2D group is best used, i.e., 2D-COS. This technique looks at the changes that occur within the spectrum and shows which changes correlate to each other, as well as determining the order of these changes. 37 The amide I band is the focus here, as this region exhibits significant changes and corresponds to the α-helix to β-sheet transitions observed in the PCMW2D analysis. Each transition that was observed using the PCMW2D analysis was segmented into small datasets then each transition was analysed separately. Figure S2 shows the synchronous and asynchronous contour plots of the first α-helical to β-sheet transition at 35% RH. Looking at the synchronous spectrum, two main areas of correlation can be seen. Firstly, the region (1650, 1670−1695 cm−1), is an area of negative correlation, as signified by the blue contour lines. This means that the α-helix region (1650 cm−1) decreases as the β-sheet/disordered region increases. The second region (1670−1695, 1670−1695 cm−1) has red contours, this means positive correlation, i.e., the β-sheet region (1670 cm−1) increases as the disordered region increases. This is summarised in Table II. Focusing on the asynchronous spectrum which appears slightly more complicated than the synchronous one. Here the sign of the peaks in the spectrum are used to draw conclusions. Positive peaks can be seen at (1650, 1670 cm−1) and (1650, 1685 cm−1), whereas a negative peak is observed at (1670, 1685 cm−1). By noting the peak signs for both the synchronous spectra as well as the asynchronous spectra, conclusions can be drawn regarding the sequential order of changes. These results are also all summarised in Table II. It is found that the α-helix peak decreases before the β-sheet peak and the disordered peak increases. The disordered peak is found to increase before the β-sheet peak. This result implies that the mechanism is α-helix to disordered and then to β-sheet. Similar results were found for both transitions and at both 35% and 80% RH. This finding supports the work done by Qin et al. 52 They performed molecular dynamics simulations on the straining of two α-helical protein filaments and found the protein to transition to a β-sheet conformation via a disordered state.
Summary of the generalised 2D correlation spectroscopy results at 35% RH in Figure S2, which shows the correlation sign for assigned bands for the synchronous and asynchronous plots and also shows the order of the changes.

WAXS/Tensile
Various structural levels of organisation in hair can be observed by means of WAXS.53–56 Typical WAXS patterns of a single hair fibre at 80% RH with 0% and 60% strain are presented in Figure 6. Of interest in this study are the spacings characteristic to the secondary structure of the keratins. The meridian arc located around 0.51 nm (Figure 6a) corresponds to the α-helix pitch along the coiled–coil axis and it reflects the fine configuration of the residues.57,58 The equatorial spot at 0.97 nm corresponds to the spacing between helices and interferences between the coiled–coil chains. 59 The same equatorial feature at 0.97 nm was also assigned to the spacing between β-sheets. 26 Another feature in the WAXS pattern can be observed in Figure 6b, which is the equatorial spot around 0.47 nm, where the hair fibre is stretched to 60% strain at 80% RH. This was assigned to the lateral distance between the chains in the β-sheet structure. 26 There are a few differences that can be clearly observed based on the visual inspection of the two WAXS patterns in Figure 6. First, the 0.51 nm arc is not present at 60% strain. This is a clear indication that the α-helix organisation was vastly affected. The spots at 0.47 nm and at 0.97 nm present at 60% strain suggest that β-sheets are formed. An additional meridian 0.33 nm arc was claimed to accompany this structure type; however, this was not consistently recognised in other publications.26–28,60 No arc at 0.33 nm could be identified in the current dataset.
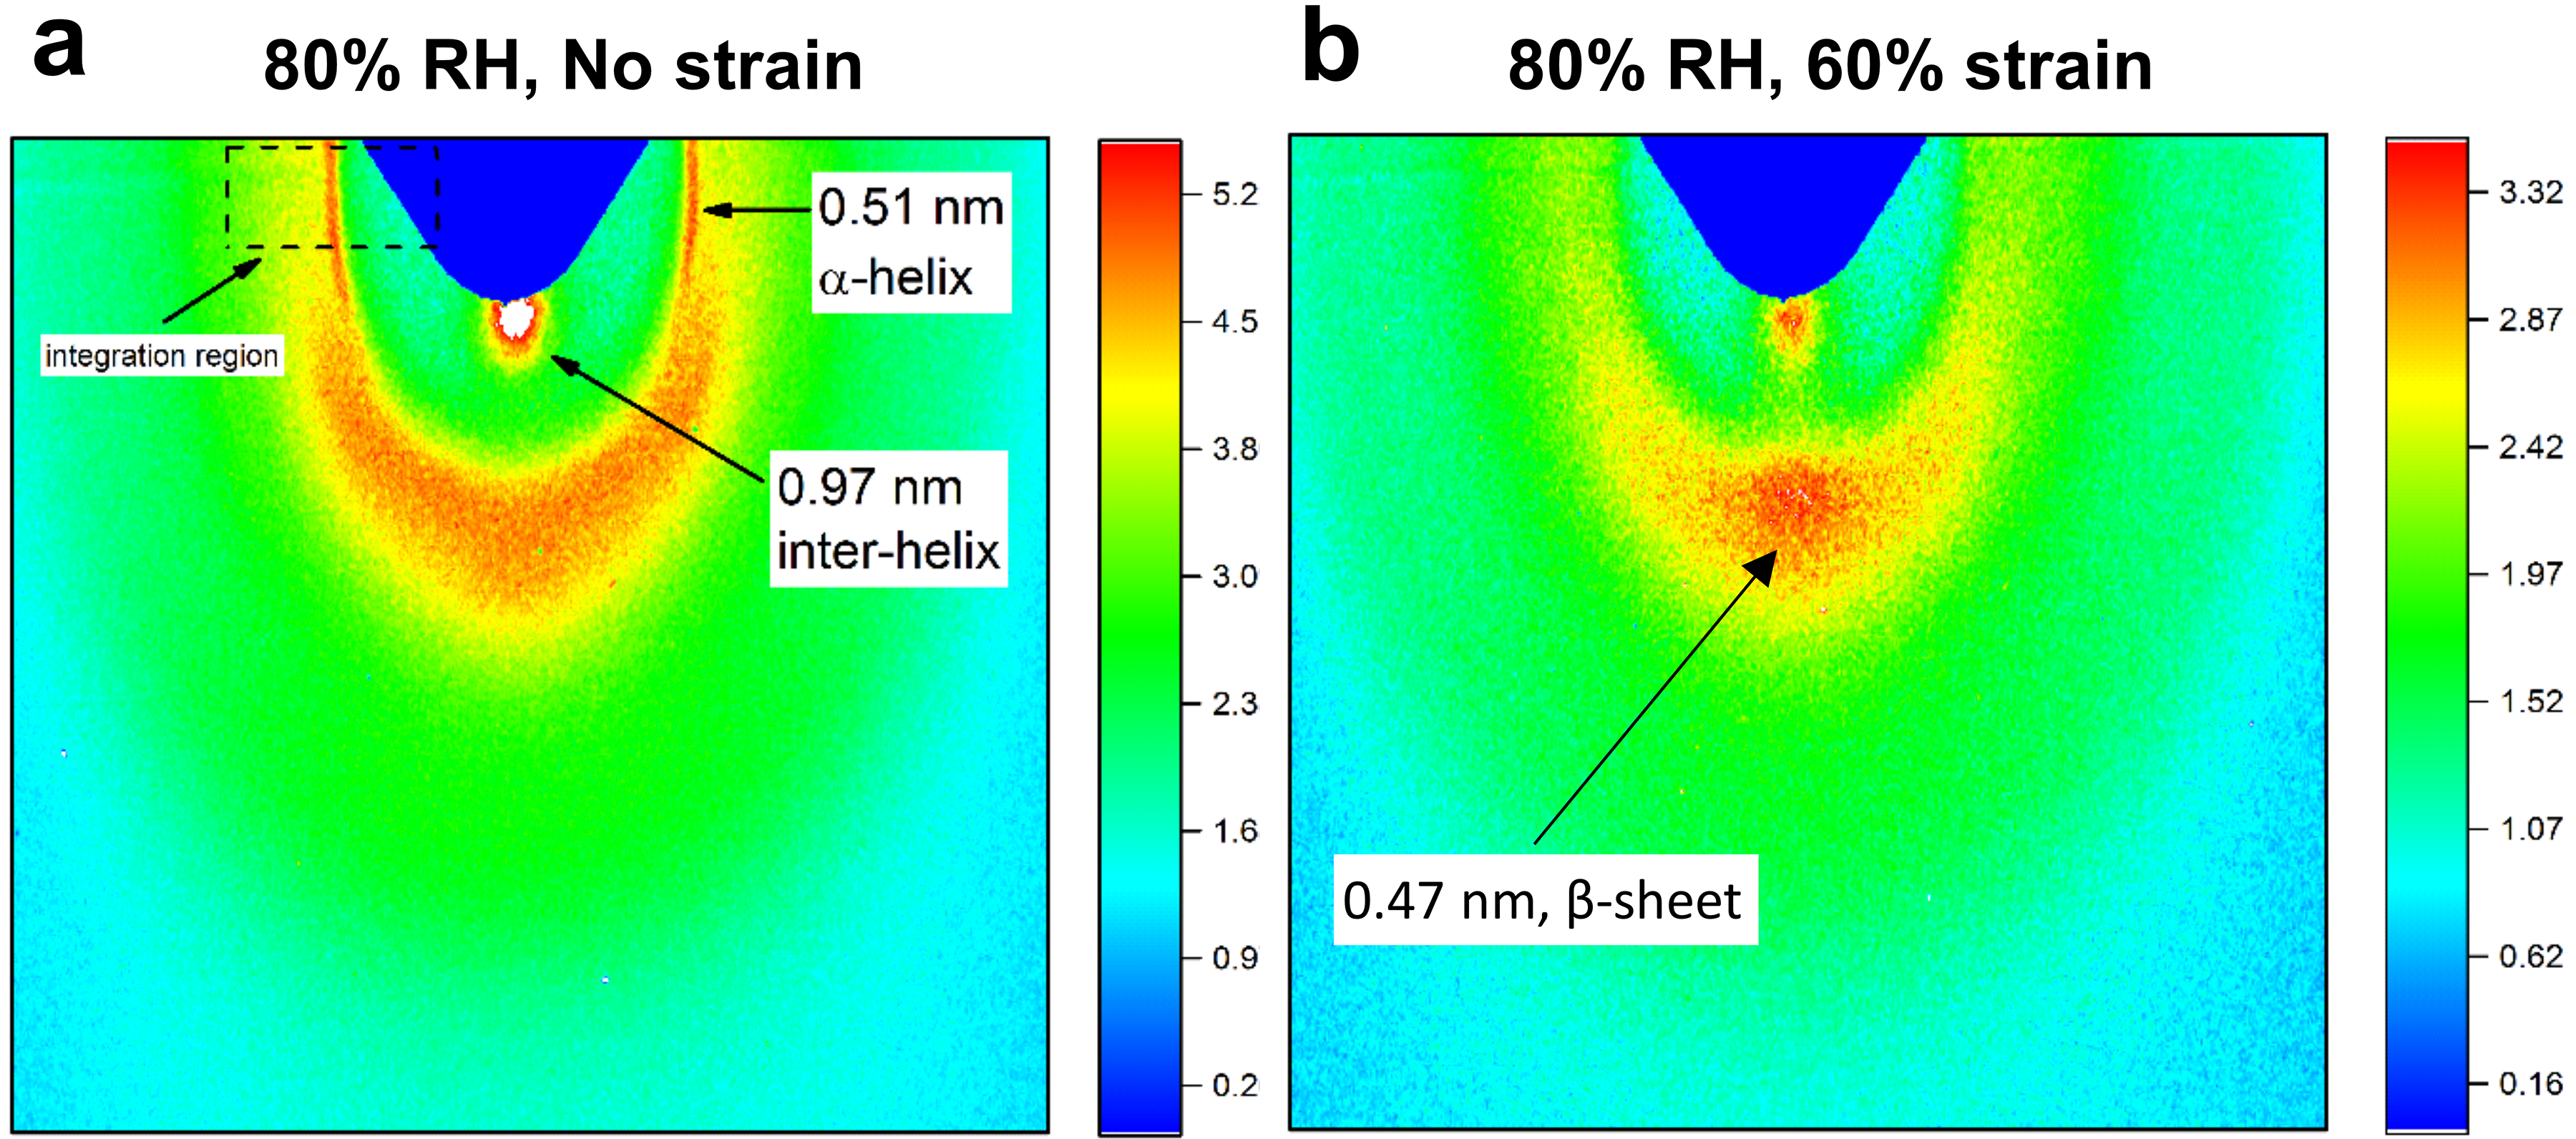
WAXS patterns of a single untreated hair fibre at 80% RH with (a) no strain applied and (b) 60% strain.
The one-dimensional profiles for an untreated hair fibre at 80% RH as a function of strain are presented in Figure 7a. A detail of the unstretched fibre is shown in Figure 7b, where two resolved peaks are highlighted: The characteristic peak of the α-helix pitch at 0.51 nm and the 0.5 nm peak of the less ordered coiled–coils. 58 These two peaks can still be resolved at 5% strain (Figure 7a) and merge into a single, broader peak, above 10% strain. It can be observed that with increasing strain the α-helix peak levels off monotonically.
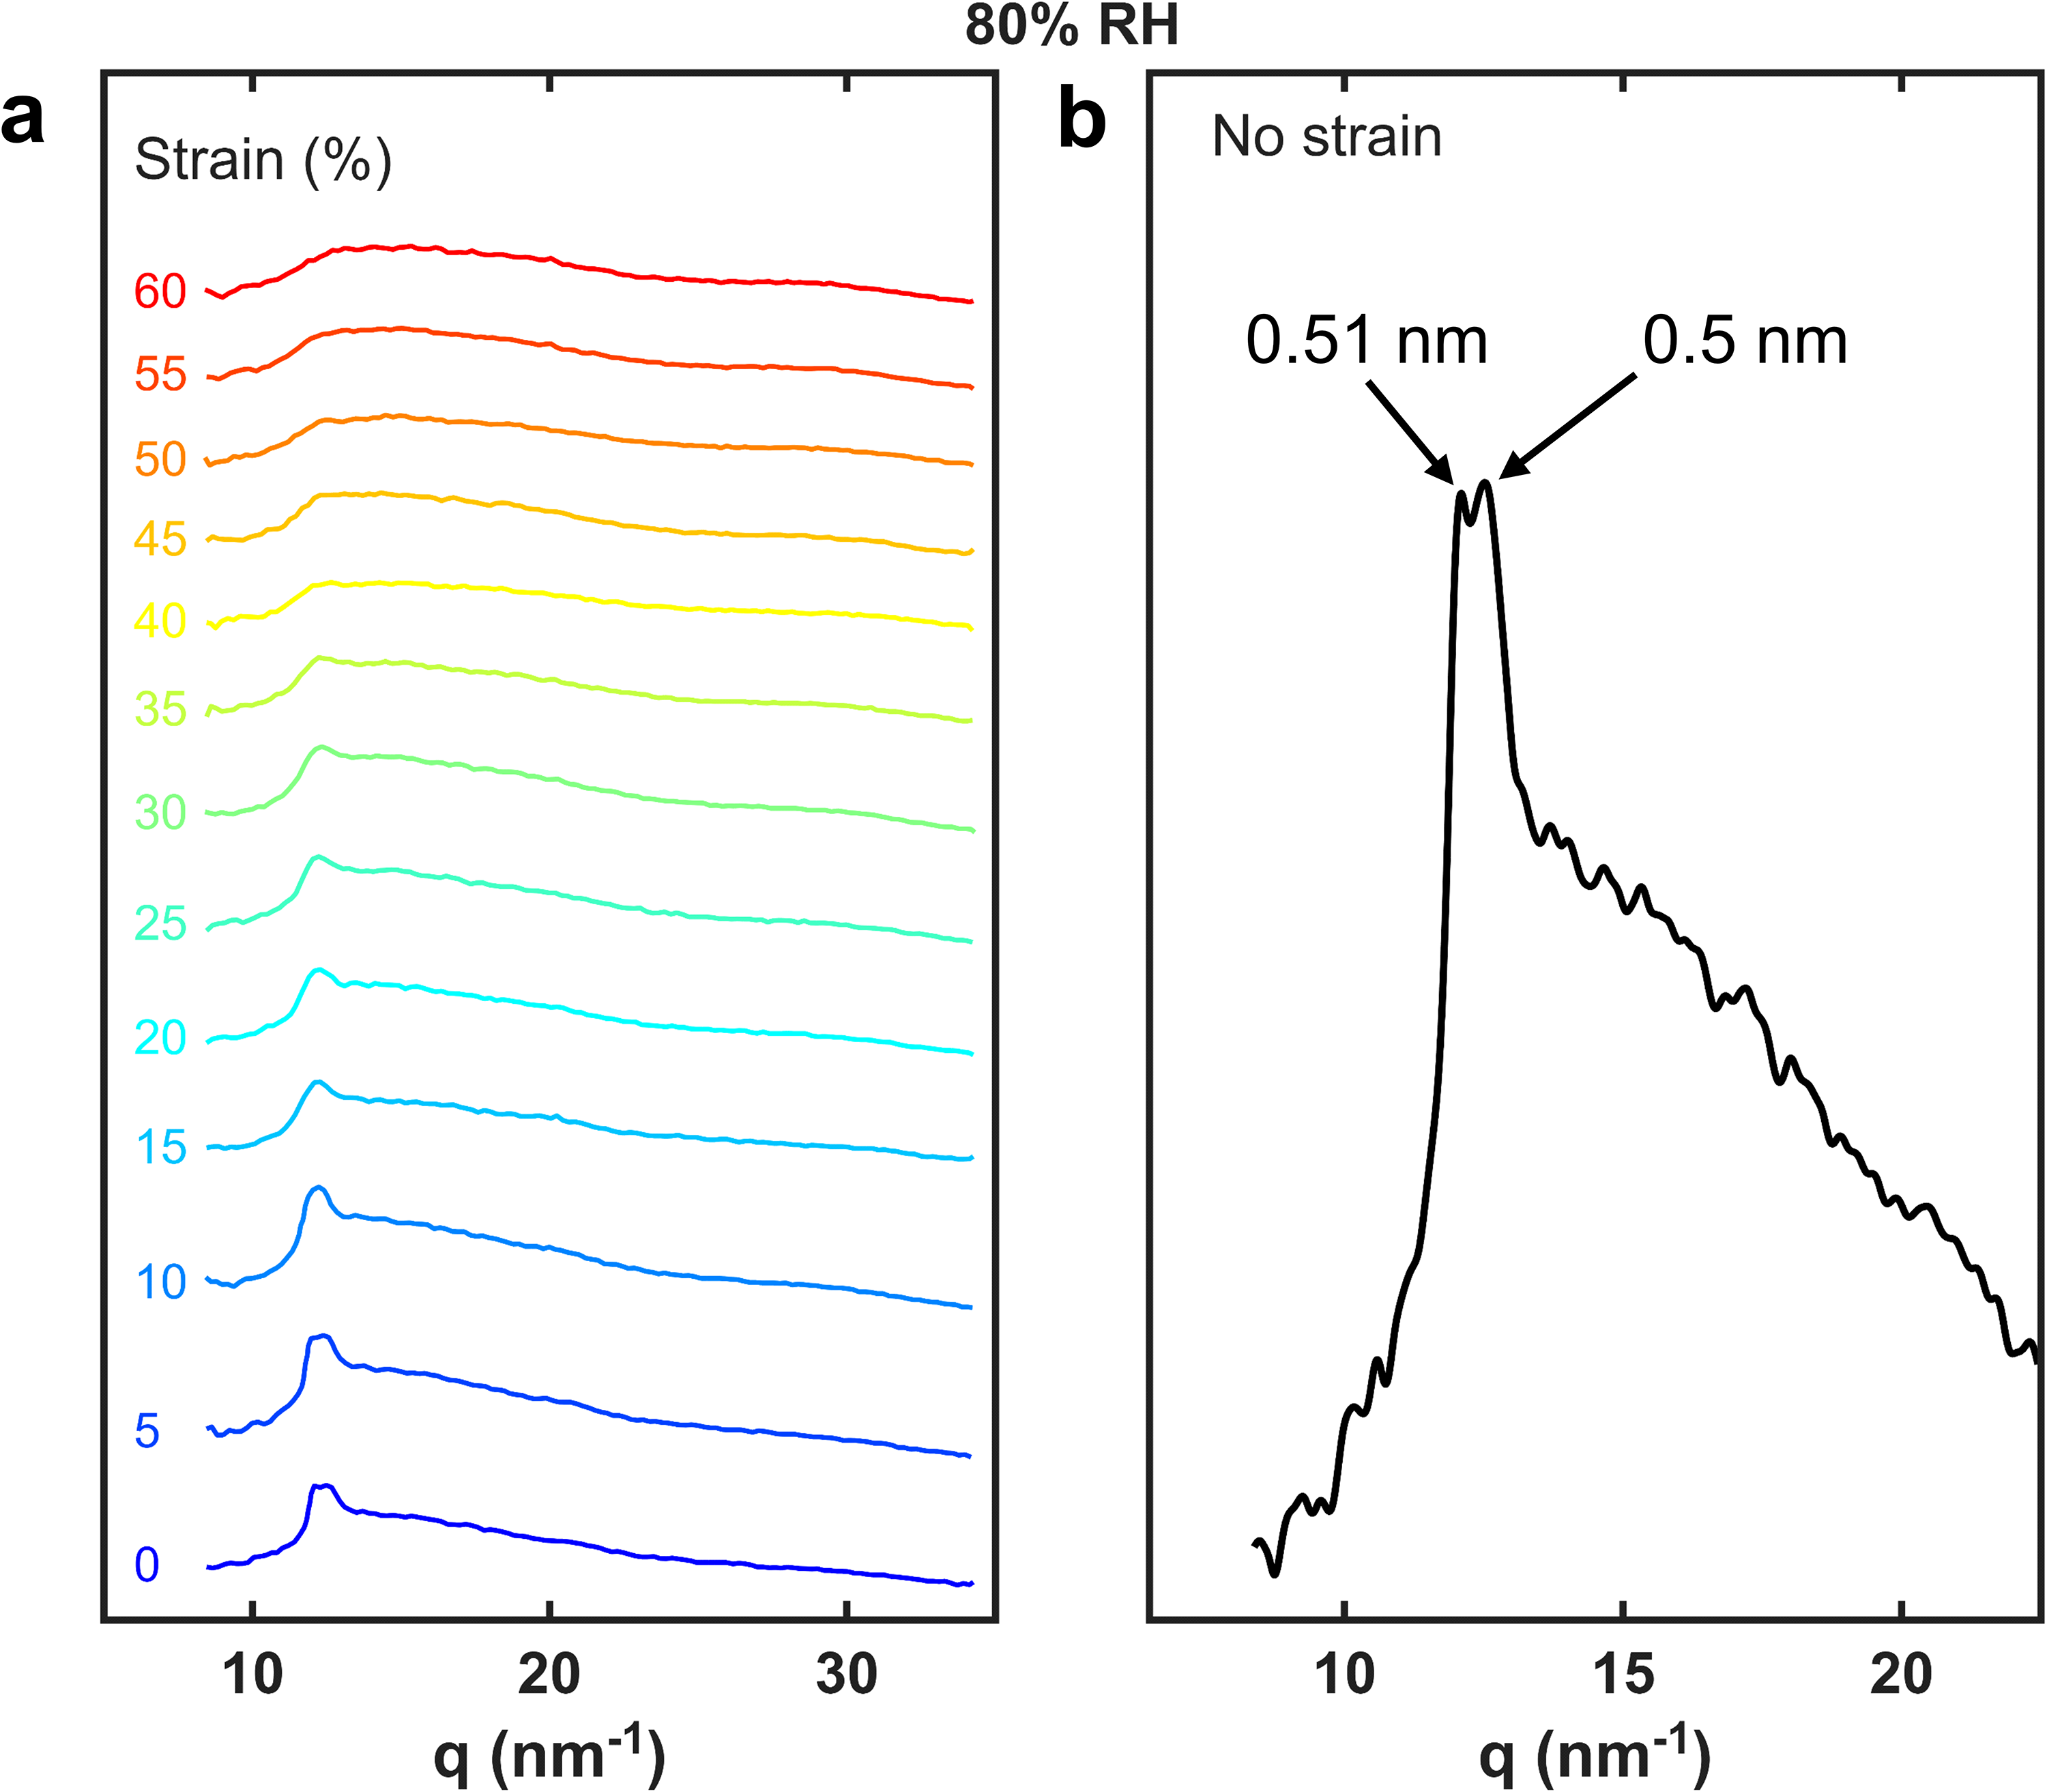
(a) One-dimensional WAXS profiles as a function of strain, obtained by azimuthal integration of the region indicated in Figure 6a and plotted as a function of q (nm−1). (b) Expanded view of the zero-strain profile, showing peaks assigned to the α-helix pitch and coiled-coil packing. The labels 0.51 nm and 0.50 nm denote the corresponding real-space d-spacings (q = 2π/d).
A β-sheet feature was observed upon hair stretching and is highlighted in the WAXS pattern presented in Figure 6b. As described in the Data Analysis section above, the line shape was analysed using a double sigmoidal function. The results are presented in Figure S3a in the Supplemental Material. It was observed that the full width at half maximum (FWHM) of the line fit decreases with increasing strain. We attribute this to the increasing contribution of the β-sheet to the relatively strain invariant, already existing, broad signal. The profile along the x-axis of the pattern-image in Figure S3b (Supplemental Material) reveals the β-sheet visible at 60% strain as a superposition of a narrow component on top of the profile at no strain. These profiles were normalised to a different threshold so that the shape of the broad profiles are matching in both cases to ease the visual comparison. These profiles were subjected to a single Gaussian lineshape fitting for strain values up to 30% and no significant differences were observed. Above 35% strain the profiles were fitted using three Gaussian functions: two symmetric relative to the profile peak to best describe the complex lineshape and a centric one, narrower, that reveals the β-sheet formation (Figure S3b and Figure S4b). The results of the fits are presented in Figure S4b (Supplemental Material), where the integral of the narrow Gaussian peak relative to the total peak area and its FWHM are represented as a function of strain (these two parameters were normalised to their maxima to ease the visual inspection on the same plot).
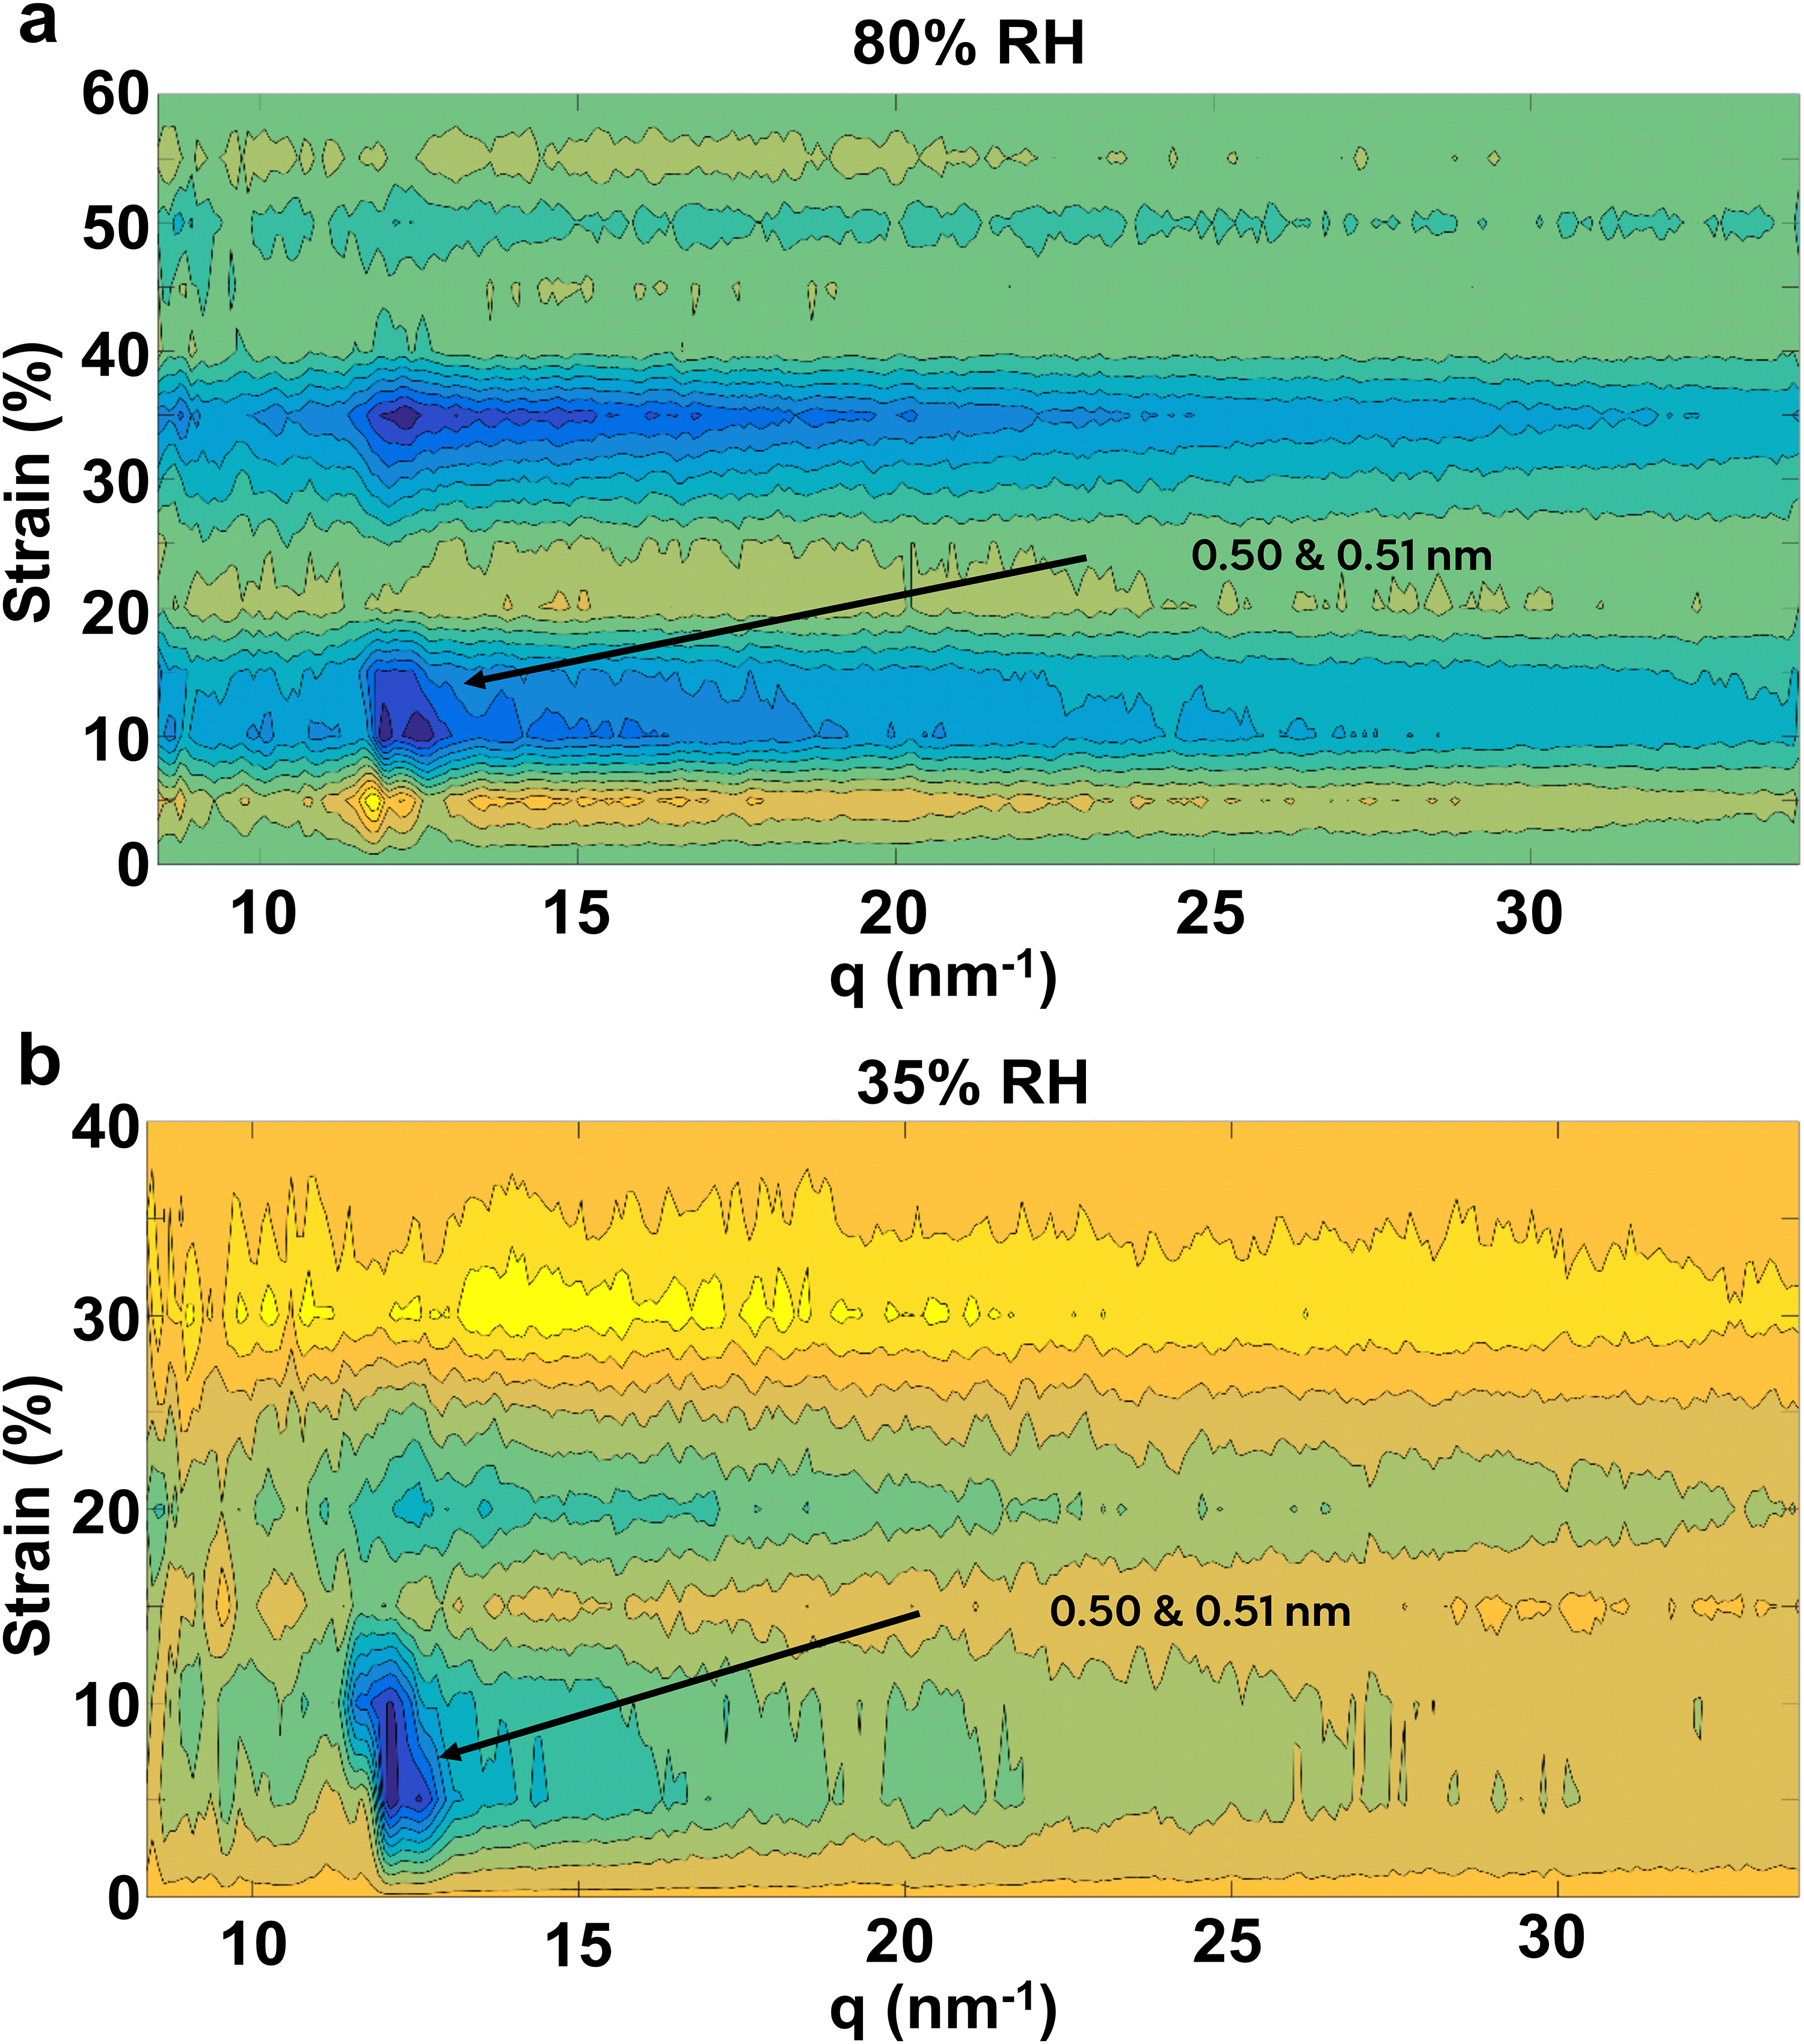
PCMW2D analysis was applied to WAXS one-dimensional profiles like the ones shown in Figure 7. The resulting contour plots as a function of strain are presented in Figure 8. Similar to the Raman results, these plots show how the WAXS profiles in the integrated α-helix region change as a function of strain. The observations from the one-dimensional profiles for the 80% RH condition (Figure 7) can easily be recognised in the PCMW2D plot (Figure 8a). Both peaks at 0.5 and 0.51 nm are present at no strain and merging into one broader feature at 15% strain. Above this strain value, a small decrease of this feature is observed up to 35%, where a more pronounced change is noticed. At higher strain, the profiles do not seem to change further. As was already mentioned in the analysis of the Raman spectra, the PCMW2D method is extremely useful at revealing changes/transitions that are due to a perturbation like strain. Inspection of the PCMW2D plots for 35% and 80% RH leads to a few additional insights. The first modification of the α-helix peak appears at lower strain at 35% RH. It can be observed that this transition spreads over a strain interval of 5–10% at 35% RH and of 10–15% at 80% RH (as indicated by the dark blue spots). A second change can be observed around 15–25% and 30–40% strain, respectively, at 35% and 80% RH. These changes are consistent with the transitions observed by Raman (Figure 5). The slight differences in strain levels associated with these transitions between the two measurement techniques likely reflect fibre-to-fibre variation, as well as differences in the techniques' sensitivity to α-helix domain size. Fibre to fibre variation may also be responsible for the fact that the second (higher strain) transition was only seen for one of the two fibres measured at 35% RH. The changes shown in Figure 8 originate strictly from the α-helix WAXS signal, therefore they are not indicative of the β-sheet formation. The loss of the sharp signal at 0.51 nm indicates that α-helical structure is less organised. The further decrease in the broad signal around 0.51 nm with strain indicates a major loss in α-helix crystallinity. These changes observed in the PCMW2D plots of the α-helix (Figure 8) are in concert with the changes observed in the β-sheet in Figure S5. It is clear that changes in the β-sheet are present and most intense at 15% and 40% strain at 80% RH. This is in agreement with the changes in the α-helix and therefore confirms the existence of two transitions during strain.
Discussion
This paper describes studies on hair fibres under strain by two different methods, Raman spectroscopy, and WAXS. Many studies have looked at tensile properties of hair before and the overall top line conclusion has not changed, i.e., during a tensile experiment the keratin undergoes a α-helix to β-sheet transition. However, what has been at dispute is how and when these transitions occur and how local conditions affect them. Thus, various WAXS studies were reported on different keratin fibres under different strain and humidity conditions. The X-ray diffraction pattern of the α-helix of unstrained human hair has two characteristic features, a 0.51 nm feature on the meridian and a 0.98 nm feature on the equator. Upon stretching, a different diffraction pattern is observed, the β-sheet, which has equatorial diffraction spots at 0.465 nm and at 0.98 nm. Depending on the experimental conditions and the performance of the X-ray instruments, the α-helix to β-sheet transition induced by fibre strain varied in its location and remained a subject of debate for more than 80 years. Among the first to report on this topic was Astbury who found that the α-helix pattern fades away and the β-sheet features appear obvious around 30% strain in human hair. 7 Both α-helix and β-sheet features coexist up to a strain of 60% where α-helix signal has completely vanished. These observations were recorded at (unknown) ambient humidity conditions. Bendit used a bundle of about 1000 wool fibres to study the α-helix to β-sheet transition upon strain at different RH and temperature conditions. 28 Evidence of the transition was based on analysing the intensity of the meridian arc at 0.51 nm and of the equatorial spot at 0.465 nm. It was found that the transition occurs already at strain values as low as 5% and that it gradually spreads approximately linearly over a certain, RH dependent, strain interval.
Skertchly et al. 61 reported work in which wool fibres were stretched in water and then measured at 45% RH following relaxation for at least 4 hours. Formation of β-sheet was reported as slower below 10% extension and was then approximately linear up to 100% extension with no α-helix left. However, this experiment allowed a lot of time for structural rearrangement. A deficit in the total amount of observed crystalline material suggests the presence of an intermediate state, particularly in the middle of the extension range. Chapman also investigated horsehair fibres extended up to 30% in cold water, 60 subsequently immersed in water at different temperatures, dried while keeping the strain and then measured. The α-helix to β-sheet transition was identified by the progressive loss of the 0.51 nm α-helix feature and appearance of the 0.465 nm β-sheet feature. Cao conducted in-situ WAXS measurements of single hair fibres (Caucasian red hair) under strain and steam setting and concluded that a α-helical to β-sheet transition does not occur upon stretching but during the steam setting on the strained fibre.12,13 The β-sheet pattern was also not observed if a wet fibre was stretched to 40% strain, but it was revealed if the fibre was further set using steam, thus the author concluded that the combination of humidity and (high) temperature conditions are necessary to trigger the α-helical to β-sheet transition. The transition from α-helix to β-sheet in wet horsehair from the tail was mentioned to consist of a two-step mechanism: unravelling of the α-helix coils starting at ∼5% strain and refolding of the unravelled coiled–coils into β-sheet structures. 26 The formation of β-sheets was however conditioned by a minimum RH of 30%. The β-sheet characteristic equatorial diffraction features at 0.46 nm and 0.95 nm were observed in concert with the decrease of the α-helix meridian arc at 0.51 nm; the β-sheet meridian arc at 0.333 nm was vaguely observed at 53% strain just before fibre breakage and its existence is questionable given the signal quality. 26 Another study published by partly the same authors on horse hair at 30% RH did not reveal the 0.333 nm feature on the full strain range up to breakage at ∼ 52%. 62
A previous Raman study showed an α-helix to β-sheet transition during a tensile experiment but was unable to identify the localisation of separate transitions at different strains and concluded that there was a general change throughout the stress–strain curve. 23 The S–S behaviour was concluded to be different with some S–S bonds breaking early in the stress–strain curve and more breakage later. However, in a review paper one of the authors showed the same data with a straight line drawn through it instead indicating a gradual decrease over the whole of the strain range. 63 It appears the error in the measurements was not low enough to conclude where a distinct transition was although it was clear that the S–S bonds were broken.
The variability in the experimental conditions used to study hair fibres under strain have led to different hypotheses in modelling hair fibres and their mechanical properties. These hypotheses were supported by the situational interpretation of how and when the keratin transformation from α-helix to β-sheet takes place. Approximately linear unfolding as a function of strain is described as extending to 100% strain in reference for wet fibres. 61 The Chapman–Hearle model would suggest a linear unfolding with strain, at least in the plateau region of the stress–strain curve. 64 The Wortmann–Zahn model proposes two different unfolding events in the plateau and strain hardening regions,9,64 both being continuous within their respective regions of the stress–strain curve.
In this study we have aimed to determine what actually happens on “in-use” timescales under carefully controlled conditions of temperature and humidity, relevant to consumer experience. A further difference between this work and the existing literature is that we have applied specific 2D analysis methods to the data. Although previously 2D-COS had been applied to Raman data of hair under stress, 23 the more recently developed PCMW2D had not. 41 This is especially useful in these studies as it shows clearly when changes occur relative to the perturbation applied, in this case the strain, and not only what has occurred. This has been used in other Raman studies but very few WAXS studies have used this method at all.34,39,42
Thus, when the data was analysed using PCMW2D a much more detailed picture emerged of the transitions during the tensile experiment in both Raman and WAXS. It was clearly observed that two localised α-helix to β-sheet transitions could be observed in these experiments whose positions can change depending on the local environment, i.e., both methods showing two distinct transitions. This is new information regarding the behaviour of hair under stress–strain and clearly shows that 2D analysis gives higher sensitivity than when just single peaks are analysed. It also shows the importance of measuring in situ under carefully controlled conditions; many previous studies would “fix” the fibre for later analysis for instance. So, in this study molecular changes are related very clearly to the cause, that is where within the stress-strain curve the transitions occur. Also using the 2D-COS analysis on the Raman data shows that the α-helix to β-sheet goes via a disordered state. This relationship to the stress gives new detailed insights into the underlying mechanisms of hair behaviour. Thus, these changes that are observed are discussed below in detail.
To summarize both the WAXS and Raman data, the first α-helix to β-sheet transition at 35% RH occurs at low strain around the Hookean region and the beginning of the yield region. This transition then moves to higher strain when the humidity is raised to 80% RH and is now completely in the yield region. The second transition is centred in the post yield region at both humidities although it still moves to higher strain at 80% RH. Also, at higher strain S–S bond breakage is observed, this is at similar strains for both humidities.
While the Raman/tensile and WAXS/tensile data show that the main transition moves to higher strain at higher humidity, the stress-strain curves (Figure 2) show that the yield stress of the fibre decreases at higher RH. The reduction in yield stress cannot therefore be attributed to changes in the intermediate filaments (IFs); if the IFs were dictating the stress–strain behaviour, then we should expect that a later IFs transition should be associated with a stiffer α-helix and therefore a stiffer fibre. These results therefore suggest that the main effect of humidity is on the matrix, reducing the modulus of the matrix, allowing the matrix to accommodate more of the strain, and therefore reducing the strain experienced by the IFs for a given fibre strain. Thus, these results indicate the importance of the matrix in determining changes in the location within the fibre stress–strain curve at which the transitions take place. The matrix contains the KAPs, so it is likely that understanding these will provide further insights on the matrix properties. The first steps to characterise the individual KAPs using a combination of molecular modelling and experimental measurements are described in a previous publication. 6
The presence of two localised α-helical to β-sheet transitions, one at low strain, the other in the post yield region, suggests consistency with the series zone model and Wortmann–Zahn model. 9 Breakage of S–S bonds at high strain (i.e. in the strain hardening region) would also be consistent with these models. However, our data shows that this process starts within the plateau region, which would suggest stress in the disulphide bonds at lower strain than that proposed by the series-zone model; this would however be consistent with the Chapman–Hearle model. 9 The combination of data for α-helix to β-sheet transitions and S–S bond breakage therefore do not provide clear consistent support for one or other of these existing literature models. This requires further investigation with one of the tests of a successful model being that it can explain the differences in RH sensitivity of the low and high strain transitions. This is discussed by Carpenter10 and will be further outlined in a future publication.
Conclusion
In this work we have used a unique experimental approach of measuring the tensile behaviour of hair under changing humidity conditions, using two different complementary methods to understand the molecular changes keratin undergoes. A new stress–strain cell with humidity control was built to allow Raman experiments to be conducted under the relevant controlled conditions. Similarly, the synchrotron radiation at ESRF Grenoble was used to investigate the α-helix to β-sheet transition in single hair fibres under strain and humidity control. State-of-the-art 2D analysis methods were also applied to both sets of data, which allowed the changes observed to be related more clearly to the applied strain. Both methods clearly showed that α-helix to β-sheet transitions within intermediate filaments are localised at specific strains rather than continuous across the stress–strain curve as previously thought. Generally, two main transitions are observed by both methods which are shifted at different humidity levels. These results indicate that the matrix of the hair structure is thus mainly affected by the change in humidity. They have been evaluated in light of the present models in the literature, neither of which fully explain these new observations. This is outlined in Carpenter10 and will be discussed in a future publication.
Supplemental Material
sj-pdf-1-asp-10.1177_00037028261457150 - Supplemental material for Structure Evolution in Hair Fibres During Strain and the Effect of Relative Humidity
Supplemental material, sj-pdf-1-asp-10.1177_00037028261457150 for Structure Evolution in Hair Fibres During Strain and the Effect of Relative Humidity by Paul D.A. Pudney, Adrian Voda, Kenneth S. Lee, David Tiemessen and Christopher Marsh in Applied Spectroscopy
Footnotes
Acknowledgments
Padryk Merkl, Tomas Vieira-de-Castro, Michael Sztucky
Declaration of Conflicting Interests
The author(s) declared no potential conflicts of interest with respect to the research, authorship, and/or publication of this article.
Funding
The author(s) received no financial support for the research, authorship, and/or publication of this article.

Supplemental Material
All supplemental material mentioned in the text is available in the online version of the journal.
References
Supplementary Material
Please find the following supplemental material available below.
For Open Access articles published under a Creative Commons License, all supplemental material carries the same license as the article it is associated with.
For non-Open Access articles published, all supplemental material carries a non-exclusive license, and permission requests for re-use of supplemental material or any part of supplemental material shall be sent directly to the copyright owner as specified in the copyright notice associated with the article.
