
Abstract
Molecular orientation is a key structural characteristic that allows optimizing the properties and performance of polymer films and fibers. Polarized Raman spectroscopy is among the most widely used techniques to quantify orientation thanks to its high level of chemical selectivity and high spatial resolution, which is especially needed when probing micro- and nanofibers. The cylindrical shape of nanofibers can nevertheless produce aberrations that prevent the accurate determination of molecular orientation when using conventional methodologies, as illustrated in the important case of polyacrylonitrile (PAN) nanofibers. Herein, we demonstrate that immersion of PAN nanofibers in a refractive index-matching medium can alleviate or eliminate these geometry-induced artifacts. While nanofibers measured in air can produce inaccurate or even physically impossible order parameters, results obtained under immersion show a strong agreement with calibrated data. This approach opens the door to accurate Raman orientation measurements in some of the most challenging samples, such as thin electrospun nanofibers.
This is a visual representation of the abstract.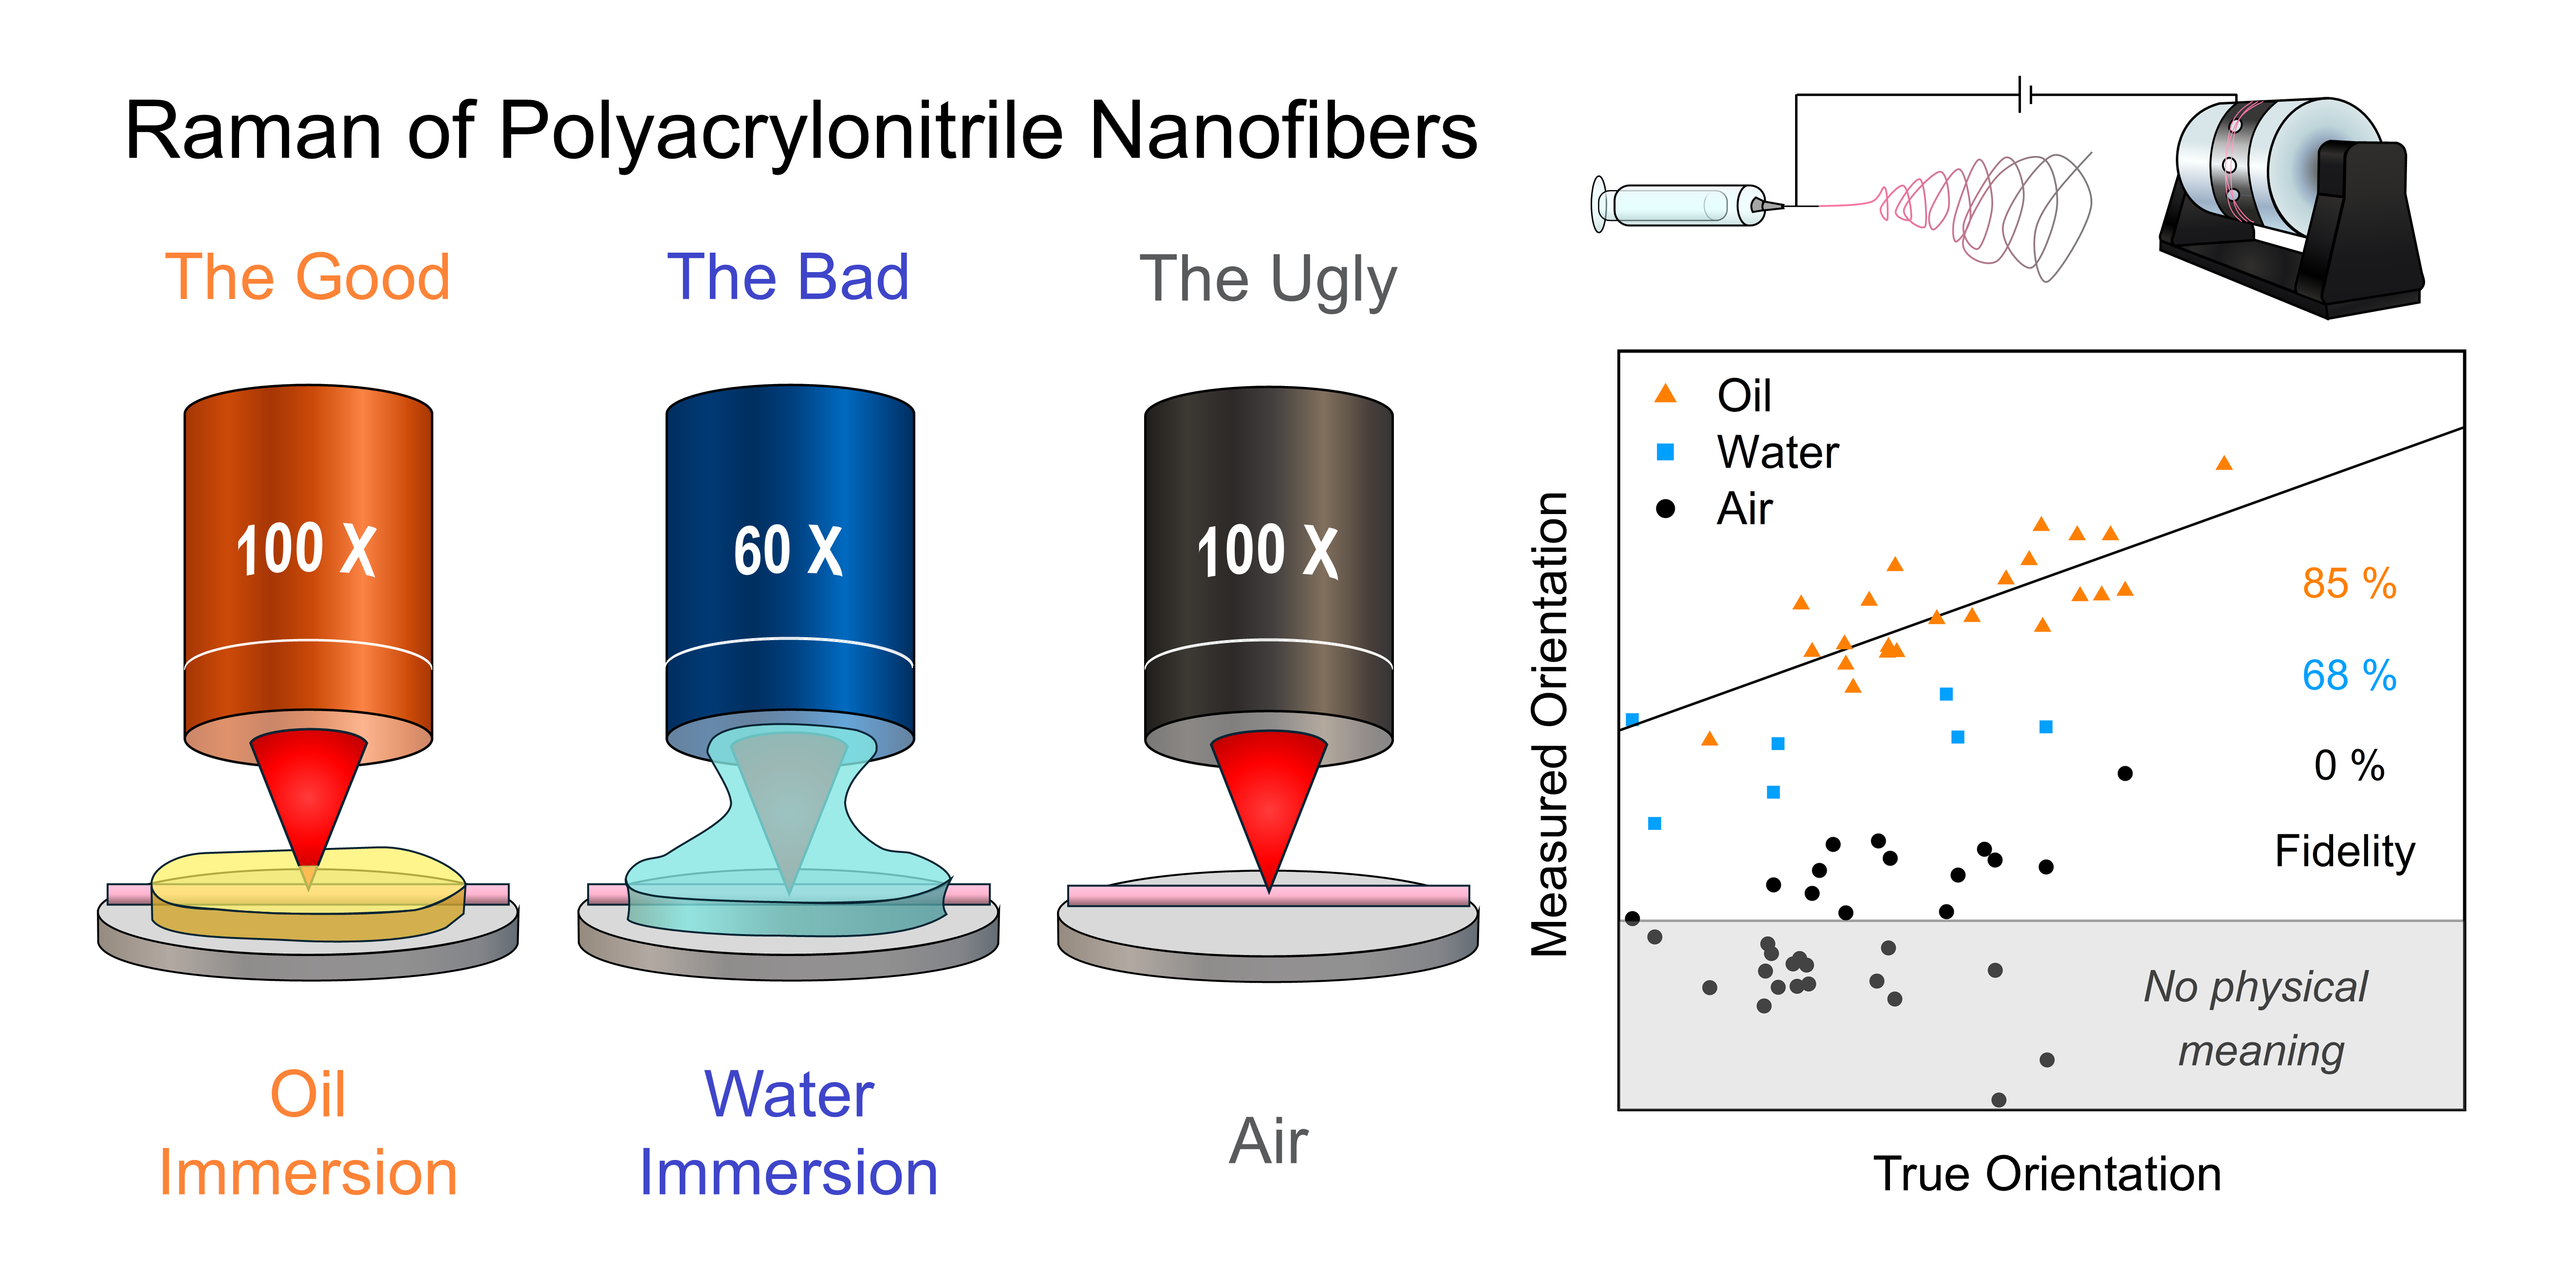
Introduction
In recent decades, materials scientists have reported striking enhancements in the mechanical,1–3 thermal,4,5 electrical,6,7 and optical 8 properties of electrospun fibers as their diameter decreases, with the most remarkable properties typically observed in fibers below 500 nm. As a result, electrospun nanofibers have become prime candidates for a range of applications, including filtration,9,10 coatings,11,12 flexible electronics, 13 sensing, 14 and tissue engineering.15,16
Understanding the structural basis of this trend is key to developing rational fabrication strategies and optimizing properties for scale-up. Polarized confocal Raman microscopy has emerged as a powerful technique for probing the structure of individual fibers of various compositions, owing to its high signal-to-noise ratio, sensitivity to both amorphous and crystalline phases, reasonably rapid analysis time, and non-invasive nature. 17 Notably, robust Raman methodologies have been developed to quantify molecular orientation (i.e., chain alignment) in single fibers using sets of four spectra collected under different light polarization conditions (hereafter referred to as “standard methodologies”).18,19 Raman has helped reveal a strong correlation between property enhancement and molecular orientation, which exhibit an analogous increase as fiber diameter decreases.20,21 This orientation improvement aligns with electrospinning dynamics, where thinner fibers experience stronger elongational forces and faster solvent evaporation—conditions that favor greater and more sustained chain alignment.22–24 More recently, we have applied polarized Raman microscopy to elucidate the process-structure relationships in individual fibers. Our results show that parameters such as polymer crystallinity 25 and glass transition temperature (Tg), 26 solvent volatility 26 and affinity with the polymer, 27 and type of fiber collector 28 influence the degree of molecular orientation across a wide range of fiber diameters, ultimately enabling the production of fibers with enhanced and more uniform performance.
Yet, the characterization of ultrathin fibers remains analytically challenging. While investigating molecular orientation in individual polyacrylonitrile (PAN) fibers using polarized Raman microscopy, Papkov et al. observed an unexpected inversion of the polarization contrast for fibers below 500 nm in diameter, suggesting a preferential chain orientation perpendicular to the fiber. 21 This contradicted results for larger PAN textile fibers and was inconsistent with the general understanding of the electrospinning process.20–24 The inversion was therefore attributed to artifacts stemming from both instrumental limitations and fiber geometry, which can skew molecular orientation analysis by polarized Raman microscopy21,29,30 and other techniques, such as infrared (IR) spectroscopy. 31 As detailed in a subsequent perspective, 17 instrumental issues can arise from the polarization-dependent response of the system and from motion of the fiber during the measurement or the switching of polarization. These problems are exacerbated for fibers with a diameter smaller than the diffraction limit of the laser, where slight shifts can displace the focus completely off the fiber surface. These instrumental effects can generally be mitigated with optimized optics and spectrum validation protocols to detect abnormal signal loss. 17 Spectral distortions intrinsic to the fiber geometry relate to differences in reflectivity and transmittivity when the fiber is probed under different polarizations. These distortions are more pronounced for thinner fiber due to the combined effect of enhanced birefringence (caused by higher molecular orientation) and greater fiber curvature. The latter causes most incident light to strike the fiber at oblique angles, where reflectivity varies for light polarized parallel and perpendicular to the fiber axis, the most extreme case being at the Brewster angle. Collectively, these effects cause one polarization intensity to appear artificially stronger than the other, easily overshadowing spectral variations from molecular orientation and thus compromising accurate quantification in ultrathin fibers using standard methodologies. 17
To circumvent these artifacts, Papkov et al. applied a semi-quantitative method that requires a single polarized spectrum by calculating the intensity ratio of two bands with distinct polarization directions. 21 The band ratio does not quantify the order parameter directly, but it is proportional to molecular orientation. While effective for PAN, this approach is not directly applicable to polymers whose vibrational modes are less well characterized 26 or for which the intense modes are all aligned in the same direction. 25 A more quantitative strategy is to build a calibration curve that relates a band intensity ratio (measured under a single polarization) to the quantitative order parameters determined on oriented macroscopic samples using standard methodologies.20,28,30 While effective in some cases, challenges include the capability to prepare bulk calibration standards covering a wide range of order parameters, 25 the presence of bands whose intensity ratio correlates well with orientation, 26 and absence of confounding spectral overlap in multicomponent systems. 27 This underscores the need of experimental strategies for the reliable investigation of molecular orientation in fibers with diameters close to or below 500 nm.
Since the artifacts appear to be due to the refractive index (n) mismatch at the interface between the cylindrical sample (n often ∼1.5 for organic materials) and the surrounding medium (typically air with n = 1), reducing this index mismatch should attenuate reflection at the fiber interface and enable signal collection that better reflect molecular orientation. In fact, performing measurements in an index-matching immersion medium is a common practice in optical microscopy and its use in Raman microscopy has been strongly recommended by Everall,32,33 and Everall et al., 34 although often overlooked, to minimize aberrations and to enable accurate depth profiling and subsurface imaging. To our knowledge, such an index-matching strategy has not yet been explored to mitigate polarization-related artifacts in molecular orientation measurements.
This work aims to expand the application range of standard Raman orientation quantification methodologies to small nanofibers by eliminating geometry-induced artifacts. More specifically, we investigate the molecular orientation in PAN electrospun fibers of a wide range of diameters in three “immersion” media, i.e., air, deionized water, and silicone oil. While standard methodologies in air replicate the large distortions previously reported, immersion in deionized water attenuates these artifacts, and oil “immersion” provides order parameters that closely match those obtained from a single-polarization calibration method. Thus, oil immersion allows the reliable application of standard methodologies for investigating challenging electrospun systems composed of specialty polymers or blends.
Experimental
Electrospinning
Polyacrylonitrile (PAN) powder with a weight-average molecular weight of 150 kg/mol (Scientific Polymer Products, Cat. no. 134) and a refractive index of 1.5187 at 25 °C was dissolved in N,N-dimethylformamide (DMF) (≥ 99.9%, Fisher Chemical, Cat. no. D119-4) by stirring for 15 min. at 80 °C, then for ∼24 h at room temperature (RT), to afford solutions with concentrations ranging from 10 to 13% (m/V). The solution was transferred to a 5 mL glass syringe (Cadence Science Micro-Mate, model 5014) fitted with a 0.41 mm diameter flat-end needle (Hamilton, model 91022) and mounted on an automated pump (Harvard Apparatus, model PHD 2000 Infusion) set at a constant flow rate of 0.05 mL/min. Electrospinning was performed by applying a 15 kV positive voltage to the needle using a CZE 1000R high-voltage power supply (Spellman High Voltage Electronics) and a 2 kV negative voltage to a gap collector using a Power Designs source. The gap collector, composed of two metal rods spaced 25 mm apart, was placed 15 cm from the needle tip. All electrospinning was conducted in a fume hood under a relative humidity below 35% and temperatures between 20 and 22 °C. The deposited fibers were transferred onto glass microscope slides and dried under vacuum at RT for at least 24 h prior to characterization.
Oriented Films
PAN films were cast from an 8% (m/V) solution, prepared following the same protocol as for electrospinning, and poured into a leveled glass petri dish. The samples were left to dry with a glass cover in a fume hood at RT for 2 weeks, until no visible solvent remained, then placed under vacuum at RT for 4 days until reaching a stable mass. The dried film formed at the bottom of the petri dish was retrieved and cut into 1 cm × 2.5 cm rectangular pieces. To induce various levels of molecular orientation, the pieces were stretched to different draw ratios using a heat gun heating at temperatures up to the Tg of PAN (∼125 °C).
Raman Microscopy
Raman spectra were acquired in backscattering geometry using the 632.8 nm He−Ne laser of a LabRam HR800 spectrometer (Horiba Scientific) coupled with an Olympus BX41 microscope. For orientation quantification using standard methodologies, the polarization of the incident and Raman scattered light was set parallel (Z) or perpendicular (X) to the main axis (z) of the sample using a half-wave plate and an analyzer, respectively. A 600 grooves/mm holographic grating was used along with a scrambler to reduce the polarization dependence of its diffraction efficiency. Correction factors close to unity were applied to compensate for the residual polarization sensitivity of the setup. Sets of parallel- and cross-polarized spectra were collected in the order ZZ, ZX, XX, XZ, and ZZ(2), the latter recorded to detect possible loss of focus during acquisition. Sample presentation, integration time, number of accumulations, and other optical parameters were adjusted as detailed in the following sections, depending on the sample type. Theorientation parameter ⟨P2⟩ was calculated from the 2244 cm–1 nitrile stretching 35 using the most probable distribution (MPD) method, described in detail in previous works. 19 The ⟨P2⟩ values were subsequently corrected for a tilt angle of 70° between the main component of the Raman tensor of the nitrile mode and the polymer backbone.35,36 The ⟨P2⟩ value is 1 for perfect chain orientation along the z-axis, 0 for a completely isotropic distribution, and –0.5 for perfect chain orientation perpendicular to the z-axis. 30
Electrospun Fibers
A small quantity of fiber was cut from the microscope slide surface using a scalpel, transferred with fine tweezers, and immobilized with adhesive tape on a BaF2 window. The confocal hole and slit of the Raman instrument were set to 100 and 150 μm, respectively. Well-isolated individual fibers with their main axis along the Z direction were all first characterized in air using an Olympus 100× long working distance objective (numerical aperture of 0.8). They were subsequently covered with either a droplet of deionized water (n = 1.33) or a thin layer of silicone oil (n = 1.403, Sigma-Aldrich, Cat. no. 146153). Water immersion measurements were then achieved using an Olympus 60× water-immersion (WI) objective (numerical aperture of 1.0), while oil “immersion” measurements were conducted with the dry 100× objective. Polarized spectra were collected with an integration time between 8 and 25 s and 4 to 15 accumulations, both adjusted to optimize signal quality for each fiber. Sets of spectra were rejected if the intensity of the 2244 cm–1 band varied by more than 5% between the ZZ and ZZ(2) spectra.
The diameter of each fiber was measured in air, prior to immersion, by acquiring a linear map of 10 to 15 ZZ spectra at evenly spaced positions perpendicular to its axis, with an integration time between 6 and 15 s and 4 to 10 accumulations. The spectral intensity was then plotted as a function of position and fitted to a Gaussian function using Origin software. The diameter was taken as double the computed standard deviation (σ) of the fit. The diameter obtained using this method is reliable for larger fibers but is overestimated for fibers with diameters below the diffraction limit of the laser (∼500 nm with the current setup). Additionally, optical effects from fiber curvature may influence the reported diameter values due to the use of a metallurgical objective. 37 These effects are expected to be consistent across all data sets and should not impact the observed trends.
Oriented Films
The oriented PAN films were analyzed in air with the 100× dry objective, using the standard MPD methodology for orientation quantification. The confocal hole and slit were set to 300 and 350 μm, respectively. The integration time was set between 3 to 6 s with 8 to 12 accumulations per spectrum. Sets of spectra were rejected if the intensity of the 2244 cm–1 band differed by more than 1% between the ZZ and ZZ(2) spectra.
The resulting film ⟨P2⟩ values were then plotted against the 2244 cm–1/1458 cm–1 band intensity ratio from their ZZ spectrum to yield a linear calibration curve (R2 = 0.97, see Figure 2). This calibration curve was then used for the single-spectrum estimation of molecular orientation in electrospun PAN fibers. These calibrated ⟨P2⟩ values served as a baseline to evaluate the effectiveness of water and oil immersion in reducing geometry-induced artifacts associated with the standard methodologies. The calibration dataset completely covers the range of ⟨P2⟩ that will be found for fibers, but the accuracy of the calibrated ⟨P2⟩ values relies on the absence of geometry-dependent effects such as a partially non-uniaxial orientation in the stretched films.
Results and Discussion
Polyacrylonitrile (PAN) is a semicrystalline polymer of considerable practical importance, valued for its high mechanical strength, chemical resistance, and thermal stability and its role as a precursor to carbon fibers.38,39 Electrospun PAN fibers provide an excellent model system for evaluating the effectiveness of higher-refractive-index immersion media in mitigating artifacts related to fiber geometry in polarized confocal Raman microscopy. PAN fibers are typically electrospun from dimethylformamide (DMF) or dimethyl sulfoxide (DMSO), 39 low-volatility, highly polar solvents that promote the formation of ultrafine fibers,22,40,41 associated with exacerbated geometric artifacts. Both their Raman spectra and the associated artifacts are well documented.17,35,42
Figure 1 presents the Raman spectra polarized parallel (ZZ) and perpendicular (XX) to the sample main axis for three PAN fibers of comparable diameters (∼800 nm) interrogated in air, deionized water, and silicone oil, as well as for a stretched PAN film in air. The 2244 cm–1 band, assigned to the nitrile stretching mode, 35 was used as the molecular orientation marker because it provides a high signal-to-noise ratio under all conditions and is well isolated from other PAN and immersion media bands (see Figure S1 in Supplemental Material for a comparison of the Raman spectra of PAN, deionized water, and silicone oil). The main component of its Raman tensor is estimated to form a tilt angle of ∼70° with respect to the chain axis.35,36 Its intensity should therefore be higher under the XX polarization and lower under the ZZ polarization when PAN chain orientation increases. This expected behavior is observed for the representative film of Figure 1, associated with an order parameter ⟨P2⟩ of 0.25, which does not show geometric artifacts typical of fibers thanks to its flat geometry. In sharp contrast, the fiber measured in air (n = 1.00) displays a marked inversion of the nitrile band intensities, with a stronger intensity in the ZZ spectrum than in the XX spectrum. This inversion is consistent with that identified in previous polarized Raman studies on single PAN fibers and incorrectly suggests a strong polymer chain alignment perpendicular to the fiber axis.17,21 Further evidence of artifacts is provided by the stronger XX intensity of the 1458 cm–1 band, associated with –CH2– bending, 43 which is largely insensitive to molecular orientation, as indicated by its equivalent intensities under XX and ZZ polarizations in the oriented film spectra. Interestingly, a similar loss of intensity equivalence for an orientation-insensitive band was also observed in our previous study on poly(ethylene terephthalate) (PET) fibers, when their diameter was reduced below 500 nm. 30
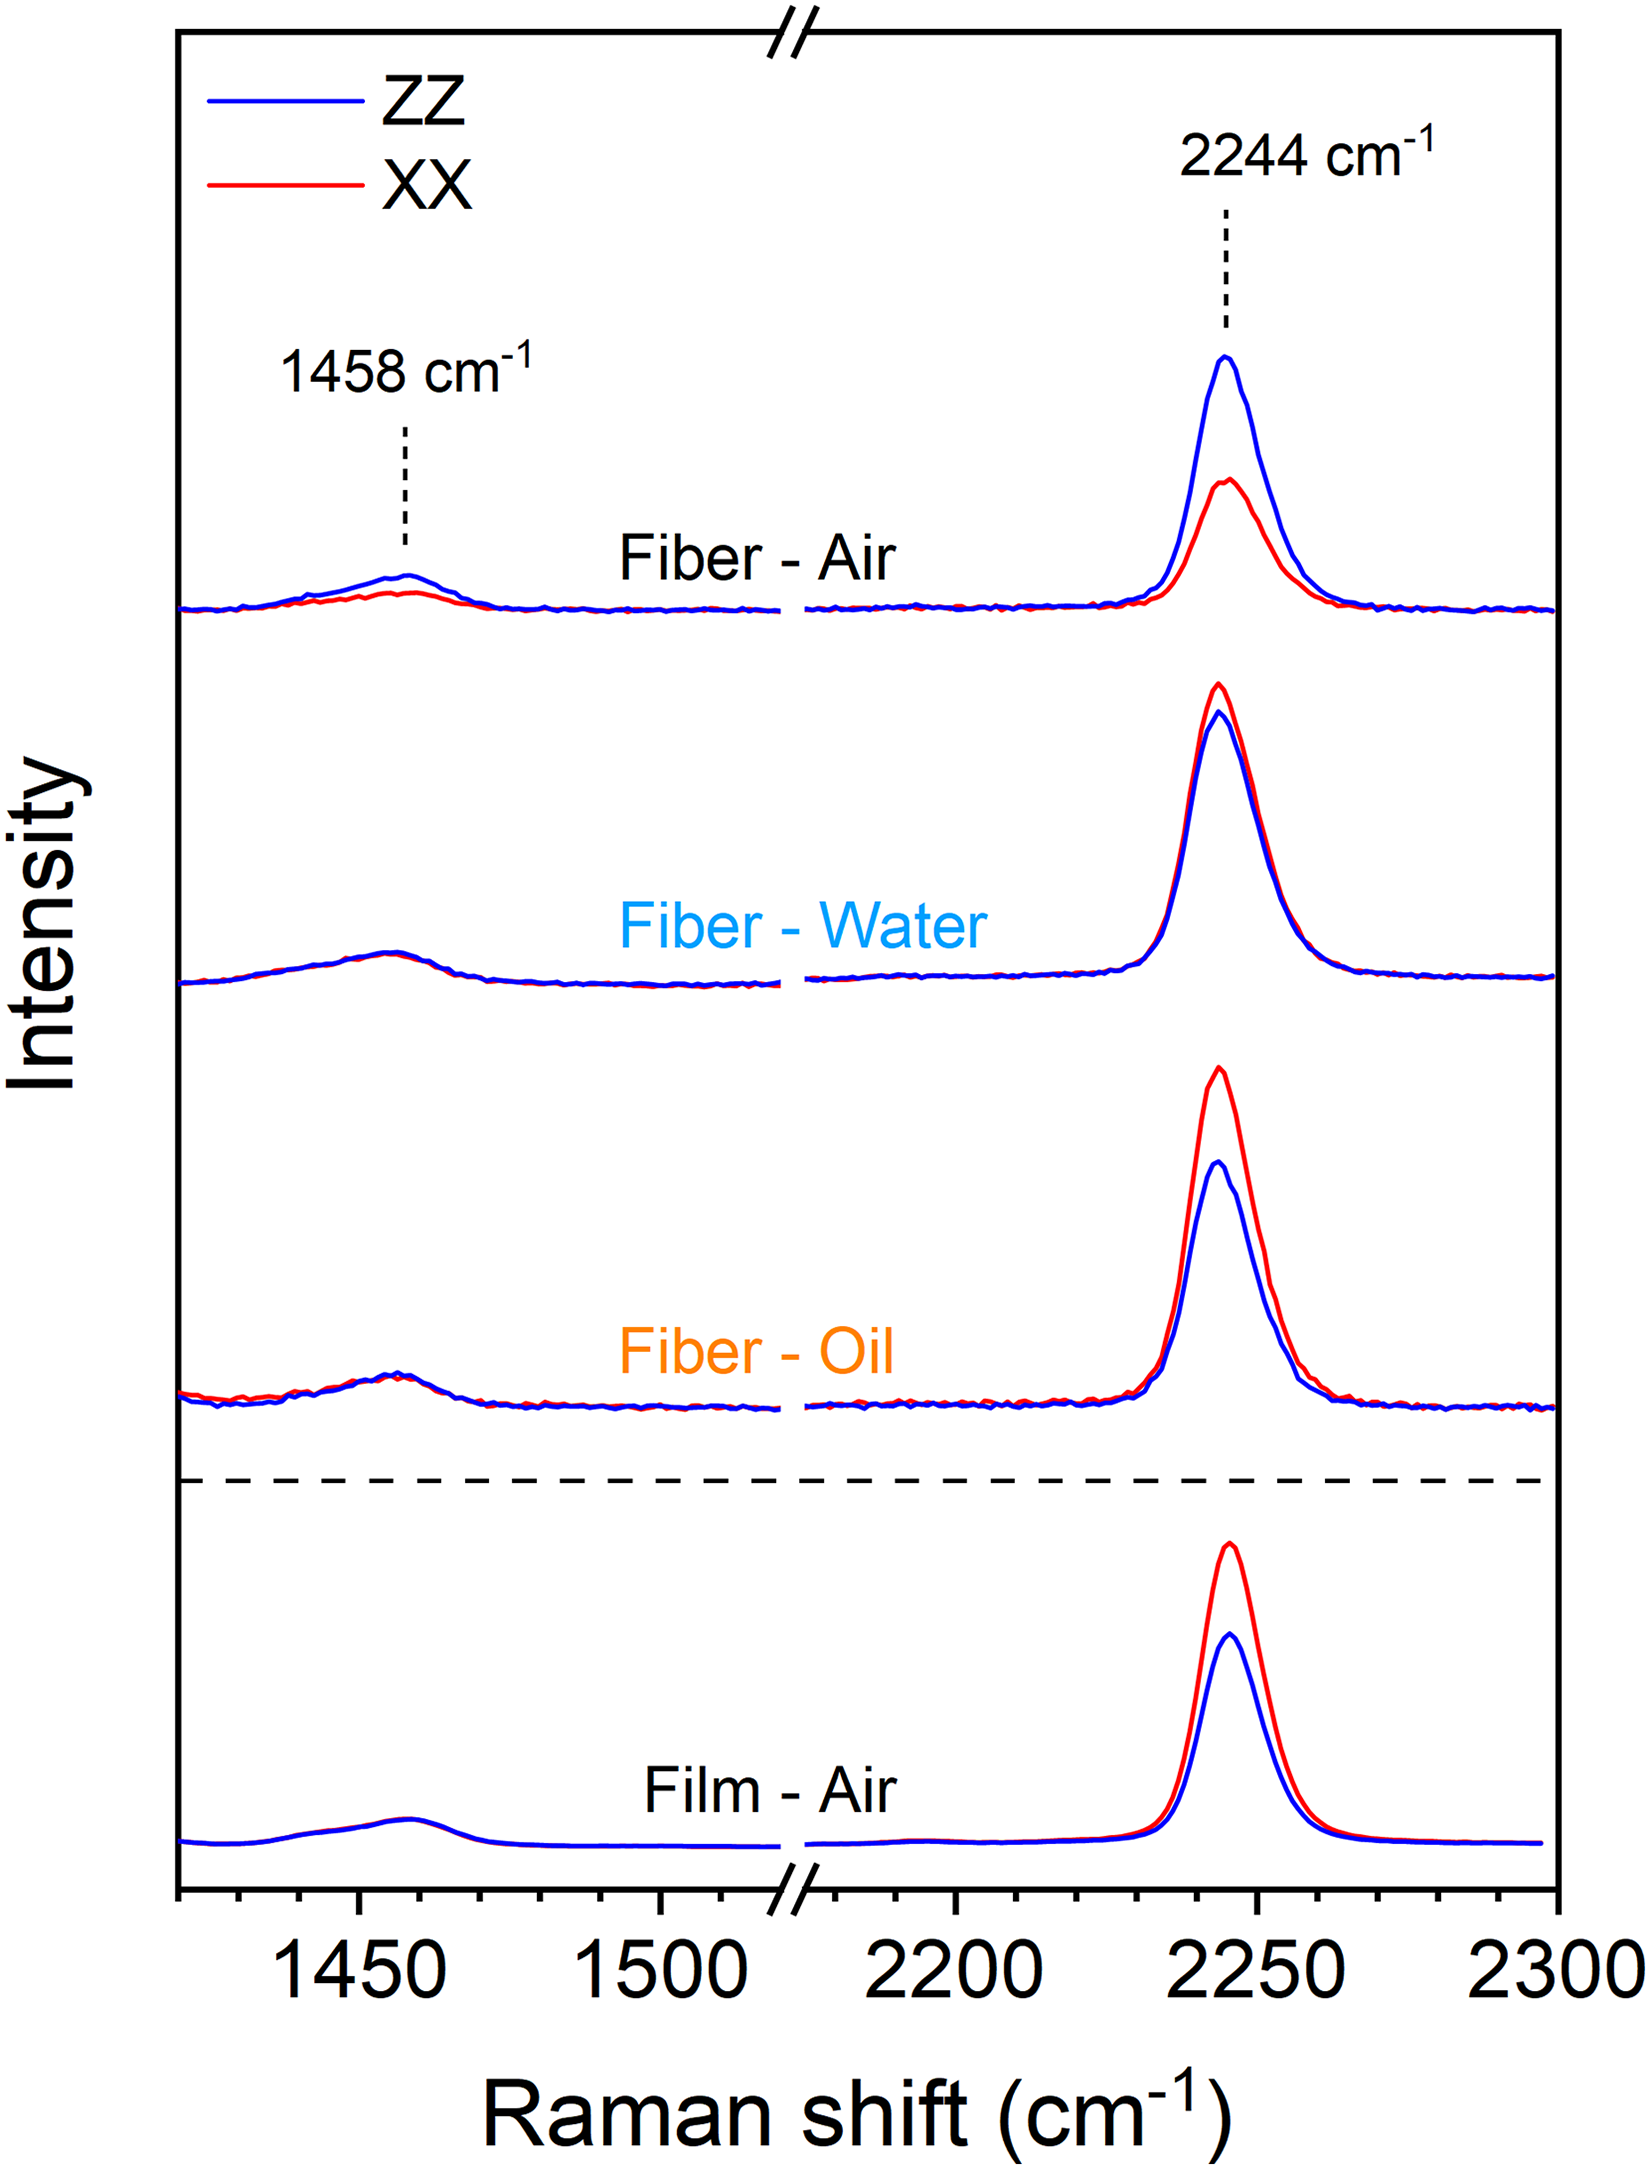
Polarized Raman bands of PAN used for orientation quantification, measured on three representative individual fibers in air (“Air”), deionized water (“Water”), silicone oil (“Oil”), and on an oriented film in air. All samples exhibit a 〈P2〉 of ∼0.25, determined using either the standard methodology (film) or a calibration curve (fibers; vide infra). For easier comparison, the spectral intensities are normalized to the 1458 cm–1 band under ZZ polarization.
Under deionized water (n = 1.33) immersion, the 2244 cm–1 band shows comparable XX and ZZ intensities. While this suggests a rather isotropic chain distribution, which is more plausible than the result in air, it remains very unlikely as PAN fibers electrospun under similar conditions typically display molecular anisotropy and enhanced mechanical properties along the fiber axis, even at ∼800 nm diameter.1,21 This spectral behavior is instead attributed to a partial mitigation of the geometry-induced artifacts by reducing the refractive index mismatch at the fiber/medium interface. A possible confounding factor is the change in numerical aperture from 0.8 to 1.0 when switching from the 100× to the 60× objective. A few control experiments were therefore conducted with the 60× objective under dry conditions, which led to the return of the incorrect relative intensities between the ZZ and XX spectra. The quality of focus was also affected, and the spectral intensity was reduced to only ∼15% of that obtained with the 100× objective. We attribute these problems to severe spherical aberrations due to the incorrect use (in air) of a water immersion objective with numerical aperture (NA) = 1.0. Finally, Figure 1 shows that when the 100× objective is used to measure the spectra of fibers covered by a layer of silicone oil (n = 1.403), the polarized intensities of the nitrile band recover a ratio similar to that of the oriented film, confirming the preferential molecular orientation along the fiber axis and, importantly, a strong suppression of geometric artifacts.
To establish the quantitative effectiveness of high refractive index media to mitigate the artifacts during the polarized interrogation of fibers, we must compare the apparent ⟨P2⟩ values and the true ⟨P2⟩ values obtained using an artifact-free method. We previously demonstrated that a calibration curve relating ⟨P2⟩ values to a band intensity ratio under a single polarization provides a reliable means of determining the orientation for fibers with sub-micrometer diameters measured in air.20,28,30
Figure 2 presents the calibration curve developed for this study relating ⟨P2⟩ values of stretched PAN films, calculated from sets of four polarized spectra using the standard methodologies, to the 2244 cm-1/1458 cm–1 band intensity ratio under ZZ polarization, where the 1458 cm–1 band serves as an internal reference. The linear regression of the calibration data demonstrates a strong correlation (R2 of 0.97) between the intensity ratio and molecular orientation. This curve was used to determine the artifact-free ⟨P2⟩ values of all PAN fibers investigated, solely from their ZZ spectrum acquired during an initial air measurement prior to immersion. Notably, it confirmed that the ⟨P2⟩ values of the three fibers whose polarized spectra are shown in Figure 1 are approximately 0.25, comparable to the film value, indicating that the variations in their polarized spectra arise from geometry-induced artifacts. We emphasize that, as not all polymers feature an appropriate orientation-insensitive band, the development of experimental strategies that enable the reliable quantification of molecular orientation in ultrafine fibers using standard methodologies is necessary.
Figure 3 compares ⟨P2⟩ values obtained using the standard methodologies (⟨P2⟩SM) with ⟨P2⟩ values derived from the calibration curve (⟨P2⟩calib) for each fiber investigated in air, deionized water, or silicone oil. The black slope represents the “ideal” scenario where ⟨P2⟩SM consistently matches ⟨P2⟩calib. Fidelity scores, indicated in the figure, assess how closely each dataset meets this scenario (details on the calculation of the score are available in the Supplemental Material). Fibers measured in air consistently display negative ⟨P2⟩SM values that diverge significantly from their ⟨P2⟩calib values, which range from 0.01 to 0.48. Even worse, about 50% of ⟨P2⟩SM values, in the shaded gray region, fall below the lowest physically meaningful ⟨P2⟩ value of –0.5. This dataset yielded a fidelity score of 0%, indicating no overlap between ⟨P2⟩SM and ⟨P2⟩calib. These results are consistent with the dominance of geometry-related artifacts in the sets of polarized spectra used to quantify ⟨P2⟩SM for fibers measured in air. Under water immersion, fibers still show discrepancies between their ⟨P2⟩SM, which range from –0.25 to 0.10, and their ⟨P2⟩calib, which range from 0.01 to 0.40. Nonetheless, the average difference between the two values is much smaller than for fibers measured in air, and the fidelity score increases to 68%, reflecting a substantial reduction of the artifacts. However, fewer fibers were successfully analyzed in water than in air due to sporadic movement during acquisition, leading to loss of focus and inconsistent intensities. This results in a selection bias in favor of larger fibers of lower orientation, leading to an overestimated fidelity score. Finally, fibers interrogated in silicone oil show a close agreement between their ⟨P2⟩SM and ⟨P2⟩calib, with overlapping ranges from –0.04 to 0.70 for ⟨P2⟩SM and 0.09 to 0.57 for ⟨P2⟩calib, and a commendable fidelity score of 85%. Interestingly, the high viscosity of the silicone oil minimized fiber movement compared to the water immersion measurements, such that the selection bias for larger fibers does not play a large role.
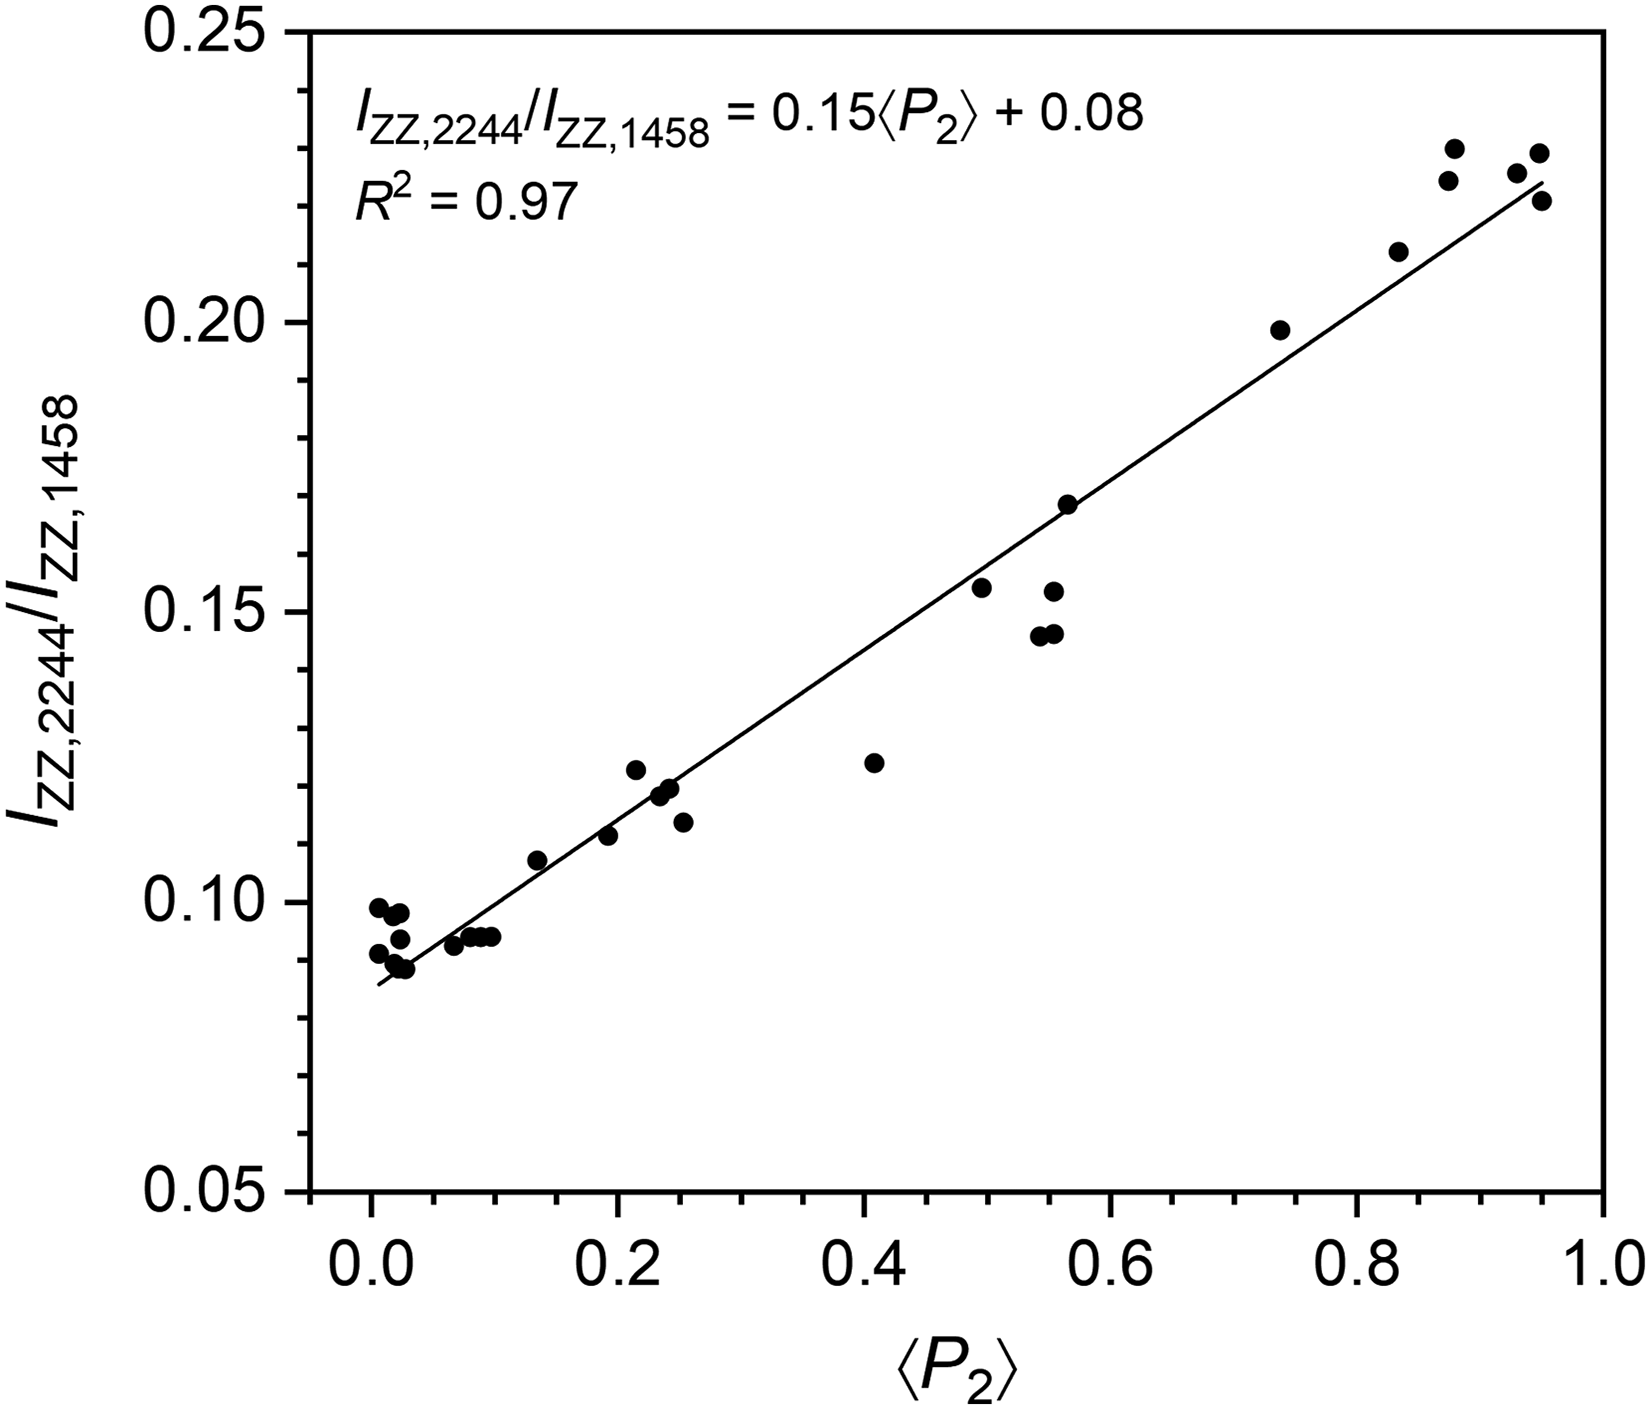
Calibration curve for evaluating the artifact-free 〈P2〉 of PAN fibers by correlating the 2244 cm-1/1458 cm-1 intensity ratio in ZZ spectra with the 〈P2〉 parameter. The curve was established with 31 PAN films stretched to various draw ratios and analyzed using the standard MPD methodology.
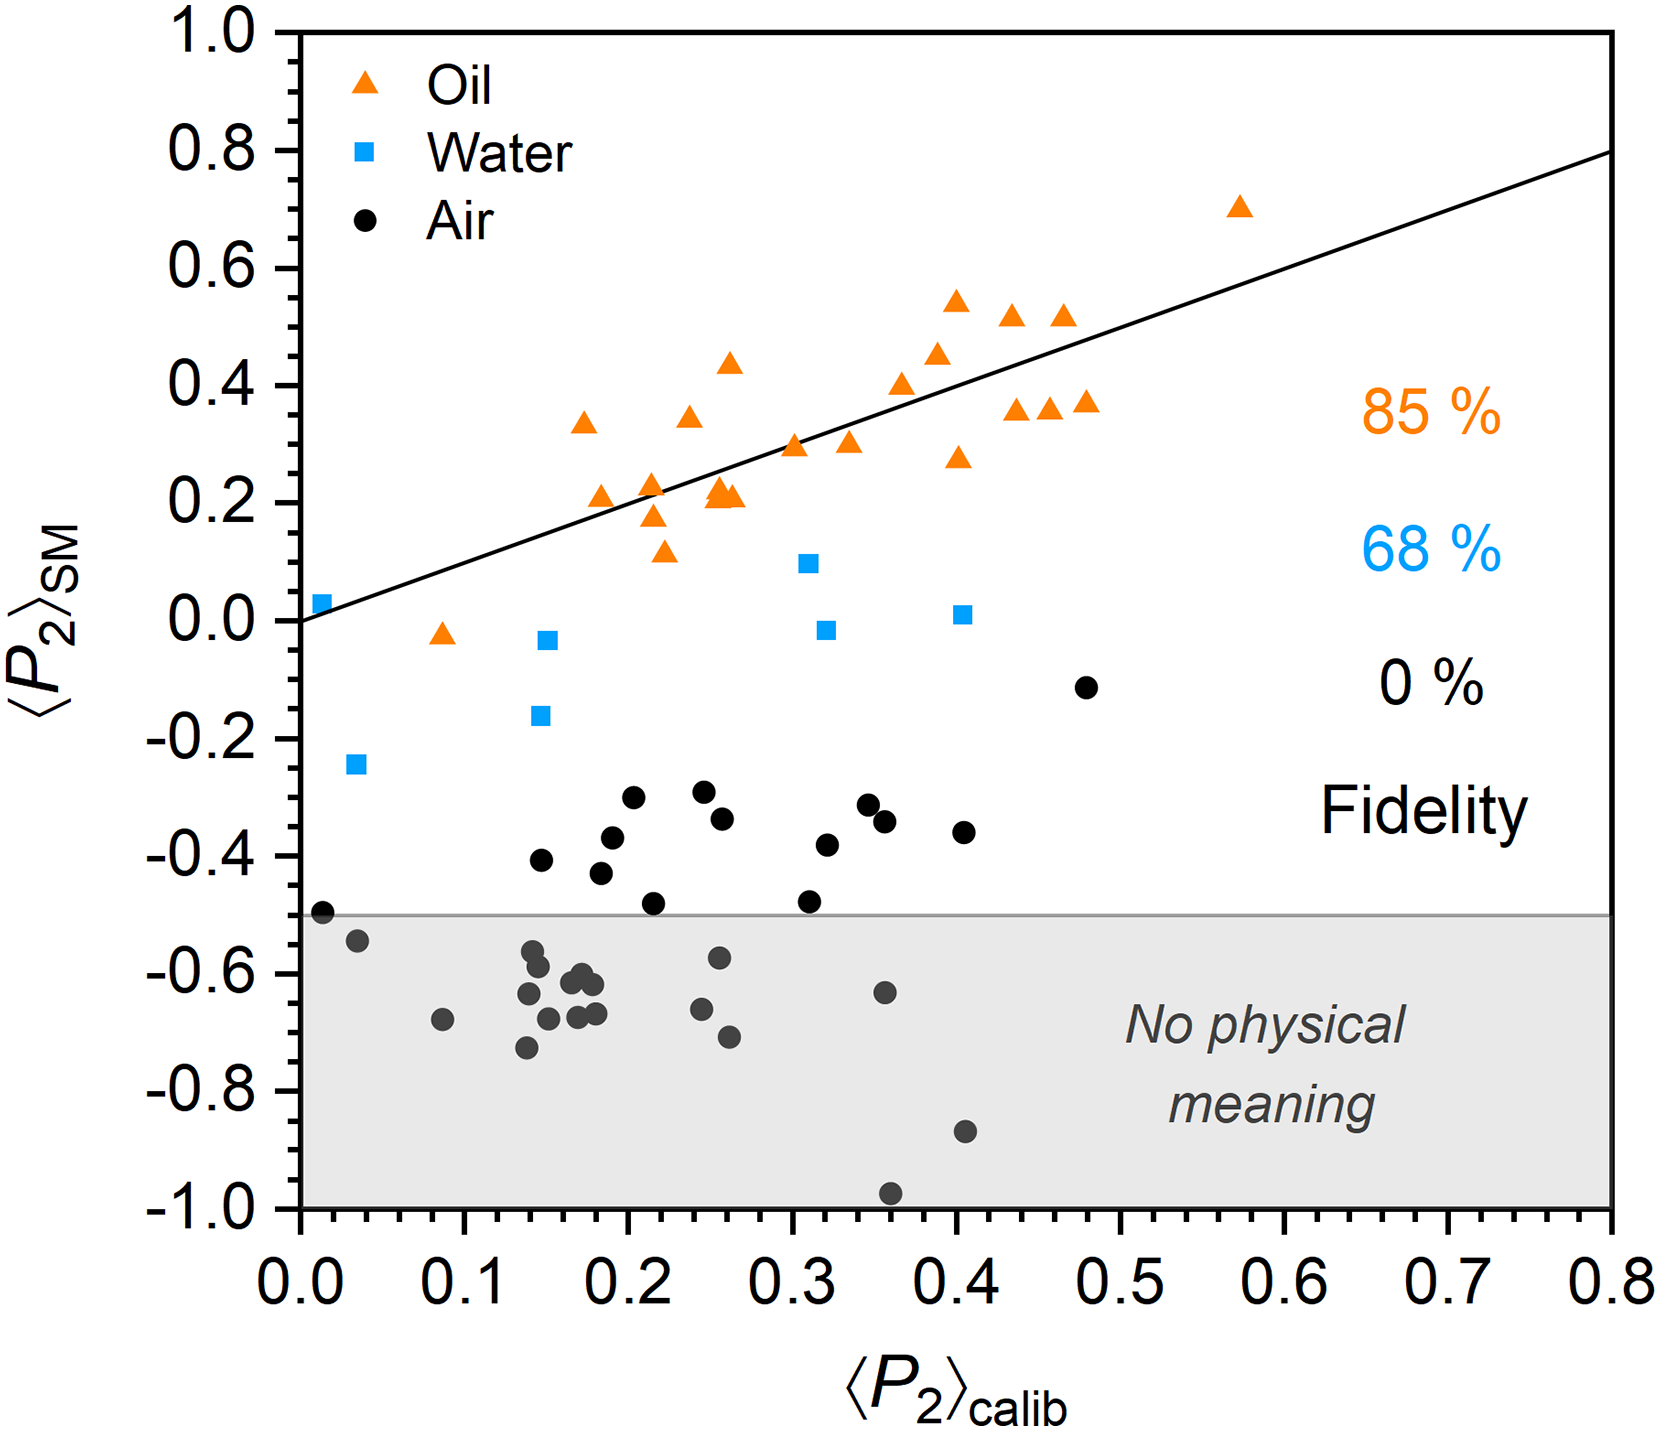
Comparison between 〈P2〉 values obtained using the standard methodologies (⟨P2⟩SM) and ⟨P2⟩ values derived from the calibration curve (⟨P2⟩calib) for fibers interrogated in air, deionized water, and silicone oil. For each fiber, ⟨P2⟩calib was determined from the ZZ spectra measured in air. The black slope represents the expected trend for perfect agreement between ⟨P2⟩SM and ⟨P2⟩calib. The percentages indicated on the figure reflect the fidelity of the datasets (color-matched) to this trend. The shaded grey region encloses data points associated with ⟨P2⟩SM values below –0.5, which are physically impossible.
Figure 4 presents the dependence of 〈P2〉SM values of fibers measured in oil and 〈P2〉calib values on fiber diameter, a key trend for the optimization of electrospun materials.20,21,25 To highlight the main conclusions, data are represented as median values, with marks indicating orientation dispersion from the 25th to 75th percentiles. Both datasets exhibit a typical increase in molecular orientation with decreasing diameter, with median 〈P2〉SM and 〈P2〉calib values reaching 0.37 and 0.40, respectively, for diameters below 600 nm. An onset diameter of orientation increase appears in both cases around 800 nm, consistent with previous studies on PAN fibers. 21 Interestingly, a substantial molecular orientation is retained in fibers with a diameter above this onset, with median 〈P2〉SM and 〈P2〉calib values of 0.21 and 0.19, respectively. This behavior can be attributed to the crystalline phase of PAN whose orientation relaxation is restricted, as previously observed for fibers of highly crystalline polymers. 25 We note that some fibers in the window below 600 nm may have diameters under 400 nm. Indeed, scanning electron microscopy (Figure S2 of the Supplemental Material) shows that electrospinning at the lowest concentration of 10% m/V mostly leads to fibers with diameters between 400 and 600 nm, but also to some outliers of lower or higher diameter. Our spectral method for diameter determination (see the Experimental section) is limited by the laser diffraction limit and would therefore overestimate the diameter of these ultrafine fibers.
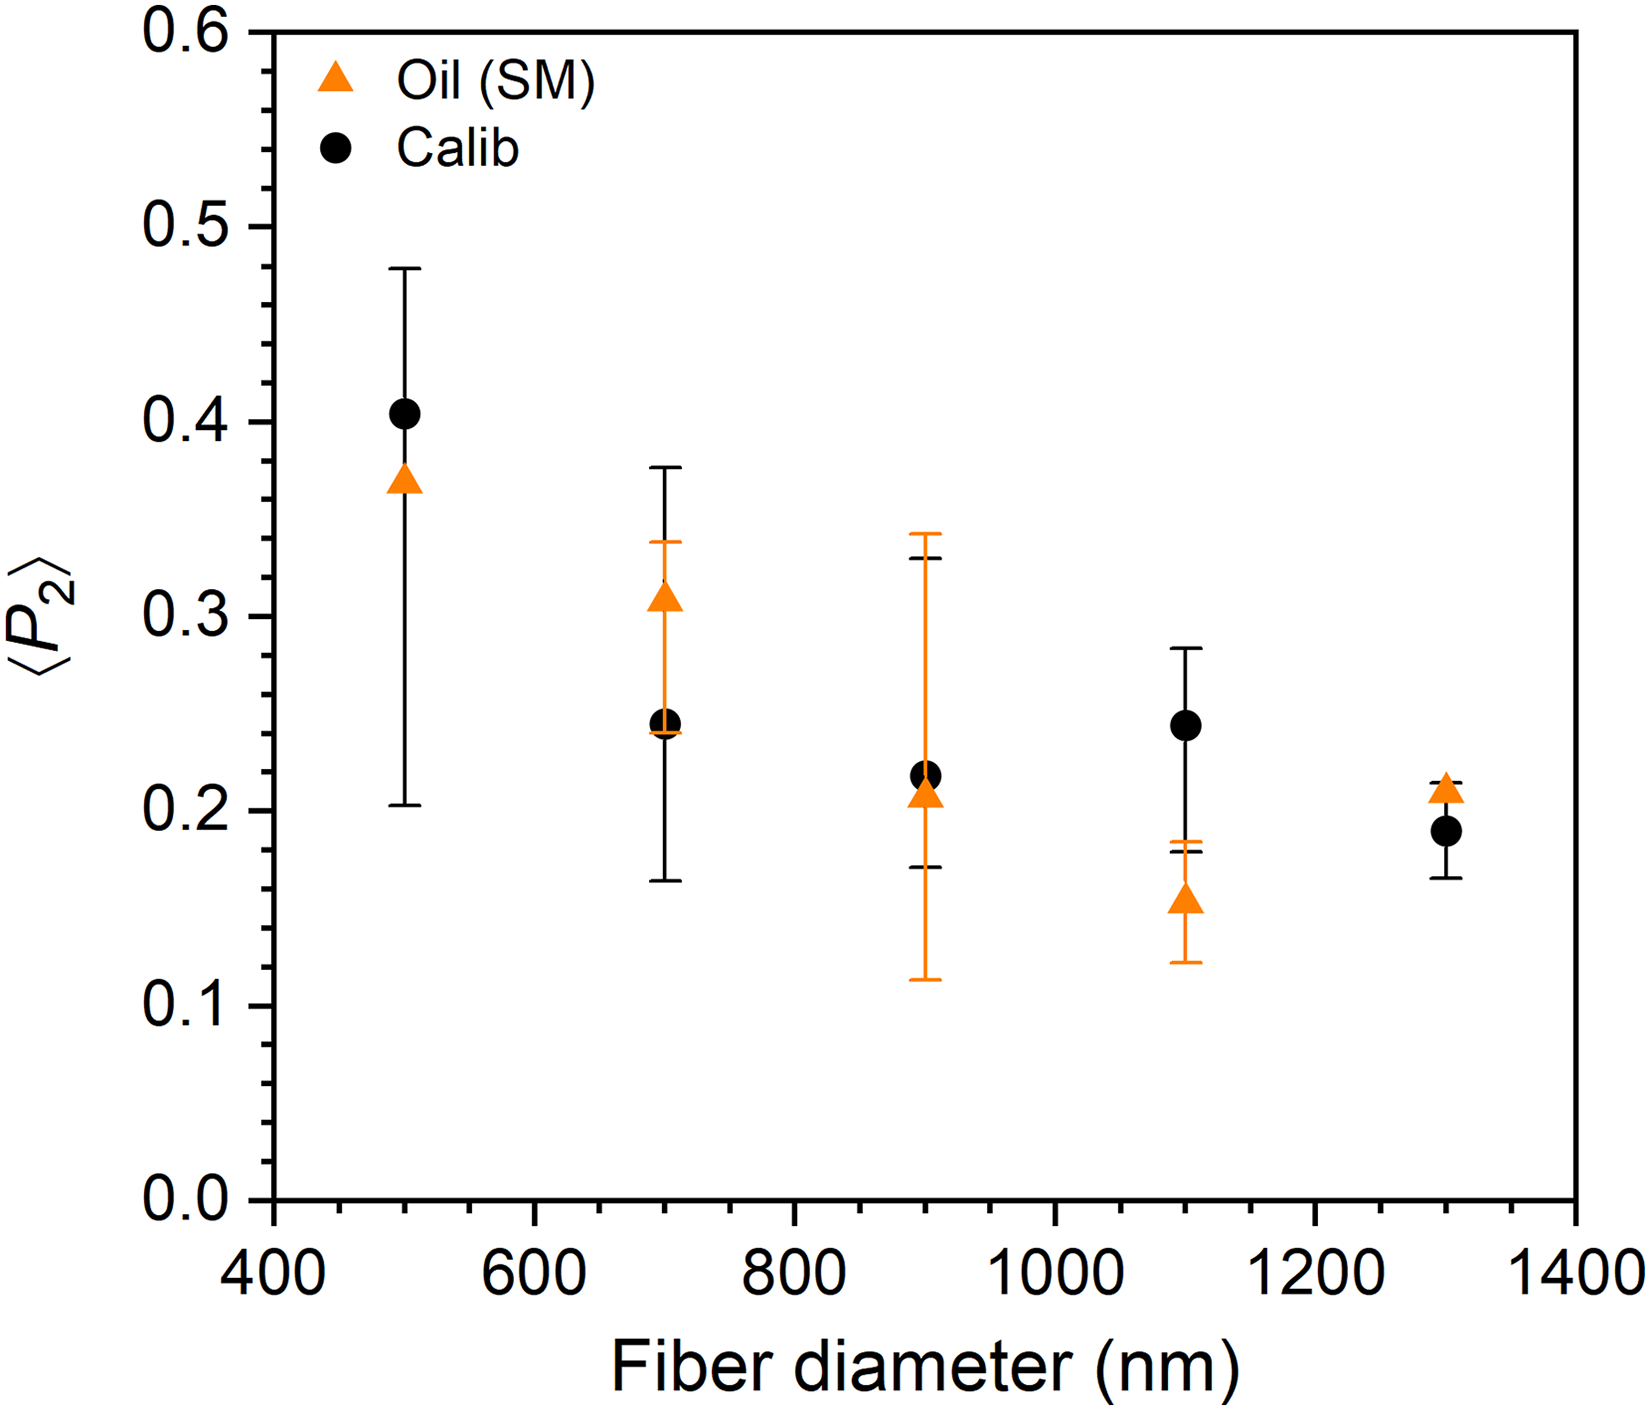
Diameter dependence of molecular orientation derived from 〈P2〉SM of fibers measured in oil “Oil (SM)” and 〈P2〉calib “Calib”. The symbols represent the median of data points within 200 nm diameter windows, and the vertical marks delimit the orientation dispersion from the 25th to 75th percentiles for each window. The first data point includes fibers thinner than the laser spot for which the reported diameter may be overestimated.
The modest differences in median 〈P2〉 observed in Figure 4, along with the 85% fidelity score for the 〈P2〉SM of fibers measured in oil (Figure 3), indicate that immersion in oil avoids most geometry-induced artifacts. Indeed, the inherent errors in Raman measurements due to drifting, slight loss of focus, and uncertainties related to spectral baselines and band intensities, typically introduce an inaccuracy of ± 0.05 in the 〈P2〉 values for both the standard methodologies and calibration curve (error bars are omitted in Figure 4 for clarity). This uncertainty is contained by optimizing the measurement time to strike a balance between increasing the signal-to-noise ratio and lowering the risk of signal loss. Further improvement can be achieved on the instrumental side by using a high-performance anti-vibration table, an automated polarization-switching device, and minimizing air flow near the fibers. When appropriate measures are taken, immersion in an index-matching medium stands out as an effective strategy to mitigate or eliminate the polarization-dependent reflection artifacts due to the size and curvature of fibers with diameters close to the laser diffraction limit.
Notes for Practical Applications
Several characteristics must be considered in selecting the immersion liquid. As a starting point, the refractive index of the liquid and polymer should match as closely as possible to minimize reflection at their interface. As noted above, sufficiently high viscosity appears to reduce fiber motion during measurements. Importantly, there should also be minimal spectral interference between the polymer and the immersion medium, at least in the region of the band of interest for orientation quantification. While this is conveniently achieved with PAN thanks to the intense and isolated nitrile stretching band, this is not necessarily the case for other polymers. Spectral overlap would lead to underestimation of the orientation due to the isotropic nature of the immersion liquid. Thankfully, available options include silicone oils (as used in this study), aromatic oils, halogenated oils, and glycerol, which all exhibit distinctive Raman responses and cover refractive indexes from approximately 1.3 to 1.7. Some variants are also available in “low autofluorescence” formulations, further reducing undesirable spectral contributions. Recording a Raman spectrum of the pure candidate immersion media is strongly recommended to confirm the absence of contributions in the spectral region of interest for orientation quantification in the fibers.
A significant drawback of immersion in an index-matching medium is that it impairs the identification of fibers and complicates focusing due to reduced optical contrast. A solution is to adapt the microscope setup for cross-polarized optical imaging, which enhances contrast based on the birefringence of the fibers. This can be achieved by positioning a polarizer and an analyzer before and after the sample such that the incident and reflected light are directed at ± 45° relative to the fiber axis (and thus to the Z and X polarizations of the laser and scattered Raman). Alternatively, if the optical imaging polarizer and analyzer are fixed in the Z or X directions, a rotating stage may be used to rotate the sample by 45° during focusing for maximum birefringence contrast, before returning to 0° for spectral acquisition.
As a final note, while measurements under sample immersion improve accuracy, they are not always necessary to obtain quantitative information on molecular orientation. Notably, geometry-induced artifacts are expected to be less prominent when the main component of the Raman tensor of the band selected for quantification is aligned parallel or perpendicular to the polymer backbone (tilt angles of 0° or 90°, compared to 70° for PAN35,36) because such bands produce larger changes in polarized intensities with orientation. 17 Additionally, some electrospinning systems naturally produce larger fibers for which the impact of geometric artifacts on polarized intensities is lower. 27 Therefore, it is recommended to first compare the polarized intensities of representative thin fibers measured both in air and in an index-matching medium to evaluate the need to use immersion. If uncertain, measurements in an index-matching medium remain the most robust option.
Conclusion
This work introduces a practical approach for minimizing spectral artifacts caused by the cylindrical geometry of electrospun micro- and nanofibers, which can impede the accurate determination of molecular orientation using conventional polarized Raman spectroscopy methodologies. By immersing electrospun fibers of polyacrylonitrile (PAN) in deionized water (n = 1.33) or silicone oil (n = 1.403) to reduce the refractive index mismatch with the surrounding medium (typically air, n = 1), it is possible to reduce or almost eliminate the geometry-induced artifacts that affect the intensity of polarized Raman spectra. The accuracy of the quantitative orientation data was significantly improved, with 〈P2〉 values obtained under water and oil immersion displaying fidelities of 68% and 85%, respectively, relative to calibrated reference data, compared to a fidelity of 0% for fibers interrogated in air. The accuracy achieved under oil immersion further enabled us to establish a robust 〈P2〉-diameter curve, a useful approach to optimize the structure-properties relationships in electrospun materials. This refractive index-matching strategy is an effective and relatively easy to implement solution to determine accurate Raman orientation values for challenging samples such as thin electrospun nanofibers.
Supplemental Material
sj-pdf-1-asp-10.1177_00037028261458831 - Supplemental material for Overcoming Artifacts: Polarized Raman of Individual Electrospun Fibers Under Immersion
Supplemental material, sj-pdf-1-asp-10.1177_00037028261458831 for Overcoming Artifacts: Polarized Raman of Individual Electrospun Fibers Under Immersion by Philippe Knapp, Arnaud W. Laramée and Christian Pellerin in Applied Spectroscopy
Footnotes
Acknowledgments
This work was supported by the Natural Sciences and Engineering Research Council of Canada (NSERC) [RGPIN-05098-2020]. The authors thank Olivier Roy for conducting complementary experiments.
Declaration of Conflicting Interests
Christian Pellerin serves as a member of the Applied Spectroscopy Editorial Advisory Board. The authors declare no potential conflicts of interest with respect to the research, authorship, review, and/or publication of this article.
Supplemental Material
All supplemental material mentioned in the text accompanies this paper online.
References
Supplementary Material
Please find the following supplemental material available below.
For Open Access articles published under a Creative Commons License, all supplemental material carries the same license as the article it is associated with.
For non-Open Access articles published, all supplemental material carries a non-exclusive license, and permission requests for re-use of supplemental material or any part of supplemental material shall be sent directly to the copyright owner as specified in the copyright notice associated with the article.