






Abstract
This study constructed a dual-substrate colorimetry based on the catalytic activity single-stranded DNA (ssDNA), i.e., 5′-GGT TGG TGT GGT TGG-3′, functionalized gold nanoparticles (AuNPs-ssDNA). By utilizing the peroxidase-mimicking activity of AuNPs and generating differential colorimetric response fingerprints through dual substrates o-phenylenediamine (OPD) and 3-amino-9-ethylcarbazole (AEC), simultaneous discrimination and quantitative detection of Fe2+ and Fe3+ were achieved. Characterization results showed that the synthesized AuNPs had an average size of about 12 nm. After functionalization, the average diameter of the formed AuNPs-ssDNA complexes increased to 13 nm, and the absorption peak position remained unchanged, indicating that ssDNA modification did not affect their dispersity and morphology. This method, combined with multivariate calibration models, can extract quantitative information from complex response patterns, with a linear detection range for both Fe2+ and Fe3+ from 0.01 to 100 μM. In practical application validation, the method was successfully used to detect iron ion concentrations in A549 cells treated with the ferroptosis inducer GPX4-IN-7. The results showed high consistency (P ≤ 0.001) with those obtained using a commercial FerroOrange detection kit, demonstrating the potential of this method for practical application in complex biological systems.
This is a visual representation of the abstract.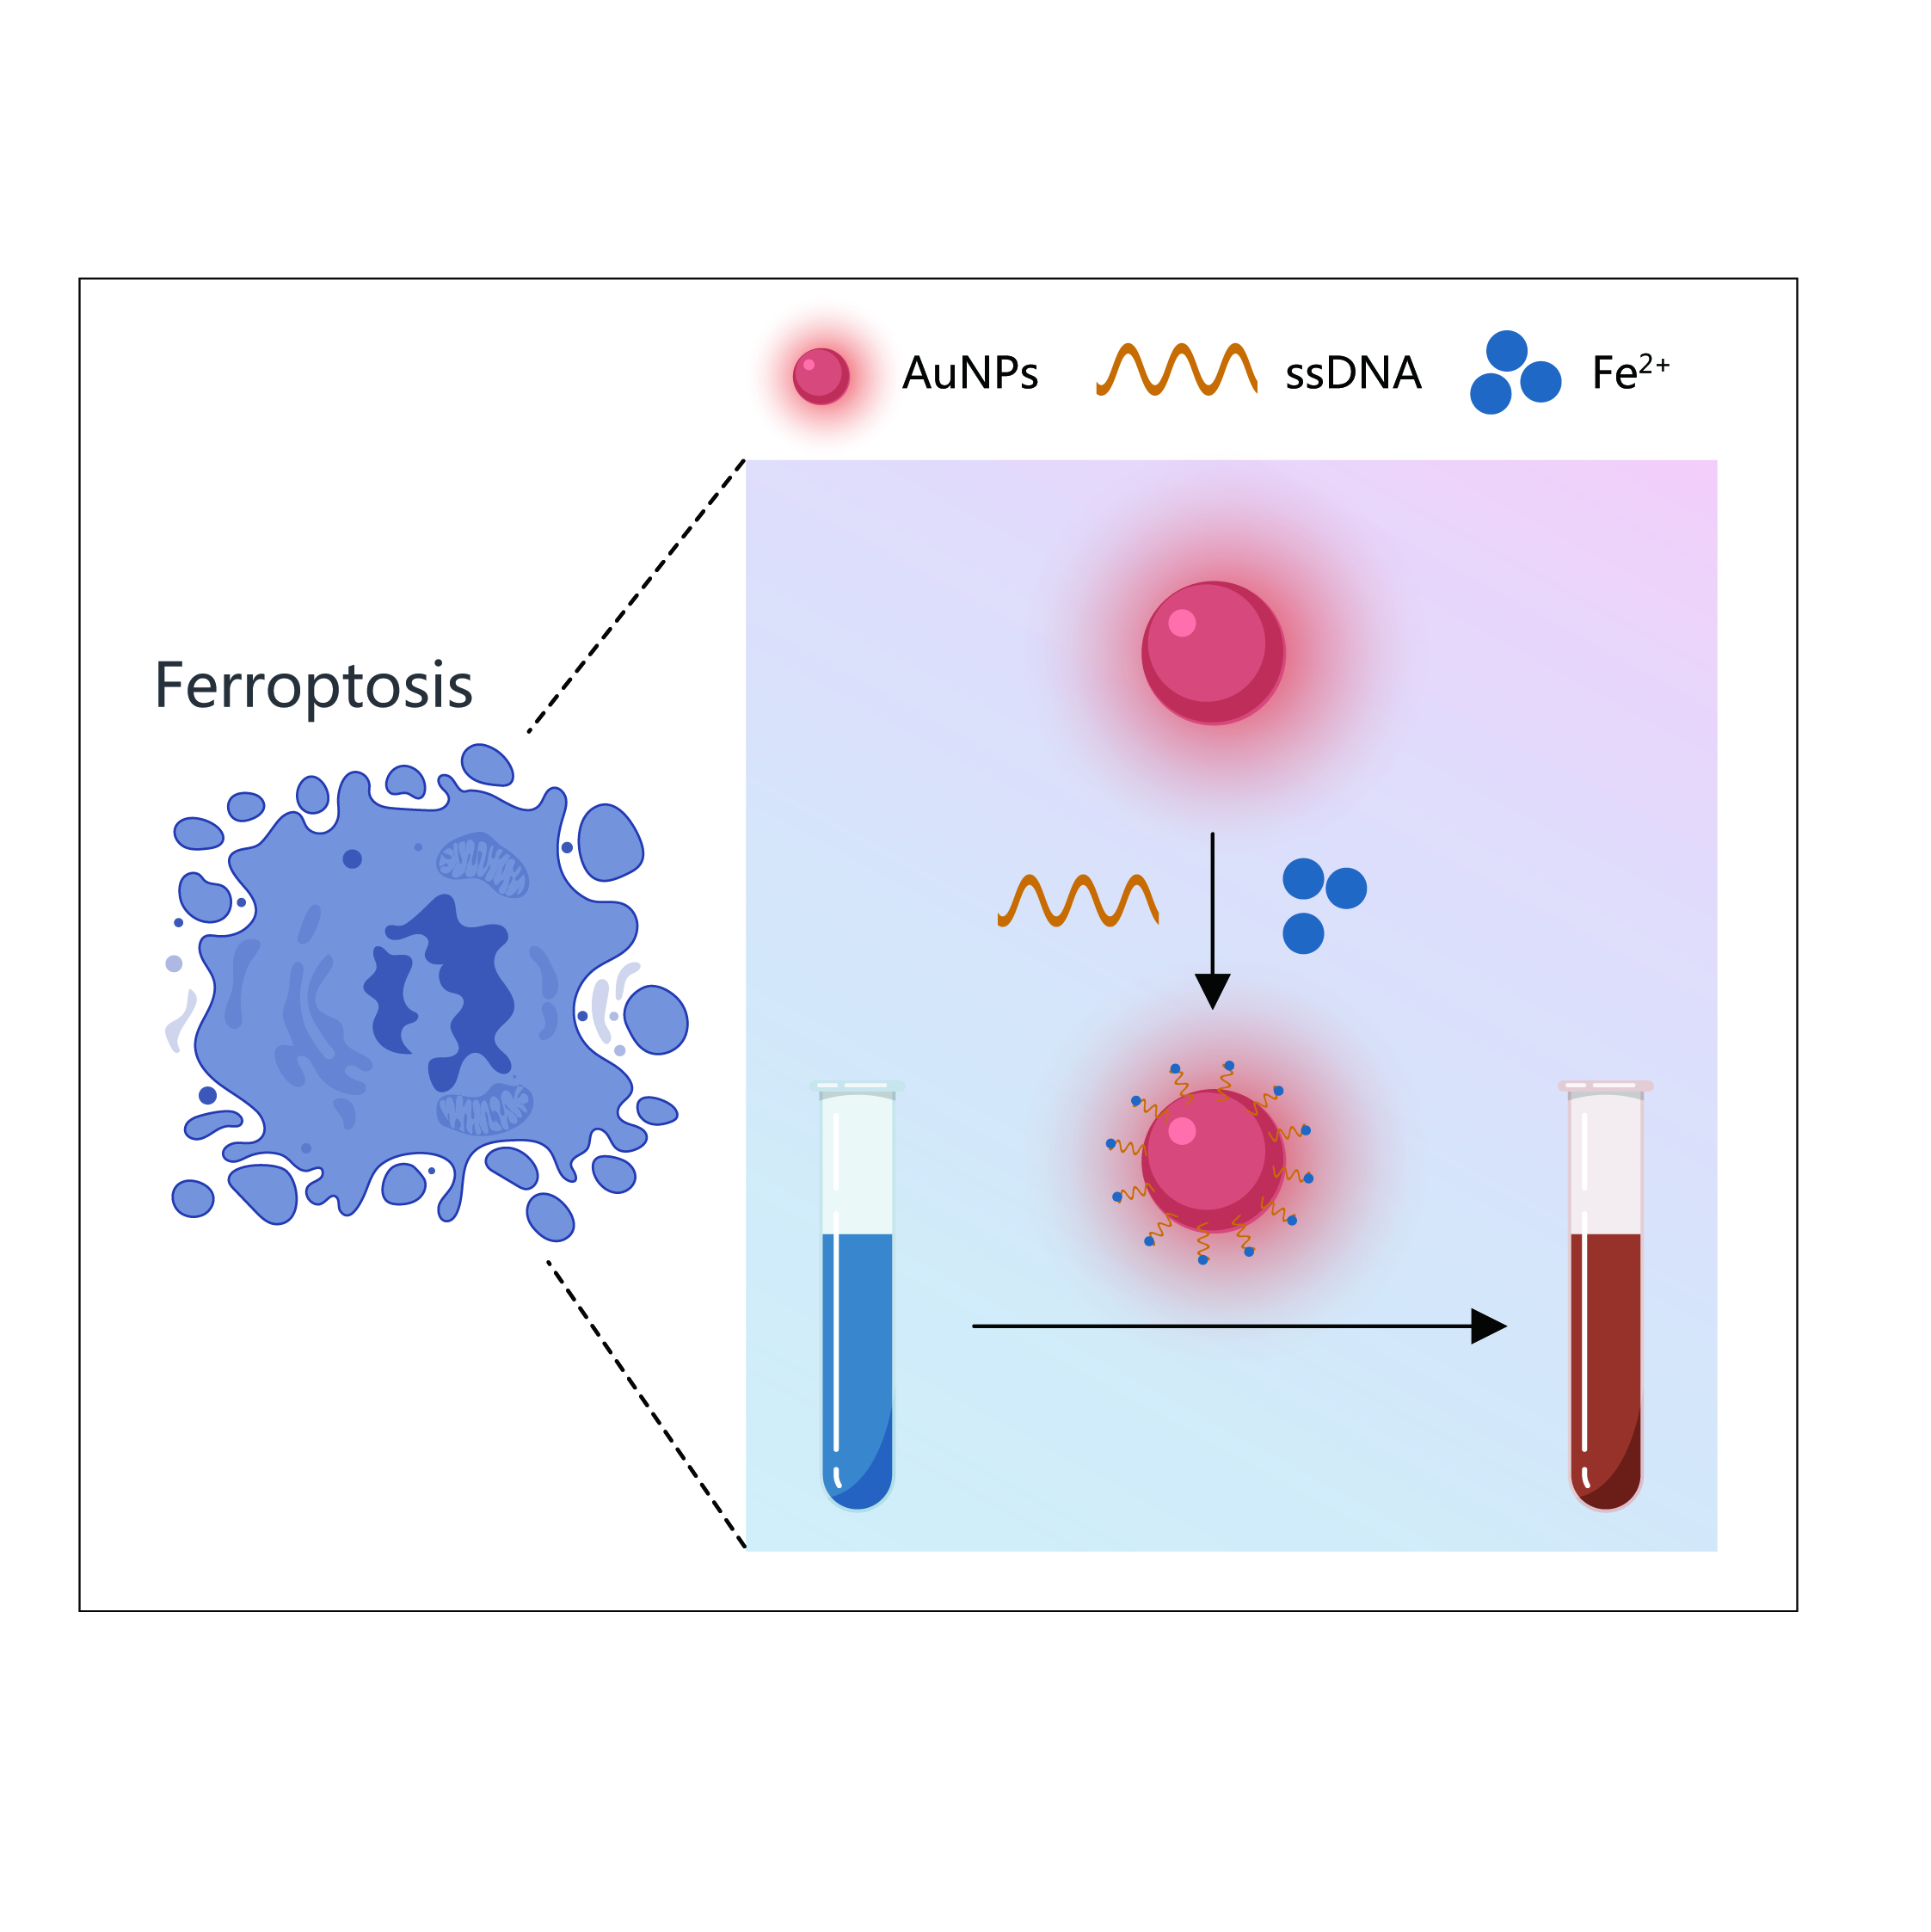
Keywords
Introduction
Iron, as an essential element for life, plays a central role in key physiological processes such as cellular metabolism, oxygen transport, and DNA synthesis. 1 Precise regulation of intracellular iron homeostasis is crucial, and the dynamic balance between ferrous (Fe2+) and ferric (Fe3+) ions is fundamental for maintaining normal cellular function. 2 However, dysregulation of iron homeostasis, particularly the abnormal accumulation of reductive Fe2+, can catalyze the production of reactive oxygen species via the Fenton reaction, leading to lipid peroxidation and subsequently inducing a form of iron-dependent programmed cell death known as ferroptosis.3,4 Therefore, accurate and quantitative detection of intracellular Fe2+ concentration is of great significance for assessing the degree of ferroptosis, studying related disease mechanisms, and screening interventional drugs. 5
The quantification of metal ions generally employs sophisticated analytical methods, including atomic absorption spectroscopy and inductively coupled plasma mass spectrometry. 6 Although these techniques offer high sensitivity, they have limitations including high cost, complex operation, and difficulty in achieving on-site or real-time detection.7–9 In the field of cell biology, detection of ferroptosis often employs fluorescent probe methods (such as FerroOrange test), but these methods are costly and susceptible to photobleaching and autofluorescence interference. In recent years, colorimetric sensing platforms based on nanomaterials have attracted widespread attention due to their low cost, simple operation, and potential for visualization. Among them, gold nanoparticles (AuNPs) have shown significant advantages in constructing colorimetric sensors due to their ease of synthesis, high modifiability, good stability, and unique optical properties.10–12 Particularly, their peroxidase-like activity can catalyze color reactions of various chromogenic substrates, providing a basis for visual detection.9,12 A core advantage of colorimetric method is its compatibility with a standard microplate reader, which is ubiquitous in biological and chemical laboratories. The procedure is straightforward: Mix the sample with the AuNPs, add the chromogenic substrate/hydrogen peroxide (H2O2) solution, incubate, and measure the absorbance. In contrast, detection with the FerroOrange kit typically relies on confocal fluorescence microscopy. This specialized equipment is not universally available, requires more technical expertise for operation and image analysis, and is less amenable to rapid, high-throughput processing of multiple samples. The colorimetric method therefore dramatically lowers the instrumental and technical barrier to entry.
However, traditional sensors based on a single chromogenic reaction of AuNPs often face challenges such as monotonous color change and weak anti-interference ability, making it difficult to selectively identify and quantify specific metal ions in complex systems (e.g., cell lysates).13,14 Furthermore, simultaneously distinguishing and quantifying chemically similar Fe2+ and Fe3+ is even more challenging. Dual-channel technology offers a new approach to address this issue. 15 By using double sensing units with different response characteristics to form a dual channel. Combined with chemometric methods, this enables high-precision identification and quantification of multiple analytes or even mixtures. 16
Building on our previous work9,12 in qualitative and quantitative analysis of multiple metal ions in water and food using a multicolor sensor array combined with chemometrics, this study proposes an innovative detection strategy. We utilize the peroxidase-like activity of AuNPs to construct a novel colorimetric sensor array. This array innovatively employs 3-amino-9-ethylcarbazole (AEC) and o-phenylenediamine (OPD) as the key combination of chromogenic substrates. These two substrates can produce differentiated color responses when interacting with AuNPs regulated by iron ions of different valences, thereby providing the possibility for simultaneous visual discrimination of Fe2+ and Fe3+. Furthermore, we analyze the color information (UV–Vis spectra) generated by the array through multivariate calibration models such as partial least squares (PLS), ultimately achieving simultaneous quantification of Fe2+ and Fe3+ concentrations in cell samples.
The innovations of this study are as follows. First, the method's selectivity and anti-interference ability in complex biological matrices are significantly improved through dual-channel signal output. Second, based on the chromogenic reactions of AEC and OPD, visual detection by the naked eye or smartphone reading is achieved, laying the foundation for on-site or simple platform detection. Third, based on chemometrics, e.g., partial least square (PLS) multicomponent quantification models, simultaneous and accurate quantification of Fe2+ and Fe3+ is successfully realized, overcoming the limitations of traditional single detection methods. Finally, applying this strategy to quantitative assessment of cellular ferroptosis provides a new tool with significantly lower cost than traditional fluorescent methods and simple operation. This method not only offers a new analytical approach for ferroptosis research but also provides a referable idea for specific detection of metal ions in other complex systems.
Experimental
Materials and Instruments
We purchased HAuCl4·3H2O (≥ 99.99%) and sodium citrate dihydrate (≥ 99%) from Aladdin Industrial Corporation (China). FeCl2·4H2O (analytical grade, ≥ 99%) and FeCl3·6H2O (analytical grade, ≥ 99%) served as the sources of Fe2+ and Fe3+ respectively. Commercial suppliers provided the chromogenic substrates 3-amino-9-ethylcarbazole (AEC, C14H14N2) and o-phenylenediamine (OPD, C6H8N2). The Fe2+, Fe3+, AEC, and OPD were purchased from Sinopharm Chemical Reagent Co., Ltd. (China). Single-stranded DNAs (ssDNA, 5′-GGT TGG TGT GGT TGG-3′) were synthesized by Sangon Biotechnology Co. Ltd. (China). ssDNA purification using high-performance liquid chromatography (HPLC). All other chemicals were analytical grade and used without purification. Ultrapure water (18.2 MΩ·cm) from a Direct-Q3 system (Merck Millipore) was used for preparing all aqueous solutions.
The ultraviolet–visible (UV–Vis) spectra were recorded using a UV–Vis spectrometer (Mettler Toledo). An incubator shaker (Hangzhou Miu Instruments Co., Ltd.) was used to mix solutions and maintain them at 37 °C.
Synthesis of Citrate-Capped AuNPs
Gold nanoparticles (AuNPs) with an approximate diameter of 12 nm were synthesized via the citrate reduction method (Turkevich method), 14 yielding citrate-capped AuNPs. Briefly, an aqueous solution of HAuCl4 (100 mL, 0.25 mM) was brought to a vigorous boil under stirring. Then, a sodium citrate solution (1 mL, 34 mM) was rapidly injected into the boiling solution. The mixture was kept boiling for another 15–20 minutes until the color changed from pale yellow to deep red, indicating the formation of AuNPs. The colloid was allowed to cool to room temperature with continuous stirring. The concentration of the AuNP colloid was estimated according to the Beer–Lambert law using its characteristic surface plasmon resonance absorbance.
Functionalization of Gold Nanoparticles (AuNPs) with ssDNA
The placement of ssDNA onto citrate-capped gold nanoparticles (AuNPs, ∼12 nm) was performed based on the physical adsorption of DNA bases (particularly adenine) onto the gold surface. The procedure is outlined as follows: (i) The ssDNA oligonucleotide solution was heated to 95 oC for 5–10 min and then rapidly cooled on ice. This step ensures the DNA remains in a single-stranded, unfolded conformation, maximizing the exposure of its nucleobases for subsequent adsorption. (ii) The denatured ssDNA (100 nM, 100 μL) was directly added to the AuNP colloid (11 nM, 100 μL). The mixture was incubated under gentle agitation at room temperature for 12 h to allow for sufficient physical adsorption of the DNA strands onto the nanoparticle surface.
To remove excess, unbound ssDNA, the functionalized AuNPs (AuNPs-ssDNA) were purified by centrifugation. The supernatant was carefully discarded, and the resultant pellet was resuspended in an appropriate buffer (100 μL, 10 mM Tris–HCl, pH 7.4). This wash-resuspension cycle was typically repeated three times to obtain purified AuNPs-ssDNA.
Preparation of Chromogen Solutions for Horseradish Peroxidase (HRP)
3-Amino-9-ethylcarbazole stock solution (4 mg/mL), 20 mg AEC was dissolved in 5 mL N,N-dimethylformamide (DMF) by vortexing. This solution was aliquoted, protected from light, and stored at –20 oC for up to several months. The working solution (prepared fresh for immediate use) and 0.5 mL the AEC stock solution was added to 9.5 mL of 0.05 M sodium acetate buffer (pH 5.0–5.2) and mixed thoroughly. Immediately prior to application, 5 μL of 30% (v/v) hydrogen peroxide (H2O2) was added and mixed gently. The working solution was kept in the dark and used promptly. It is recommended to filter the solution through a 0.45 μm filter before use to remove any potential micro-crystals and minimize background.
o-Phenylenediamine (OPD) Solution
The OPD substrate, which produces a soluble orange-yellow product, was prepared with caution due to its potential carcinogenicity. All handling was performed wearing gloves.
The substrate buffer (0.1 M citrate–phosphate buffer, pH 5.0) was prepared by mixing 24.3 mL of 0.1 M citric acid solution with 25.7 mL of 0.2 M disodium hydrogen phosphate (Na2HPO4) solution. The final volume was adjusted to 100 mL with deionized water, and the pH was verified to be 5.0.
The working solution (prepared fresh for use) of 4 mg of OPD tablets or powder was dissolved in 10 mL of the pre-warmed substrate buffer (pH 5.0). Immediately before adding to the assay, 5 μL of 30% H2O2 was added to the solution, which was then mixed well and used immediately under light-protected conditions.
Preparation of the Dual-Channel Detection
The sensor array was constructed based on the modulation of the peroxidase-like activity of AuNP-ssDNA by Fe2+ and Fe3+ ions. In a typical procedure, 10 μL AuNP-ssDNA colloid was mixed with 10 μL ultrapure water (as a control unit) or solutions containing different concentrations of Fe2+ or Fe3+. The mixture was incubated at 37 °C for 10 min to allow interaction between the metal ions and the AuNP-ssDNA surfaces.
Subsequently, the chromogenic reaction was initiated by adding 500 μL these substrate solutions (AEC or OPD). For the dual-channel detection, separate aliquots of the AuNP–metal ion mixture were transferred to wells containing either AEC or OPD substrate solution. The final reaction mixture was incubated at 37 °C for a fixed time (e.g., 10, 20, 30, 40, 50, and 60 minutes) to allow color development catalyzed by the peroxidase-like activity of the AuNPs-ssDNA-Mn + .
Data Acquisition and Multivariate Analysis
The response of the dual-channel detection was captured in multiple forms, (i) digital photographs of the colored solutions, and (ii) full UV–Vis spectra (e.g., 400–700 nm). For simultaneous quantitative analysis of Fe2+ and Fe3+ concentrations, PLS regression models were developed. The dataset was randomly split into a calibration set (∼80%) and an external validation set (∼20%). Model robustness was evaluated using bootstrapping Latin partitions, and performance was assessed based on the square correlation coefficient (R2), root mean square error of cross-validation (RMSECV), and standard deviation (SD)–root mean square error of cross-validation for the external set.17–19 All chemometric analyses were performed using appropriate toolboxes in Matlab (The MathWorks Inc.).
Detection of Cellular Ferroptosis
A549 cells were cultured in Dulbecco's Modified Eagle Medium (DMEM) supplemented with 10% fetal bovine serum (FBS) at 37 °C in a humidified atmosphere containing 5% CO2. For experiments, cells were seeded into appropriate culture plates and allowed to adhere for 24 hours. To establish a cellular ferroptosis model, the culture medium was replaced with fresh medium containing varying concentrations of the ferroptosis inducer GPX4-IN-7 (MedChemExpress, USA). 3 Cells were then incubated for an additional 24 h to simulate different degrees of ferroptotic stress. Following treatment, cells were washed three times with phosphate-buffered saline (PBS). Intracellular labile Fe2+ was stained using the FerroOrange ferroptosis detection kit according to the manufacturer's instructions. Fluorescence imaging was performed using a confocal microscope. The fluorescence intensity, corresponding to Fe2+ levels, was quantified using ImageJ software. In parallel, treated cells were collected, washed with PBS, and resuspended in 0.2 mL of PBS. The cell suspension was thoroughly homogenized via grinding. The homogenate was centrifuged to remove cell debris, and the clear supernatant was collected for analysis. A 10 µL aliquot of the processed cell supernatant was introduced into the self-assembled sensor array, comprising the OPD and AEC sensing units. The array was incubated for 60 minutes (OPD unit) or 20 minutes (AEC unit), as previously optimized. Following incubation, the UV–Vis absorption spectra of the reaction systems were recorded. The spectral data were then input into the pre-established PLS model to predict the concentrations of Fe2+ concentration in the samples. A spike-recovery experiment conducted in cell lysis buffer to robustly demonstrate accuracy and precision under conditions mimicking real application. In this study, cell lysates is PBS. Known concentrations of Fe2+ and Fe3+ standards (10 µL, 50 µM) were spiked into the PBS buffer and quantified using our established dual-channel method and PLS calibration models. The agreement between the iron concentrations predicted by our PLS mold and the values indicated by the FerroOrange fluorescence intensity was assessed using Spearman correlation analysis. A P-value of ≤ 0.005 was considered indicative of statistically significant concordance.
Results and Discussion
Mechanisms
The core of the method relies on the horseradish peroxidase (HRP)-like catalytic activity of AuNPs–ssDNA–Mn + . In the presence of hydrogen peroxide (H2O2), these AuNPs–ssDNA–Mn+ can catalyze the oxidation of specific chromogenic substrates, such as AEC and OPD, leading to the formation of colored products with distinct absorption spectra. The catalytic efficiency of AuNPs is highly sensitive to their surface properties, including charge, aggregation state, and the adsorption of molecules or ions. 20
Our initial work 12 utilized the classic HRP-mimicking substrate, 3,3’,5,5'-tetramethylbenzidine (TMB), with AuNPs-ssDNA. While successful for single-analyte detection, we found that a single substrate like TMB provided insufficient “cross-reactive” signal diversity to resolve mixtures. To overcome this limitation, in our subsequent research, 9 we conducted a comprehensive screening. We evaluated a panel of seven common HRP chromogens, including 4-chloro-1-naphthol (4-CN), AEC, OPD, 2,2′-azinobis (3-ethylbenzthiazpline-6-sulfonic acid)-ammonium salt (ABTS), 3,3′-diaminobenzidine (DAB), benzidine, and 5-aminosalicylic acid (5-ASA), for their ability to generate differential response patterns with AuNPs-ssDNA-Mn + . This work successfully enabled the discrimination of 14 metal ions and the quantification of ternary mixtures (Tl+/Pb2+/Hg2+), demonstrating the power of using multiple substrates to create unique “fingerprint” responses. Building on that foundation, the present study focuses on the detection of iron species (Fe2+/Fe3+), which are crucial in biomedical research (e.g., ferroptosis). For this specific application, we re-evaluated the substrate panel and found that the combination of AEC and OPD provided the most distinct and complementary response patterns for Fe2+ and Fe3+, leading to superior analytical selectivity for these ions compared to other substrate pairs.
The principle for ion detection exploits the fact that different metal ions interact with the AuNP surface in unique ways, thereby modulating their catalytic activity to different extents. The sensor operates through a cascade of synergistic interactions among the three key components, which is summarized below.
The principle for ion detection exploits the fact that different metal ions interact with the AuNPs surface, thereby modulating their catalytic activity to different extents. The sensor operates through a cascade of synergistic interactions among the three key components:
Platform preparation (AuNPs–ssDNA): Citrate-capped AuNPs are first functionalized with unmodified ssDNA. The ssDNA adsorbs onto the AuNP surface primarily via physical interactions, which concomitantly displaces or covers the surface citrate molecules. This ssDNA layer serves a triple purpose: (a) it stabilizes the AuNPs against salt-induced aggregation, (b) its exposed nucleobases provide specific binding sites for metal ions, and (c) it removes the potentially interfering reductant (citrate) from the nanoparticle surface, thereby creating a cleaner and more defined catalytic interface. Catalytic activity activation (formation of AuNPs–ssDNA–Mn+): The AuNPs–ssDNA conjugate itself possesses minimal peroxidase-like activity. The critical step is the introduction of the target metal ions (Fe2+ or Fe3+). These ions bind to the nitrogenous bases of the surface-bound ssDNA, forming a ternary AuNPs–ssDNA–Mn+ complex. The bound metal ion acts as a catalytic center, dramatically enhancing the peroxidase-mimicking activity of the nanocomposite. The type and concentration of the metal ion directly modulate this catalytic activity. Signal transduction (color generation via chromogenic reaction): The activated AuNPs–ssDNA–Mn+ complex catalyzes the oxidation of a chromogenic substrate (AEC or OPD) in the presence of hydrogen peroxide (H2O2). For instance, it catalyzes the conversion of colorless OPD to a yellow-orange product (oxidized OPD) or AEC to a reddish-brown product. The rate and extent of this color change are directly proportional to the catalytic activity of the complex, which in turn depends on the concentration of the metal ion (Fe2+ or Fe3+).
The innovation lies in using two different chromogenic substrates (AEC and OPD) to form a dual-channel detection. For quantitative and simultaneous analysis, the method integrates chemometrics. The data from the dual-channel, full UV–Vis spectra are processed using multivariate calibration models. PLS regression models are built to correlate the multidimensional response pattern from the two-substrate channel with the known concentrations of Fe2+ and Fe3+ in calibration samples. This model can then deconvolute the combined signal from a mixture, allowing the simultaneous quantification of both ions in an unknown sample.
In summary, the principle combines (i) the ion-specific modulation of AuNP-ssDNA peroxidase-like activity, (ii) the generation of differential colorimetric fingerprints using a dual-channel, and (iii) multivariate calibration models to extract quantitative information on both analytes from the complex response pattern.
Characterization of Gold Nanoparticles
Figure 1 shows transmission electron spectroscopy (TEM) images of the synthesized AuNPs that we prepared following the Experimental section. TEM imaging confirms AuNPs consist of individual spherical-shaped gold nanoparticles (Figure 1a) with average size of about 12 nm. Figure 1b shown the spherical AuNPs have their absorption peak at about 520 nm. Meanwhile, AuNPs were conjugated with ssDNA, the absorption peak position is not change, which indicated the image of well dispersed and morphology AuNPs is not affected by the ssDNA. The AuNPs exhibited an average diameter of 12 nm (polydispersity index, or PDI = 0.135) and a zeta potential of –14.17 ± 1.29 mV. Following ssDNA conjugation, the AuNPs-ssDNA complex showed an increased average diameter of 13 nm (PDI = 0.069) and a zeta potential of –37.23 ± 5.23 mV (Figure 1c). The dynamic light scattering experiments indicated the AuNPs were functionalized with ssDNA. The synthesized AuNPs and their size distribution are appropriate for our subsequent experiments. Figure 1d are the photograph and UV–Vis spectra of AuNPs, AuNPs-ssDNA, AuNPs-ssDNA + Fe2+ and AuNPs-ssDNA + Fe3+. Fe2+ and Fe3+ cannot change the colors and absorption of AuNPs-ssDNA, which conclude the AuNPs-ssDNA AuNP aggregation colorimetric method is not suitable to detect Fe2+ and Fe3+.
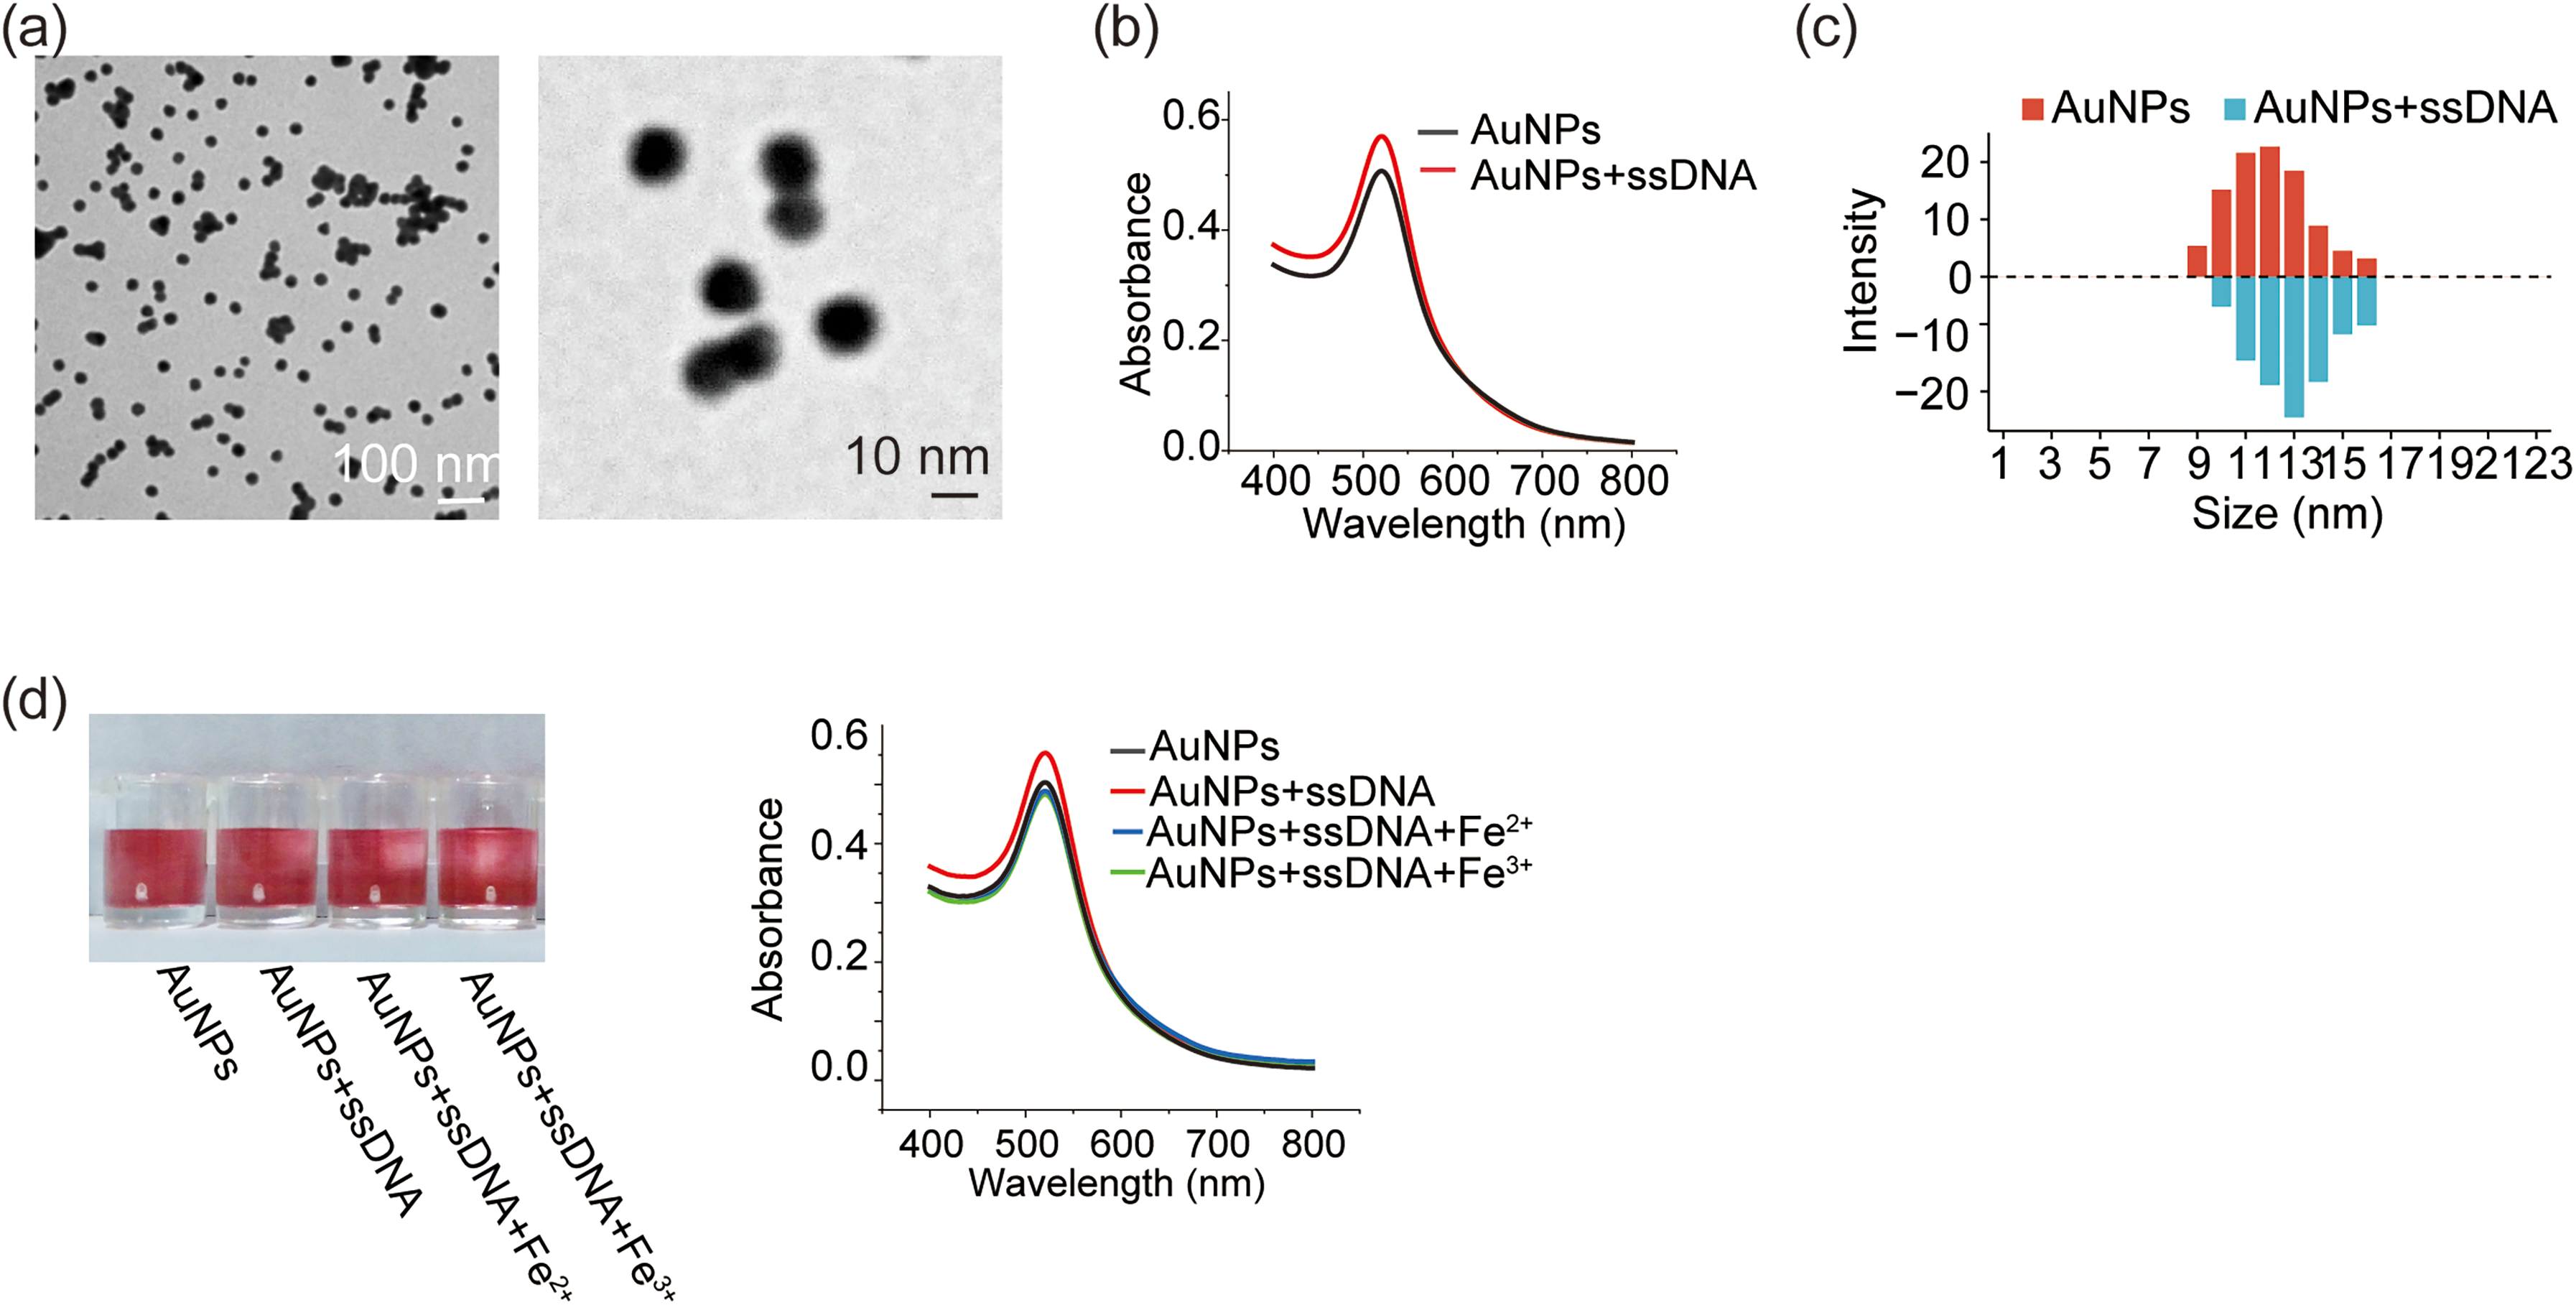
Characterization of gold nano particles (AuNPs). (a) TEM characterization of AuNPs. (b) UV–Vis spectra of AuNPs and AuNPs-ssDNA. (c) Dynamic light scattering data of AuNPs and AuNPs-ssDNA. (d) Photos and spectra of AuNPs-ssDNA response Fe2+ and Fe3+.
Identification of Fe2+ And Fe3+ Based on the Color Map and UV–Vis Spectra
Based on the color change of the chromogenic substrate, the catalytic activity of AuNPs–ssDNA can classify the metal ions into different groups. To rigorously evaluate the selectivity of dual-channel detection, fourteen metal ions (Cu2+, Fe2+, Fe3+, Mn2+, Ni2+, Zn2+, Cd2+, Cr3+, Co2+, Ba2+, K+, Tl+, Pb2+, and Hg2+) was selected. This is a critical experiment to demonstrate that the observed colorimetric response is specific to or significantly distinct for the target ions (Fe2+ and Fe3+), rather than a general reaction to metal ions. Figures 2a and 2b presents the photographic response of the array, which comprises the two sensing units OPD and AEC, toward each of these ions at a concentration of 10 μM. OPD sensor units exhibited different colors (Figure 2a) when AuNPs–ssDNA was mixed with Fe2+, Fe3+. The fundamental reason different metal ions produce varied color changes lies in their distinct electronic structures and physicochemical properties. Key factors include: (i) The unique electron configuration (e.g., d-orbital occupancy in transition metals) and stable oxidation states of each ion (e.g., Fe2+ versus Fe3+) dictate their binding affinity and mode of interaction with the nucleobases of the AuNPs-ssDNA surface. (ii) Upon binding, each metal ion uniquely modulates the peroxidase-mimicking activity of the resulting AuNPs-ssDNA-Mn+ complex. This is because the ion's electronic properties influence charge transfer dynamics and the catalytic pathway for oxidizing the chromogenic substrates (AEC/OPD) in the presence of H2O2. (iii) Consequently, ions with different electronic structures (e.g., alkali metal Na+ versus transition metal Fe3+) induce different catalytic efficiencies and kinetics. This leads to variations in the rate and extent of the oxidation reaction, ultimately producing distinct color intensities and hues for each ion-substrate combination in the array.
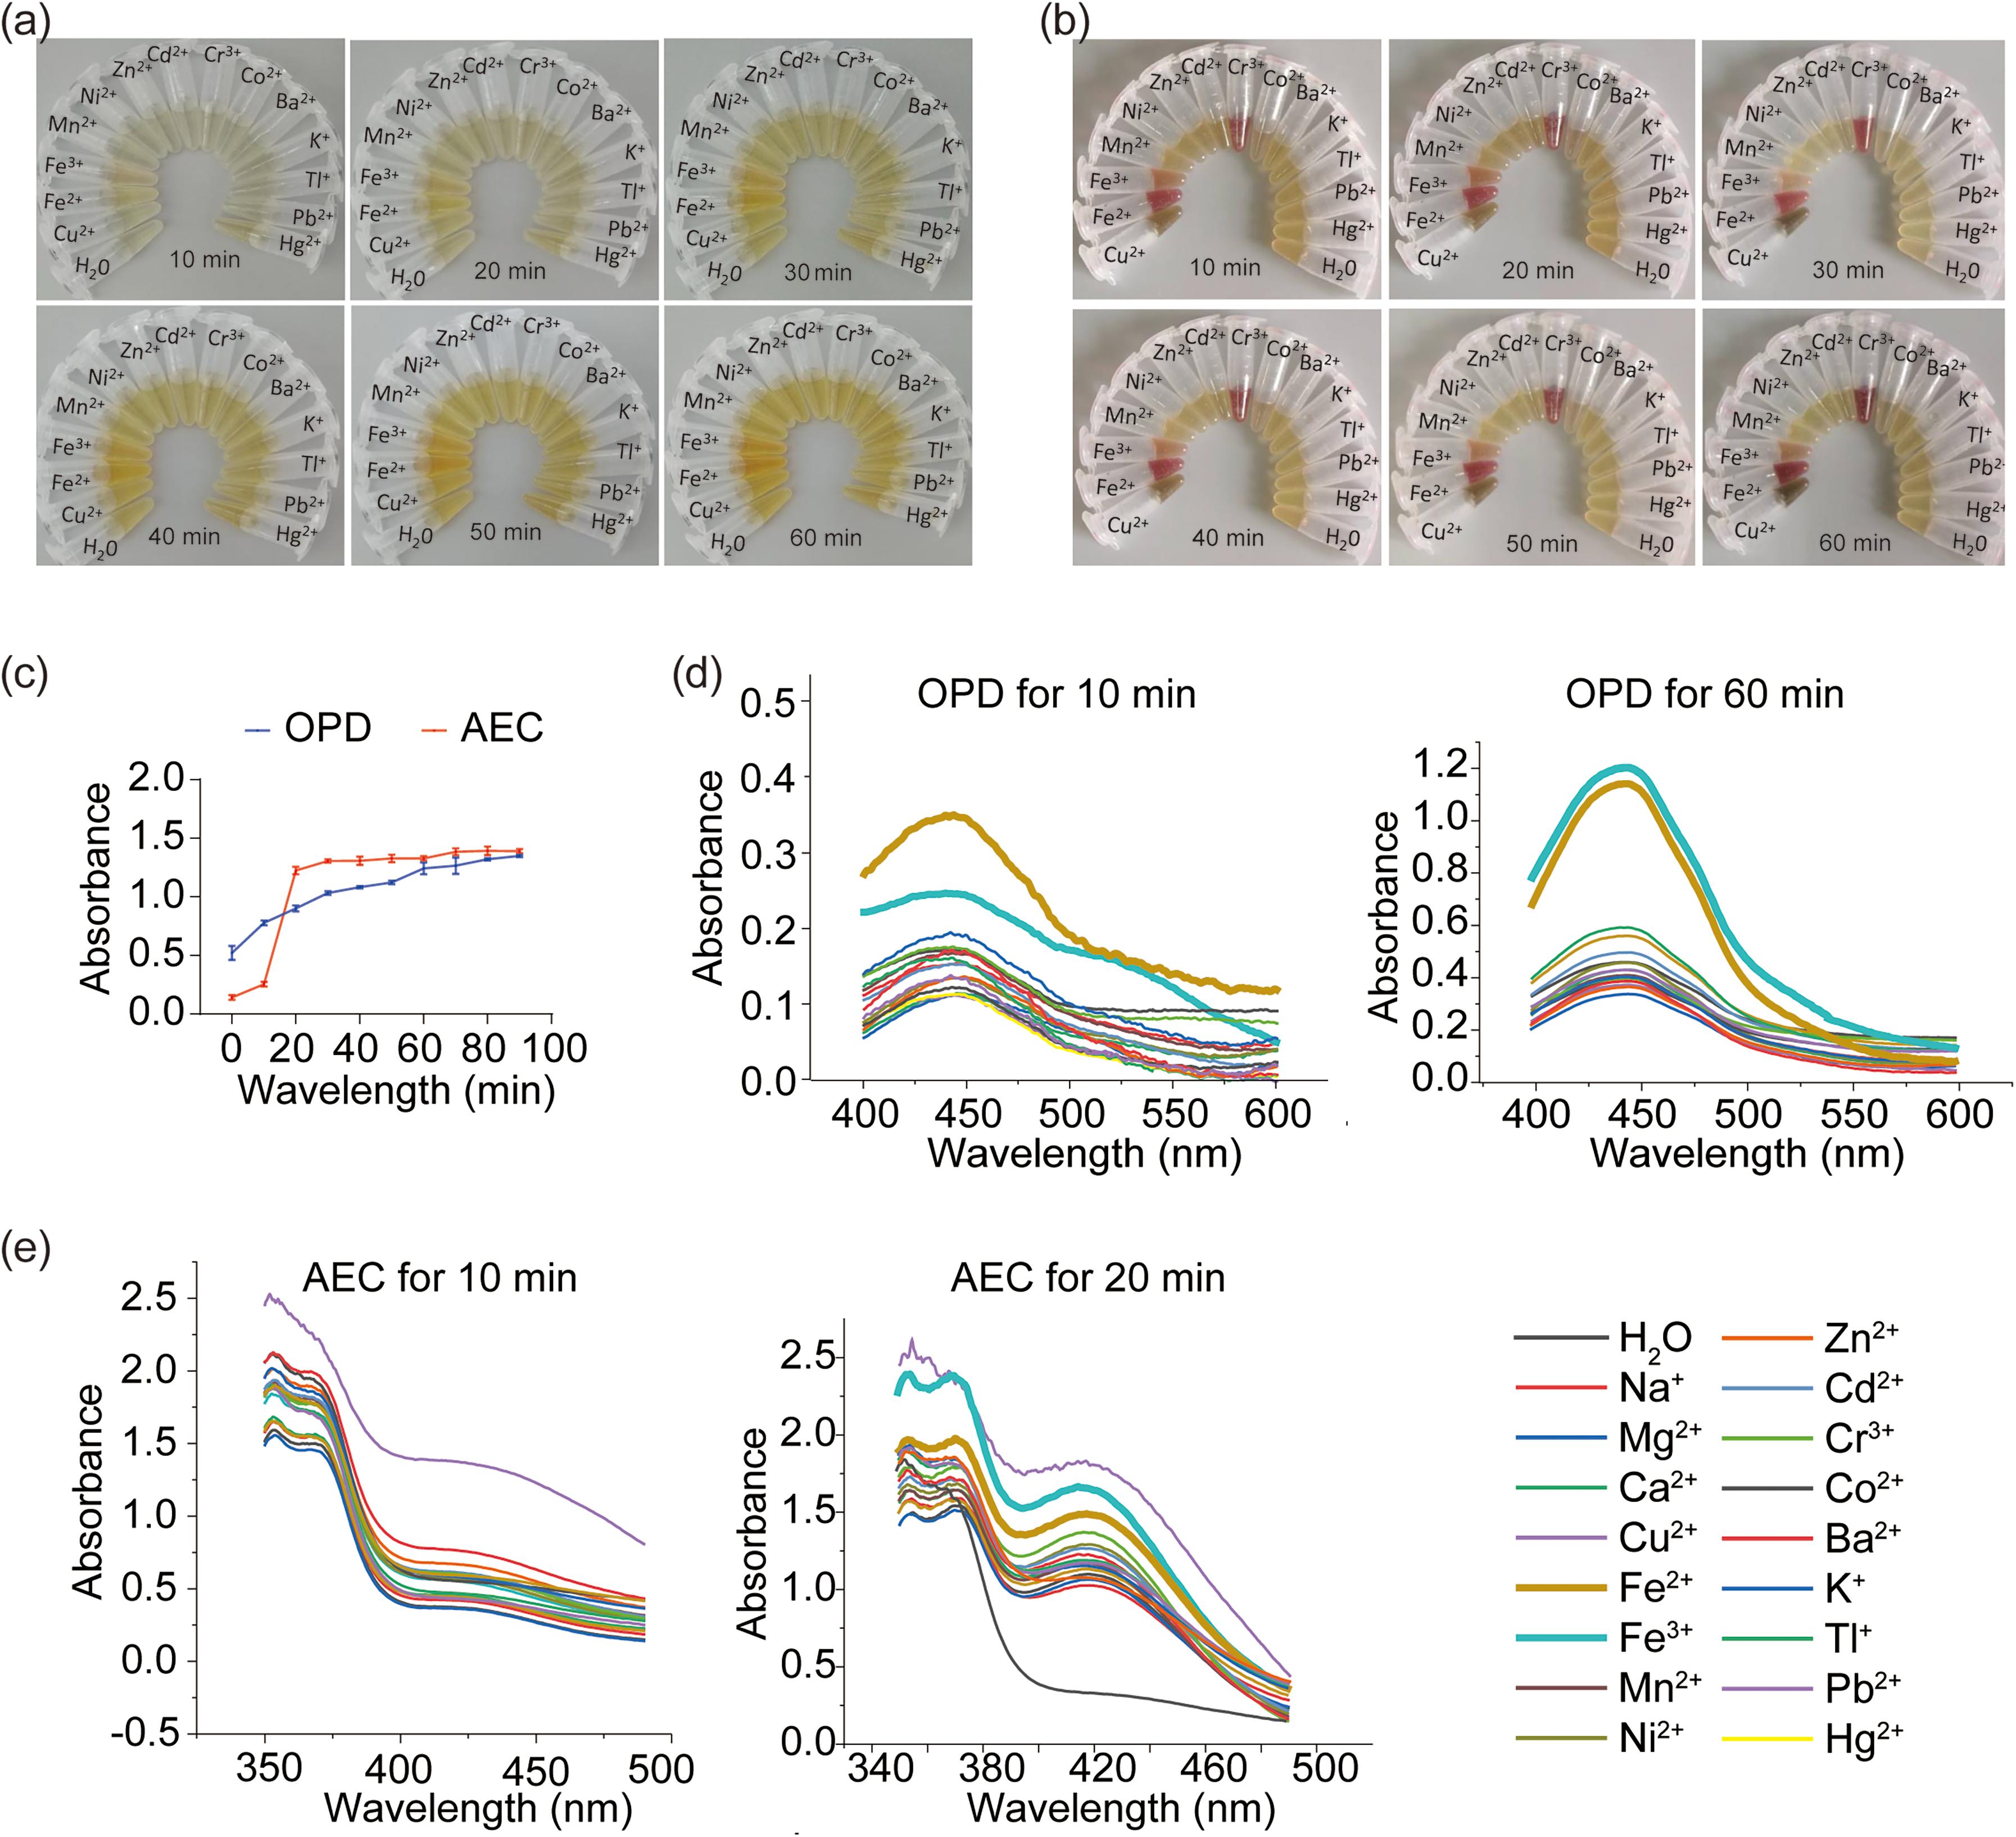
Identification of Fe2+ and Fe3+ based on the color map and UV–Vis spectra. (a) Photograph of the colorimetric OPD sensor unit used for the detection of 14 metal ions (10 μM each). (b) Photograph of the colorimetric AEC sensor unit used for the detection of 14 metal ions (10 μM each). (c) Absorbance at the maximum absorption wavelength in the dual-channel (AEC and OPD) in the presence in the presence of Fe2+ at different time. (d) UV–Vis spectra of the colorimetric OPD sensor units used for the detection of 14 metal ions (10 μM each). (e) UV–Vis spectra of the colorimetric AEC sensor units used for the detection of 14 metal ions (10 μM each).
However, the OPD sensor unit cannot distinguish Fe2+ and Fe3+. Given the differing biological roles of Fe2+ and Fe3+, it is crucial to distinguish between them. To achieve this, AEC was incorporated as a sensing unit to improve the selectivity of our approach (Figure 2b). The OPD sensing unit effectively identifies Fe2+ and Fe3+ from other metal ions. Although the AEC unit responds to multiple ions (including Cu2+, Fe2+, Fe3+, and Cr3+), it provides clear discrimination between Fe2+ and Fe3+. By integrating the advantages of both OPD and AEC, the sensor array achieves not only the detection of iron ions but also their specific differentiation into Fe2+ and Fe3+. The identification performance of the sensing units was highly dependent on the color development time. Notably, the OPD unit required an incubation period of 60 minutes to achieve optimal performance, at which point its colorimetric response was most distinct. UV–Vis spectral analysis further verified that this 60-minute time point enabled the OPD unit to provide clear discrimination between iron ions (Fe2+/Fe3+) and the other tested metal ions. In contrast, the AEC sensing unit achieved rapid color development, enabling clear discrimination between different metal ions within 20 minutes. While a longer incubation time (60 minutes) was optimal for the OPD unit, it proved detrimental for AEC, as bubble formation occurred. These bubbles severely compromised the assay by distorting visual color assessment. Consequently, incubation times of 60 min (OPD) and 20 min (AEC) were used in further experiments.
The control experiments performed in this study provide definitive insights into the catalytic mechanism and decisively address concerns regarding solution-phase redox interference. First, the absolute necessity of the AuNPs–ssDNA platform for signal generation was unequivocally established. As shown in Figure S1a (Supplemental Material), in the absence of AuNPs (with only ssDNA and metal ions present), the target ions Fe2+ and Fe3+, along with most other tested metal ions, failed to induce any significant color change in the chromogenic substrates (AEC–OPD) within the 60-minute observation window. Critically, this key experiment, i.e., containing all reaction components except AuNPs, also serves as the most direct evidence that potential side reactions (including any homogeneous Fenton-like processes 21 ) do not contribute to the detectable signal under our assay conditions (Figure S2). The system remains optically silent, confirming that the complex redox network potentially involving free metal ions, H2O2, and the substrates is kinetically negligible and does not interfere with the measurement.
Therefore, the significant chromogenic activity observed in the complete system is exclusively “gated” by the formation of the ternary AuNPs–ssDNA–Mn+ complex. This conclusion is further reinforced by the result that solutions containing only free Fe2+ or Fe3+ (without AuNPs or ssDNA, Figure S1b) were equally inactive. The stark contrast between the silent “no-AuNP” control and the active complete system underscores that the peroxidase-mimicking activity is not a solution-phase phenomenon but a surface-catalyzed process. The measured signal thus correlates directly with the concentration of metal ions specifically adsorbed and activated at the nanostructured interface, ensuring the specificity of the detection.
Quantitation Analysis of Fe2+ and Fe3+ in Binary Mixtures
Given its capability to identify Fe2+ and Fe3+, our sensor array can further be applied to the quantitative determination of each specific ion. In practical samples, Fe2+ and Fe3+ ions often coexist in varying and unknown ratios. To simulate this realistic scenario, we prepared random mixtures of Fe2+ and Fe3+ at different proportions. These mixtures were then introduced to the sensor array comprising the OPD and AEC sensing units, and the corresponding UV–Vis absorption spectra (Figure 3a) were collected for analysis. A PLS regression model was employed to enable the simultaneous quantitative analysis of Fe2+ and Fe3+ in binary mixtures based on their UV–Vis absorption spectra. This method overcomes the limitation of traditional univariate calibration, which depends on a single wavelength and often fails in mixtures due to spectral overlap and poor selectivity. The predictive PLS models for Fe2+ and Fe3+ were established using the optimal number of PLS components (13 for Fe2+, 10 for Fe3+), which were selected to minimize the average RMSECV. Model precision was assessed via 10 bootstrap iterations, with the 95% confidence intervals presented in Figures 3b (Fe2+) and 3c (Fe3+). The models showed strong agreement between predicted and reference concentrations, as evidenced by low RMSECV values (1.0019 ± 0.04 μM for Fe2+; 4.3796 ± 0.07 μM for Fe3+) and high coefficients of determination (R2 = 0.9994 for Fe2+; for R2 = 0.9879 Fe3+). According to IUPAC guidelines, the calculated limits of detection were 76.34 nM for Fe2+ and 102.33 nM for Fe3+, with both ions exhibiting a linear response across the 0.1–100 μM concentration range.
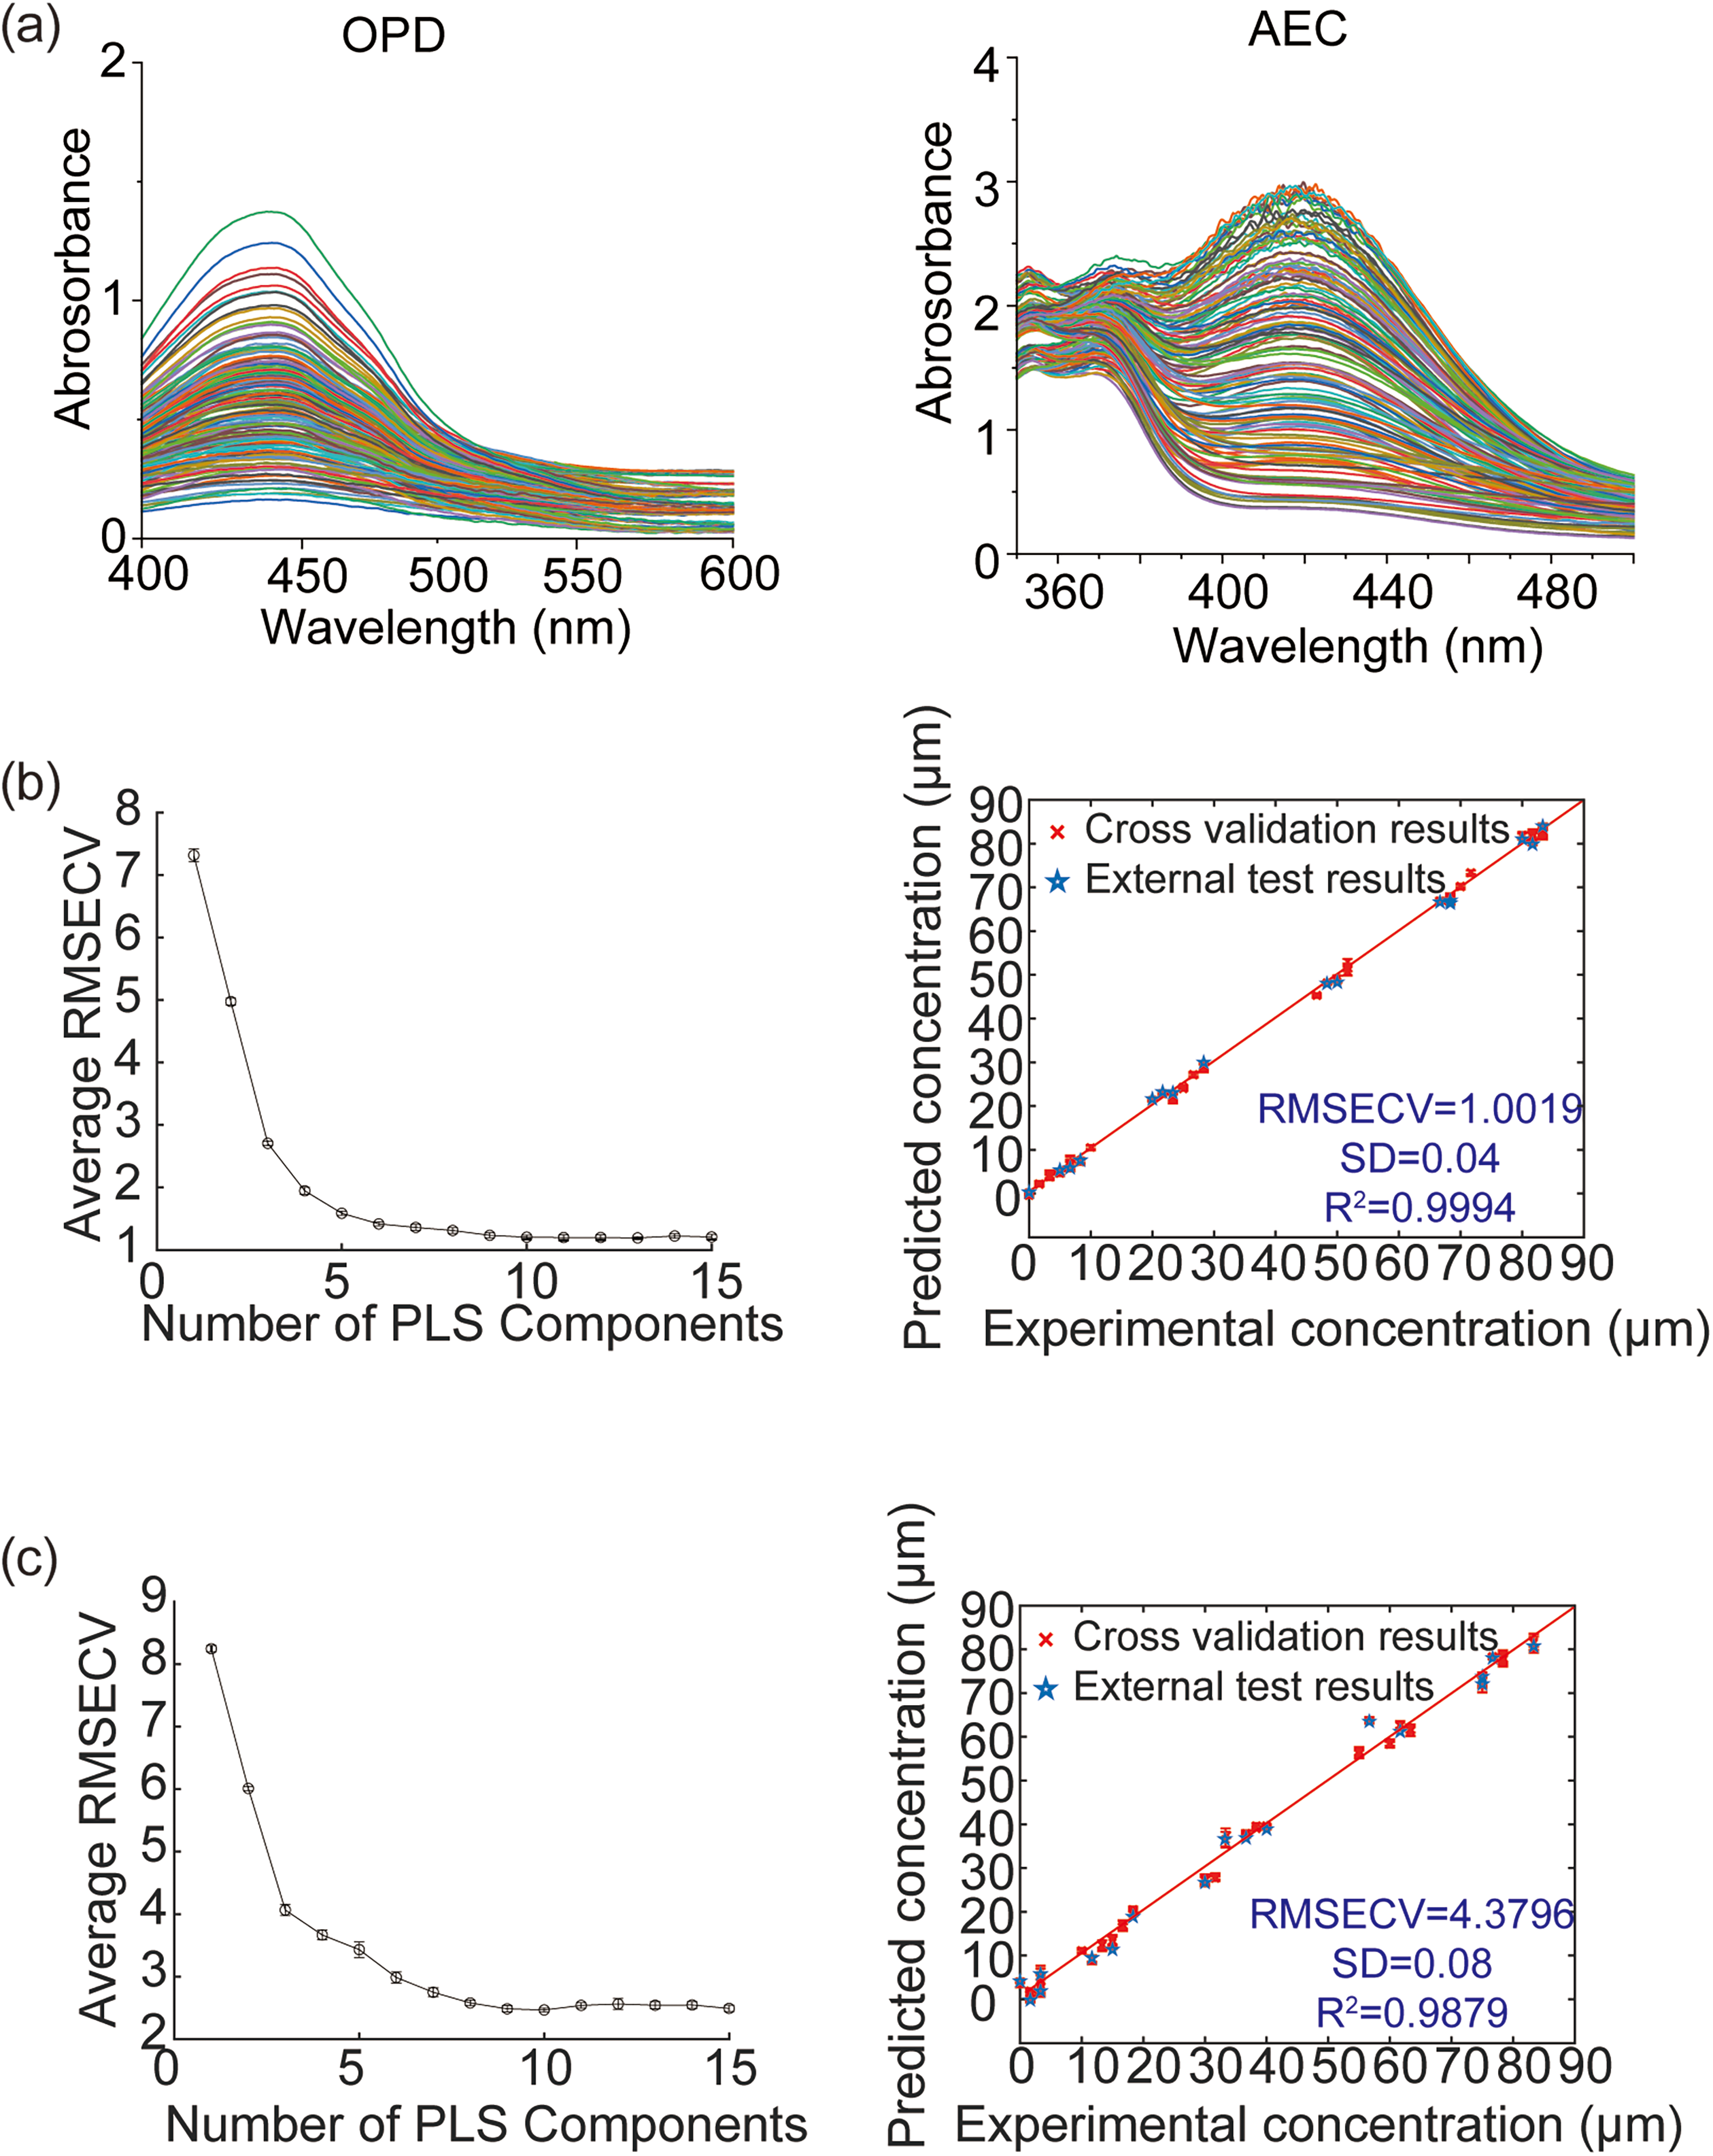
Quantitation analysis of Fe2+/Fe3+ in binary mixtures. (a) The UV–Vis spectra OPD and AEC sensor units for quantitation of binary mixture (Fe2+/Fe3+). (b) The PLS results for Fe2+. (c) The PLS results for Fe3+.
The strategy does not rely on a single, perfectly specific probe. Instead, we employ multiple sensing units (AuNPs-ssDNA complexes tested with different chromogenic substrates like AEC and OPD). While ions like Fe3+ and Cr3+ may produce similar signals in one channel (e.g., the AEC unit), they generate distinct and differential response patterns across the dual-channel. This collective pattern forms a unique “fingerprint” for each ion. To interpret these complex fingerprint patterns and quantitatively determine concentration in potential mixtures, we employed PLS regression modeling. Unlike univariate analysis which looks at a single signal, PLS is a powerful multivariate calibration method that utilizes the entire response profile from all sensor units simultaneously. It is specifically designed to handle correlated data and extract the latent variables that best correlate with the concentration of the target analyte, even in the presence of interfering species that cause similar responses in some channels. The PLS model effectively learns and utilizes the entire unique pattern caused by Fe2+ or Fe3+, differentiating it from the pattern caused by Cr3+ or other ions. Therefore, the perceived similarity in individual channels is not a flaw but a characteristic of the system that is effectively managed and turned into an advantage by the array-based design combined with chemometrics. The combination of a cross-reactive dual-channel and multivariate statistical analysis (PLS) is a well-established paradigm to overcome the limited specificity of individual receptors, enabling accurate quantification in complex environments. Unlike univariate models, PLS is built using UV–Vis spectral data from the dual-channel (AEC and OPD) response. During calibration, the model learns the complete, multidimensional fingerprint of the system, which intrinsically incorporates any minor but consistent systematic effects. Consequently, as long as these effects are reproducible, the model mathematically accounts for and corrects their influence when deconvoluting the signals from unknown mixtures. This ensures that the final predicted concentrations of Fe2+ and Fe3+ reflect the amount of ions participating in the surface-catalyzed reaction with high accuracy and reliability.
Detection of Cellular Ferroptosis
This study aimed to detect the concentrations of Fe2+ and Fe3+ in biological processes, intending to provide a new method for biological research and medical diagnosis. To validate the practical application capability of this method, A549 cells were treated with different concentrations of the ferroptosis inducer GPX4-IN-7 (an indirubin derivative) to simulate varying degrees of cellular ferroptosis. Subsequently, the self-assembled sensor array was used to detect the Fe2+ concentration in the treated cells (Figure 4a), and the established PLS model was employed to predict the total iron ion concentration (Figure 4b). To verify the accuracy of our method, the FerroOrange ferroptosis detection kit was used simultaneously to detect the iron ion concentration in the same cell samples (Figure 5). Spearman correlation analysis (Figure 6) showed a strong concordance (P ≤ 0.001) between the results obtained by our method and those from the FerroOrange kit, indicating the potential applicability of our method in real complex systems. In this study, cell lysates is PBS. Known concentrations of Fe2+ and Fe3+ standards were spiked into the PBS buffer and quantified using our established dual-channel method and PLS calibration models. Recoveries were 101.92 and 99.07% for Fe2+ and Fe3+, respectively. The relative standard deviation (RSD) was 2.34 and 3.01% for Fe2+ and Fe3+, respectively. This data will directly confirm the method's reliability and resistance to matrix effects in complex biological environments.
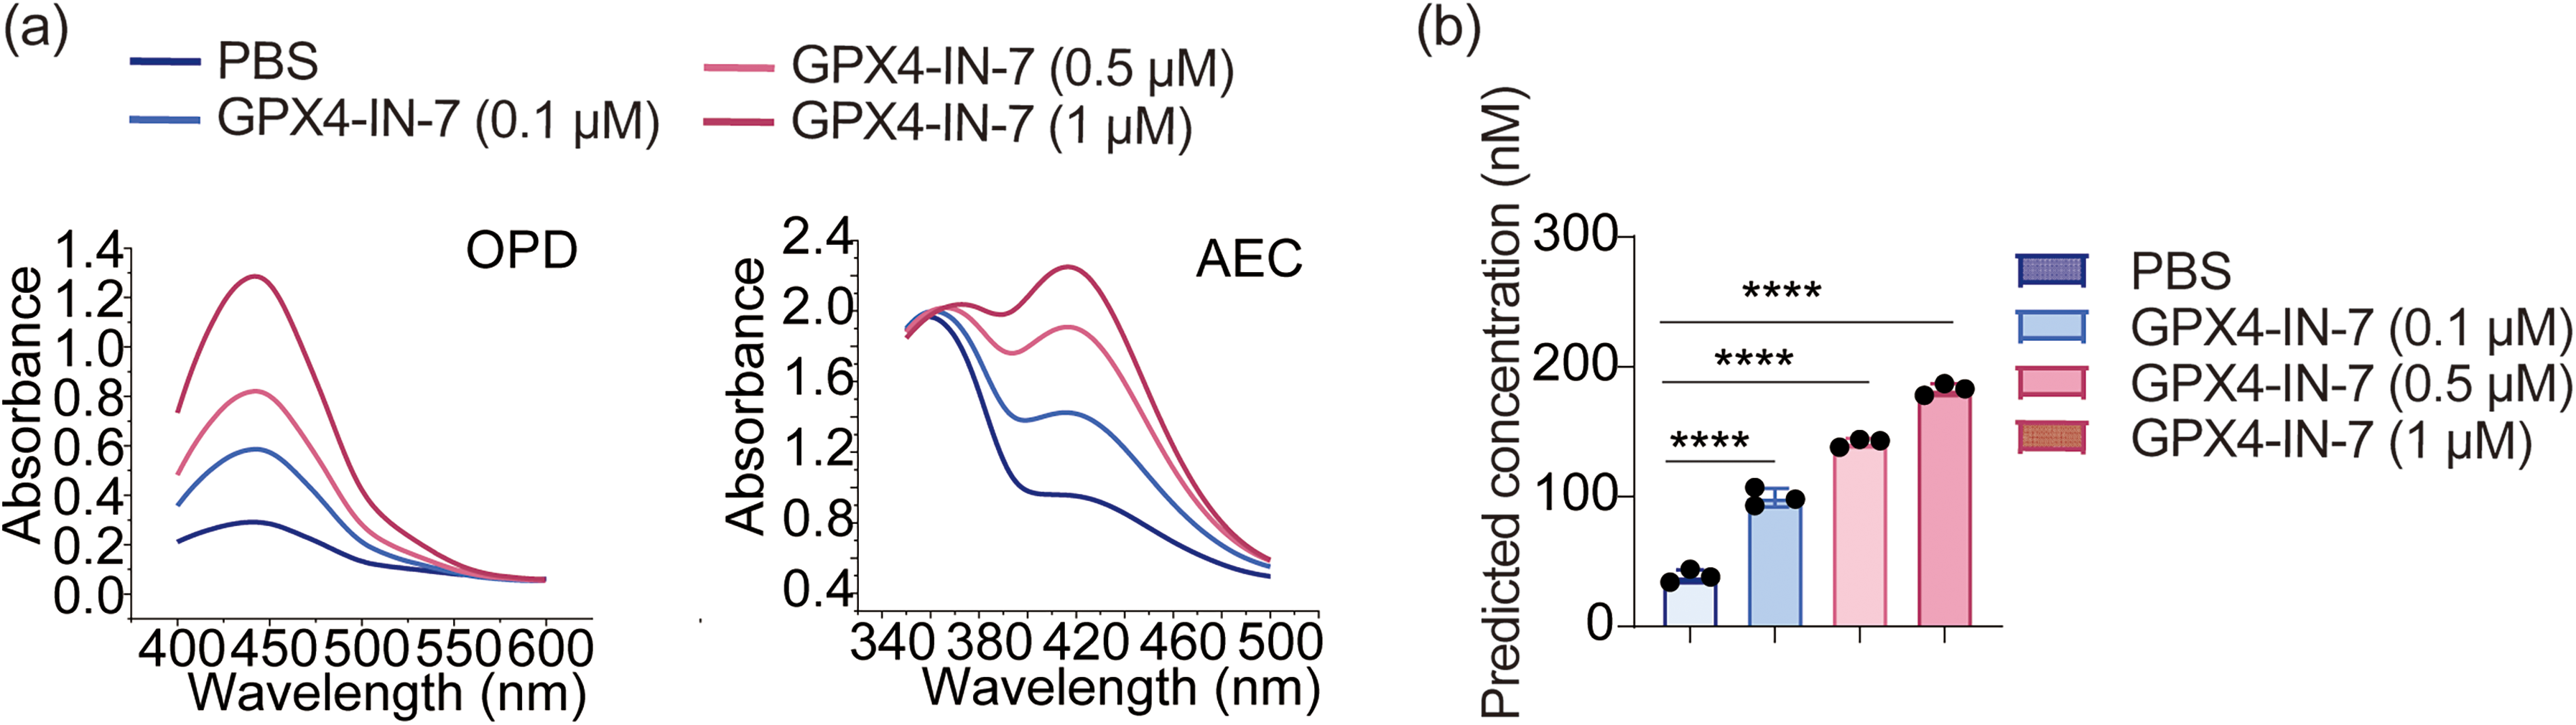
Detection of cellular ferroptosis based on sensor array. (a) The UV–Vis spectra OPD and AEC sensor units for detection of Fe2+. (b) The PLS predicted results for Fe2+.
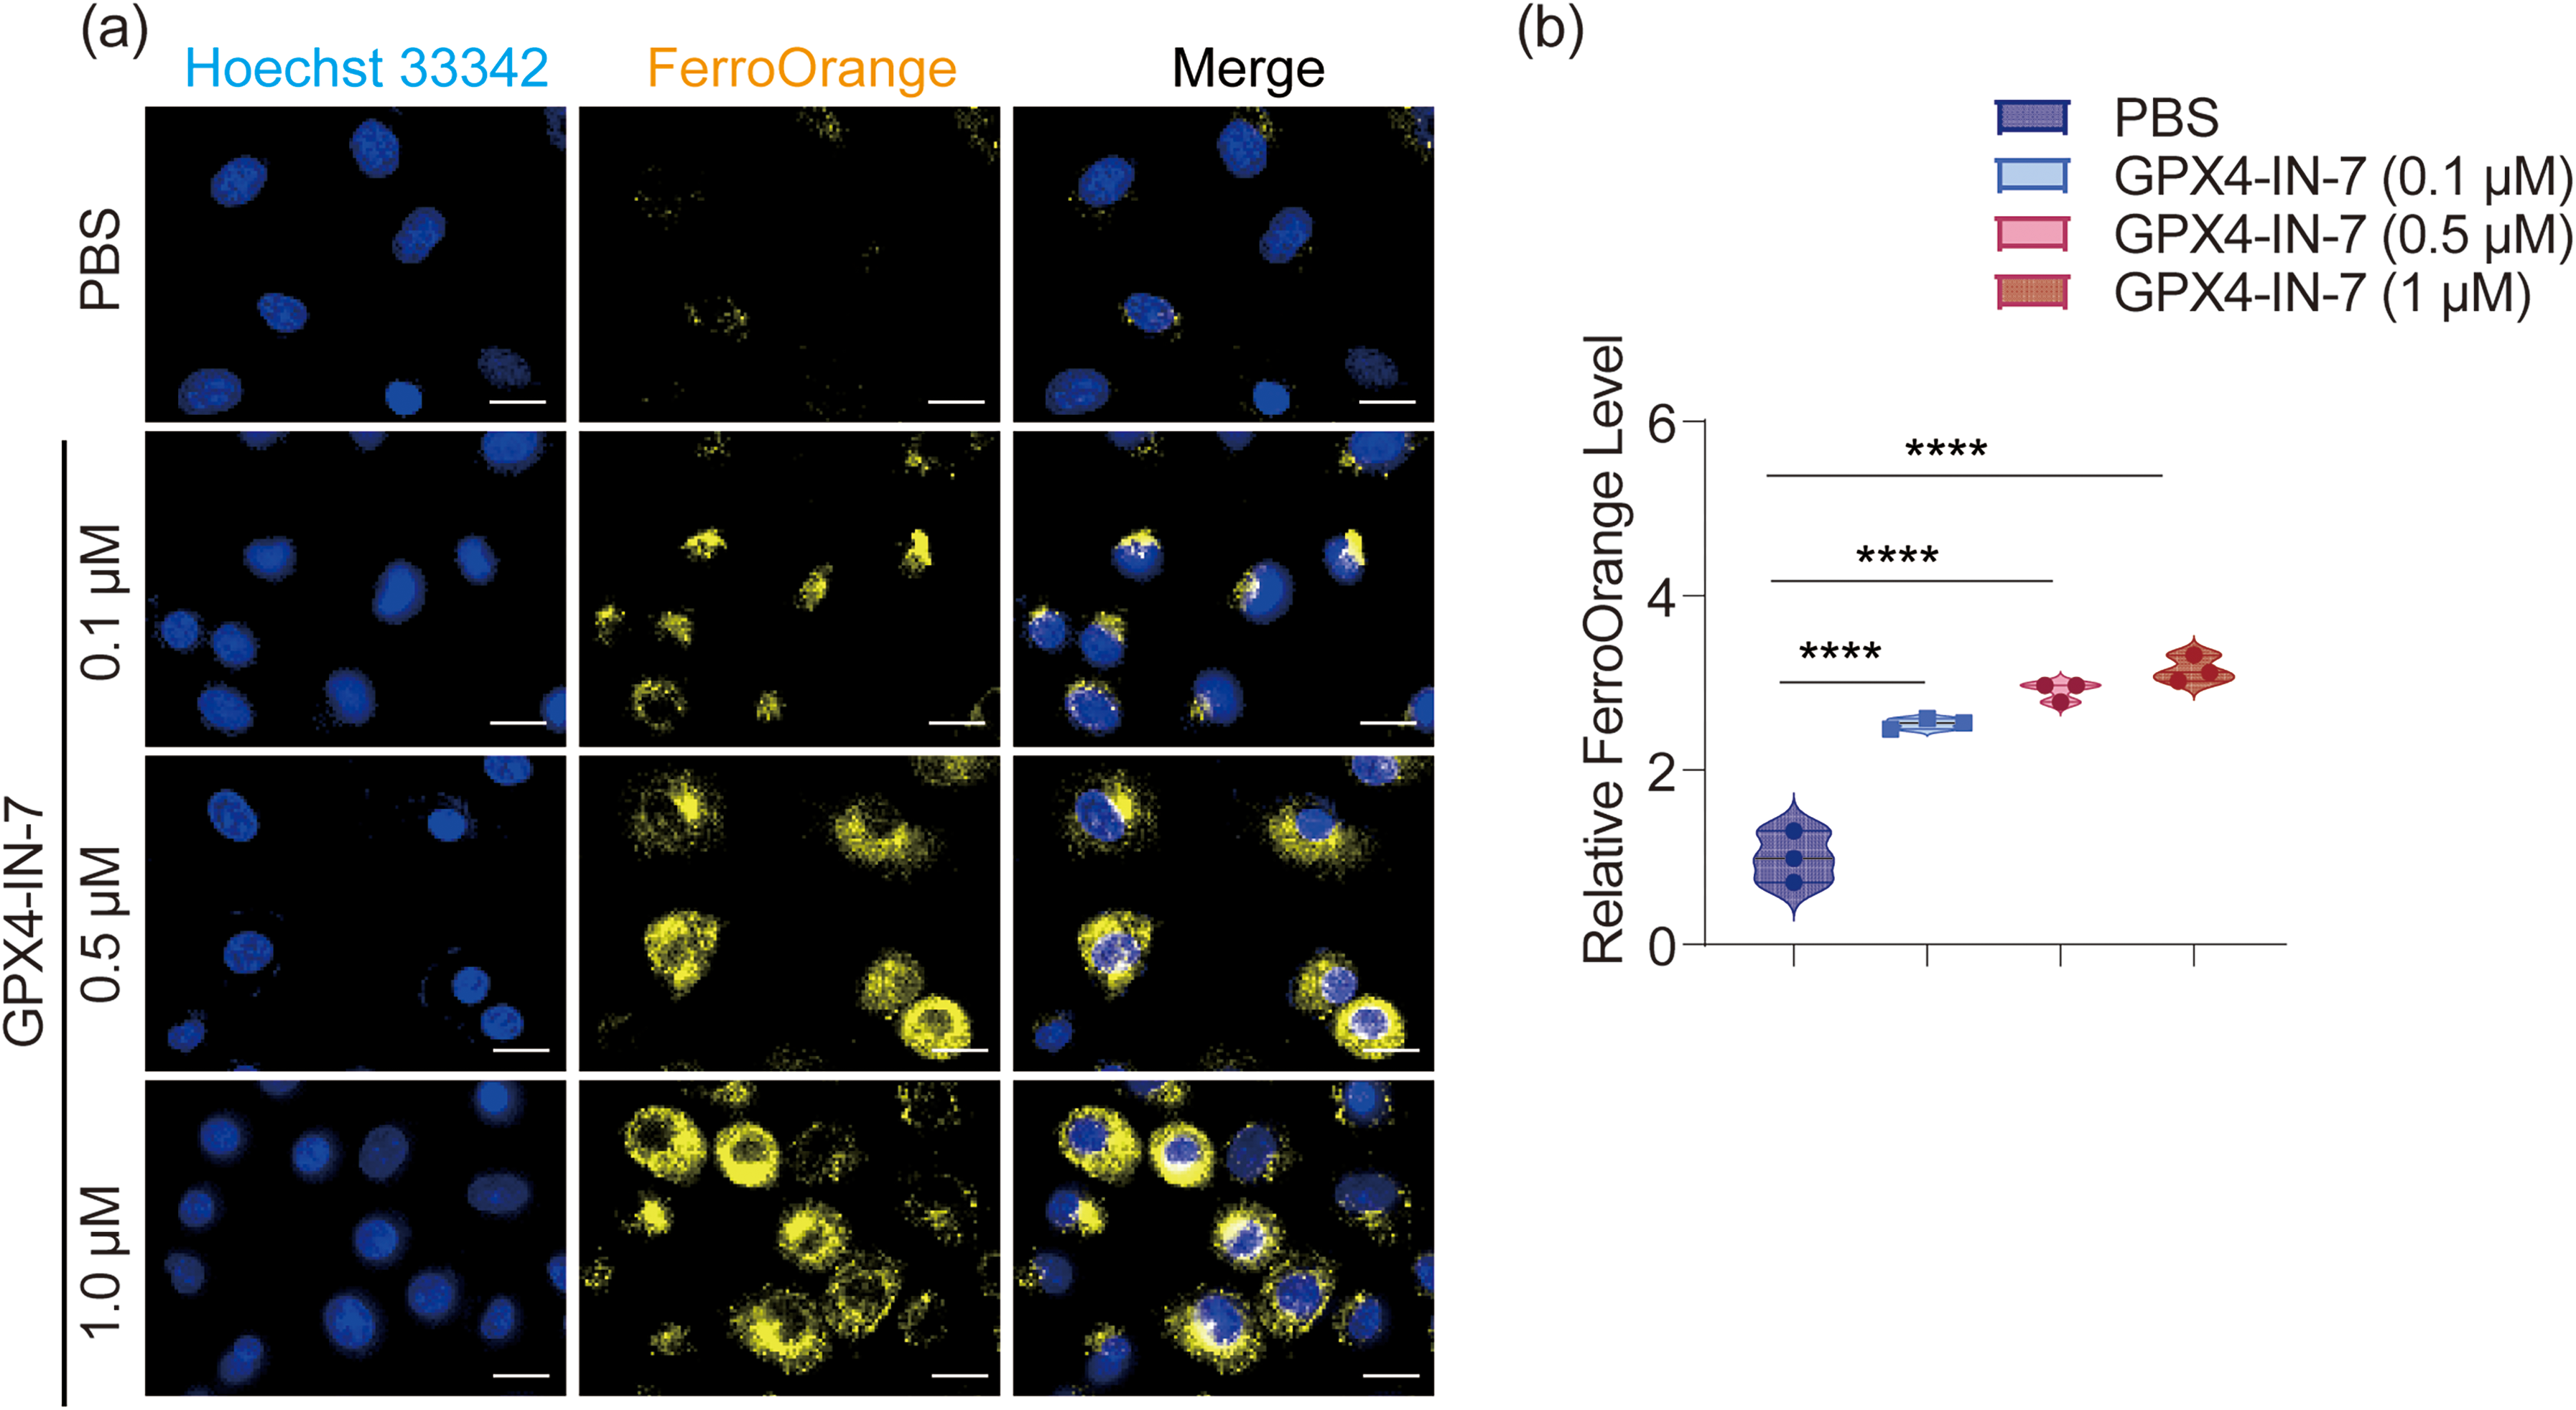
Detection of cellular ferroptosis based on FerroOrange ferroptosis detection kit. (a) Fluorescence of Hoechst 33342 (to stain nuclei, blue), FerroOrange (Fe2 + in the cell, yellow), Scale: 10 μm. (b) Relative FerroOrange level.
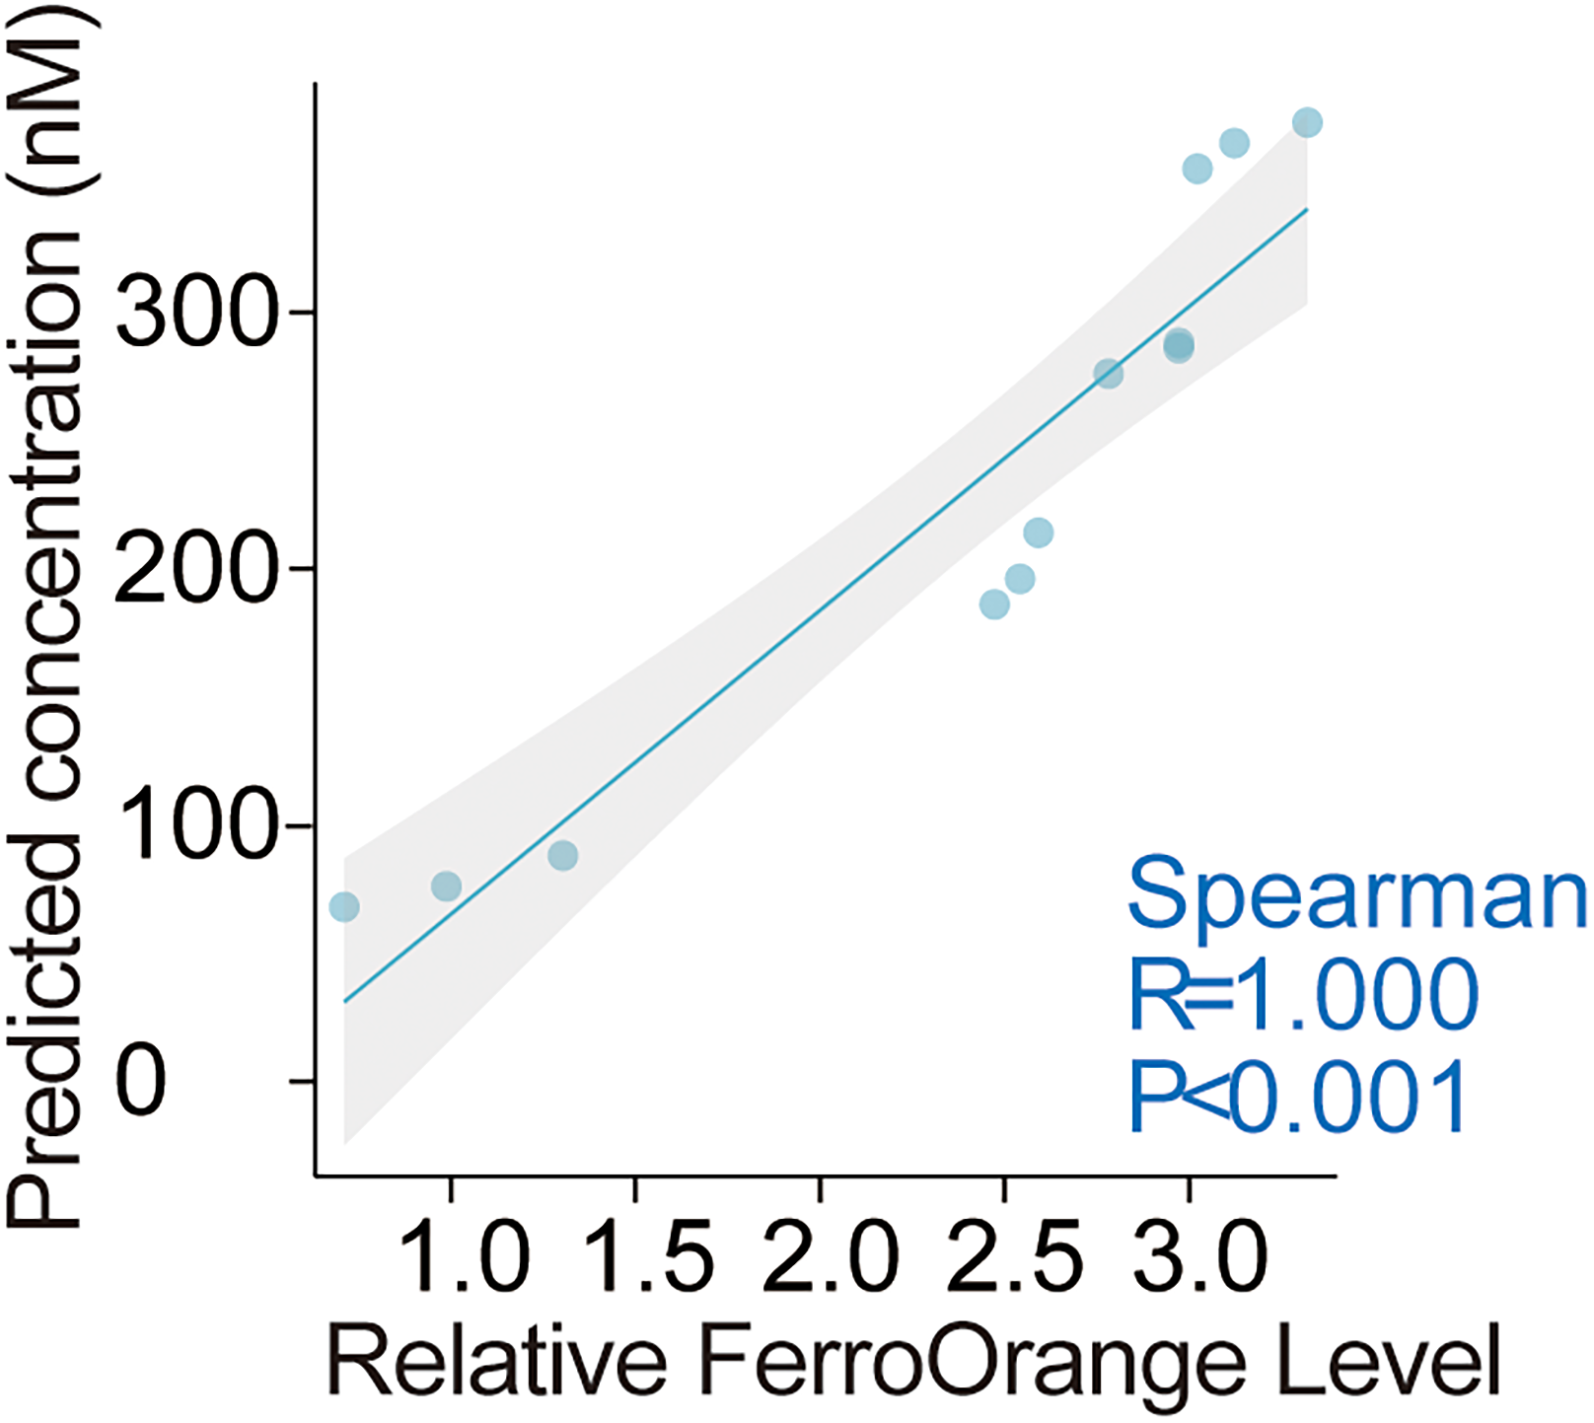
Analysis of the concordance between the sensor array and FerroOrange ferroptosis detection kit.
Conclusion
This study successfully developed a colorimetric sensor array based on the peroxidase-mimicking activity of AuNPs for the specific discrimination and quantitative detection of Fe2+ and Fe3+. The core principle of the method lies in the ion-specific modulation of AuNPs’ enzymatic activity by Fe2+ and Fe3+, and the differential colorimetric fingerprints generated by the dual-substrate array. Experiments demonstrated that the method has a wide linear detection range and can predict ion concentrations in unknown samples using a PLS model. More importantly, the method showed good accuracy and reliability in detecting complex biological samples simulating cellular ferroptosis, with results highly consistent with those from standard detection methods. Therefore, this research provides a new and effective method for iron ion detection in biological processes and medical diagnostics.
Supplemental Material
sj-docx-1-asp-10.1177_00037028261460904 - Supplemental material for Quantitative Analysis of Cellular Ferroptosis Using Dual-Channel Colorimetry Based on Gold Nanoparticle Catalytic Activity
Supplemental material, sj-docx-1-asp-10.1177_00037028261460904 for Quantitative Analysis of Cellular Ferroptosis Using Dual-Channel Colorimetry Based on Gold Nanoparticle Catalytic Activity by Lijuan Huang, Meiqi Liu, Qian Zhang, Ting Yang, Yujia Wu, Dong Yan, Changqi Xu, Dingyi Liu, Jie Yu and Chenghao Chen in Applied Spectroscopy
Footnotes
Acknowledgments
We would like to express our sincere gratitude to Professor Yizhuang Xu from Peking University for the kind invitation to contribute to this special issue. This work was financially supported by the Beijing Municipal Health Commission through the “High Innovation Plan - Qingmiao Project” (Grant No. G202521141) and Beijing Municipal Health Commission through the “Excellent Clinical Research Plan of Research Wards” (Grant No. BRWEP2024W102090106).
CRediT Author Statement
Lijuan Huang and Meiqi Liu contributed equally to this article.
Funding
This work was supported by the Beijing Municipal Health Commission through the Excellent Clinical Research Plan of Research Wards (Grant No. BRWEP2024W102090106) and Beijing Municipal Health Commission through the High Innovation Plan-Qingmiao Project (Grant No. G202521141).
Declaration of Conflicting Interests
The author(s) declared no potential conflicts of interest with respect to the research, authorship, and/or publication of this article.

Supplemental Material
All supplemental material mentioned in the text accompanies this paper online.
References
Supplementary Material
Please find the following supplemental material available below.
For Open Access articles published under a Creative Commons License, all supplemental material carries the same license as the article it is associated with.
For non-Open Access articles published, all supplemental material carries a non-exclusive license, and permission requests for re-use of supplemental material or any part of supplemental material shall be sent directly to the copyright owner as specified in the copyright notice associated with the article.
