






Abstract
The step-growth polymerization of 1,4-butanediol with 4,4′-diphenylmethanediisocyanate (MDI) was monitored in situ by fiber-coupled attenuated total reflection Fourier transform infrared (ATR FT-IR) spectroscopy between 40 and 70 °C. In contrast to previous kinetic and two-dimensional correlation spectroscopy (2D-COS) studies of this system, the present work applies multivariate curve resolution alternating least squares (MCR-ALS) to temperature-dependent spectral data. The method enables decomposition of overlapping urethane-related bands and extraction of concentration profiles for chemically and physically distinct species, including dissolved and precipitated polymer phases. The MCR-ALS results are consistent with previously reported kinetic trends while providing additional quantitative insight into transient species and phase evolution. These findings demonstrate the added value of multivariate analysis for the concise interpretation of complex polymerization processes.
This is a visual representation of the abstract.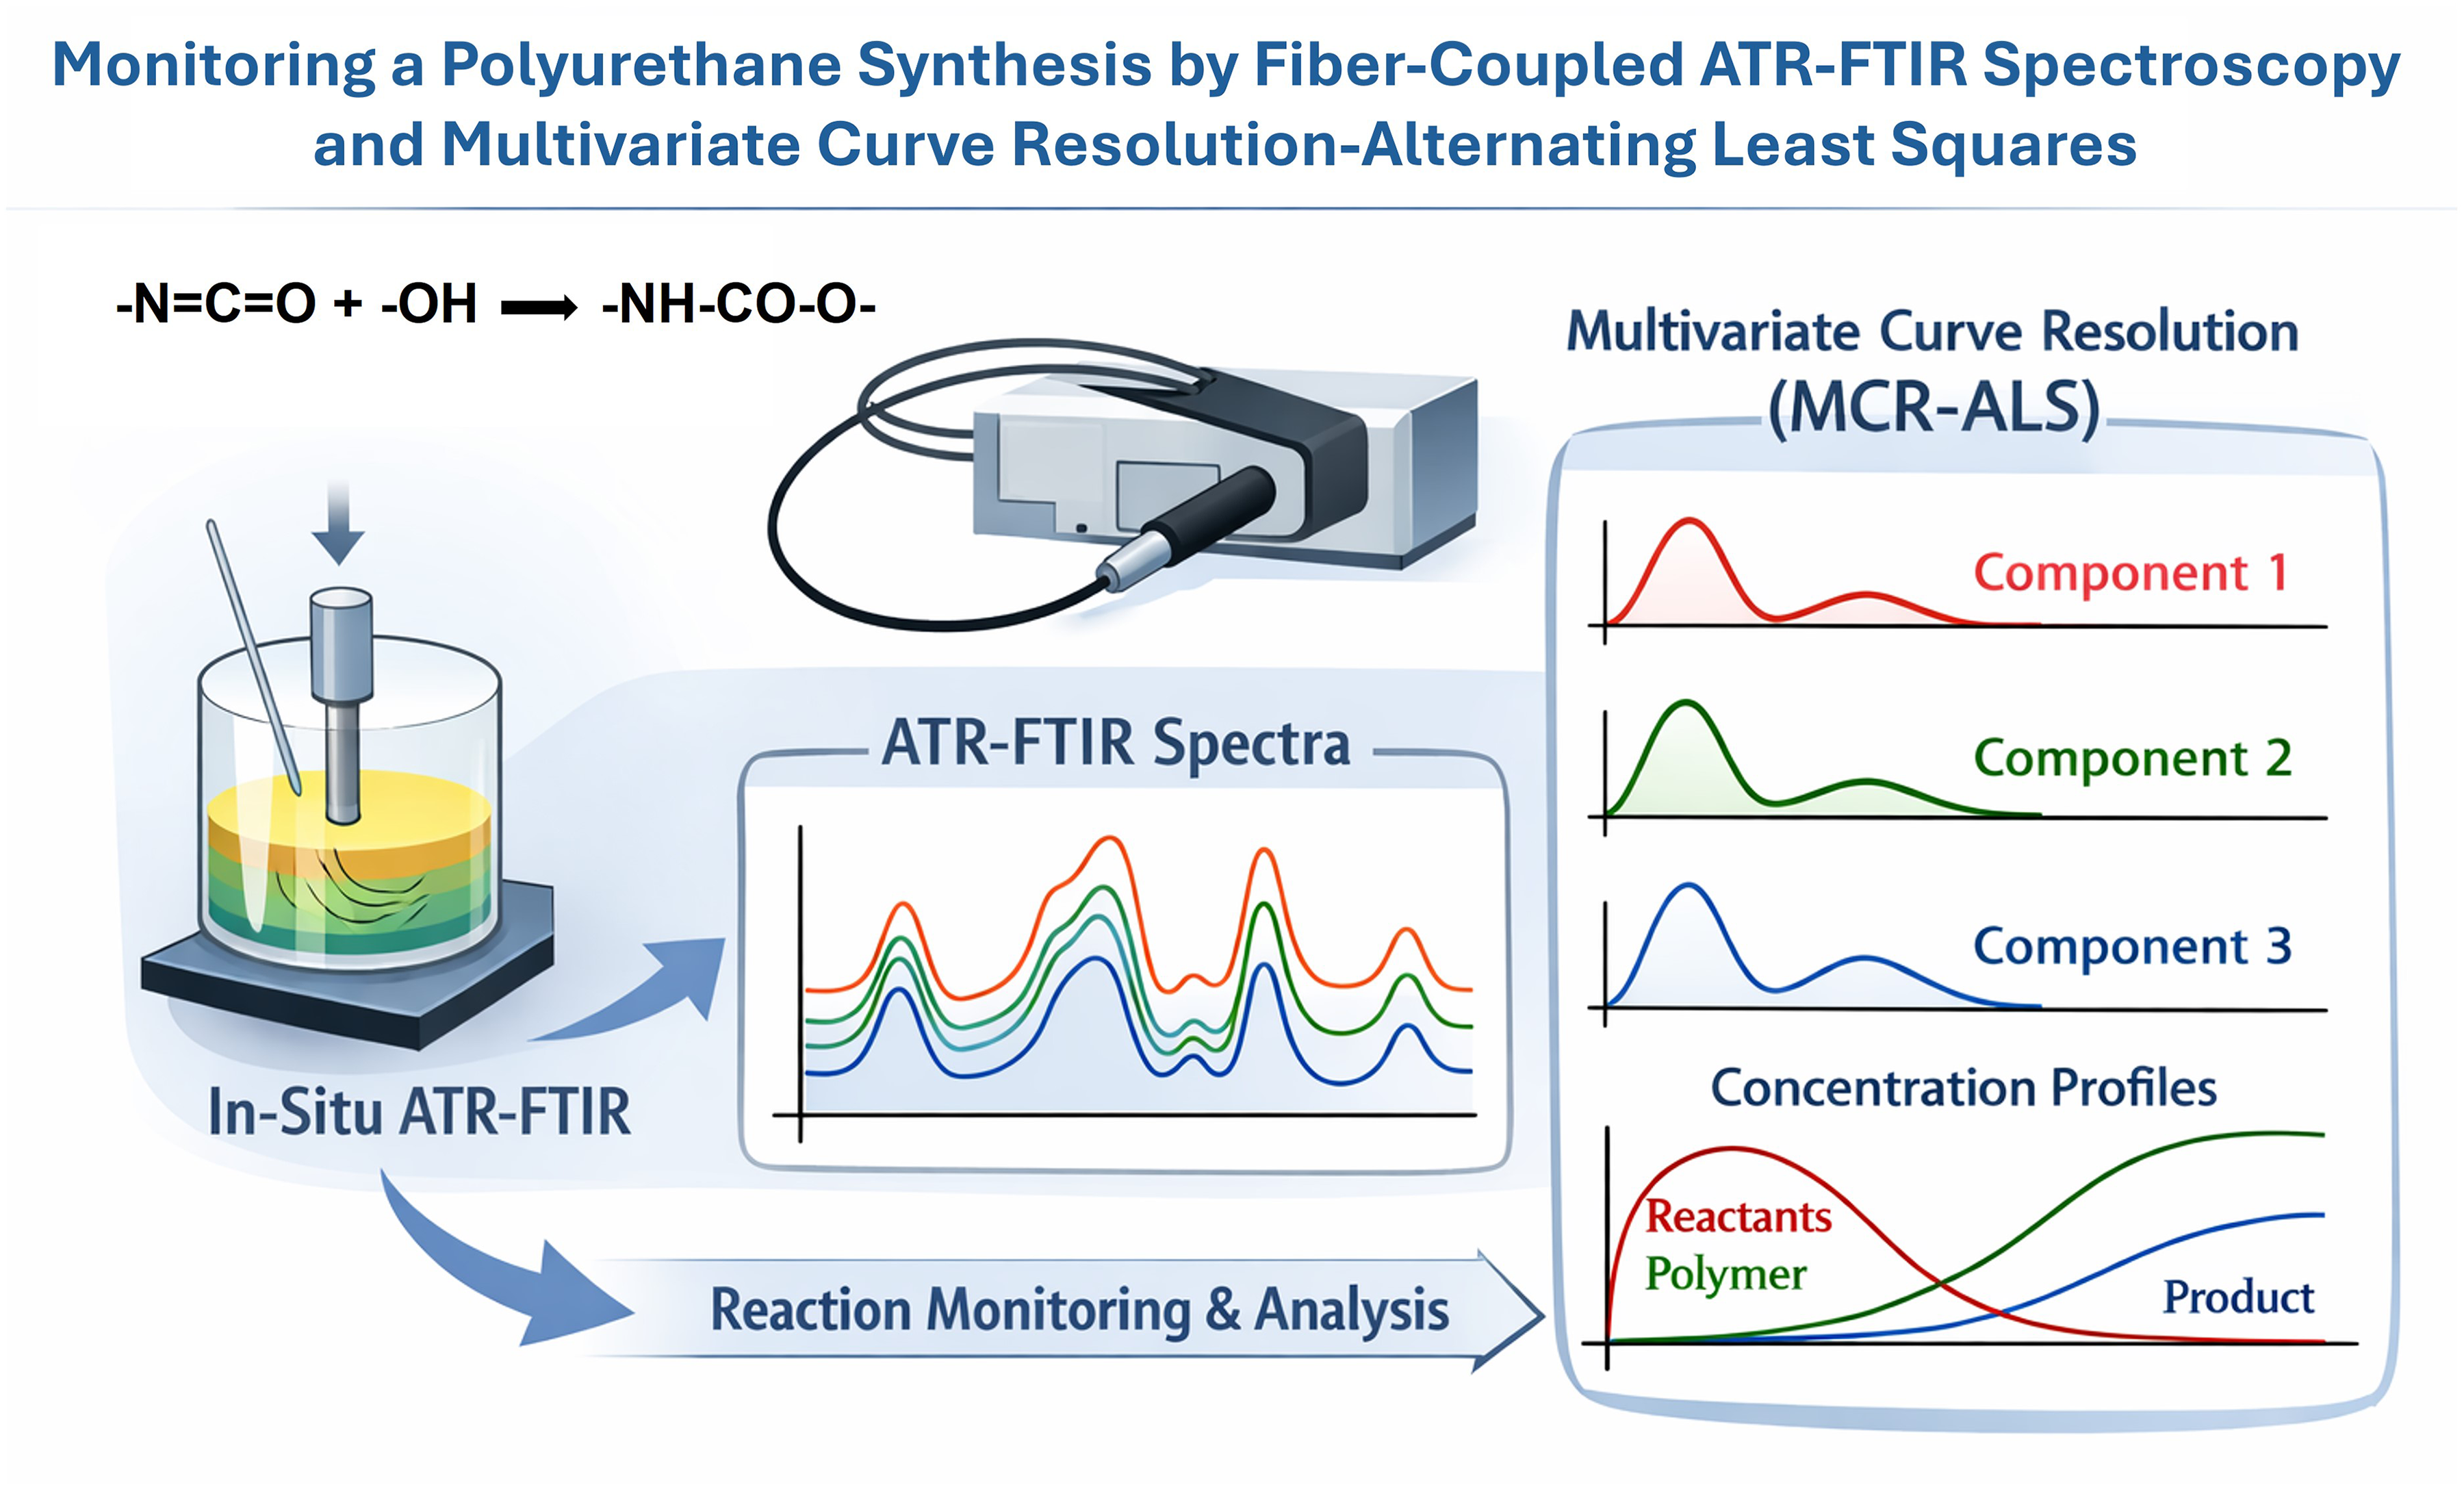
Keywords
Introduction
Polyurethanes constitute an important class of functional polymers used in coatings, elastomers, adhesives, and foams owing to their tunable mechanical and chemical properties. They are commonly synthesized via step-growth polymerization of diisocyanates with diols or polyols. Among model systems, the reaction of 4,4′-diphenylmethanediisocyanate (MDI) with 1,4-butanediol (BDO) (Figure 1) has been extensively investigated as it yields linear urethane structures with well-defined chemistry.1,2
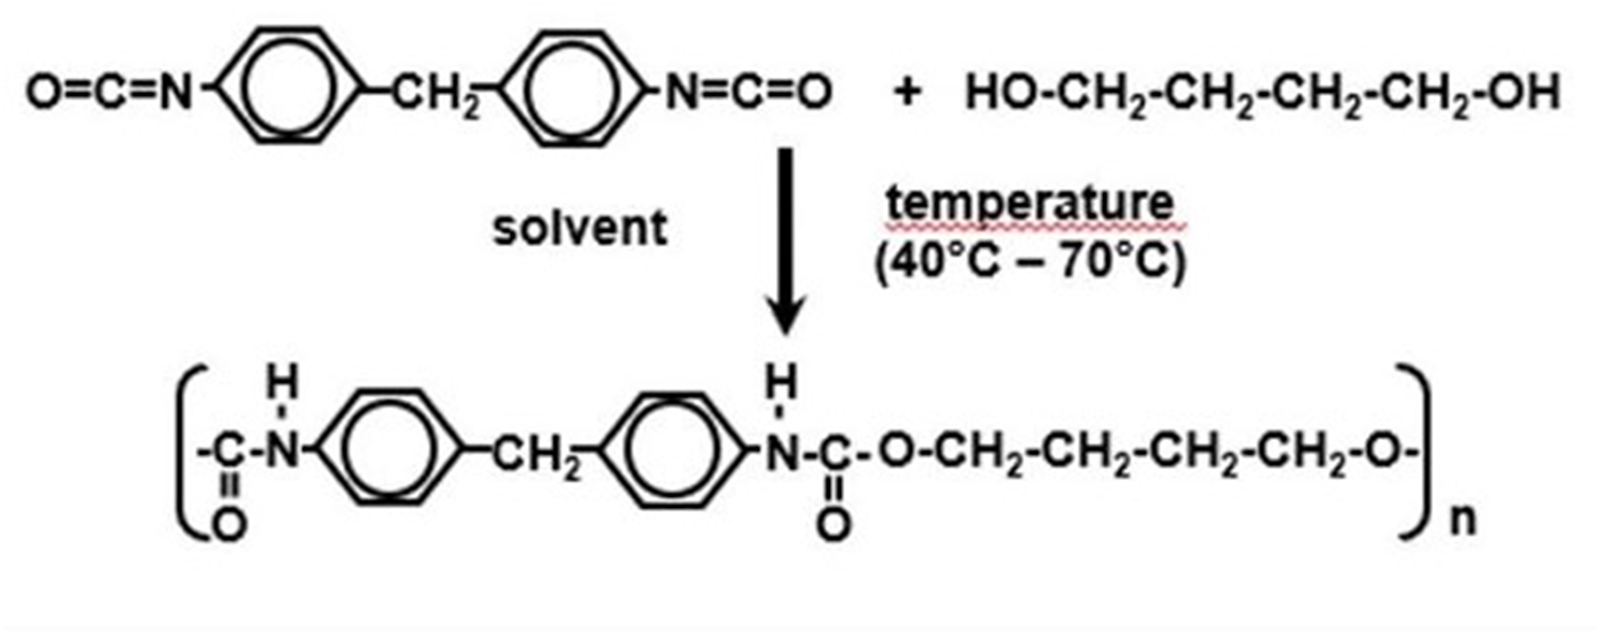
Reaction scheme for the step-growth polymerization of 4,4′-diphenylmethane-diisocyanate (MDI) with 1,4-butanediol (BDO) yielding linear polyurethane chains.
Real-time spectroscopic monitoring is essential for understanding polymerization kinetics and structure development. Attenuated total reflection Fourier transform infrared (ATR FT-IR) spectroscopy allows direct observation of isocyanate consumption and urethane formation, but quantitative interpretation is complicated by overlapping absorption bands and temperature-dependent band shifts, particularly in the carbonyl region.3–5 Previous analyses of the same temperature-dependent ATR FT-IR data sets demonstrated that kinetic parameters can be derived from band integration and employed two-dimensional correlation spectroscopy (2D-COS) and perturbation-correlation moving-window 2D (PCMW2D) analysis to elucidate hydrogen-bonding sequences and phase transitions during polymerization.6–8 While these methods provide high spectral resolution and qualitative sequence information, they do not yield concentration profiles of the evolving species. The present work therefore applies multivariate curve resolution (MCR-ALS) to the same data to complement correlation-based findings with quantitative concentration-based descriptors. Notwithstanding the specific advantages of MCR-ALS, the contour maps of the 2D-COS analysis are exemplarily represented for the 70 °C experiment in order to provide the reader a direct comparison of these evaluation techniques.
MCR-ALS enables decomposition of complex spectral matrices into pure-component spectra and associated concentration profiles without explicit band assignment or kinetic models.9–12 Here, MCR-ALS is used to (i) reduce spectral redundancy, (ii) resolve overlapping urethane-related features, and (iii) quantitatively describe the evolution of dissolved and precipitated polymer species. By integrating MCR-ALS with earlier kinetic and 2D-COS results, a robust description of the polyurethane formation process is obtained.
Experimental
Materials and Reaction Conditions
4,4′-Diphenylmethanediisocyanate (98.2%, Bayer Materials Science, Germany) and 1,4-butanediol (99%, Thermo Fisher GmbH, Germany) were used as received. Polymerizations were carried out in solution using a 1:1 (by volume) mixture of diethylene glycol dimethyl ether (diglyme)(99%, Thermo Fisher GmbH, Germany) and chloroform (99.8%, Fisher Scientific GmbH, Germany) as solvent. Chloroform was stabilized by amylene (2-methyl-1-butene) to avoid side reactions with isocyanate groups. Reactions were conducted at 40, 50, 60, and 70 °C under magnetic stirring, as described previously. 8
ATR FT-IR Measurements
Spectra were recorded using a Bruker IFS-28 FT-IR spectrometer equipped with a liquid-nitrogen-cooled mercury–cadmium–telluride (MCT) detector and coupled to a diamond ATR probe via silver-halide fibers (Figure 2). 13 Spectra were collected continuously in 2.5-min intervals over the full polymerization time, varying between 120 min (at 40 °C) and 60 min (at 70 °C). The spectra were acquired with a spectral resolution of 4 cm–1 and 128 scans were accumulated.
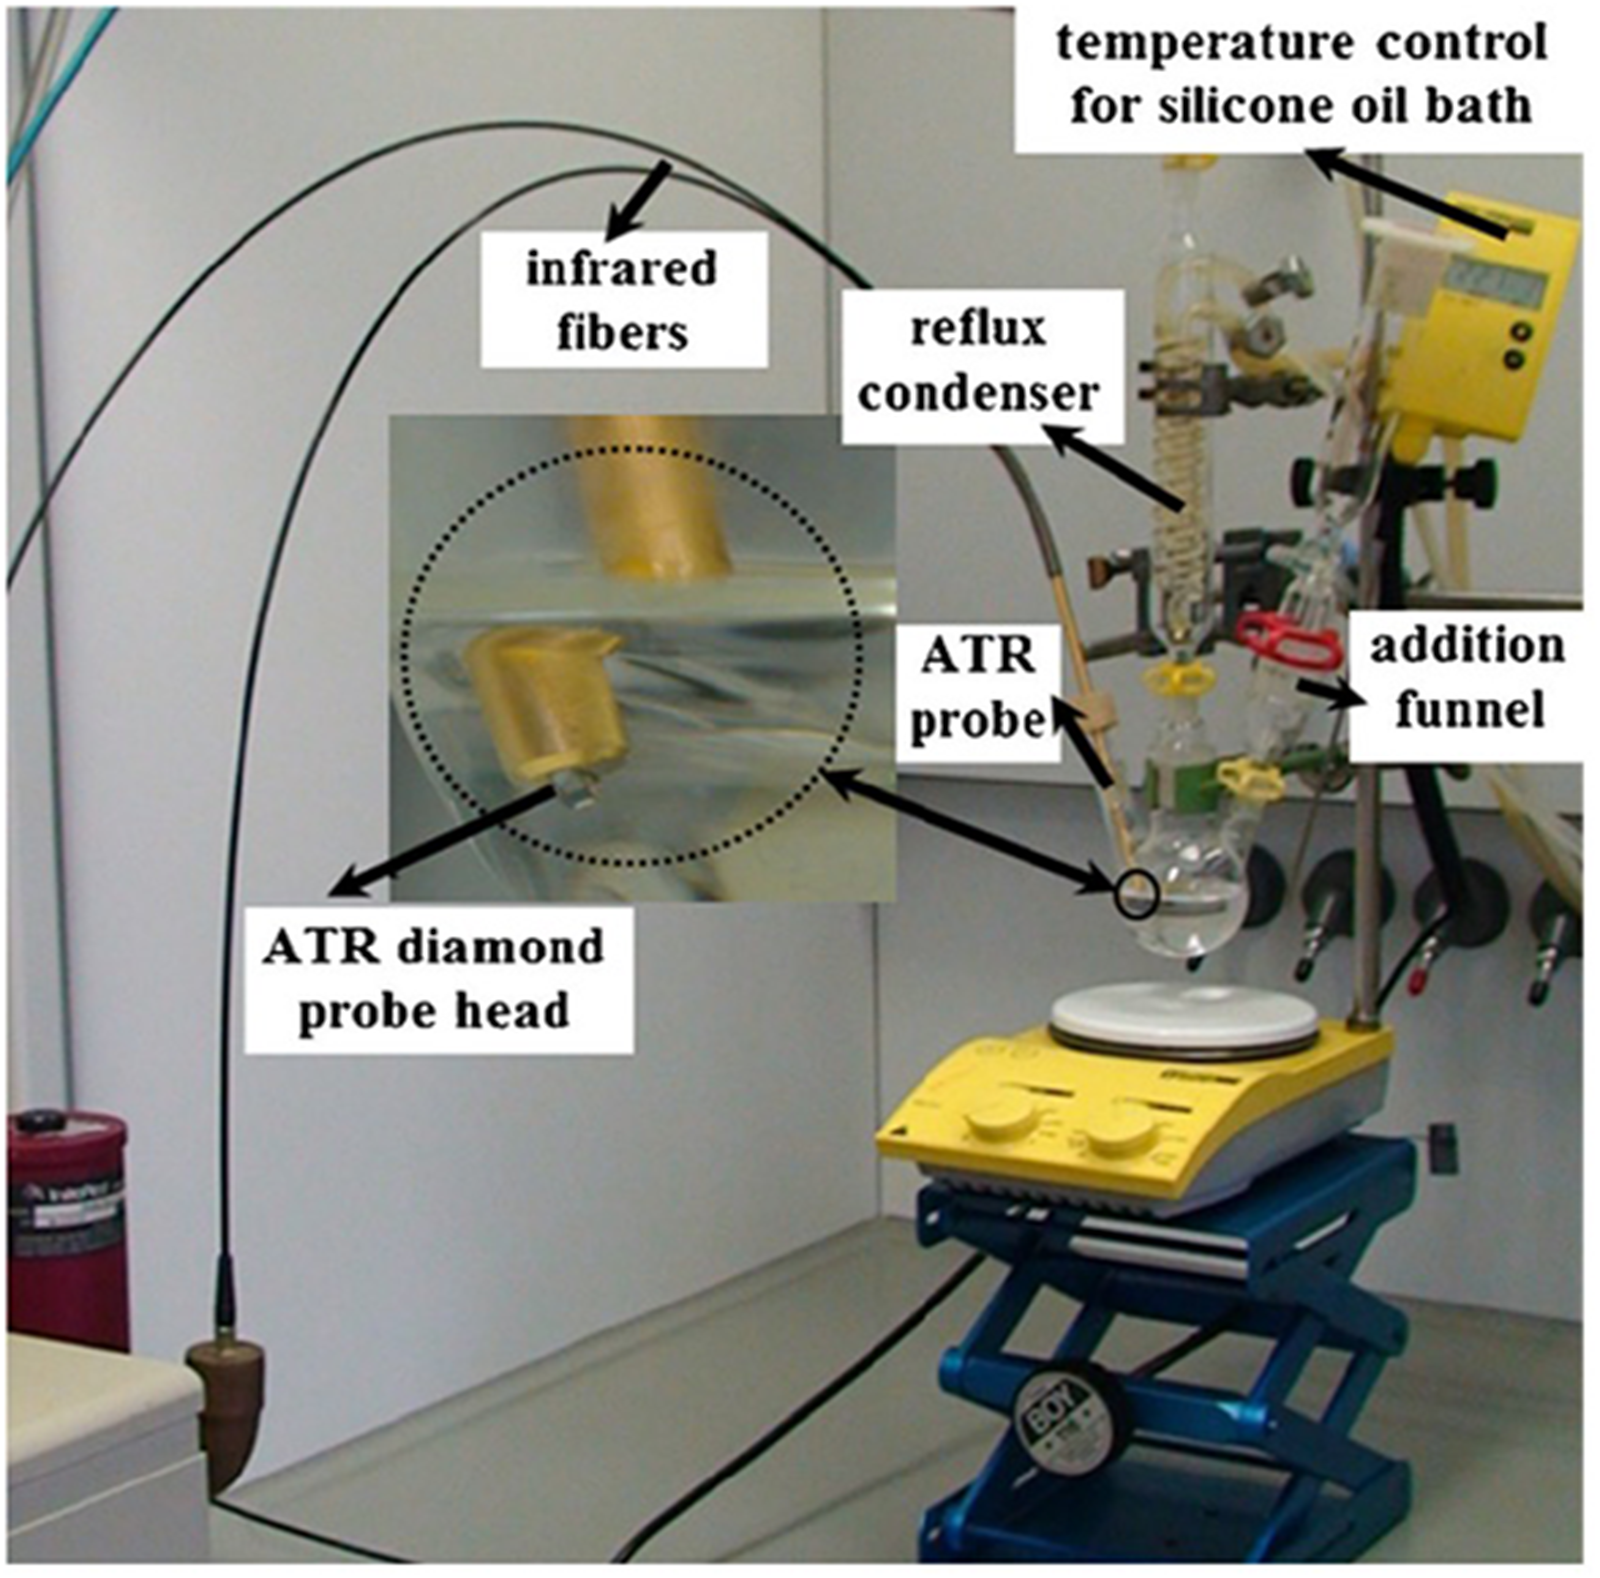
Experimental setup for in-situ monitoring of the polyurethane polymerization by fiber-coupled ATR FT-IR spectroscopy using a diamond ATR probe connected via silver-halide infrared fibers.
Results and Discussion
Spectral Evolution and Kinetic Background
In Figure 3 (top), the ATR FT-IR spectra recorded during polymerization at 70 °C are shown. However, due to the low signal-to-noise ratio (S/N) in the absorption range of the diamond reflection element (1900–2400 cm−1) for kinetic evaluation, Savitzky–Golay smoothing (nine points, third-order polynomial) was applied to improve the S/N (Figure 3, bottom). 8
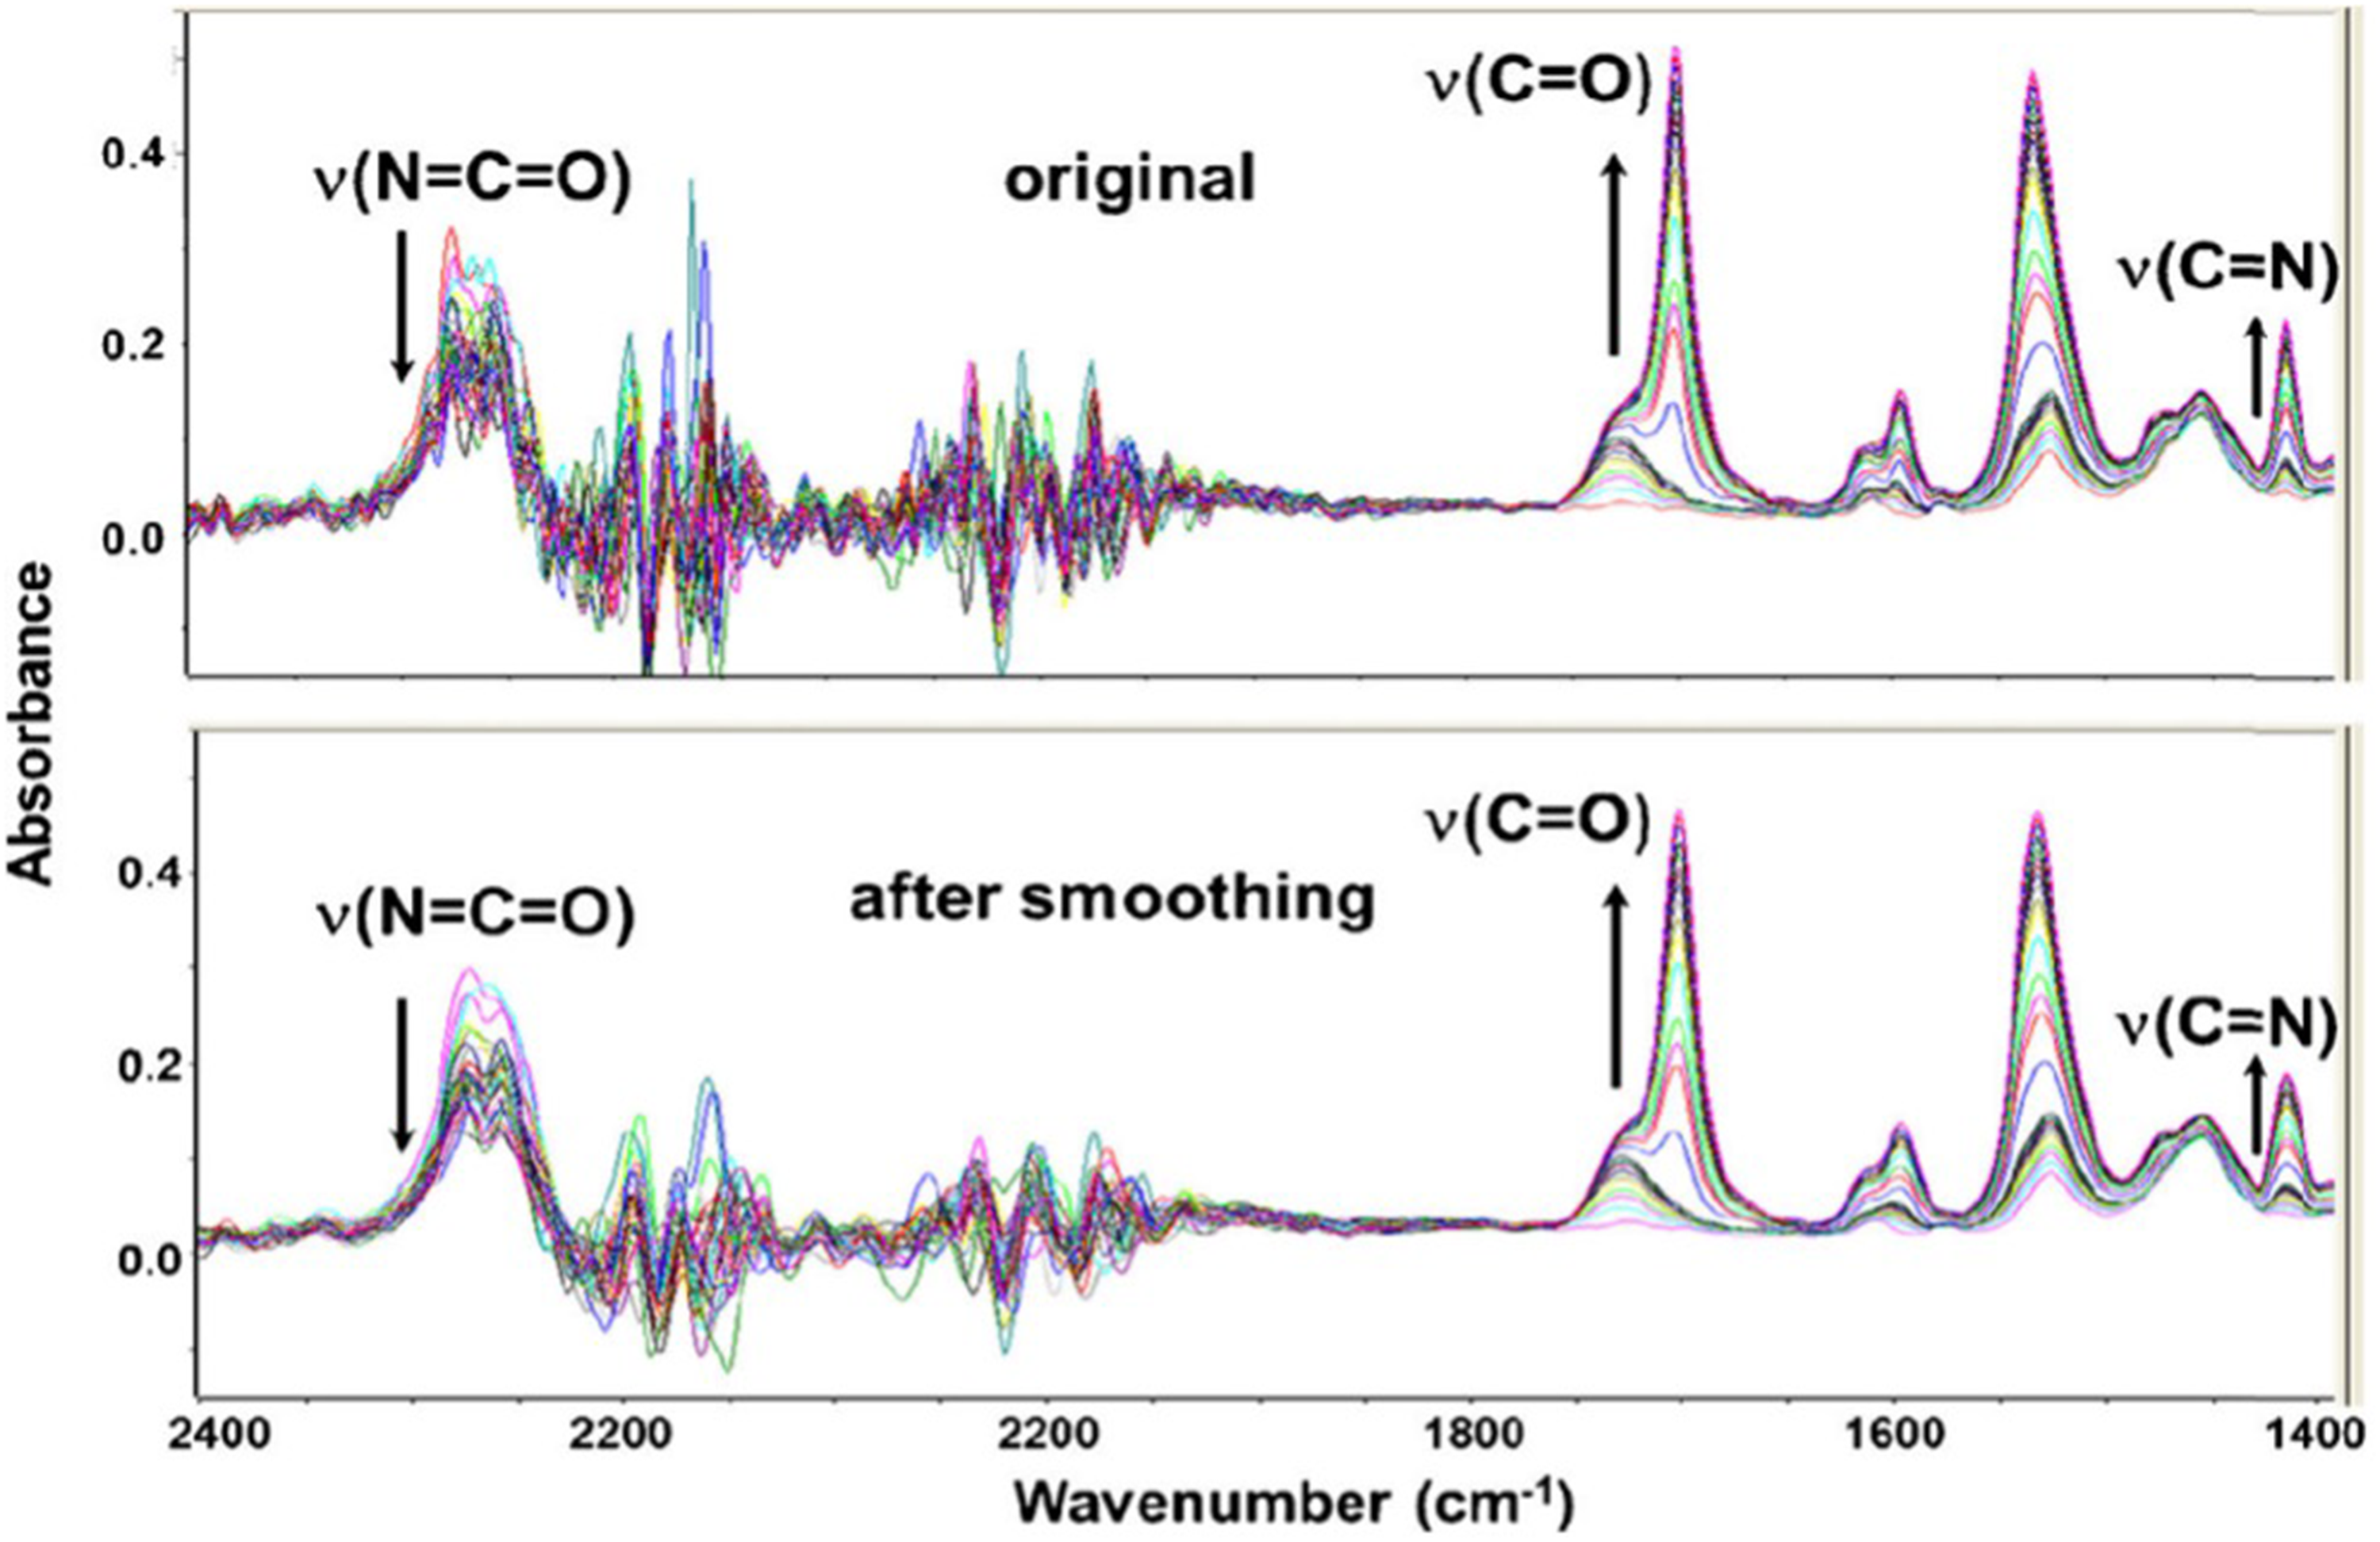
Representative ATR FT-IR spectra recorded during polyurethane polymerization at 70 °C, showing the evolution of urethane-specific absorption bands (top) and effect of Savitzky–Golay smoothing applied to improve the S/N ratio for subsequent kinetic analysis.
Consistent with earlier reports,7,8 polymerization is characterized by a decrease of the ν(N = C = O) absorption near 2270 cm–1 and a concomitant increase of urethane-specific bands, notably the ν(C=O) stretching vibration (1750–1700 cm–1), the amide II band (1550–1500 cm–1), and an absorption at ∼1411 cm–1 attributed to a ν(C = N) vibration of a resonance structure involving the aromatic ring. At advanced reaction stages, pronounced band shifts and intensity changes indicate precipitation and crystallization of the polymer. These effects accelerate with increasing temperature and complicate conventional band-integration approaches, although reliable second-order rate constants and an activation energy of 35.98 kJ mol–1 were previously obtained. 8
2D-COS Analysis
Prior to the analyses, the FT-IR spectra were baseline-corrected in the wavenumber range 1760–1400 cm–1. Then, the series of FT-IR spectra measured at the different experimental temperatures were converted to comma-separated value (.csv) format files and subsequently integrated into one csv file according to the requirement of the 2Dshige software (http://sci-tech.ksc.kwansei.ac.jp/∼ozaki/) that was used for the 2D-COS analysis. In Figure 4 the synchronous and asynchronous 2D correlation maps (contour level 8) of the spectra series measured during the total observation period at 70 °C are shown. While only positive cross-peaks are observed in the synchronous map (1700/1535, 1700/1413, and 1535/1413) positive and negative cross-peaks occur in the asynchronous map: (i) 1727/1699(+), (ii) 1535/1523(−), (iii) 1727/1535(+), (iv) 1699/1523(−), (v) 1727/1411(+), and (vi) 1699/1411(−). Thus, the synchronous map reflects the correlated intensity increase of the polymer-specific ν(C = O), ν(C-N) + δ(NH), and 1413 cm–1 bands with progressing polymerization. The positive and negative cross-peaks of the asynchronous map on the other hand provide information on the sequential changes and improved spectral resolution. The bands at 1727 and 1523 cm−1 that can be assigned to weakly hydrogen-bonded polymer in solution evolve before the 1411 cm−1 absorption band that represents the resonance structure of the urethane functionality whereas the 1699 and 1535 cm−1 bands of the strongly hydrogen-bonded solid polymer evolve last: 1727, 1523 < 1411 < 1699, 1535 (< means changing before).
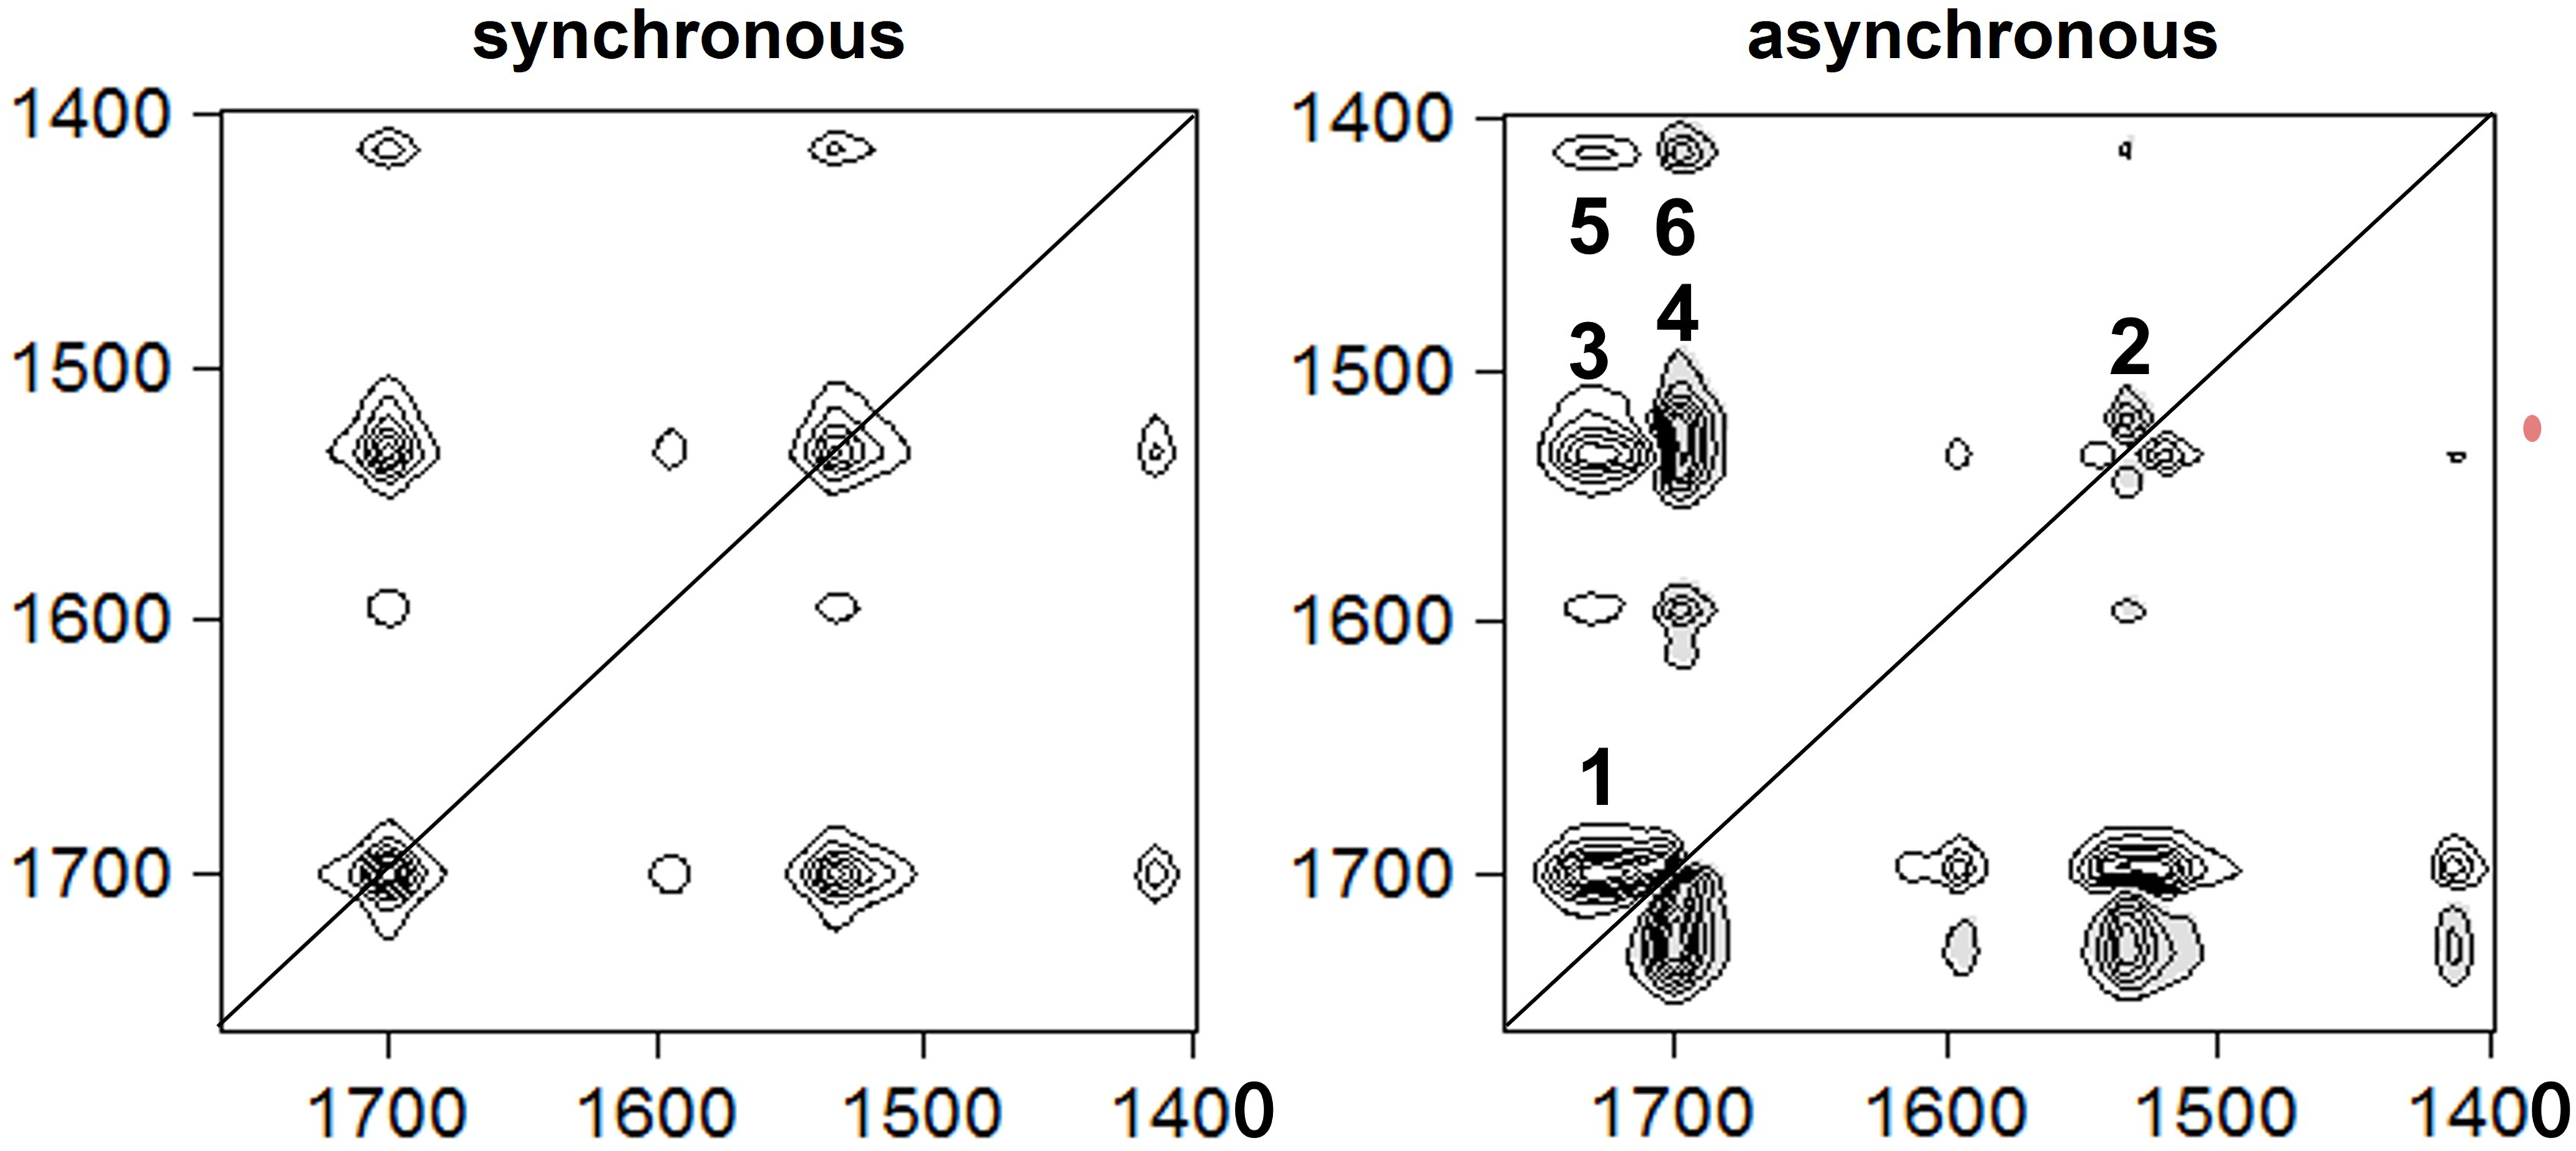
Synchronous and asynchronous 2D correlation maps of the 1750–1400 cm−1 wavenumber range for the spectra series monitored during the total observation period at 70 °C (positive cross-peaks are white and negative cross-peaks are gray-shaded).
MCR-ALS Analysis
The data was analyzed by Matlab (version R2016a, The Math Works, Inc., USA), MCR-GUI 2.0 (from https://www.mcrals.info). The general optimization parameters were defined as number of iteration equal to 50, and convergence criteria equal to 0.1. Repeated analyses using alternative initial estimates converged toward equivalent solutions, indicating that the resolved profiles are not dependent on a particular initialization.
MCR-ALS was applied to the baseline-corrected and Savitzky–Golay-smoothed ATR FT-IR spectra described in the Spectral Evolution and Kinetic Background section above. To suppress instrumental artefacts originating from the diamond ATR element, the 2200–1800cm–1 region was excludedprior to analysis. The ν(N = C = O) region (2350–2270 cm–1), containing information on monomer consumption, was subsequently merged with the chemically informative 1800–600 cm–1 range associated with polyurethane formation. This preprocessing ensured that both reactant depletion and product evolution contributed simultaneously to the multivariate resolution.
The selection of three components with a sequential transformation was supported jointly by principal component analysis (PCA)/standard normal variate (SVD) analysis and chemical interpretability:

A: residual monomer, B: dissolved polyurethane with weak hydrogen bonding, and C: precipitated, strongly hydrogen-bonded polyurethane adhering to the ATR probe.
The resolved MCR-ALS components should therefore be interpreted as spectroscopically distinguishable physicochemical states rather than strictly isolated molecular species.
Initial estimates of pure spectra were obtained using the simple-to-use self-modeling mixture analysis (SIMPLISMA) combined with PCA-selected representative spectra from each temperature dataset. Non-negativity constraints were imposed on both spectral and concentration matrices together with a closure constraint of 100% on the concentration profiles to reflect the conservation of total chemical composition.
The resolved spectra (Figure 5a) agree well with established polyurethane assignments. The intermediate component exhibits a broad, higher-wavenumber carbonyl band characteristic of weakly hydrogen-bonded urethane groups in solution, whereas the final component shows a red-shifted and narrower ν(C = O) band together with amide II changes typical of ordered, crystalline domains. These spectral differences confirm that MCR-ALS separates not only chemical conversion but also phase evolution during polymerization.
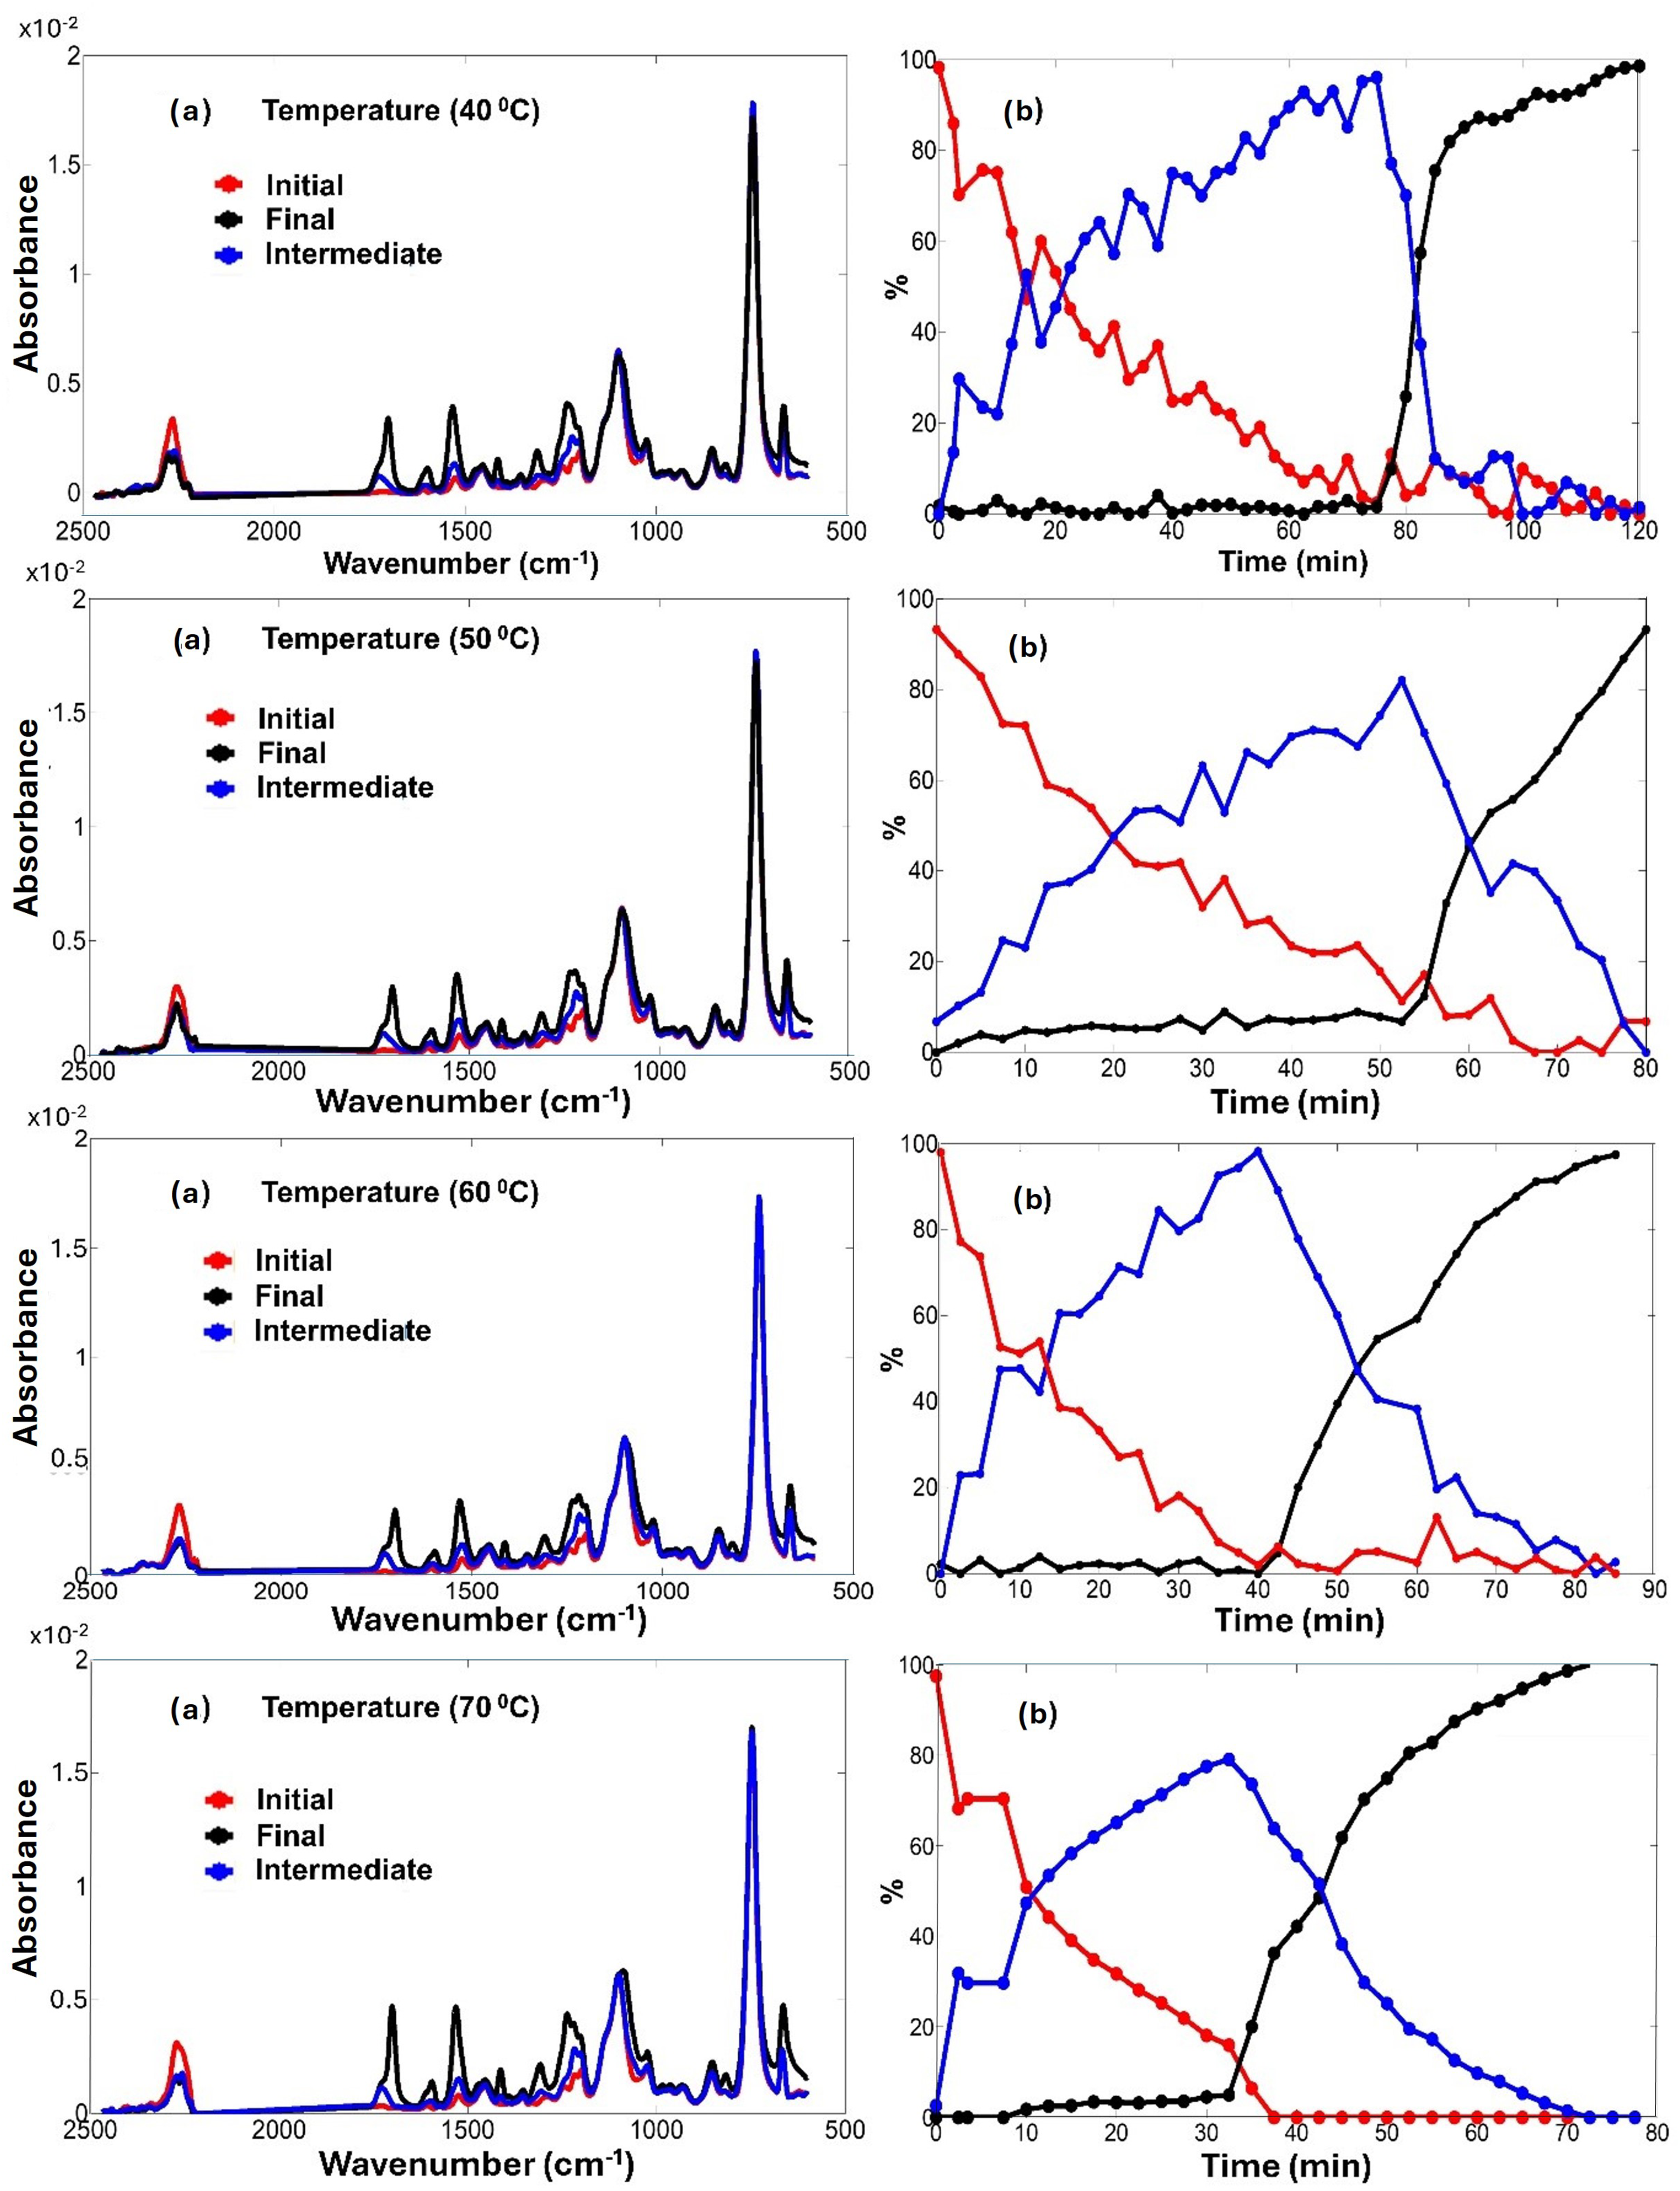
Results of MCR-ALS analysis applied to the temperature-dependent ATR FT-IR spectra of the MDI–BDO polymerization: (a) resolved pure-component spectra associated with chemically and physically distinct species; (b) corresponding concentration profiles illustrating monomer consumption (initial), polymer formation (intermediate), and the emergence of a solid polymer phase during the reaction (final).
Temperature-Dependent Concentration Profiles
Because MCR-ALS yields relative concentration profiles derived from spectral variance, the extracted trends are interpreted as apparent reaction progress consistent with kinetic behavior rather than as direct kinetic measurements.
40 °C.
At 40 °C the reaction proceeds slowly, allowing extensive accumulation of the dissolved polymer intermediate. The intermediate reaches nearly quantitative relative contribution before conversion into the solid phase begins after approximately 75 min. This delayed onset reflects slow development of strong intermolecular hydrogen bonding and crystallization at low temperature.
60 °C and 70 °C
At elevated temperatures the sequential character becomes increasingly compressed in time. At 60 °C, both reaction steps accelerate while preserving the A → B → C progression: the intermediate reaches a pronounced maximum near 40 min before rapid formation of the solid phase. At 70 °C the intermediate is only transiently detectable and attains a reduced maximum intensity. The rapid appearance of the final component indicates that polymer precipitation follows urethane formation almost immediately, demonstrating the strong temperature dependence of the physical phase transition rather than a change in reaction mechanism. These observations agree with kinetic acceleration and precipitation behavior previously inferred from conventional band analysis and PCMW2D correlation spectroscopy.
50 °C: Experimental Offset Rather than Kinetic Deviation
The concentration profiles obtained at 50 °C deviate from the systematic temperature trend: The final component appears at early times, and the intermediate reaches a comparatively lower maximum. Within the framework of MCR-ALS, such behavior does not necessarily reflect altered reaction kinetics. Because the algorithm resolves components relative to the selected initial spectral states, any deviation of the first recorded spectrum from the true starting composition propagates through the reconstructed concentration profiles. The most plausible explanation is therefore an experimental time offset, meaning that the spectrum labeled “0 min” already contained partially converted material. Consequently, the apparent early formation of the final species at 50 °C should be interpreted as a measurement artefact rather than evidence for a mechanistic change. When this offset is considered, all temperature series remain consistent with a common sequential reaction pathway.
Quality of the MCR-ALS Models
Table I summarizes the quantitative performance parameters. Variance explained exceeds 99.9% for all datasets, while lack-of-fit values remain below ∼2%, indicating excellent reconstruction of the experimental spectra.
MCR-ALS results: Intermediate peak (min), variance explained, lack of fit (LOF) in % and standard deviation of the residuals (SDR).

To evaluate solution uniqueness, rotational ambiguity was analyzed using the MCR-BANDS algorithm. 14 Without constraints, extremely large Fmax–Fmin values (1012–1015) were obtained, demonstrating the intrinsic non-uniqueness typical of unconstrained bilinear decompositions. Upon applying chemically justified non-negativity constraints, F-values decreased by many orders of magnitude to values close to unity or below. This systematic reduction confirms that the imposed constraints effectively restrict the feasible solution space and guide the optimization toward chemically meaningful results. 15 According to established criteria for MCR-ALS robustness, the constrained solutions can therefore be regarded as reliable representations of the underlying physicochemical processes.
Mechanistic Implications
Combining ATR FT-IR spectroscopy with 2D-COS and MCR-ALS provides a unified interpretation of polyurethane formation: (i) Chemical conversion: consumption of isocyanate groups and formation of urethane linkages. (ii) Physical transformation: transition from dissolved polymer chains to hydrogen-bonded crystalline domains. (iii) Temperature effect: acceleration of both chemical reaction and phase separation without changing the overall mechanism.
The concentration profiles show smooth monomer decay, transient accumulation of dissolved polyurethane, and sigmoidal growth of the solid phase whose onset shifts systematically toward shorter reaction times with increasing temperature. These trends corroborate precipitation times previously derived from PCMW2D analysis and confirm the kinetic parameters obtained from classical evaluations.
Importantly, MCR-ALS complements correlation-based spectroscopy: whereas 2D-COS reveals the sequence of spectral events, MCR-ALS provides concentration-based descriptors that distinguish overlapping chemical and physical contributions. In summary, the agreement between MCR-ALS results and previously reported kinetic and 2D-correlation analyses provides independent validation of the resolved components and supports their physicochemical relevance.
Conclusion
The step-growth polymerization of 4,4′-diphenylmethanediisocyanate with 1,4-butanediol was successfully monitored in situ by fiber-coupled ATR FT-IR spectroscopy over the temperature range 40–70 °C and evaluated using multivariate curve resolution alternating least squares (MCR-ALS). The multivariate analysis enabled decomposition of strongly overlapping spectral features and provided concentration-based descriptors of the evolving reaction system.
Three spectroscopically distinguishable components were resolved and assigned to residual monomer, dissolved polyurethane chains with weak hydrogen bonding, and a precipitated, strongly hydrogen-bonded polymer phase adhering to the ATR probe. The corresponding concentration profiles reveal a consistent sequential A → B → C transformation across all temperatures, demonstrating that polymer formation and phase separation proceed through a common mechanism while being strongly accelerated at elevated temperature.
The MCR-ALS results are fully consistent with kinetic parameters and precipitation behavior previously obtained from conventional band analysis and perturbation-correlation moving-window 2D spectroscopy. Whereas 2D-COS primarily elucidates the sequence of spectral changes, MCR-ALS complements these approaches by providing concentration-related insight that separates chemical conversion from physical phase evolution.
Evaluation of rotational ambiguity using the MCR-BANDS algorithm shows that chemically meaningful constraints substantially reduce solution non-uniqueness, confirming the robustness of the resolved profiles. The study therefore illustrates how appropriate constraint selection, combined with independent spectroscopic validation, allows reliable interpretation of complex polymerization systems without requiring explicit kinetic modeling.
Overall, the combination of fiber-coupled ATR FT-IR spectroscopy and MCR-ALS analysis provides a powerful strategy for real-time investigation of reactive polymer systems. The approach enables concise interpretation of overlapping spectral information and offers a transferable framework for studying coupled chemical reactions and phase transitions in heterogeneous polymerization processes.
Footnotes
Consent for Publication
The authors agree to the publication of this manuscript under a CC BY-NC 4.0 license.
CRediT Author Statement
De Gea Neves: Data Curation, Methodology; Miriam Unger: Data Curation, Methodology; Heinz W. Siesler: Writing - Review & Editing, Conceptualization, Supervision.
Declaration of Conflicting Interests
The author(s) declared no potential conflicts of interest with respect to the research, authorship, and/or publication of this article.
