






Abstract
Raman spectroscopy is widely used in biomedicine due to its non-invasive nature and the large amount of information it contains. This technique allows for the analysis of changes in lipid composition and concentration, which may be useful diagnostic parameter. These changes may appear at an early stage of neurodegenerative diseases and brain tumours. In addition, Raman spectroscopy allows measurements to be taken on tissues that have not been previously preserved. Therefore, it is important to investigate and select an appropriate method of sample storage in order to obtain Raman spectra of the highest possible quality. There are no clear guidelines in the currently available literature on how to prepare brain tissue samples to obtain the highest possible spectral quality. The aim of this study was to investigate the influence of an important parameter - the storage temperature of rat brain tissue on the quality of the spectrum. Based on a review of the literature, three methods of storing brain tissue were selected. The obtained Raman spectra were pre-processed and averaged. 2T-2D analysis was performed, comparing spectra differing in the way the tissue was stored before measurement. Based on the 2T-2D maps, differences were identified and discussed.
This is a visual representation of the abstract.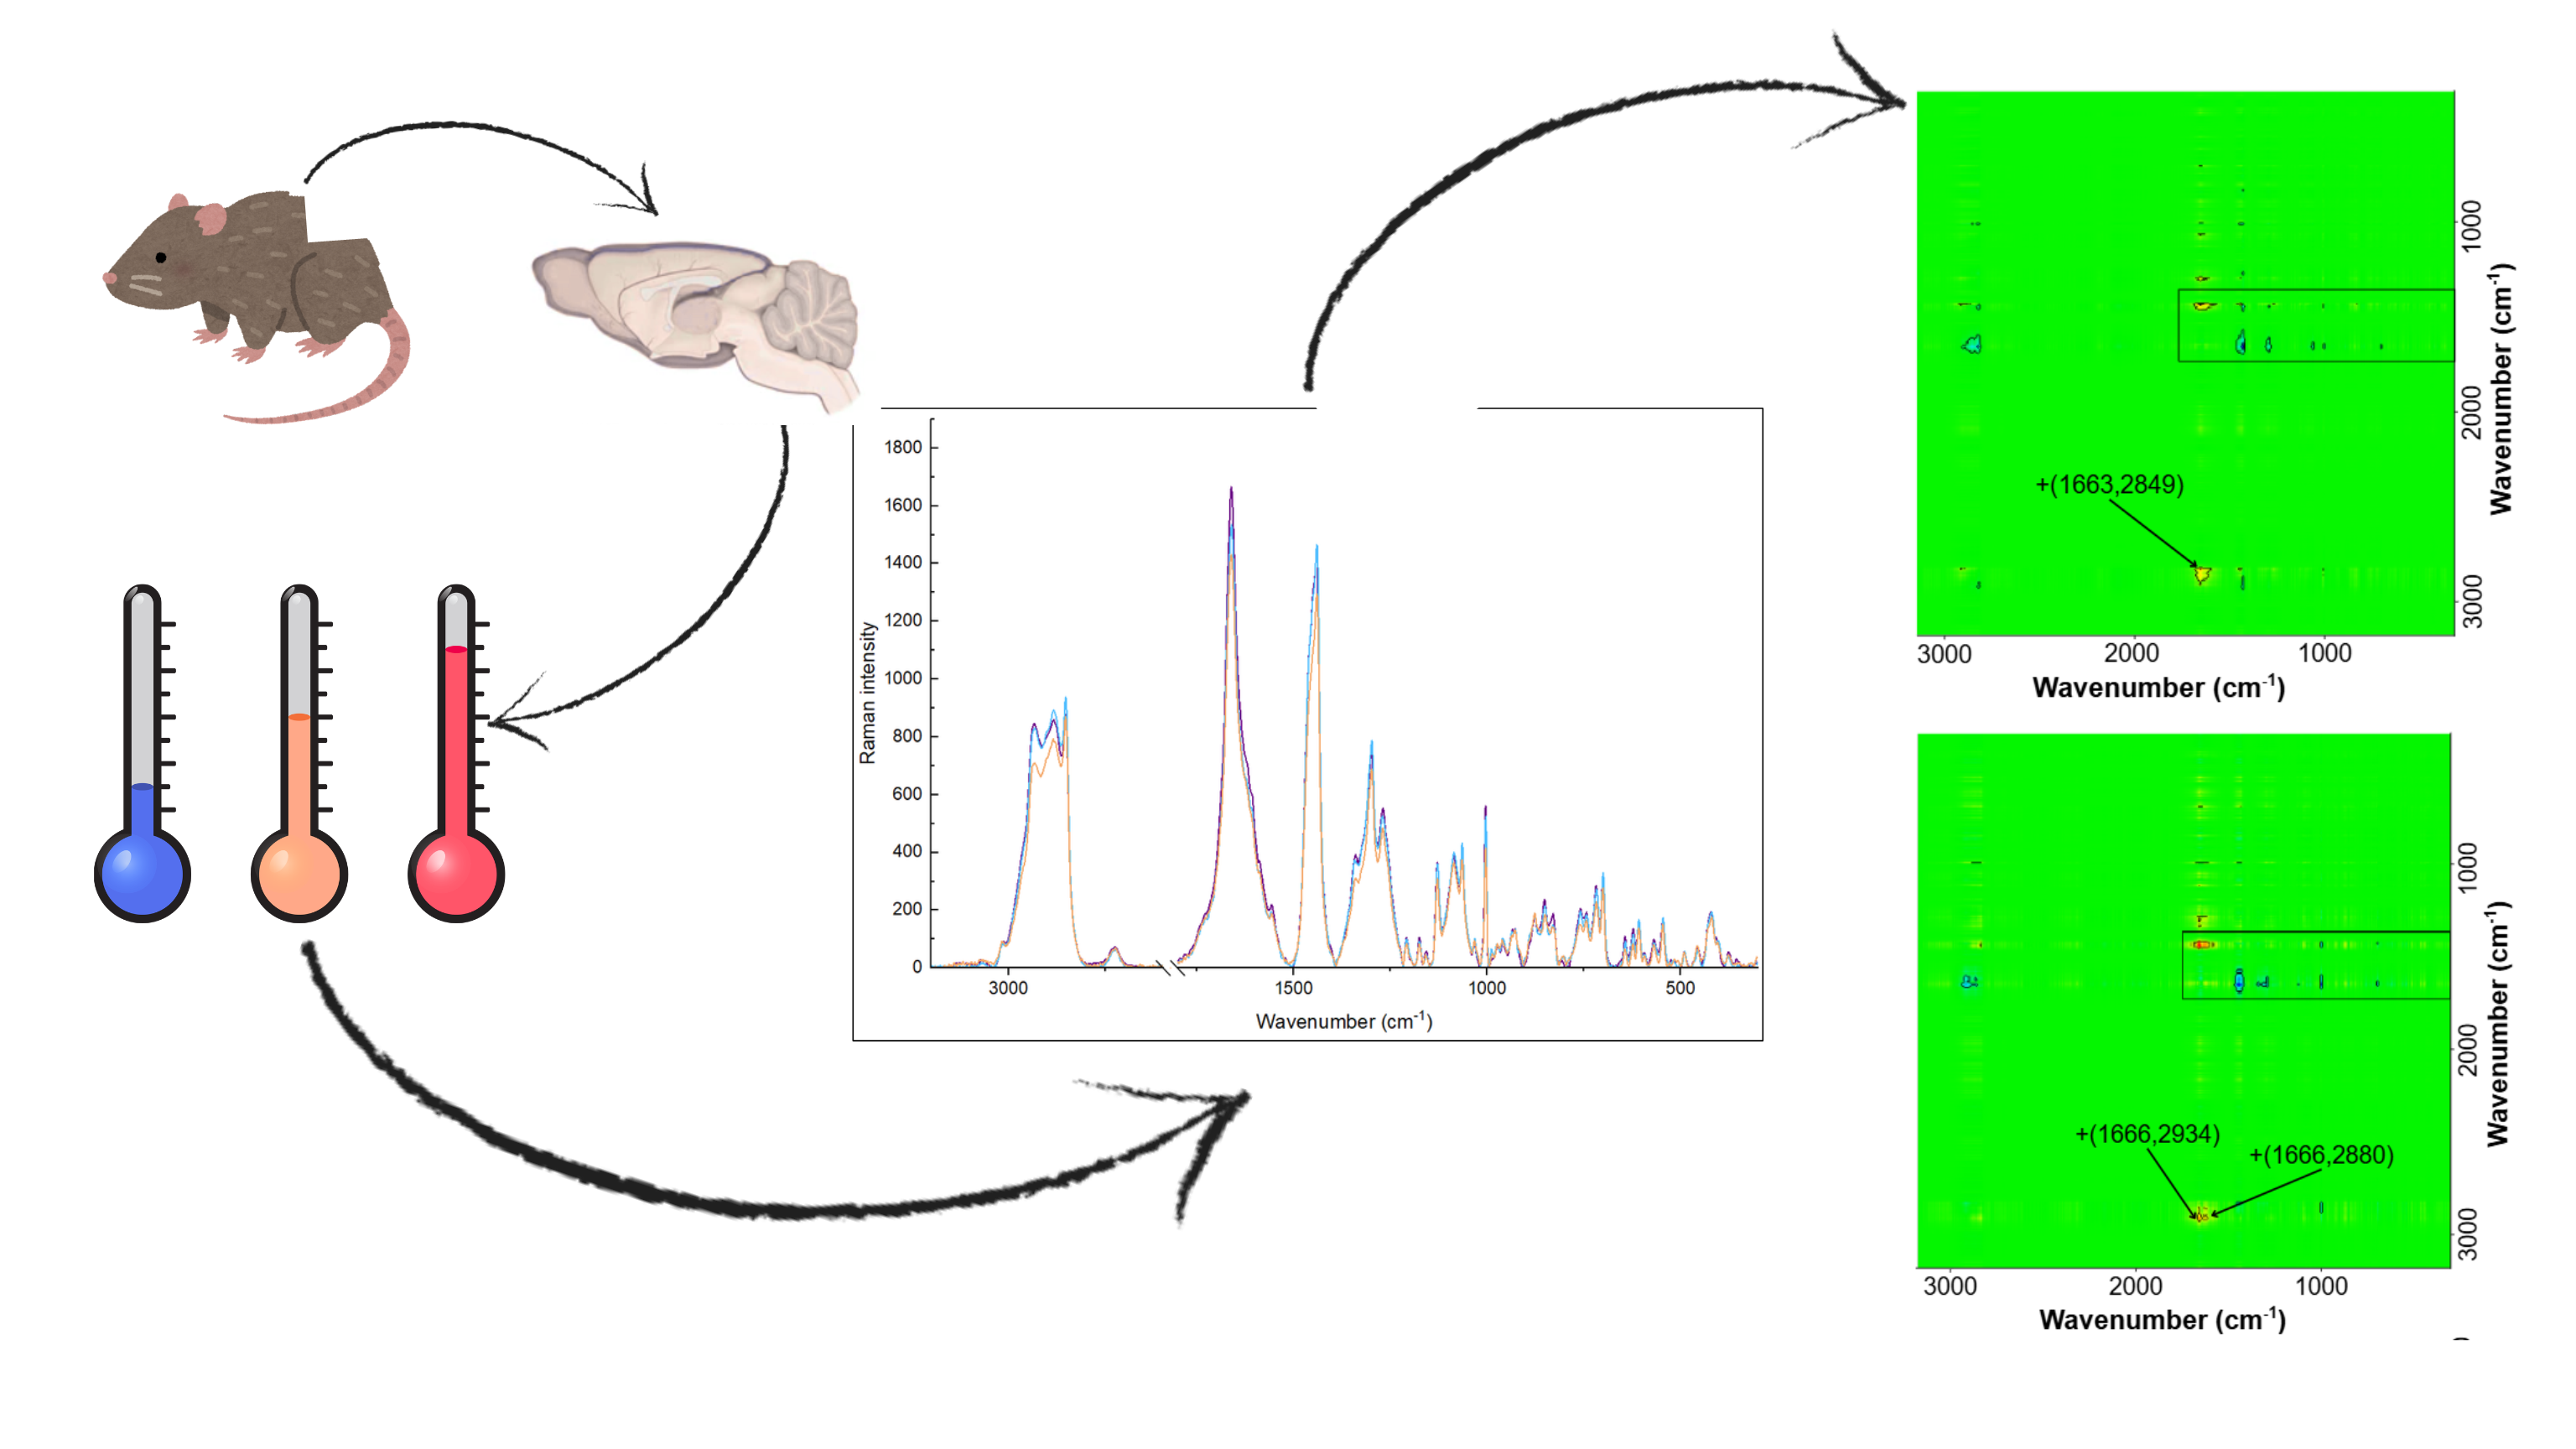
Keywords
Introduction
Raman spectroscopy is a technique that, thanks to its non-invasive nature, is widely used in the study of biological materials. 1 This technique allows us to observe changes in the composition of samples associated with the development of diseases such as brain tumours and neurodegenerative diseases such as epilepsy or Alzheimer's disease.2–4 In diseased brain tissues, changes in lipid concentration and saturation may occur, so monitoring them may be a useful parameter enabling rapid diagnosis of diseases at an early stage. 5 Raman spectroscopy is a technique that allows measurements to be taken without prior sample preparation. Furthermore, this technique allows measurements to be taken on brain tissue that has not been subjected to any fixation method. Conventional fixation procedures often require the use of paraffin, whose bands obscure important areas of the spectrum, particularly C-H vibrations of lipids.1,5
Despite the lack of preservation methods, it is essential that brain tissue is in the best possible condition to ensure reliable measurements and high-quality results.5–7 It is possible to perform brain tissue measurements in artificial cerebrospinal fluid (ACSF).4,6 as well as in frozen and then thawed brain tissues. 8 However, the currently available literature does not provide clear guidelines on how to prepare a brain tissue sample to obtain the highest possible spectral quality.
The aim of this study was to investigate the effect of storage temperature of rat brain tissue on the quality of the spectrum. Based on a literature review, three methods of storing brain tissue were identified, selected and tested.3,6,8,9
Experimental
Samples
This study used Sprague-Dawley rats, which are an outbred strain. 10 This strain was obtained by crossing an albino Wistar female with a hooded male, which was a hybrid of unknown origin. The strain was bred in 1925 at the University of Wisconsin by Robert Worthington Dawley, and the strain is named after him.10,11
The control rats used in the study came from the Animal Breeding Facility of the Institute of Zoology and Biomedical Sciences of the Jagiellonian University in Kraków. The animals were bred in laboratory conditions with unlimited access to food and drinking water. The animals were kept at a constant temperature of 21 ± 2°C and a 12-hour light-dark cycle (12 hours of light and 12 hours of darkness).
Eleven healthy male rats were used in the study. At the time of decapitation, the rats were 5-6 weeks old. The animals were anaesthetised with isoflurane, followed by intracardiac perfusion with ice-cold artificial cerebrospinal fluid (ACSF). The brain was dissected, and then horizontal sections (300 μm) covering, among others, the hippocampus were cut on a microtome (Leica VT1000S). Brain slices were placed in an incubation chamber containing heated ACSF (34°C), continuously carbonated.
After regeneration (approximately 1 hour), brain sections were transferred to chilled ACSF. No fixation method was used. Fresh slices were stored according to the selected method during microspectroscopic measurements.
Method I: Brain tissue was stored at room temperature, placed in ACSF, and subjected to continuous carbogenation.
Method II: Brain tissue was stored in a container placed on ice packs. The tissue was placed in a cooled, continuously carbogenated ACSF solution.
Method III: Brain tissue was frozen in liquid nitrogen. Prior to measurement, the sample was thawed at room temperature and then placed in a measuring vessel containing 0.9% physiological saline solution.
Raman Microspectroscopy
The spectra were recorded using a Renishaw inVia Qontor spectrometer coupled with a Leica microscope. An immersion lens (60×, NA = 0.75) was used. The spectra were recorded in the range of 3200-2600 cm-1 and 1800-300 cm-1 using a 785 nm laser line with a power of 1 mW. An Okolab Cage incubation system was used in combination with a CO2-UNIT-BL to maintain a constant temperature (32°C), humidity (70%) and CO2 concentration (0.1%). During the measurement, the slices remained immersed in ACSF solution (Methods I and II) or 0.9% physiological saline solution (Method III). The spectral data were processed using Renishaw WiRE software.
2T2D Raman Correlation
Two-trace two-dimensional (2T2D) correlation analysis was applied to the averaged Raman spectra obtained in Methods I, II, and III. 12 At first, the spectra were smoothed using the Savitzky-Golay algorithm (nine smoothing points). Then, the baseline was corrected. The spectra prepared in this way were averaged and used as an input data for generate asynchronous correlation maps. Thermo Scientific SpectraCorr package within Omnic v.9.3 software was used.
Two-trace two-dimensional correlation spectroscopy (2T2D-COS) is an analytical technique used to compare spectral data. This method allows for the identification of subtle differences between data sets. The 2D-COS method is based on transforming spectra into a two-dimensional correlation map, either synchronous or asynchronous. The synchronous map shows spectral bands whose intensity changes in a correlated manner, thus indicating a common mechanism of change. The asynchronous map presents uncorrelated changes in intensity, thus providing information about separate mechanisms of change. A positive cross-peak value (ν1> ν2) indicates a greater contribution of the first band (ν1) than the second band (ν2) in relation to the reference spectrum. A negative cross-peak value (ν1<ν2) indicates the opposite relationship. 12 It is worth mentioning one more 2T2D advantage. One of the key characteristic of asynchronous 2T2D analysis in comparing a pair of spectra to detect very subtle feature differences is that, unlike the difference spectrum, the technique is not affected by the relative scale of intensities. So multiplication of either spectrum by an arbitrary constant does not change the coordinates of cross-peaks. This feature is especially important in the current work.
Results and Discussion
Raman Microspectroscopy
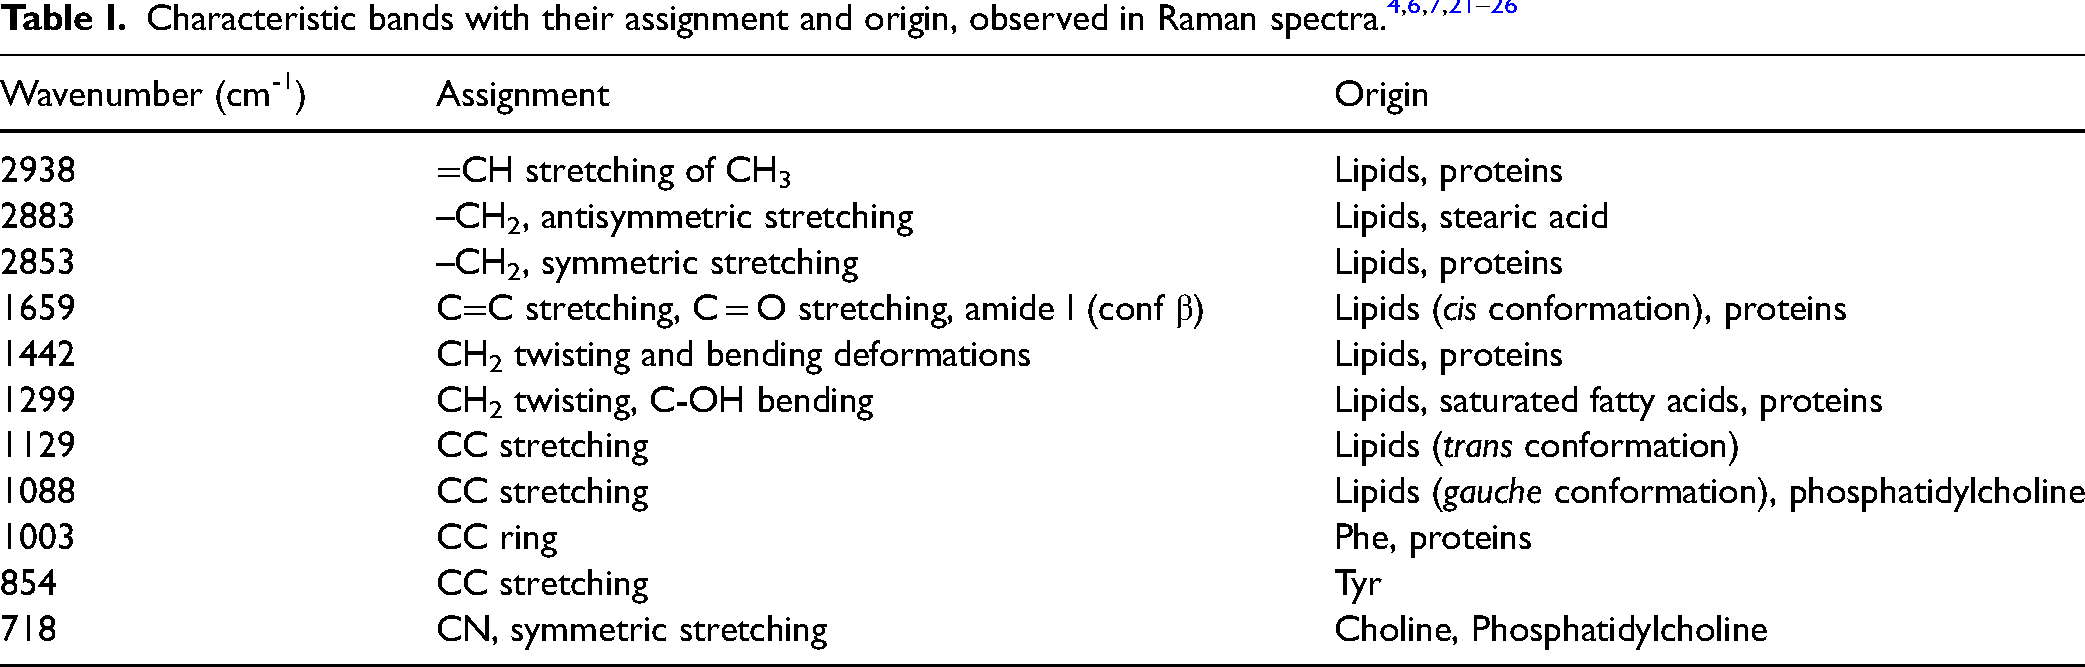
Figure 1 shows the average Raman spectra for each method used, recorded with a 785 nm laser in the range of 3200-2600 cm-1 and 1800-300 cm-1. Table 1 summarizes and attributes the origins of the individual bands. The obtained spectra confirm that the brain structure is rich in lipids and proteins. Due to the complexity and lack of clear differences between the spectra, a 2T2D correlation analysis was performed.
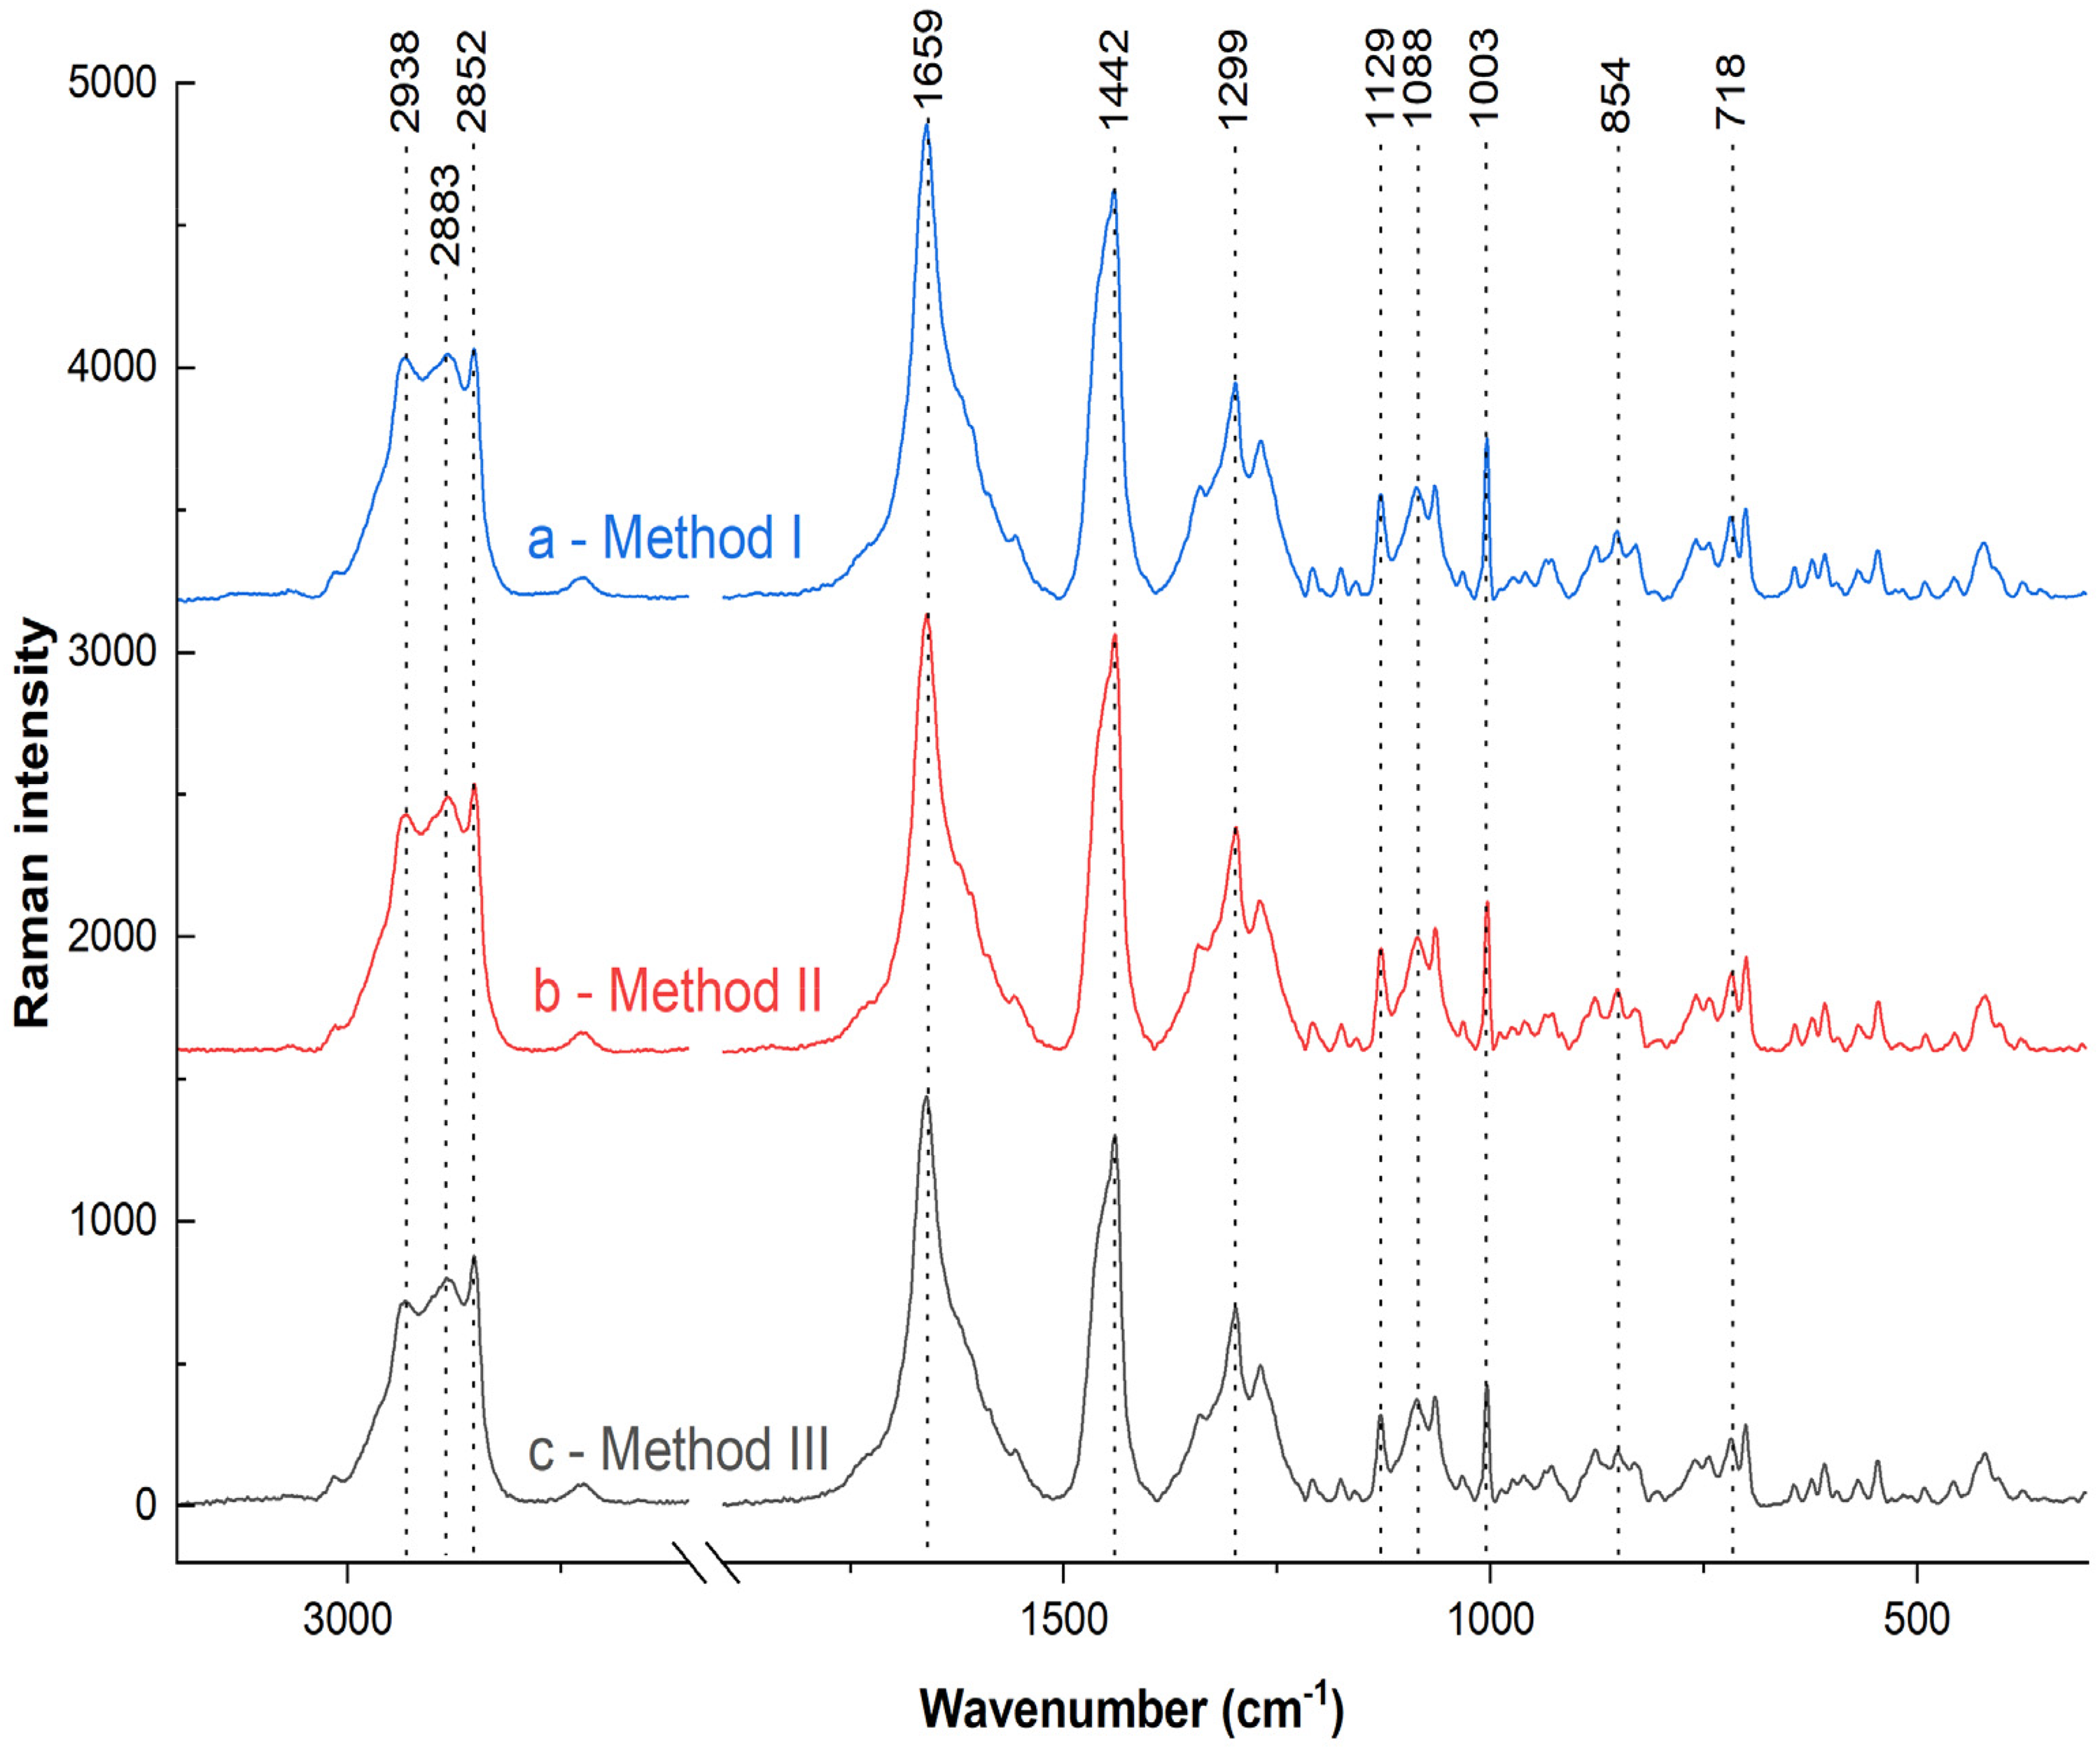
Averaged Raman spectra obtained for the examined brain tissue. (a) Method I: room temperature, ACSF solution; (b) Method II: cooling, ACSF solution; (c) Method III: freezing, NaCl solution.
Among the abiotic factors, temperature has a decisive influence on vital functions and on the structure of lipids and proteins. Low temperature affects the stiffening of phospholipid bilayers, promote freezing of body fluids can lead to a lethal state. 13 The next mechanism in response to low temperature is the increase in fatty acid unsaturation. 14 The effect of temperature on proteins is difficult to predict, although the final states at high and low temperatures are similar in some way. 15
However, rapid freezing and subsequent storage at low temperatures is a standard procedure for preserving frozen biospecimens, as ultra-low temperature markedly limits enzymatic activity, including RNase- and protease mediated degradation, and stabilizes nucleic acids and proteins for downstream molecular analyses. In brain tissue studies, rapid freezing followed by storage at −80°C in in situ hybridization/RNAscope studies led to the detection of many neurochemical mRNA markers in brain sections.16,17,18 Therefore, under appropriate handling conditions and in the absence of repeated freeze–thaw cycles, −80°C storage is not expected to induce relevant tissue degradation.
2T2D Raman Correlation
Asynchronous correlation maps are presented in Figure 2. Method I (room temperature; ACSF solution) was compared with Method II (chilled; ACSF solution) and then Method III (freezing in liquid nitrogen; NaCl solution) was correlated with Method II. Method II was chosen as the reference method, as it is currently being used in our work using rat brain tissue. We based this choice on the similarity in the chemical composition of the neocortex and hippocampus region and Raman spectra that we obtained in earlier works for this area.6,7 The observed similarities between the hippocampus and neocortex are likely to reflect, at least in part, their shared developmental origin from the pallium. During telencephalic development, distinct pallial subdivisions give rise to major cortical territories, with the medial pallium contributing to the hippocampal formation/archicortex and the dorsal pallium to the neocortex. 19 Consequently, both structures share fundamental features of cortical organization, including a predominance of pallium-derived glutamatergic projection neurons and locally integrated GABAergic interneuron networks. 20 Therefore, similarities in their chemical composition should not be interpreted as unexpected, but rather as consistent with their common pallial origin and related cortical identity, despite their later divergence into distinct cytoarchitectonic and functional domains.
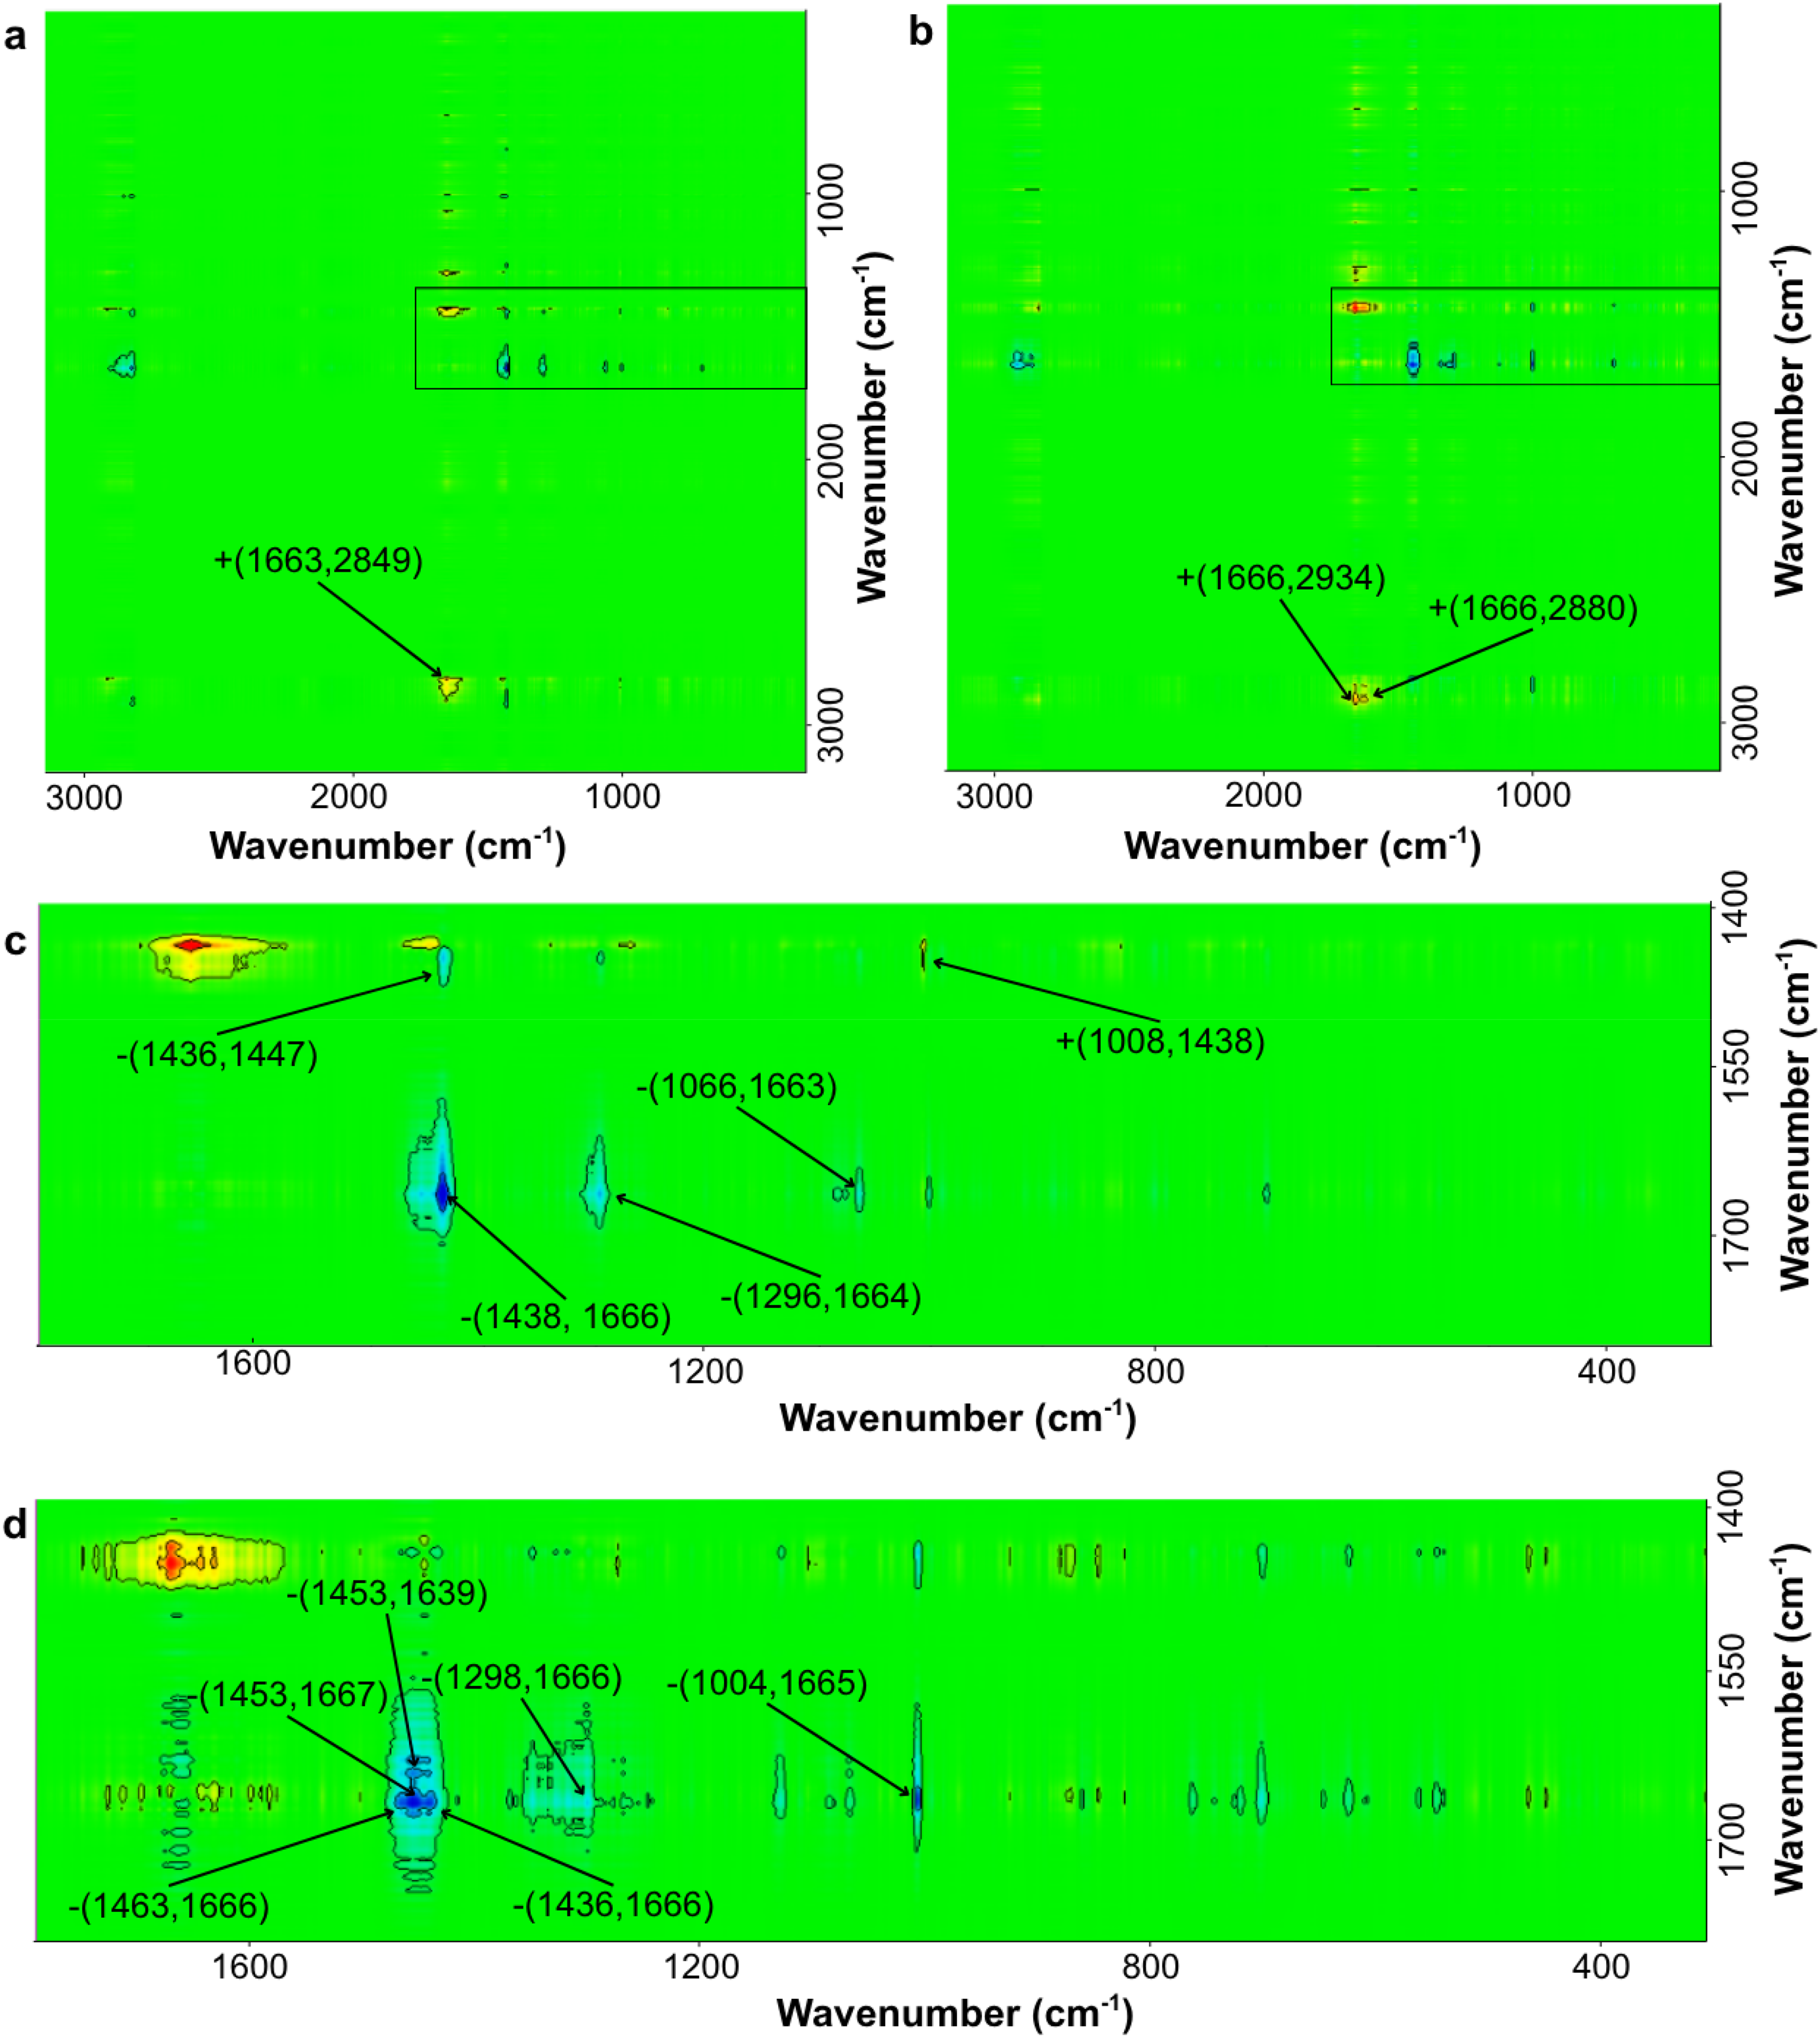
Asynchronous 2T2D correlation map for the studied populations with selected cross-peaks indicated and in 3200–300 cm-1 range. (a) Method I (room temperature, ACSF solution) vs. Method II (cooling, ACSF solution); (b) Method III (freezing, NaCl solution) vs. Method II (cooling, ACSF solution); Selected area x: 1750–1400 cm-1 and y: 1800–300 cm-1 (c) comparing Method I (room temperature, ACSF solution) vs Method II (cooling, ACSF solution); (d) Selected area comparing Method III (freezing, NaCl solution) with Method II (cooling, ACSF solution).
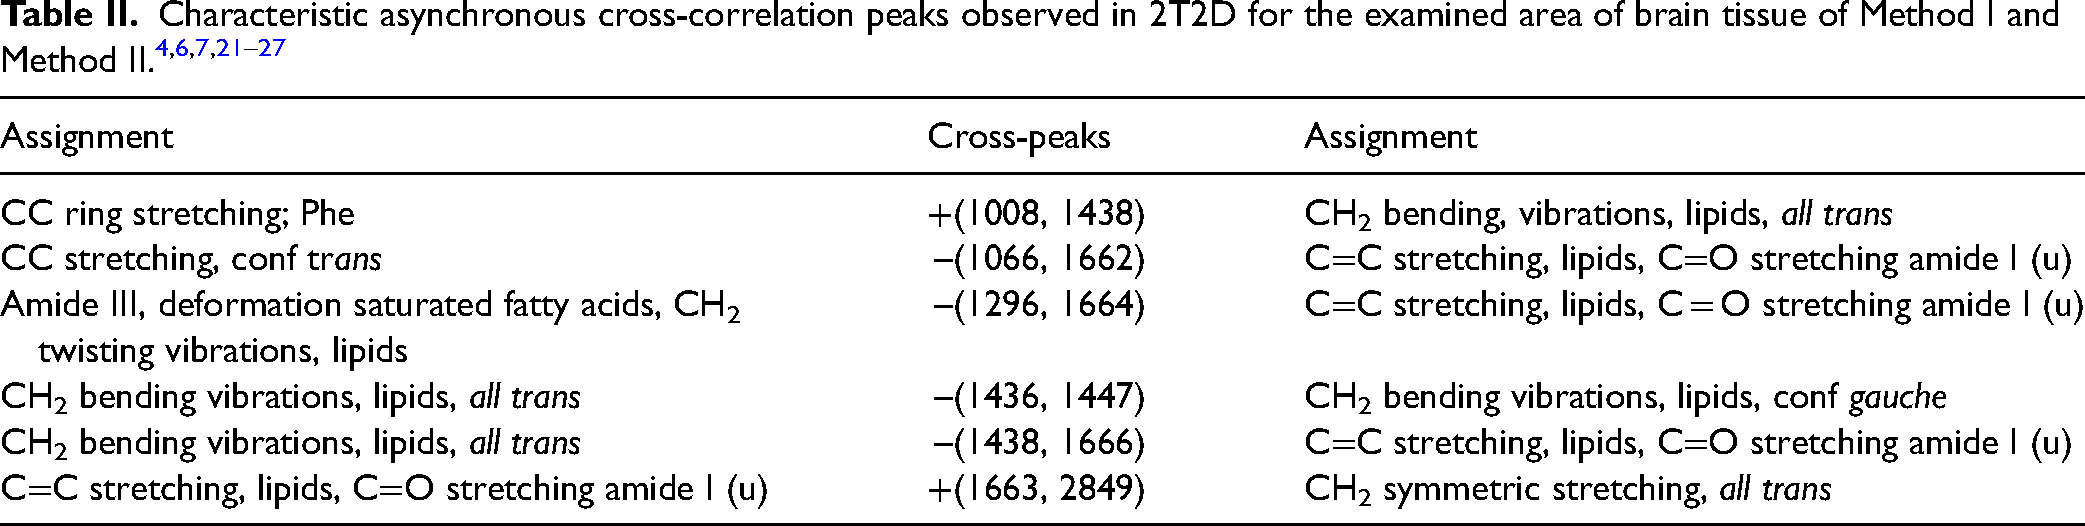
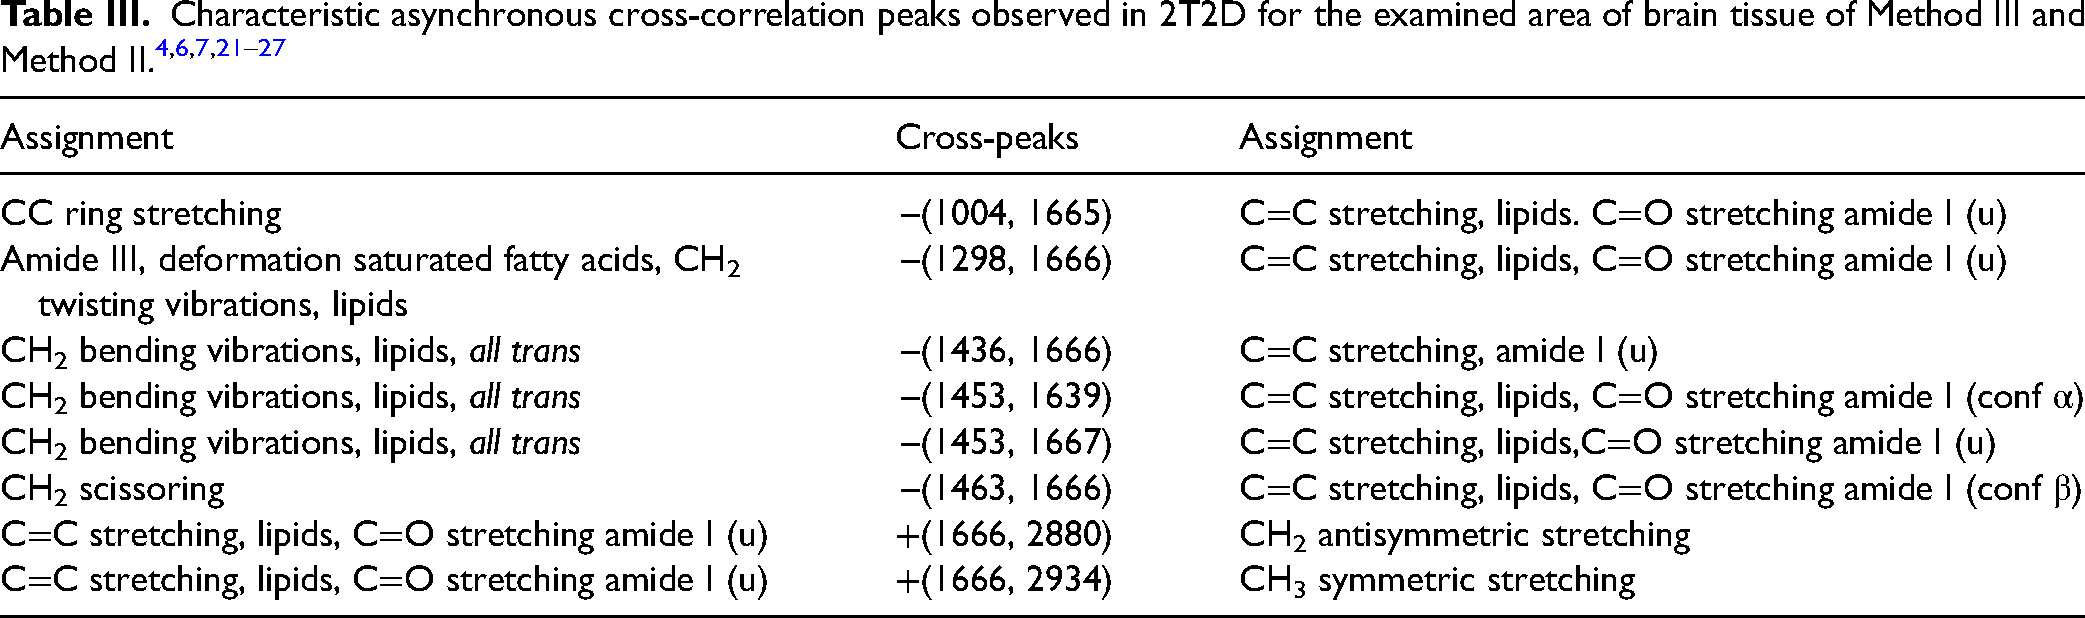
Table II shows the characteristic cross-peaks observed on asynchronous maps for Method I versus Method II. Table III shows cross-peaks for comparison of Method III versus Method II.
Method I vs Method II
Comparing Method I (room temperature; ACSF solution) with Method II (cooling; ACSF solution), the dominance of negative cross-peaks can be observed. The positive cross-peak +(1008,1438) shows that the proportion of CC vibrations originating from the aromatic ring is greater than the proportion of vibrations originating from lipids. The negative cross-peak –(1066, 1662) suggests that the contribution of vibrations originating from lipids in the trans conformation is smaller than the contribution of vibrations originating from amides I in unordered conformation. The negative cross-peak -(1296, 1664) indicates that in the case of tissue stored at room temperature, the band originating from saturated fatty acids and/or amide III vibrations has a smaller contribution than the Amide I (conf u) band observed for tissue stored in a cooled ACSF solution. The negative peak –(1436, 1447) suggests subtle differences in lipids conformations, correlates asynchronously lipid ordering, so we conclude that in Method I we obtain fewer lipids in trans conformation. Similarly, the negative cross-peak –(1438, 1666) indicates a smaller contribution of CH2 vibrations than vibrations originating from amides I. The positive cross-peak +(1666, 2849) corresponds to a greater contribution of vibrations originating from amide I (conf u) than symmetrical CH2 vibrations in tissue stored at room temperature.
Method III Versus Method II
Comparing Method III (freezing in liquid nitrogen; NaCl solution) and Method II (cooling; ACSF solution), both positive and negative cross-peaks were observed. The negative cross-peak –(1004, 1665) indicates a smaller contribution of the band originating from CC vibrations in the aromatic ring than the band originating from amide I (conf u) vibrations in tissue stored in freezing condition, in NaCl solution. The cross-peak –(1298, 1666) suggests a smaller contribution from the amide III band and/or lipids than from the Amide I band. The negative cross-peak –(1453, 1667) indicates a relationship between lipids and proteins. A smaller contribution from protein vibrations is observed for tissue stored in cooled ACSF. Positive cross-peaks +(1666, 2880) and +(1666, 2934) indicate a greater contribution of vibrations originating from amide bands for tissue stored in cooled ACSF than vibrations originating from lipids. Negative cross-peaks were also observed at –(1436, 1666) and –(1453, 1639), indicating a smaller contribution from CH2 vibrations than from amide I bands in β and α conformations. The negative cross-peak –(1463, 1666) indicates a correlation between the CH2 scissoring vibration and the amide vibration. More lipid vibrations are observed, probably due to the splitting interactions. 27
Conclusion
Sprague-Dawley control rats were used in this study. On the day of decapitation, the rats were 5–6 weeks old. The aim of the study was to examine how temperature affects the storage of brain tissue. For this purpose, based on a literature review, three methods were identified, designed and tested. Method I used room temperature and ACSF solution. In Method II, the tissues were stored on ice packs and ACSF was used as the solution. Method III involved freezing in liquid nitrogen. The samples were then thawed and the measurement was performed in a 0.9% NaCl solution.
The obtained Raman spectra differed slightly, so 2T2D-COS correlation analysis was used to identify subtle differences. Method II was treated as a reference spectrum, against which the effects obtained in Methods I and III were compared. For both comparisons, differences were observed in the amide I, amide III and lipid-specific regions. These changes suggest that temperature changes in the chemical structure of the brain may result in protein conformational changes and modifications of lipid structures, such as conformational changes or changes in saturation. Method II indicates a greater abundance of lipids vibrations in the brain tissue compared to Method I, and a greater abundance of proteins represented by amide I band compared to Method III. The changes observed in proteins using methods I and III indicate their denaturation as a result of temperature influence.
Footnotes
Acknowledgment
The study was supported by the research part of the subsidy of the Faculty of Chemistry, Jagiellonian University in Krakow, Poland.
The study was carried out using research infrastructure funded by the European Union in the framework of the Smart Growth Operational Programme, Measure 4.2; Grant No. POIR.04.02.00-00-D001/20, “ATOMIN 2.0 – Center for materials research on ATOMic scale for the INnovative economy”.
ORCID iDs

Funding
The author(s) disclosed receipt of the following financial support for the research, authorship, and/or publication of this article: European Commission grant number (POIR.04.02.00-00-D001/20).