
Abstract
Background
Understanding lipoprotein (a) [Lp(a)] measurement variability is essential in establishing its coronary heart disease (CHD) association, and optimizing assessment and management of atherosclerotic cardiovascular disease (ASCVD) risk. We established the components of biological variation (BV) and reference change value (RCV) of Lp(a) in a UK cohort.
Method
22 healthy individuals were recruited to the study. Blood samples were collected for six consecutive weeks and analysed in duplicate using the Lp(a) assay by Sentinel Diagnostics on the Beckman Coulter AU5800. Outlier, heterogeneity, normality, and trend analysis were performed, followed by CV-ANOVA to determine estimates of BV, adhering to the 14 BIVAC quality items. RCV was calculated based on estimated CVA and CVI.
Results
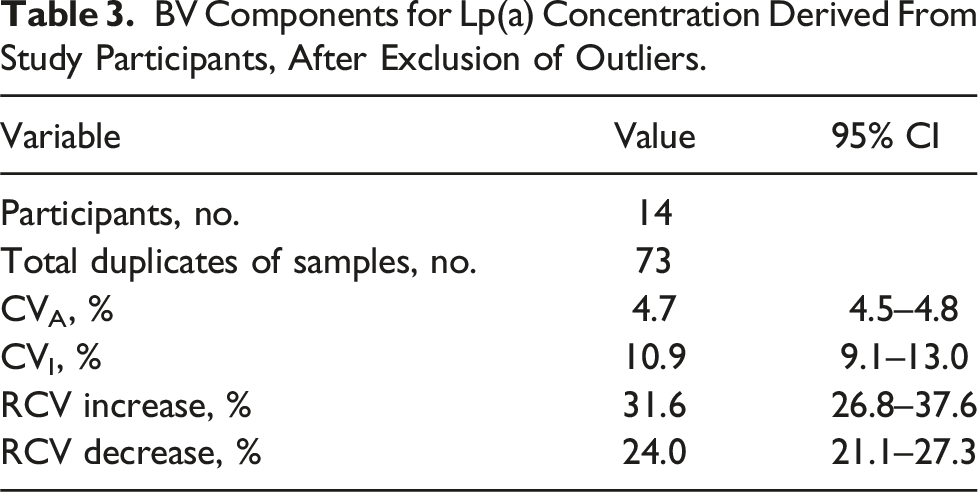
Four participants were excluded from the analysis as their mean Lp(a) levels fell below the functional sensitivity of the assay. Mean Lp(a) concentration ranged from 14 to 241 nmol/L. The overall estimate of CVI for all participants was 10.9% (95% CI of 9.1 – 13.0%). The RCV for Lp(a) was +31.6%/-24.0%.
Conclusion
Our study obtained a CVI estimate for Lp(a) that aligned consistently with recent studies adhering to the quality specifications outlined in the BIVAC checklist. The CVI estimate was significantly lower than Lp(a) estimates reported in studies up to 2003. The CVI estimate highlights the limitations of relying solely on a single Lp(a) measurement for prognosticating ASCVD risk and identifying candidates for novel Lp(a) therapies, particularly when the measured value is near clinical decision thresholds.
Introduction
Lipoprotein (a) [Lp(a)] is a distinctive plasma lipoprotein composed of a low-density lipoprotein (LDL) particle, with apolipoprotein B-100 (ApoB-100) covalently linked to apolipoprotein(a) [apo(a)] by a disulphide bond. 1 The LPA gene primarily determines Lp(a) concentration in plasma. 2 Apo(a) comprises loop-like structures called kringles, stabilized by three internal disulphide bonds, with variability in the size of the apo(a) isoforms mainly due to number of kringle IV type-2 (KIV2) repeats, with molecular mass ranging from 250 to 800 kDa. 3 There is an inverse correlation of isoform size with Lp(a) concentration. 4 Larger isoforms are associated with lower Lp(a) concentrations, likely due to an increase in the transit time through secretory pathway from hepatocytes and increased degree of pre-secretory degradation. 5
Epidemiological studies have shown a consistent association between elevated Lp(a) levels and increased risks of myocardial infarction (MI), coronary heart disease (CHD), stroke, peripheral arterial disease and aortic valve stenosis, due to its pro-atherogenic and pro-inflammatory properties.6–8 In the Emerging Risk Factors Collaboration, each standard deviation increase in Lp(a) concentration was linked to a 16% higher risk of CHD events. 9 In the Copenhagen City Heart Study, individuals with Lp(a) levels in the 67th to 90th percentile, 90th to 95th percentiles, and above the 95th percentile had a 1.6, 1.9, and 2.6 times higher risk of myocardial infarction (MI), respectively, compared to those below the 22nd percentile. 10 Doubling the Lp(a) concentration was associated with a 22% increased risk of MI. The Bruneck study found that higher Lp(a) levels significantly improved CHD risk prediction, with a 2.4-fold increased risk for those in the top quintile compared to the lower quintiles, even after adjusting for common risk factors. 11
Specific therapies targeting Lp(a) concentration have highlighted the need for accurate Lp(a) measurements, complicated by the unique structure of apo(a). KIV2 repeats can result in significant challenges in measuring Lp(a). 12 Antibodies directed against the KIV2 motif can recognize the protein multiple times, resulting in measurement bias. This leads to the underestimation of serum concentrations for small isoform Lp(a), while overestimating those of large isoform Lp(a). 13 Lp(a) concentration should ideally be measured using a method where the effect of isoform size has been minimized using appropriate antibodies with calibrators certified for traceability of Lp(a) values to the WHO/IFCC reference material. 14 The results should also ideally be expressed in particle units, and conversion from mass units should be strongly discouraged. 14
Measurement variability profoundly influences the robustness of disease associations, particularly in the context of lipoproteins. The variability in measurement can introduce uncertainty and conflicting estimates regarding the correlation of a specific biochemical risk factor with CHD. Biological variation (BV) encompasses the intra-individual coefficient of variation (CVI), which is the natural fluctuation of the concentration of an analyte in the same individual, and the inter-individual coefficient of variation (CVG), which is the variation of the concentration of an analyte among a group of individuals of sound health. 15
Assessing BV helps determine the minimum precision needed for analyte measurement, which can be defined as either the desirable allowable imprecision or bias. 16 Coupled with assay analytical imprecision, this determines the reference change value (RCV) of the assay. This is a statistical threshold used to determine whether the difference in analyte concentration between two consecutive measurements in the same individual is clinically significant. This can help determine the efficacy of an intervention or detriment of a change in health status. Understanding Lp(a) measurement variability is essential in optimizing assessment and management of atherosclerotic cardiovascular disease (ASCVD) risk, especially with the advent of therapies targeting Lp(a).
Past efforts have aimed to understand the temporal variability of Lp(a) measurements within individuals. Marcovina et al. (1994) showed significant differences in BV among subjects, ranging from 0.9 to 51%, inversely correlated with Lp(a). 17 However, this study utilized a calibrator isolated from a donor with an intermediate-size isoform of apo(a), potentially introducing measurement bias as results were expressed in total Lp(a) mass.
Glueck et al. obtained serial measurements from 145 patients over 1.7 years, similarly finding a wide-ranging CVI (1.7 to 58%) inversely correlated with Lp(a) mass concentration. 18 Similar methodology in a diabetic population to the 1994 BV study by Marcovina et al., reported CVI ranging from 23.7% to 42.3%, again inversely correlated with Lp(a) concentration. 19 The implications were profound, suggesting that a single measurement could misclassify CHD risk, particularly near clinically significant cut-offs.
In a 2017 study, Marcovina et al. reassessed short-term temporal variability in Lp(a) using individuals from placebo groups in IONIS-APO(a)Rx and IONIS-APO(a)-LRx trials. 20 While mean changes in Lp(a) levels over time did not differ significantly among groups with varied Lp(a) concentrations, notable within-person variability was evident. Many individuals showed over a 25% change in Lp(a) level between two time points, highlighting Lp(a)’s dynamic nature over short-term intervals.
In 2018, The European Federation of Clinical Chemistry and Laboratory Medicine Working Group on Biological Variation and Finnish Group for the Biological Variation Database (EFLM WG-BV and TFG-BVD) aimed to tackle standardization issues affecting the application of BV results in clinical care. 21 They introduced the Biological Variation Data Critical Appraisal Checklist (BIVAC) to assess the reliability of BV estimation studies, which was subsequently utilized to critically appraise existing studies on enzymes, lipids, lipoproteins, and diabetes-related analytes. In addition to most of the studies assessing the BV of Lp(a) being performed over 25 years ago and using outdated analytical methods, 22 almost all the studies when appraised using the BIVAC resulted in a quality score of C on a scale of A to D. 21
Clouet-Foraison et al. applied the BIVAC checklist in a recent study using samples from the European Biological Variation Study (EuBIVAS), estimating a CVI of 8.9% (95% CI of 8.3 to 9.5%) for all individuals. 23 This study, conducted at the Bristol Royal Infirmary (BRI), sought to apply the BIVAC checklist to a UK cohort. The primary aim was to derive estimates of BV and RCV to inform local clinical decision-making regarding Lp(a)-lowering interventions and significant changes in health status.
Method
Analysis of imprecision and stability of Lp(a) assay
Assessment of stability and imprecision of the quantitative immunoturbidimetric Lp(a) assay by Sentinel Diagnostics on the Beckman Coulter AU5800 were performed according to best practice guideline, 24 and Clinical and Laboratory Standards Institute guidelines, 25 respectively.
Pooled samples [made up from spare serum from samples analysed for Lp(a)] at five clinically significant Lp(a) concentration levels (∼10 nmol/L, ∼50 nmol/L, ∼100 nmol/L, ∼200 nmol/L, and ∼400 nmol/L) were divided into five series with five replicate samples. Mean, standard deviation (SD), and coefficient of variation (CV) were calculated for each level. Imprecision was compared with the manufacturer’s specification and the total allowable error specified by the acceptable test performance criteria. The CV was calculated as: CV = (SD/mean) x 100. The functional sensitivity, defined as the lowest Lp(a) concentration with a CV of 20%, was estimated from data obtained in the experiment to define total precision.
Previous studies showed minimal decrease in Lp(a) values over 25 months between fresh and frozen plasma.17,26 Following Young et al.'s protocol for BV studies, 27 samples were collected at fixed intervals and frozen to facilitate simultaneous analysis to eliminate between-run imprecision. A stability study was conducted to confirm the reliability of the results. Blood samples from 20 individuals undergoing evaluation in the lipid clinic were collected into an SST tube, centrifuged and serum separated into seven aliquots. Baseline Lp(a) concentration was established from an initial aliquot. Two aliquots were chilled at 2–8°C and analysed after 72 h and 1 week for short-term stability. Two aliquots from each set were stored at −20°C and −80°C and analysed after two and 12 weeks for long-term stability.
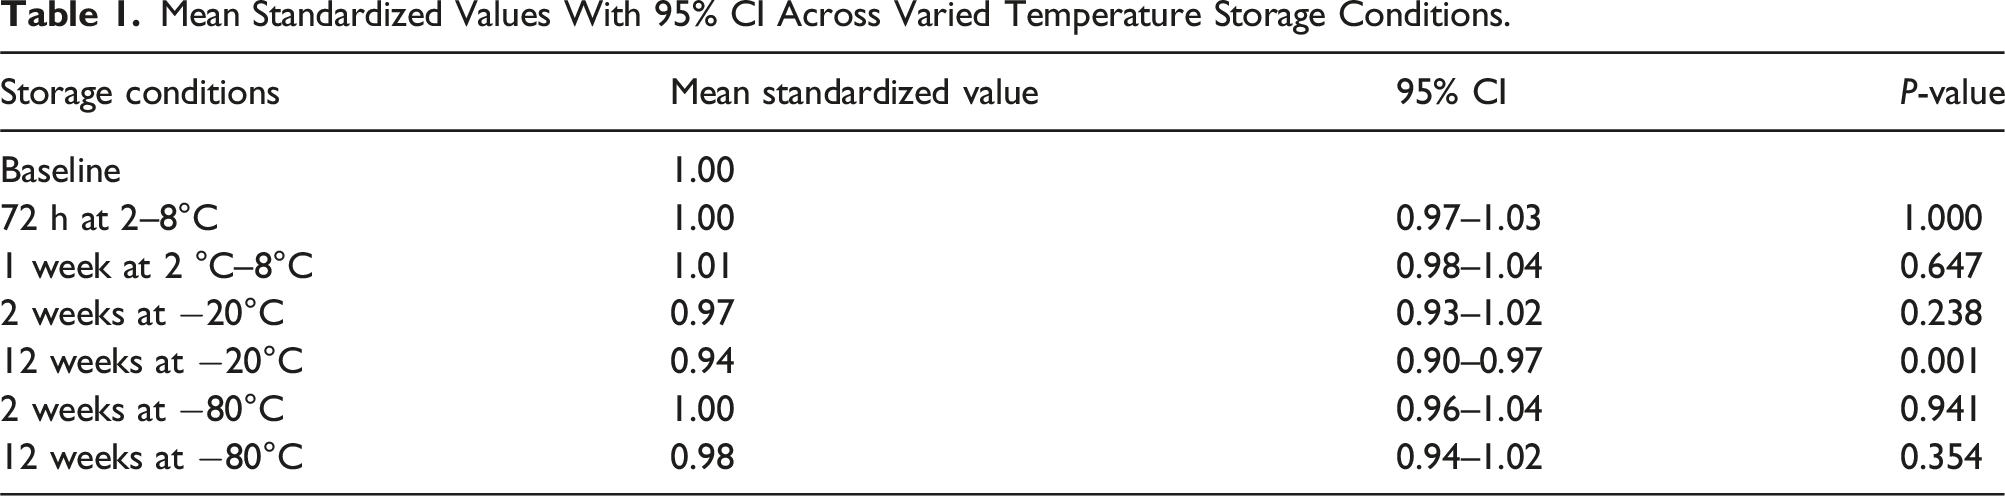
Mean standardized values, 95% confidence intervals (CI), and P-values comparing baseline and subsequent time points were calculated. Results were plotted to demonstrate the rate of change in Lp(a) concentration over time. Figure 1 summarizes the processes used to confirm stability of estimates of Lp(a) concentration across varied temperature and temporal storage conditions. Schematic flowchart of process used to confirm stability of estimates of Lp(a) concentration across varied temperature and temporal storage conditions.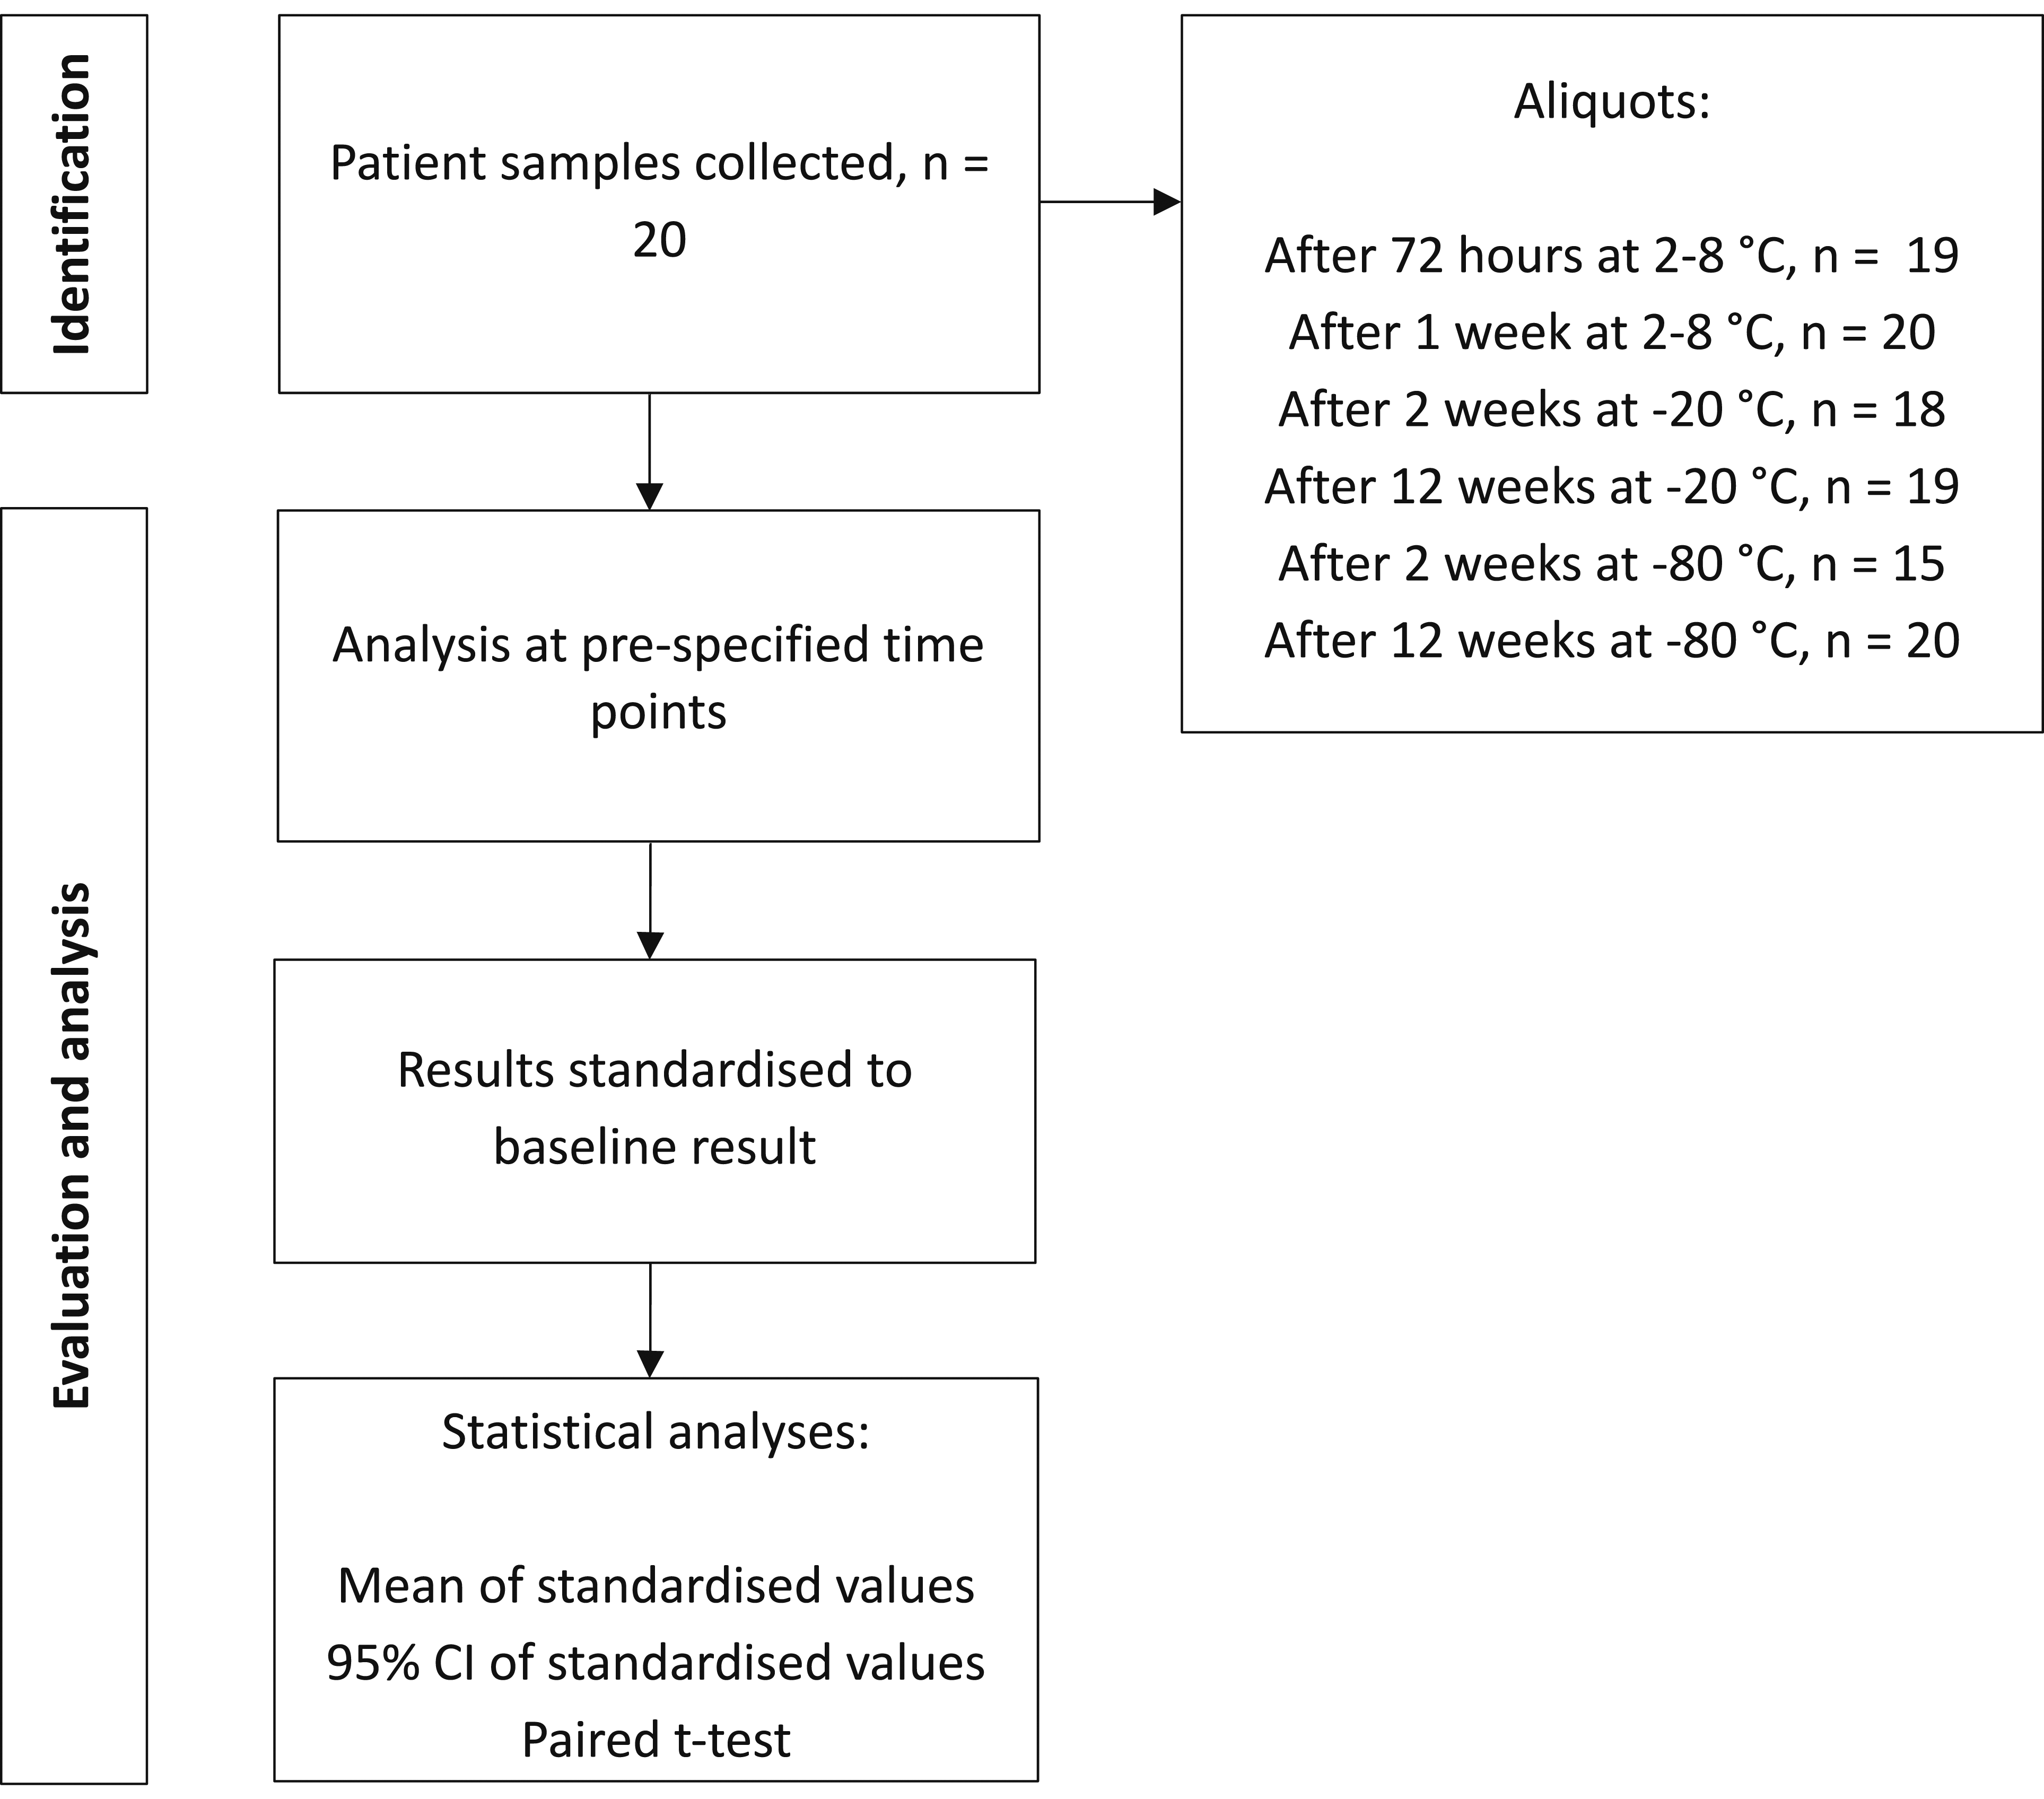
Study design of biological variation study
Healthy staff members at BRI participated in the study, following the protocol advocated by Cotlove and refined by Young et al. 27 Samples were collected at fixed intervals and frozen periodically for simultaneous batch analysis to eliminate between-run variability, compensating for within-run variability through replicate analyses. The study adhered to the 14 BIVAC quality items, including study design, recruitment, methodology of sample collection, storage and analysis and statistical handling. 21 This enabled the estimates derived to be robust for safe application in clinical practice. The study was performed subject to favourable opinion and authorization from all necessary regulatory and other bodies, including REC, HRA, and University Hospitals Bristol and Weston NHS Trust.
Recruitment
A total of 22 healthy participants were enrolled in the study, determined based on Røraas et al.'s experiment estimating the number of individuals, repeat samples, and replicates needed to power within-person SD detection. 28 A power of 0.99 would be achieved with six repeat samples measured in duplicate from 10 healthy participants, with a ratio of one between the analytical coefficient of variation (CVA) and CVI.
The study included adults between the ages 18-65 years old. Participants were not included in the study if any of the following applied 29 : acute hospital admission within last 3 months; diagnosis of diabetes mellitus; chronic kidney disease defined as an eGFR less than 60 mL/min; nephrotic syndrome defined as urine ACR greater than 3 mg/mmol; diagnosis of chronic liver disease due to any aetiology; untreated hypothyroidism or hyperthyroidism; on lipid lowering medications (including statins, ezetimibe, fibrates, bile acid sequestrants, inclisiran and PCSK9 inhibitors); and on exogenous sex steroids or growth hormone replacement. Written informed consent was obtained from participants prior to inclusion in the study.
Sample collection
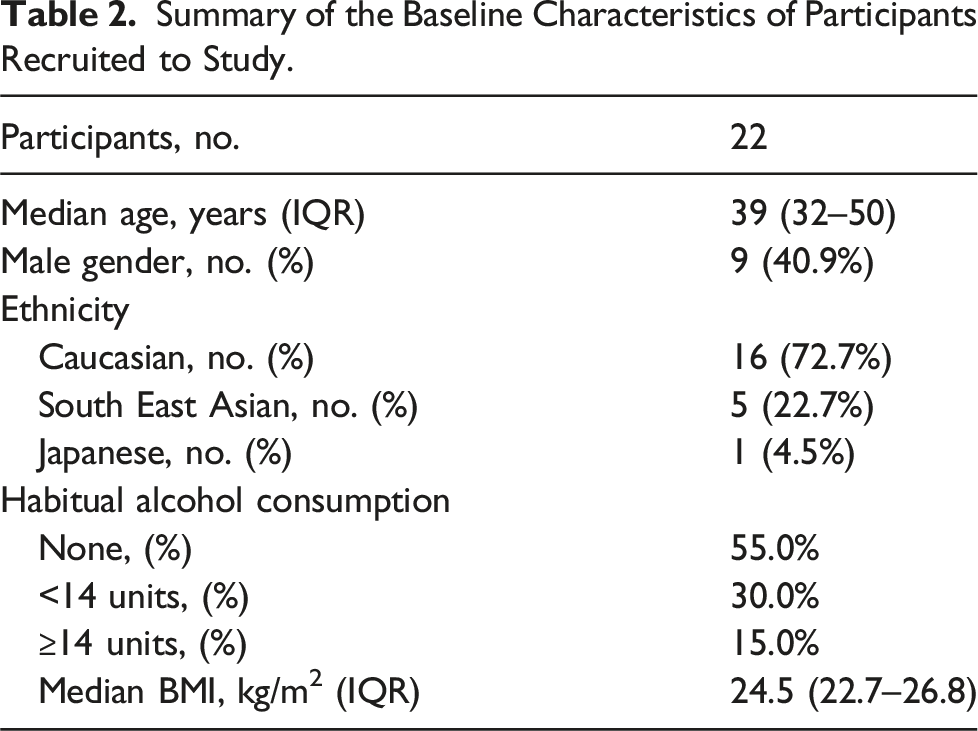
Participants completed a health questionnaire covering general health, medical history, and medications. Data on age, gender, race, and alcohol consumption were recorded. Initial examination included measurements of height, weight, resting pulse, and blood pressure (BP).
Non-fasting blood samples were collected from participants in the morning over six weekly visits, using standard venepuncture and phlebotomy procedures. Blood samples were collected at each subsequent visit over a 6-week period by the chief investigator to minimize sampling bias. Two serum separator tubes were collected weekly for 6 weeks, centrifuged within 2 hours, and separated. Samples were then transferred into pre-labelled, pseudonymized aliquots and stored at −80°C until analysis, with records maintained by the chief investigator to link participant samples.
Laboratory analysis
All analyses were performed at the biochemistry laboratory of BRI using the Beckman Coulter AU5800. Lp(a) determinations were performed using the Sentinel Diagnostic Lp(a) Ultra (REF 11,504D), a quantitative immunoturbidimetric assay using latex particles coated with anti-Lp(a) antibodies. Agglutination resulting from the interaction between Lp(a) and the anti-Lp(a) antibody was detected through absorbance changes proportional to the Lp(a) concentration, reported in molar concentration units, in the sample. Calibration employed the Sentinel Diagnostic Lp(a) Cal Set (REF 11,522D), comprising lyophilized calibration serum at five levels (11.6 to 217 nmol/L). The Sentinel Diagnostic Lp(a) Control Set (REF 1,152,201), featuring lyophilized control serum at two levels, served as internal quality controls in each run. The Sentinel Diagnostic Lp(a) method is traceable to the reference method and uses calibrators standardized to the WHO-IFCC Reference Material SRM2B.
The participant samples were thawed at room temperature on the day of the analysis and mixed by inversion. Analysis was conducted by a lone operator using a single batch of reagents, quality control materials, and calibrators to minimize analytical variability. Samples were randomly added to the analyser, with quality control at start, middle and end of run, to minimize positional or time related biases.
Statistical analysis
Data processing and statistical analyses utilized various software tools. Initial data entry and cleaning occurred in Microsoft Excel 2016. Python (v3.11) was used for further analysis and modelling, employing libraries such as scipy. stats for tests, statsmodels for advanced modelling, pandas for manipulation, seaborn for visualization, and numpy for numerical operations. Specific statistical analyses were conducted in R (v4.3.2), employing the LMER library for linear mixed-effects models.
CVI estimation was performed using CV-ANOVA within a multi-level nested model, as outlined by Røraas et al.. 30 To facilitate this, each individual’s data point was transformed by dividing by the individual’s mean value, with ANOVA performed on the transformed data to estimate CVI. Data homogeneity for CVI estimation was assessed using the Cochran’s C test after excluding outlying participants whose variance of repeated measurements fell outside 1.5 times the interquartile range (IQR) of the group variance.31,32 The homogeneity of the data used to estimate the CVA was assessed using the Bartlett test after excluding outliers in the SD between duplicates of samples which fell outside 1.5 times the IQR of the group SD.31,32 Verification of the normality of residuals was performed using the Shapiro-Wilk test. The CVA was estimated from the difference between duplicate determinations for each sample taken per participant over the 6 weeks of repeat analysis, using the formula SDA2 = ∑d2/2N (d = difference between duplicate determinations, N = number of paired results). The formula, CVA = SDA/mean * 100, was then used to calculate the CVA from the SDA obtained. To assess steady-state conditions, linear regressions on pooled mean group sample concentrations were conducted. Steady-state was determined if the 95% CIs of the regression slope included zero. CVI was estimated using a nested linear mixed-effects model on R.
Overall BV estimates were used to calculate the RCV for Lp(a) using the formula below, where Zα is set at 1.65 for the probability level of significant unidirectional change at 95% CI, using the log normal approach.
33
Figure 2 summarizes the processes used to estimate the components of BV and RCV of Lp(a). Schematic flowchart of processes used to estimate biological variation and reference changes value of Lp(a).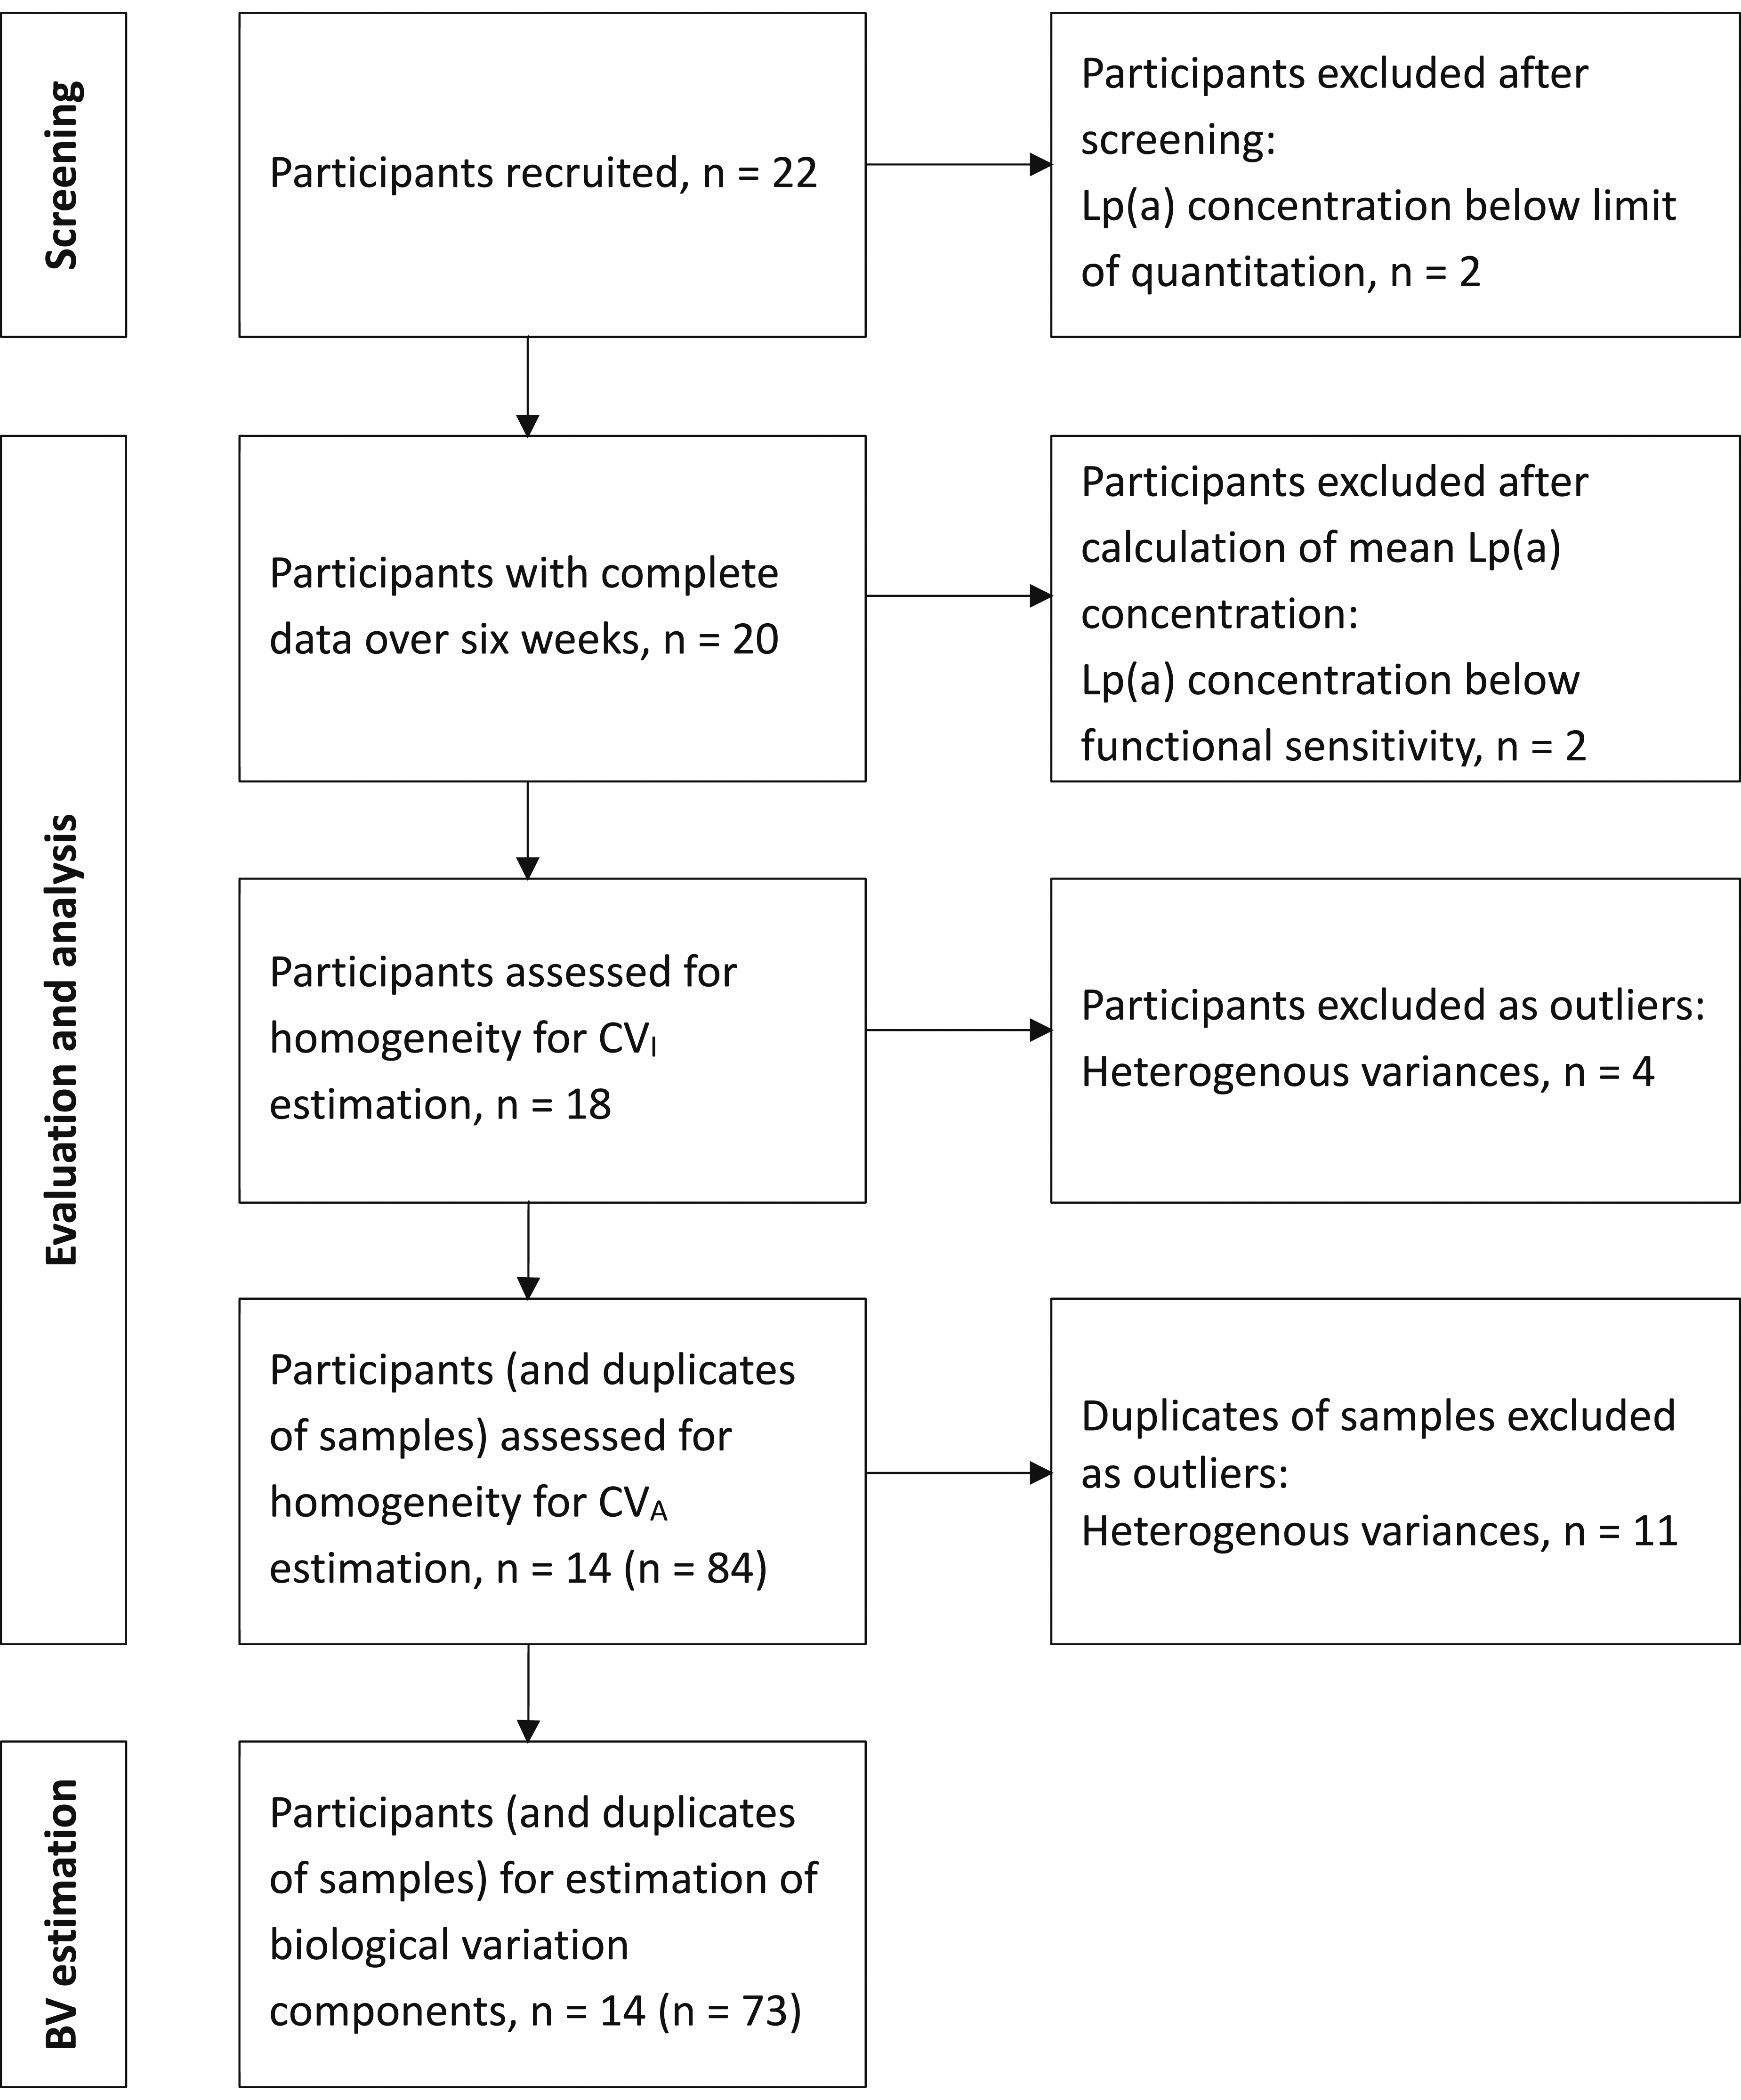


Results
Mean Standardized Values With 95% CI Across Varied Temperature Storage Conditions.
Baseline characteristics of Lp(a) biological variation study cohort
Summary of the Baseline Characteristics of Participants Recruited to Study.
Estimation of Lp(a) biological variation and reference change value
Two participants were excluded after screening as their Lp(a) concentrations were below the limit of quantitation of the assay. A further two participants were excluded from the analysis as their mean Lp(a) levels fell below the functional sensitivity of the assay. Additionally, four participants were excluded as outliers as the variance of their repeated measurements fell outside 1.5 times the IQR of the group variance.31,32 Cochran’s C statistic result was 2.10 (P-value = .02). Significant outliers in the SD between duplicates of samples were excluded if they fell outside 1.5 times the IQR of the group SD. All remaining participants had at least four paired samples included in the final model. Shapiro-Wilk test indicated normal distribution for residuals of individual variation. No significant overall trends in Lp(a) concentration were observed over the 6-week study.
Figure 3 displays Lp(a) concentration distribution for all participants in the final analysis, with 95% CI around mean values, after outlier exclusion. Mean Lp(a) concentration ranged from 14 to 241 nmol/L. Mean values (dots) and 95% CI of Lp(a) concentrations for each individual included in the study, after exclusion of outliers.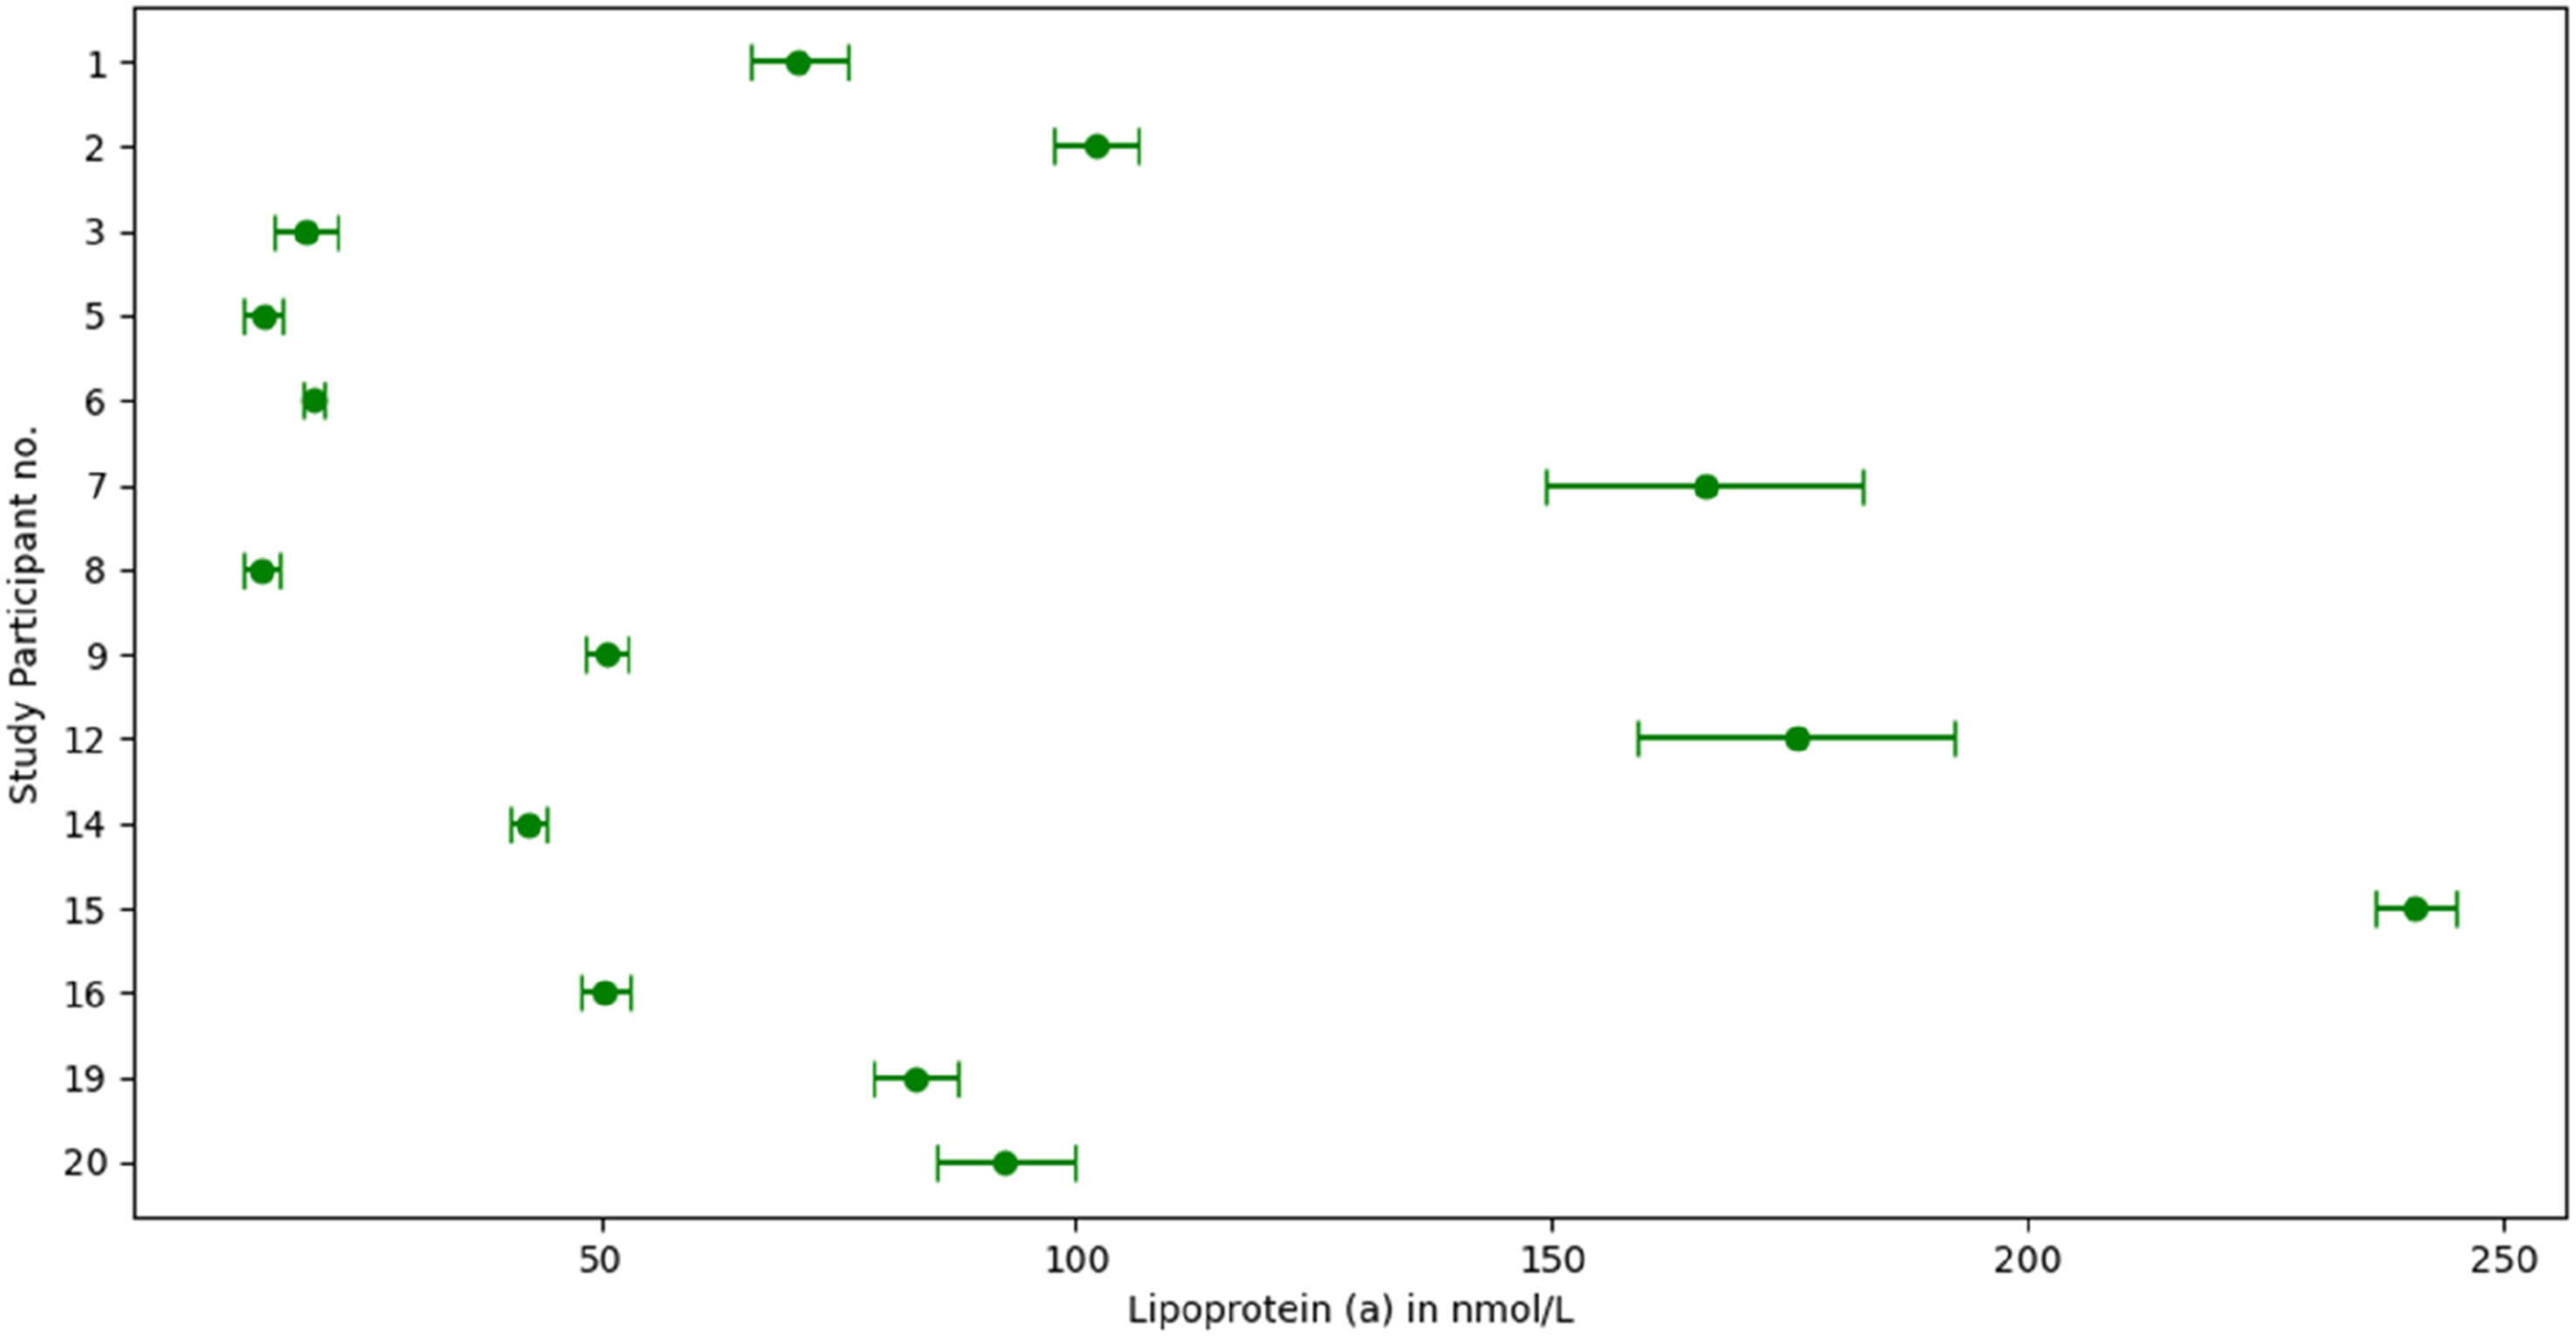
BV Components for Lp(a) Concentration Derived From Study Participants, After Exclusion of Outliers.
Discussion
The study assessed the imprecision and stability of the Sentinel Diagnostic Lp(a) assay, crucial for BV studies,26,27 and focused on assessing BV in a healthy UK cohort, adhering to BIVAC standards.
The CVI of 10.9% in our study closely mirrored the CVI of 10% (4.3–26.7%) reported in a meta-analysis of Lp(a) BV studies documented in the EFLM BV database. 22 This similarity was also seen in comparison to the CVI estimate of 8.9% (8.3–9.5%) derived from the BV study conducted by Clouet-Foraison et al.. 23 Our study could not reliably estimate CVI separately for males and females. Clouet-Foraison et al. identified a slight gender-based difference in CVI, reporting values of 6.7% (5.9–7.5%) for males and 10.6% (ranging from 9.8–11.6%) for females. 23 Given the slightly higher proportion of females in our study, it is worth considering whether this demographic distribution influenced the slightly elevated estimate of CVI.
It is important to highlight the differences in the BV estimates of Lp(a) reported in studies up to 2003.17–19 This may be explained by outdated assays not meeting current standards of isoform insensitivity, variations in study designs, and less restrictive statistical analyses that employed heterogeneous cohorts, resulting in unreliable CVI estimations with wide CIs. However, there is a potential risk associated with stringent exclusion criteria applied in BV studies, specifically tailored for APS purposes. Such rigorous criteria might yield estimates that lack external validity in the context of routine clinical practice. In our study, four out of 18 participants were excluded due to non-homogeneity of CVI, emphasizing the delicate balance required in data exclusion to ensure reliability without sacrificing generalizability.
The minimum number of samples required from each participant to achieve an estimate within 10% of their true homeostatic set point with a 95% probability can be determined using the formula: n = {1.96 * ([CVA2 + CVI2]1/2/10)}2. 34 Based on the CVA and CVI estimates obtained in the study, a minimum of five samples is necessary to obtain an estimate for Lp(a) concentration within 10% of a healthy participant’s true homeostatic set point, within our laboratory setting.
Changes in Lp(a) concentrations with novel medications such as pelacarsen, olpasiran, or lepodisiran are usually evident, given the substantial reductions, typically more than 90%, conferred by these new injectable therapies. However, selecting patients for these treatments based on Lp(a) concentration cut-offs, such as those used in clinical trial inclusion criteria, requires careful consideration. While it is impractical to repeat five samples in routine clinical care to obtain a true Lp(a) value for a patient, it is crucial to recognize the limitations of a single measurement when formulating long-term management plans for patients with elevated Lp(a).
The study-derived RCV provides critical guidance for both clinicians and laboratories in interpreting Lp(a) results. For clinicians, the RCV enhances the utility of a single Lp(a) measurement by establishing a range within which the true patient value likely resides. This aids in refining risk prognostication and determining potential eligibility for Lp(a)-lowering therapies, particularly when results are near decision thresholds outlined in current guidelines. For laboratories, the RCV serves as a benchmark to assess significant changes in Lp(a) levels between consecutive measurements. Exceeding this limit warrants further investigation into potential pre-analytical errors such as sample mislabelling or collection issues or underlying secondary causes of elevated Lp(a), including hypothyroidism, nephrotic syndrome, or renal disease.
Harb et al. highlighted the value of repeat Lp(a) measurements in reclassifying cardiovascular risk using European Atherosclerosis Society (EAS) categories. 35 Among 98 patients with intermediate-risk Lp(a) levels (30–50 mg/dL), 20% shifted to low-risk and 33% to high-risk after retesting. Similarly, Shamsudeen and Hegele reported intra-individual variability, with 10 of 11 patients reclassified around a 50 mg/dL cut-off over 10 years. 36 While Trinder et al. observed strong correlations between baseline and follow-up Lp(a) levels, considerable scatter around the correlation line suggests that reliance on a single result can be misleading, particularly when significant change was taken as exceeding 25% or 120 nmol/L. 37
In our cohort of 22 participants, applying EAS-based categories (<90, 90–199, ≥200 nmol/L), three shifted from low- to moderate-risk and two from moderate- to high-risk. While a single lifetime measurement of Lp(a) may be practical given resource constraints, this study highlights the need for caution when making long-term management decisions based on a single Lp(a) value, particularly when the measurement is close to clinical decision thresholds.
Three participants showed Lp(a) concentrations above 125 nmol/L. Acknowledging the limited participant pool, this distribution aligns with the observed Lp(a) concentration pattern in the Copenhagen General Population Study. 38 Although this falls outside the primary scope of our study, it underscores the necessity for a more systematic approach to Lp(a) screening in the general population in identifying individuals who might be at an elevated risk of ASCVD due to underlying genetic factors. Elevated Lp(a) levels correlate with increased ASCVD risk, exhibiting a concentration-dependent relationship.9–11 Ongoing clinical trials are investigating novel Lp(a) lowering therapies’ impact on ASCVD, with the hope of addressing residual ASCVD risk not directly linked to LDL cholesterol.39,40
Study limitations
A limitation of the study is the exclusion of results in the BV estimation due to non-homogeneity of variance and instances where Lp(a) concentration fell below the quantification limit or functional sensitivity threshold. While necessary for the reproducibility of estimates using the CV-ANOVA method, its potential impact on the clinical applicability and generalizability to the broader population should be acknowledged.
It is important to highlight that the study refrained from calculating a CVG for Lp(a) due to the wide range of observed concentrations stemming from underlying genetic factors within the population. Furthermore, the utility of a CVG for Lp(a) concentration is doubtful, as interpretation of a Lp(a) result is inherently linked to an individual’s own ASCVD risk.
Separate estimations of CVI for male and female would have been ideal, considering slight differences in prior studies. However, limited participants precluded statistically valid estimates. Stratifying data based on concentration ranges for consistent CVI estimates was unfeasible due to small sample size, although prior studies found no significant differences across groups.
Conclusions
Our findings yielded a CVI estimate for Lp(a) that aligned consistently with recent studies adhering to the quality specifications outlined in the BIVAC checklist. Our findings mirrored those reported by Clouet-Foraison et al., who conducted their study using the EuBIVAS population, and were in line with estimates documented in the EFLM BV database, derived from a meta-analysis of prior studies. Importantly, our CVI estimate was significantly lower than Lp(a) estimates reported in studies up to 2003, a discrepancy likely attributed to methodological and assay advancements over the years. The CVI estimate highlights the limitations of relying solely on a single Lp(a) measurement for prognosticating ASCVD risk and identifying candidates for novel Lp(a) therapies, particularly when the measured value is near clinical decision thresholds..
Footnotes
Acknowledgements
I would like to thank the staff in the Biochemistry Department at BRI for all their help with the setup of the assay. I would like to acknowledge the help given to me by the R&D department at Bristol Royal infirmary. I would like to express my heartfelt thanks to the staff at BRI, who volunteered their time and samples to the project.
Declaration of conflicting interests
The author(s) declared no potential conflicts of interest with respect to the research, authorship, and/or publication of this article.
Funding
The author(s) did not receive any financial support for the research, authorship, and/or publication of this article. Dr Paul Downie has received speaker/consulting fees from Besins Healthcare, Daiichi-Sankyo, Sanofi, Amgen, Sobi, Novartis and Amarin. Dr Paul Downie has received financial support for travel and accommodation to attend national/international conferences from Sanofi, Amgen and Daichii-Sankyo. Dr Kofi Antwi has received financial support for travel and accommodation to attend an international conference from Daichii-Sankyo.
Ethical approval
IRAS 319104 Biological variation of Lp(a) and its application in a lipid clinic - HRA & HCRW Approval issued 31/08/2023.
Guarantor
Dr Kofi Antwi.
Contributorship
Dr Kofi Antwi wrote the first draft of the manuscript. All authors reviewed and edited the manuscript and approved the final version of the manuscript.