
Abstract
Background
To clarify the fundamental characteristics of the Japan Society of Clinical Chemistry reference measurement procedure (JSCC RMP) for glycated albumin (GA), an additional performance study was performed and the correlation between the HPLC method and JSCC RMP was re-evaluated.
Methods
Repeatability, detection limit, addition recovery, uncertainty of measurement, inter-laboratory comparison, correlation between JSCC RMP and HPLC method were evaluated.
Results
The coefficient of variation (CV) of the total repeatability for the nine pretreated samples including isotope dilution and hydrolysis, defining that the averages of each of nine MS measurement samples are independent measurement vials, was 1.0%(n = 9). The limit of detection and Quantification of the GA values were 7.4 and 29.5 mmol/mol, respectively. Addition recovery rates were 99.6%–100.4%. The strong correlation (r = 0.999) of measured six serum samples between two laboratories was observed. Certified values and expanded uncertainties for JCCRM 611-2 (M, H, HH) using the JSCC RMP were as follows: JCCRM 611-2M: 232 and 9 mmol/mol, JCCRM611-2H: 359 and 14 mmol/mol, JCCRM611-2HH: 556 and 22 mmol/mol, respectively. The regression equation obtained using the Passing–Bablok method was GA (%)HPLC = 0.0523 × GA (mmol/mol) JSCC RMP + 1.315.
Conclusion
The basic performance of the JSCC reference procedure for GA measurement was good, and similar results were obtained at other facilities, so it was considered to be robust and suitable as a reference method for GA measurement. Additionally, an equation was established to convert JSCC RMP (mmol/mol) values to the HPLC% values used in clinical practice.
Background
Glycated albumin (GA) reflects glycemic control over a shorter period (2–3 weeks) compared to hemoglobin A1c (HbA1c), which indicates control over 2–3 months. It is considered a useful indicator when the glycemic control status changes in a short period of time, such as when starting or changing diabetes treatment. 1 GA is also a useful alternative marker of glycemic control in patients with anemia and variant hemoglobin, whose HbA1c values are inaccurate due to the altered lifespan of red blood cells. 2
In Japan, commercial measurement of GA began with the development of the high-performance liquid chromatography (HPLC) method. 3 Subsequently, the enzymatic method 4 was developed and internationally disseminated, and many manufacturers now offer KITs for GA measurement. To ensure consistency in clinical practice, the GA value of the enzymatic GA assay was designed to be consistent with that of the HPLC method. In other words, the GA value of the enzymatic method is traceable to that of the HPLC method. 4
The Diabetes Mellitus Indices (DMI) Committee of the Japan Society of Clinical Chemistry (JSCC) initiated a GA standardization project, reporting the reference range of routinely measured GA traceable to the HPLC method. 5 Subsequently, the committee developed and recommended an SI-traceable reference measurement procedure and reference material (JCRLM 611) for the determination of GA. 6 In the reference procedure, GA was determined as albumin containing lysine residues irreversibly bound to glucose. 6 This JSCC reference measurement procedure (JSCC RMP) uses isotope dilution liquid chromatography/mass spectrometry (ID-LC/MS), and GA values are expressed in mmol/mol. However, regarding the performance of JSCC RMP, only the LC/MS intra-day reproducibility (n = 10) and inter-day reproducibility (n = 15), and the correlation between the JSCC RMP and the enzyme method (n = 44) were disclosed. In the correlation study, the samples also measured using HPLC method, but the results of direct comparison between the HPLC method and the JSCC RMP was not disclosed.
On the other hand, since the GA values routinely measured as described above are traceable to the HPLC method, the Committee has developed a conversion formula to convert the reference procedure measurements (mmol/mol) to the HPLC method (%). The conversion formula between JSCC RMP and the HPLC method was recalculated using Passing–Bablok regression, based on the results obtained in the past 6 and verified using another sample.
To clarify the fundamental characteristics the basic characteristics of JSCC RMP, performance studies such as repeatability, addition recovery and limit of detection were performed and detailed explanations including traceability and uncertainty were added. Regarding the conversion formular between JSCC RMP and the HPLC method, the formular was recalculated using Passing–Bablok regression. Moreover, the JSCC RMP, there are also performance evaluation reports from two facilities.7,8 Therefore, we have also included a discussion comparing the results of present study.
Methods
Reagents and apparatus
L-Lysine Monohydrochloride (CRM 6018-a, CAS No. 657-27-2) was obtained from the National Metrology Institute of Japan (NMIJ) (Ibaraki, Japan). L-Lysine-4,4,5,5-d4 dihydrochloride (Cas No. 284664-88-6) was purchased from ISOTEC (U.S.). Nε-(1-Deoxy-D-fructos-1-yl)-L-lysine, (CAS No. 2174904-65-3), and Nε-(1-Deoxy-D-13C6-fructos-1-yl)-L-lysine were purchased form peptide research institute (Japan). JCCRM 611-1, JCCRM 611-2, and JCCRM 614-1 were purchased form the Reference Material Institute for Clinical Chemistry Standard (Japan). General reagents were purchased from FUJIFILM Wako Pure Chemical Corporation (Japan) and KANTO CHEMICAL (Japan).
Shodex-Asahipak ES-502N 20 C (100 mm × 20 mm inner diameter (ID), Showa Denko, Japan) was used for the albumin purification, LCMS TRIPLE QUAD 5500 (SCIEX, Japan) was used for MS measuring, Automated glycated albumin analyzer Hi-AUTO GAA GAA-2000 (Kyoto Daiichi Chemical Co., Ltd. now Arkray Inc.) was used for HPLC method, 3 and Lucica GA-L (Asahi Kasei Pharma) was used for Enzyme method. 4
Hi-AUTO GAA GAA-2000 measurement conditions are briefly described below. In this method, the sample (1 μL of serum) is first injected into an albumin-affinity column (50 mm × 7.6 ID, DEAE poly vinyl alcohol anion exchange gel) and eluted with eluent A at a flow rate of 1 mL/min to separate albumin fraction with an elution time of 2.0–3.0 min from other proteins. The albumin fraction is then injected into a boronic acid affinity column (100 mm × 4.0 mm ID, boronate poly vinyl alcohol affinity gel), and non-glycosylated albumin is eluted by eluent A at a flow rate of 2 mL/min. After 4.5 min from sample injection, the eluent was switched to eluent B for 1.5 min in a stepwise manner, and GA is eluted. Then, the eluent was switched back to eluent A, again.
Eluent A: 50 mmol/L glycine (pH 8.50) containing 220 mmol/L magnesium chloride and 0.1% NaN3.
Eluent B: 20 mmol/L Tris (hydroxymetyl) aminomethane (pH 8.50) containing 150 mmol/L sorbitol, 50 mmol/L EDTA, 440 mmol/L NaCl, and 0.1% NaN3.
Glycated albumin and non-glycated albumin were detected by a fluorescence detector (excitation wavelength 285 nm and emission wavelength 340 nm), and the detector output is processed by an automatic integrator. The GA value is expressed as a percentage of GA in total albumin.
Pooled serum for addition recovery test and single serums for additional correlation study are purchased from Trina Bioreactives AG (Switzerland).
The JSCC RMP for the GA
Detailed methods for the JSCC RMP for GA are provided by Takei et al. 6 A brief summary is given below.
First, albumin was isolated from serum/plasma. The stable isotopes of lysine and Nε-(1-deoxy-D-fructos-1-yl)-L-lysine (Deoxy fructosyl-lysine; DOF-Lys) as internal standards were added to the isolated albumin, followed by hydrogenation. After hydrolysis of albumin with hot hydrochloric acid, the released lysine and DOF-Lys are measured by isotope dilution liquid chromatography/mass spectrometry (ID-LC/MS) and their concentrations are determined from each isotope ratio. The concentrations of DOF-Lys (Cd, nmol/g) and total lysine (CLys, nmol/g) were determined and then the GA (mmol/mol) were calculated using the following formula. Fifty-nine is the number of lysine residues in one molecule of human serum albumin.

Measurements using JSCC RMP for GA were performed in Reference Material Institute for Clinical Chemistry Standard (ReCCS) except for inter-laboratory comparison. Measurements for inter-laboratory comparison were performed in ReCCS and Asahi Kasei Pharma.
Traceability to the international system of units (SI)
JSCC RMP requires lysine and DOF-Lys as reference materials. Traceability of the lysine concentration to SI units is ensured by using the certified reference material, NMIJ CRM 6018-a (L-lysine monohydrochloride), as the primary standards. CRM 6018-a has the certified value determined by neutralization titration as the primary method of measurement with NMIJ CRM 3001 (potassium hydrogen phthalate) and NMIJ CRM 3005-a (sodium carbonate) as the primary standards.
Traceability of DOF-Lys to SI units is ensured by quantitative nuclear magnetic resonance (qNMR) analysis using the certified reference material, DSS-d6 reference material (sodium 3-(trimethylsilyl)-1-propane-1,1,2,2,3,3-d6-sulfonate, certified by NMIJ, 92.4 ± 0.5%) as standard. qNMR is described in The Japanese Pharmacopoeia. 9
The lysine standard solution is prepared via a one-step dilution process in accordance with the gravimetric method. The DOF-Lys standard solution is prepared by a two-step dilution process, in accordance with the gravimetric method. The initial stage involves preparing the stock solution of DOF-Lys, which is then quantified through the NMR method. DOF-Lys is diluted to prepare the standard solution. The lysine and DOF-Lys solutions are combined to create calibration standards. The standard solutions for ID-LC/MS calibration have been certified as JCCRM 614-1 and are included on the Joint Committee On Traceability in Laboratory Medicine (JCTLM) list.
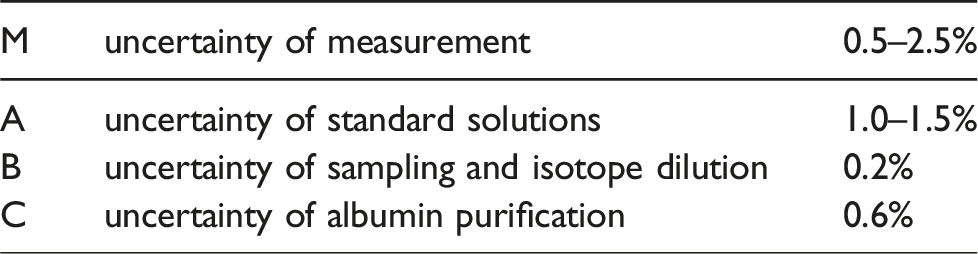
Calculation of uncertainty of measurement

Regarding the expanded uncertainty, the result will be round off to the nearest whole number. The same methodology is employed for the measurement results.
Performance study
Measurement precision
The JSCC RMP has three steps: albumin isolation, hydrochloric acid hydrolysis, and MS measurements. Three vials of albumin were isolated and three times each hydrolyzed with isotope-diluted hydrochloric acid. This produced nine vials of LC/MS samples and the LC/MS measurements were carried out six times for each sample. A pooled serum was used for sample serum.
Limit of detection (LOD) and limit of quantification (LOQ)
The measurement result in the JSCC RMP is the ratio of the concentration of DOF-Lys and lysine to the concentration of DOF-Lys. Therefore, when considering the LOD and LOQ, we need to consider DOF-Lys and lysine separately and then combine the two to calculate the LOD and LOQ for GA. First, Limit of Blank (LOB) was determined from the 95th percentile of the variation in the measurement of blank samples. LOD was calculated using the equation of LOD = LoB + 1.651 × SD, where SD is the standard deviation of the low concentration samples. LOQ was set as the concentration at which the CV did not exceed 2% after diluting the sample. Samples containing lysine and DOF-Lys solutions of different concentrations were prepared and CV values were calculated by performing quadruplicate measurements of each sample and the LOQ and LOD were determined. With regard to the LOD and LOB of GA value (mmol/mol) the JSCC RMP first isolates a specific amount of albumin, the lysine concentration of which remains nearly constant. Consequently, the LOD and LOB of GA value (mmol/mol) are estimated using the ratio of the LOD and LOB of DOF-Lys to the lysine concentration, with the lysine concentration itself being constant.
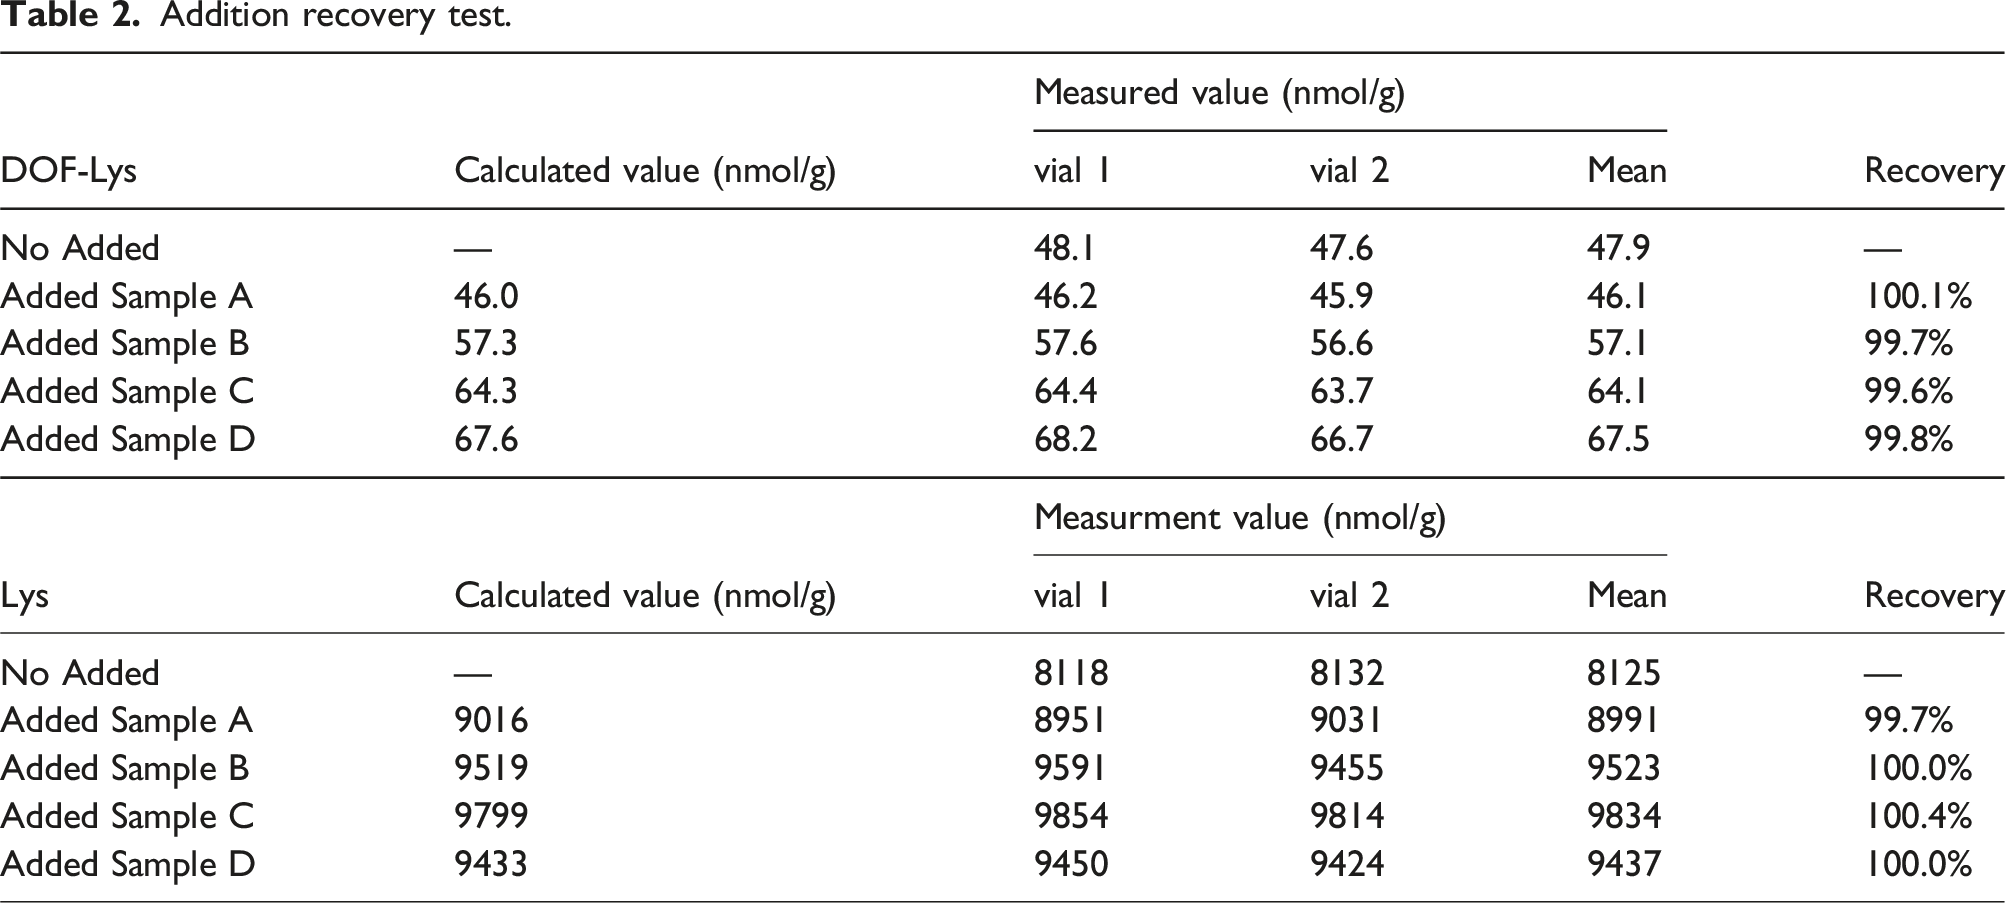
Addition recovery test
The sample albumin was obtained by isolation, washing, and concentration from the test serum according to the Ref. 6. Samples for the addition recovery test were prepared by adding known concentrations of lysine and DOF-Lys solutions to albumin samples. The added solution of known concentration was JCCRM 614-1, Standard Solutions for Measurement for GA. The samples were isotopically diluted and hydrolyzed with hydrochloric acid according to the Ref. 6. The albumin sample without additives and four samples with the addition of different concentrations of lysine and DOF-Lys were pretreated twice for LC/MS and each was measured six times by LC/MS. The calculated concentration is the result of adding the amount of added DOF-Lys and lysine to the measured results of DOF-Lys and lysine in the albumin sample without additives.
Inter-laboratory comparison of the JSCC RMP
Six serum samples were assayed in two laboratories and an inter-laboratory comparison study was performed. Three of the six samples are pooled serum, the other three samples are single serum, and the sample concentrations range from 250 mmol/mol to 830 mmol/mol.
Correlation of GA value between JSCC RMP and HPLC method
Takei et al. 6 measured the same serum (range 160–840 mmol/mol) using JSCC RMP, HPLC method, and enzymatic method and reported the correlation between JSCC RMP and enzymatic method using least squares method. The correlation of GA value between JSCC RMP and HPLC method was investigated using raw data and Passing–Bablok regression. In addition, we verified the relationship using new three pooled serum for new lot of JCCRM 611 (M, H, and HH) and seven single serums. As the HPLC method is no longer in use, the GA values measured by the enzymatic method, which are traceable to the HPLC method values, are used as the equivalent values for the HPLC method in the additional correlation study.
Statistics
All statistical analyses were performed using StatFlex version 7.0 statistical analysis software (Artech, Osaka, Japan). Measurement precision was presented as mean and coefficient of variation (CV). For the detection limit study, the regression equation was calculated by the method of least squares, and the correlation coefficient was calculated using the Pearson’s correlation coefficient. For the inter-laboratory comparison, the correlation coefficient was calculated using the intraclass correlation coefficient. Passing–Bablok regression was used to calculate the regression equation for the reference measurement procedure, the HPLC method, and the enzymatic method. Brand–Altman analysis was applied to validate the regression equation.
Results
Certified values and expanded uncertainty of measurement
The certified values and expanded uncertainties obtained using the JSCC RMP for JCCRM 611-2 (M, H, HH) were as follows.
JCCRM 611-2M: 232 mmol/mol, 9 mmol /mol
JCCRM 611-2 H: 359 mmol/mol, 14 mmol/mol
JCCRM 611-2 HH: 556 mmol/mol, 22 mmol/mol
Measurement precision
GA measurement results of pooled serum using the JSCC RMP.

Abbreviations: JSCC RMP, The Japan Society of Clinical Chemistry reference measurement procedure.
A, B, C indicate the LOT of the pretreatment. MS #1 indicates the first measurement of mass spectrometry.
MS Ave. and MS CV indicates Average and CV for MS measurements performed six times.
Isolation CV indicates CV of within albumin isolation.
The CV values for MS measurements performed six times were 1.2–2.8%, that of within albumin isolation were 0.8–1.2% and that of total precision for serum with 232.1 mmol/mol GA values was 1.1%.
Limit of detection (LOD) and limit of quantification (LOQ)
The relationship between DOF-Lys and lysine concentration and the detected value is shown in Figure 1. The CV values for each sample are shown in parentheses in the figure. Relationship between DOF-Lys (a) and lysine (b) concentration and MS area counts. Within-run repeatability (n = 4, CV) is shown in parentheses.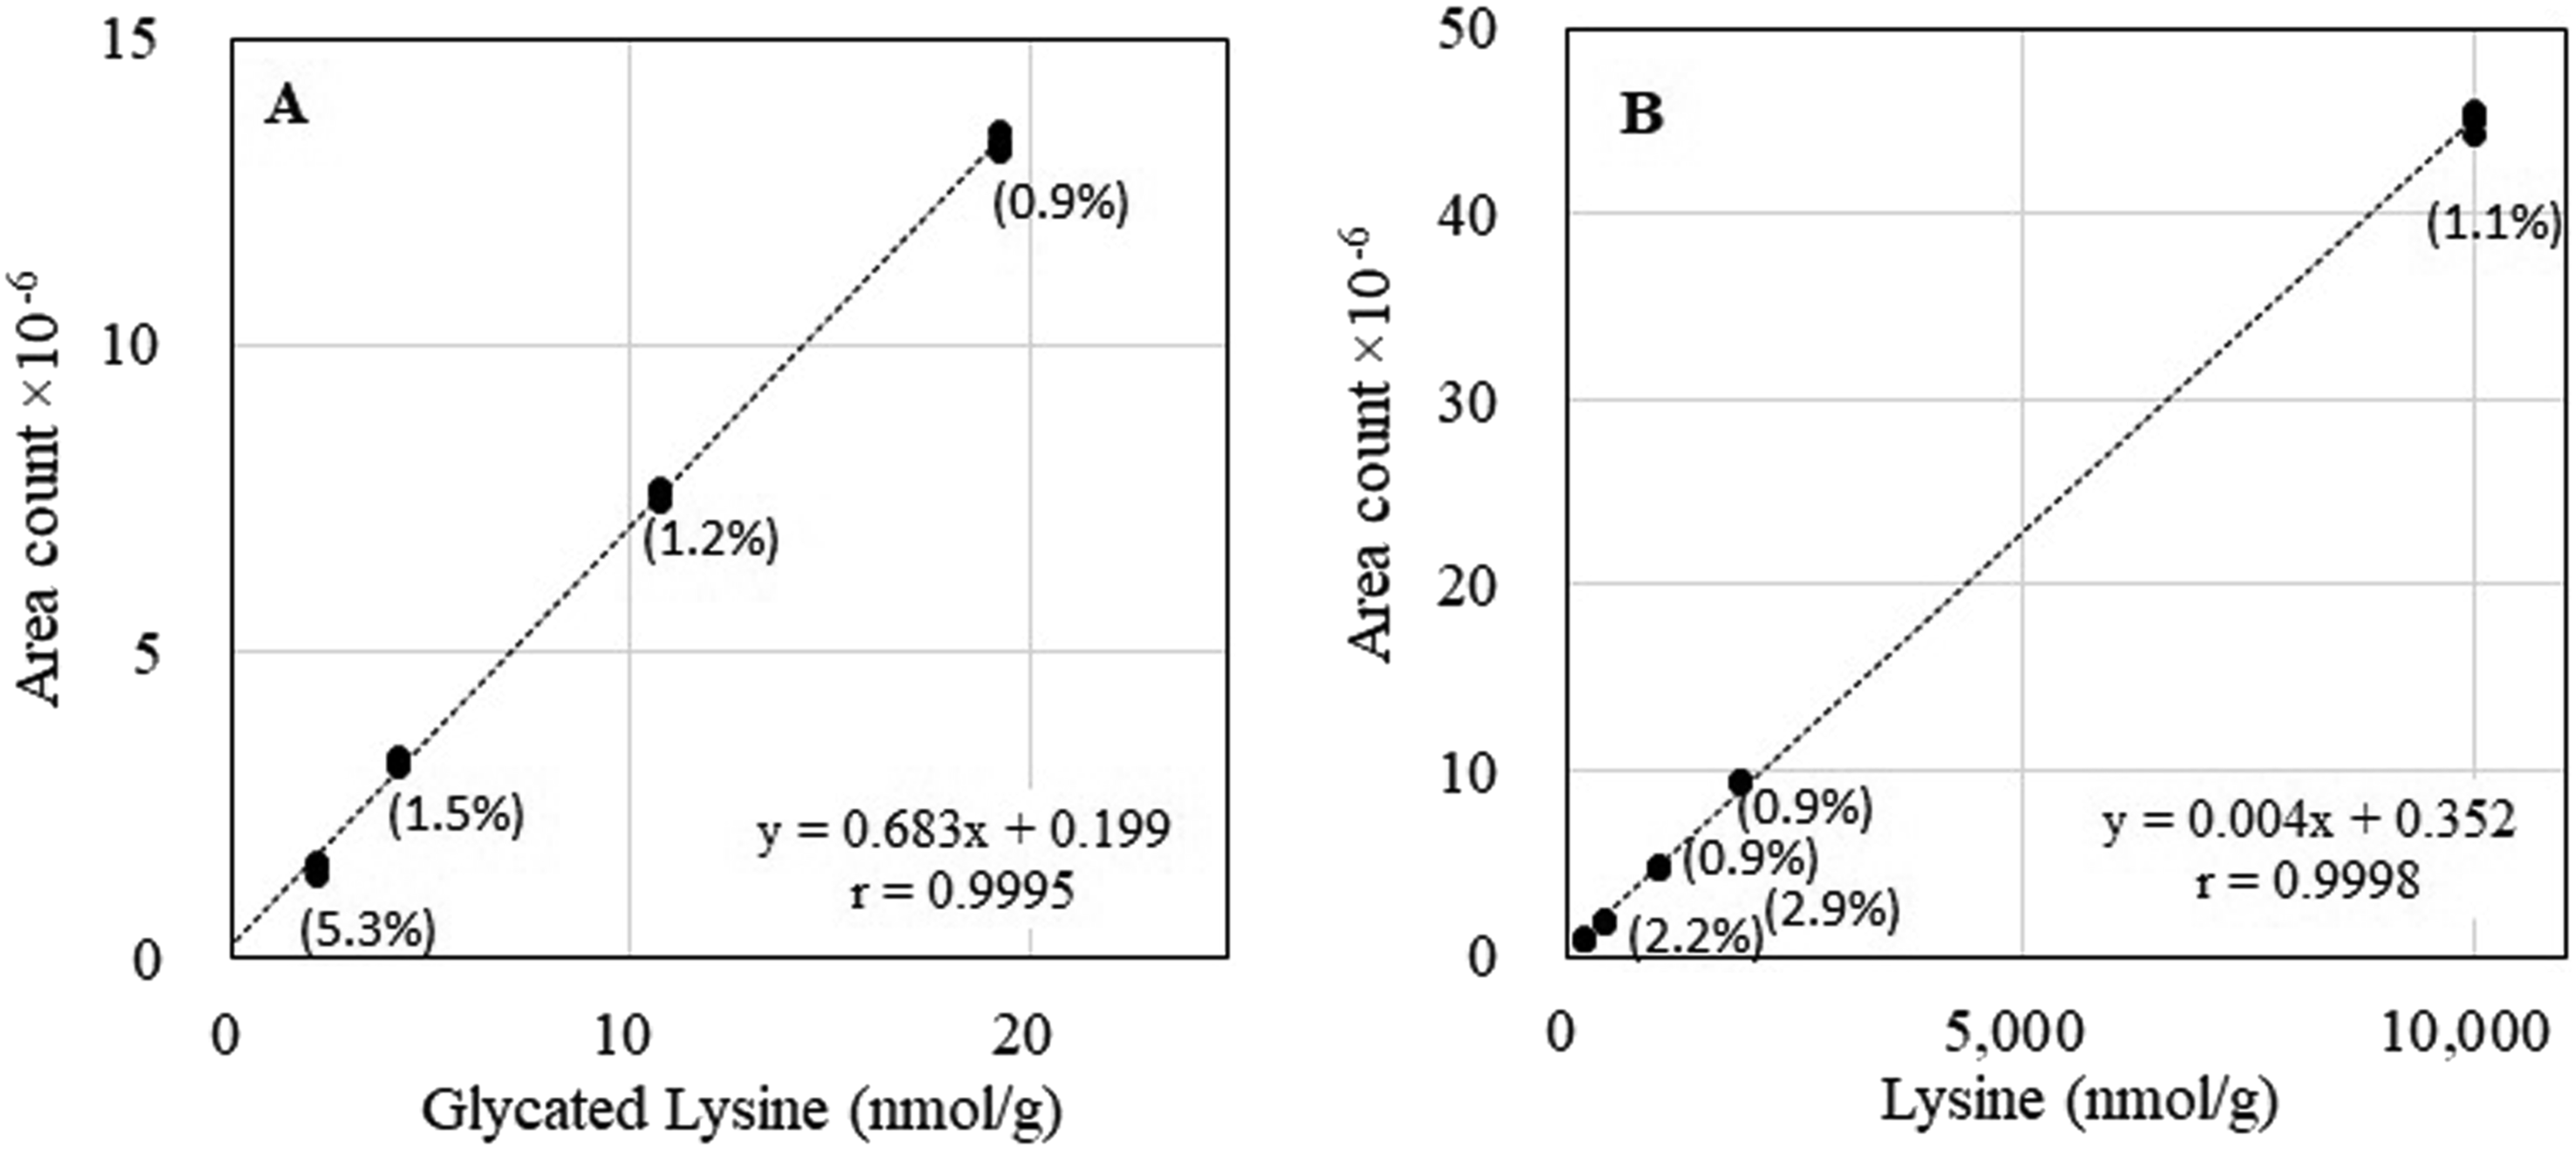
The within-run repeatability CV (n = 4) at DOF-Lys concentrations, 20, 10, 4, and 2 nmol/g were 0.9%, 1.2%, 1.5%, and 5.3%, respectively, for each concentration. Good linearity was observed over the range of concentrations measured. The results for lysine also showed good linearity in the range of 190–10000 nmol/g and the within-run repeatability CV (n = 4), 10000, 2000, 1000, 390, and 190 nmol/g were 1.1%, 0.9%, 0.9%, 2.9%, and 2.2%, respectively, for each concentration.
The LOB was calculated from the results of multiple measurements of the blank samples were 0.8 nmol/g for DOF-Lys and 87 nmol/g for Lys. The LOD values were calculated using the formula LoB + 1.651 × SD, and were 1 nmol/g for DOF-Lys and Lys 94 nmol/g. The LOQ was set as the concentration at which the CV value did not exceed 2% when the sample was diluted, and DOF-Lys 4 nmol/g, Lys 1000 nmol/g (Figure 1).
As described in the Method section, the LOD and LOB of GA value (mmol/mol) were estimated based on the ratio of the LOD and LOQ of DOF-Lys to a certain lysine concentration, assuming a constant lysine concentration.
If the LOQ for DOF-Lys is set at 4 nmol/g, the lysine concentration will always be approximately 8000 nmol/g, so that the LOQ of GA value (mmol/mol) is obtained by equation (1) shown in 2.1. Thus, LOQ for GA value (mmol/mol) was determined to be 29.5 mmol/mol.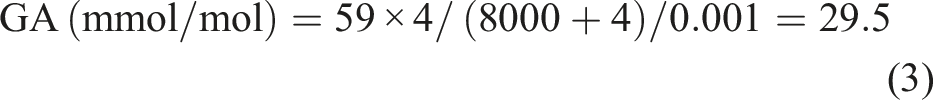
Using equation (3), LOD of GA value was calculated as 7.4 mmol/mol.
Addition recovery test
Addition recovery test.
Inter-laboratory comparison
The correlation of GA value (mmol/mol) between the measurement results of six serum samples at the two laboratories is shown in Figure 2. A high correlation was observed (r = 0.9997). Intraclass Correlation Coefficients were calculated from the results measured in 2 laboratories. The ICC(2,1) was 0.998, which is an agreement. The correlation of GA value (mmol/mol) between the measurement results of six serum samples at the two laboratories.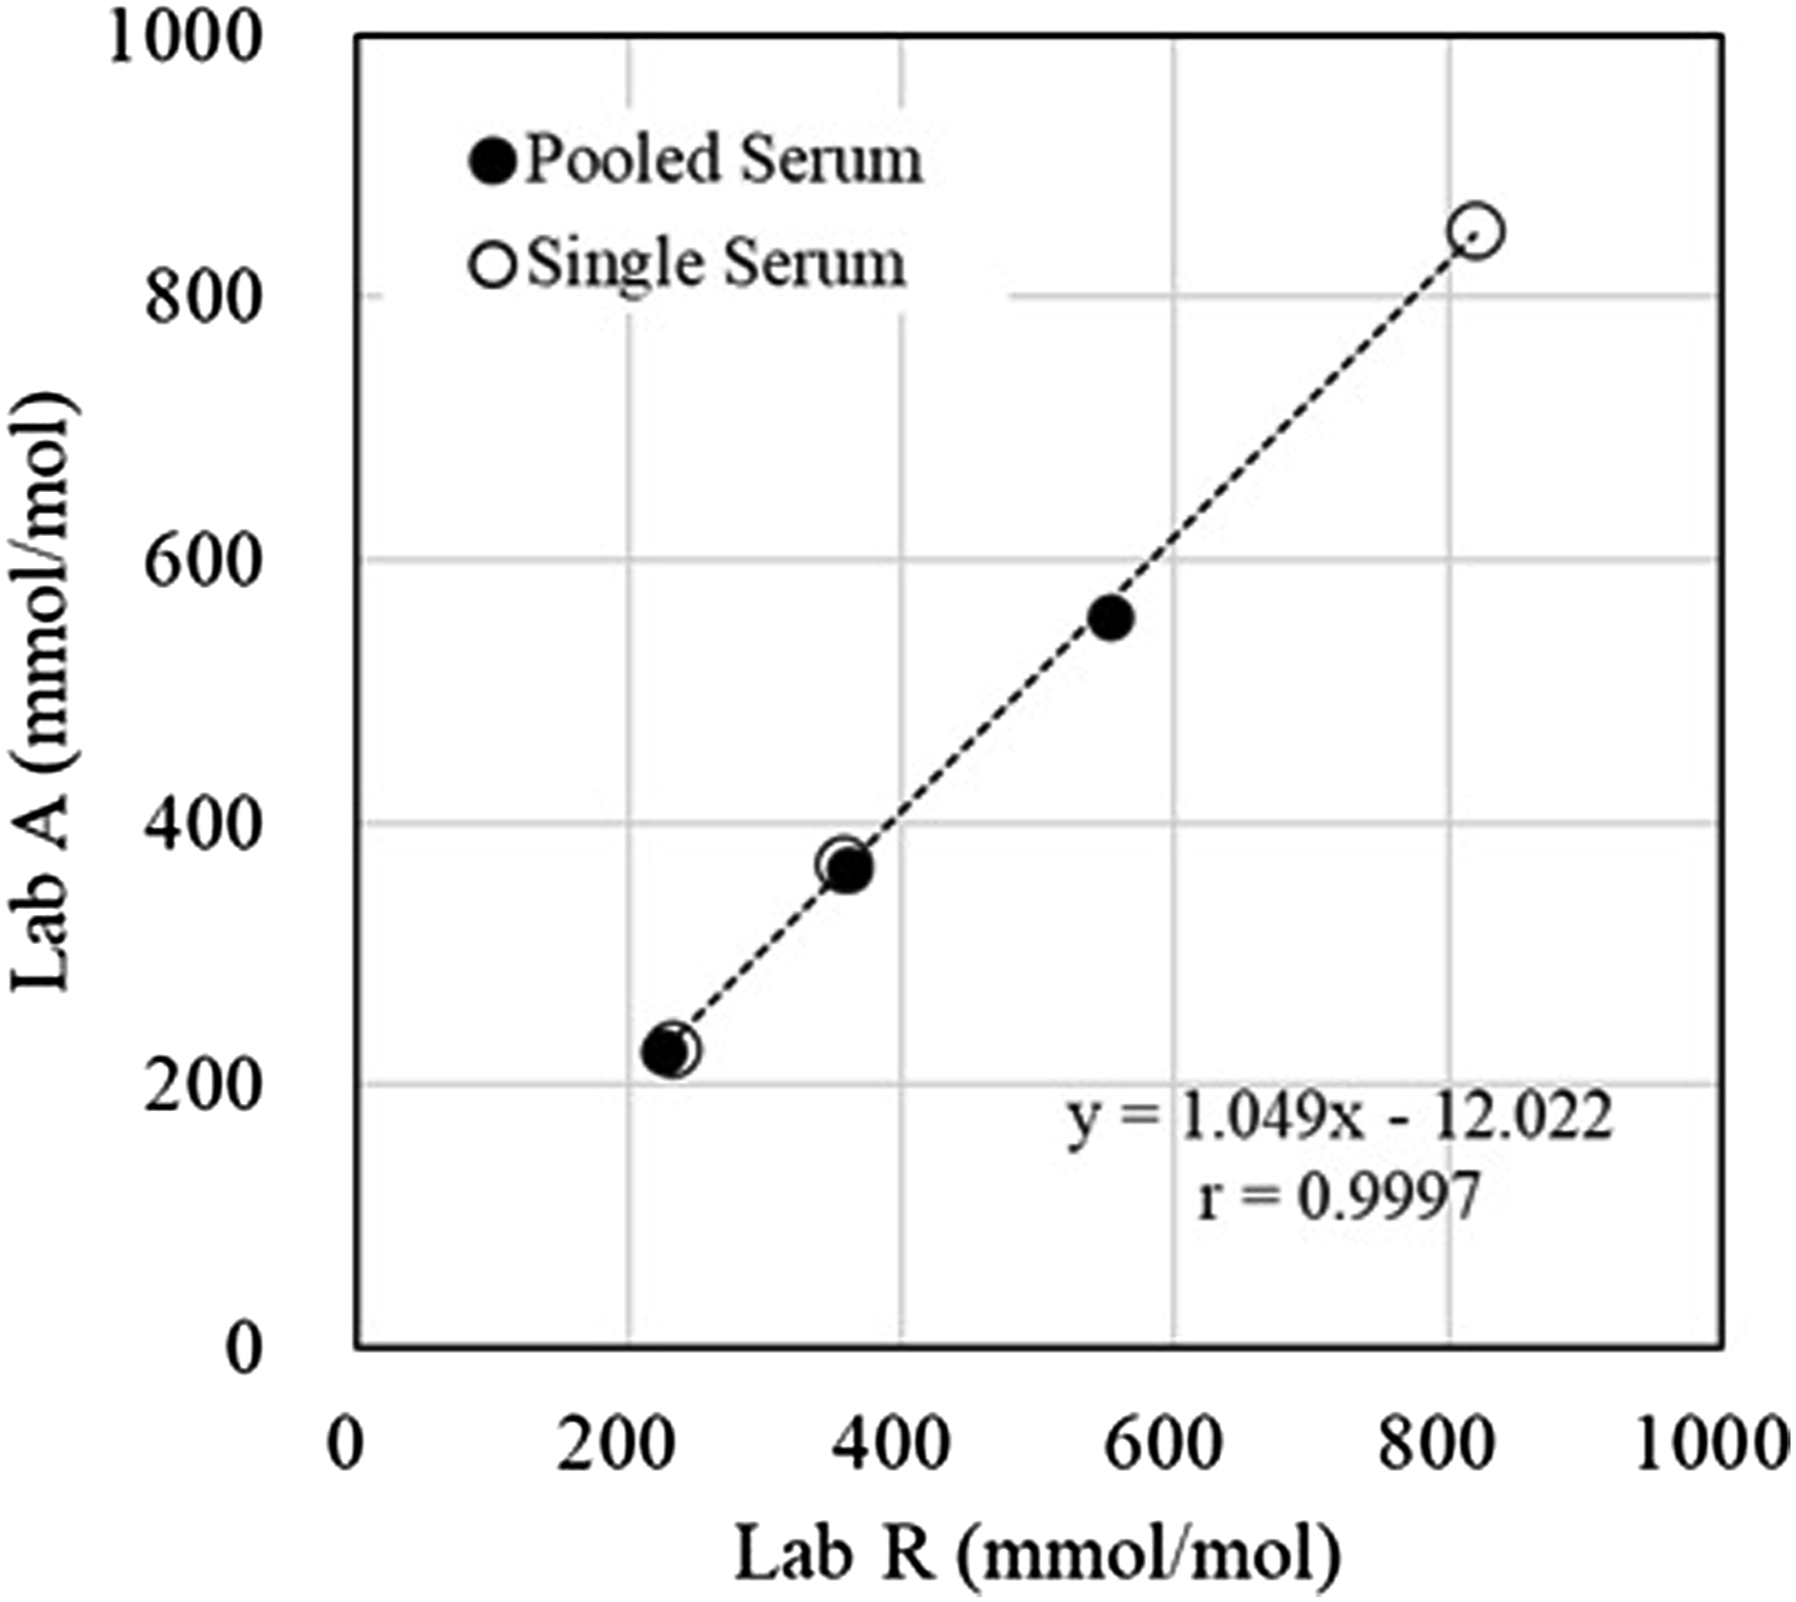
Correlation of GA value between JSCC RMP and HPLC method
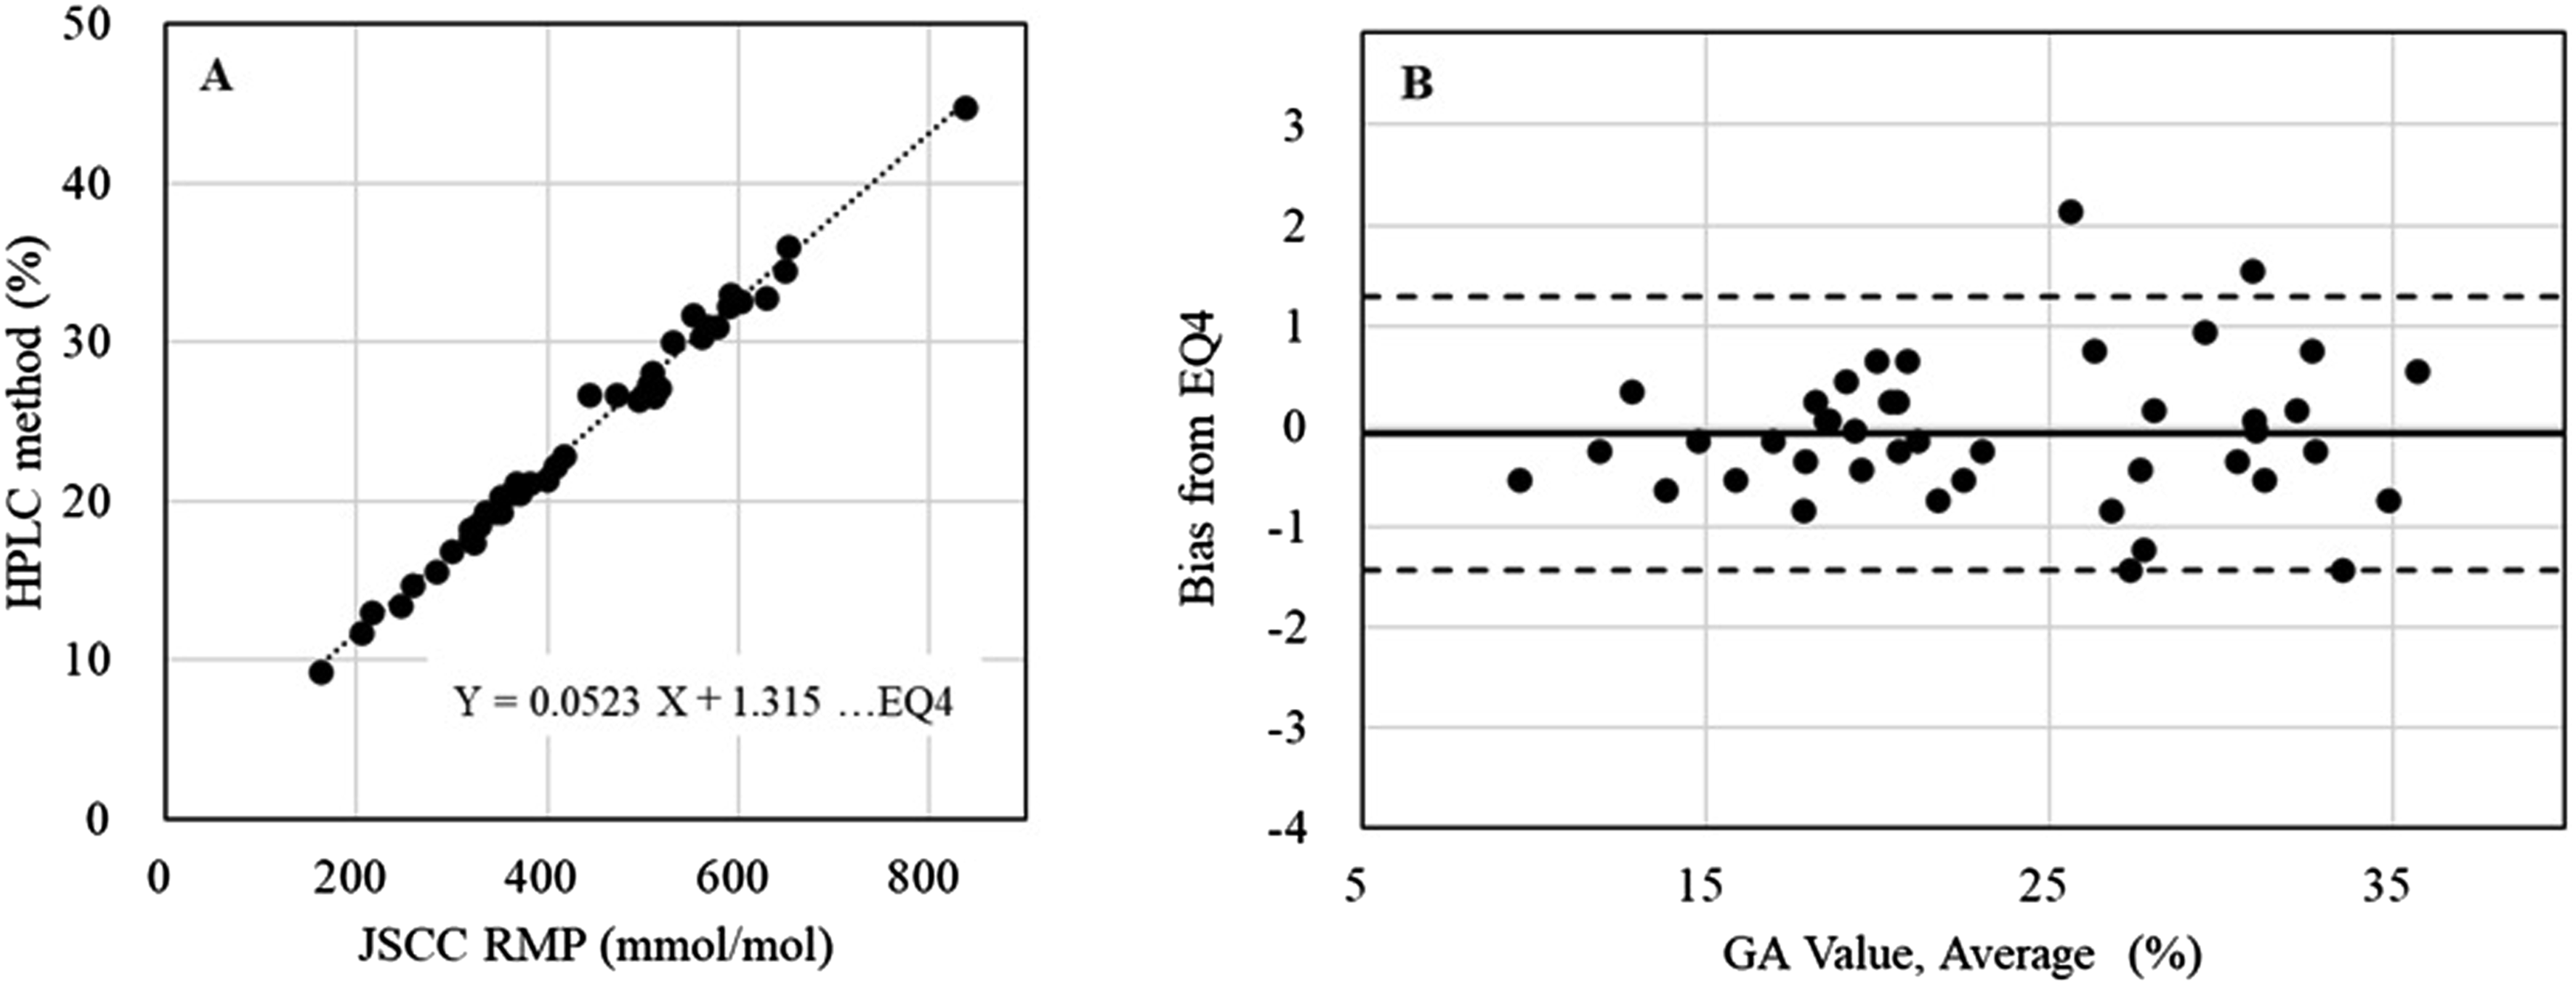
The correlation between the JSCC RMP GA (mmol/mol) and the HPLC method GA (%) was strong (n = 44, r = 0.997, Figure 3(a)). The regression equation obtained using the Passing–Bablok method is shown in equation (4). Correlation of GA value between JSCC RMP and HPLC method and validation of the regression equation. (a) Correlation of GA value between JSCC RMP and HPLC method; and (b) Plots of Brand–Altman analysis. The Y-axis shows the bias value, defined as the difference actual HPLC value minus value from equation (4). Abbreviations: JSCC RMP ID-MS.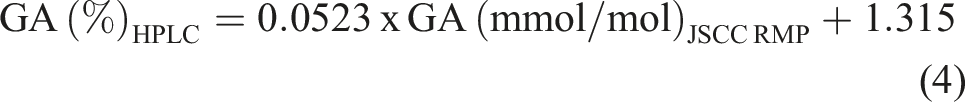
To confirm the equation (4), the three pooled serum, for the new lot of JCCRM 611-2 (M, H, and HH) and the seven single serum were newly measured this time using the enzymatic method traceable to the HPLC method and JSCC RMP. The measured values of all samples agreed with the equation (4).
To show agreement between calculated and measured values by equation (4), we show the scatter plot of Brand–Altman analysis, for the bias of the actual measurements and the values calculated by equation (4) for n = 44 in Figure 3(B). Vertical axis is the bias that the actual HPLC values from the calculated GA (%) HPLC using equation (4). Limits of agreement, 95% confidence intervals (±1.96 × SD) are indicated by dashed lines and the solid line is the mean. There are 42 plots inside the confidence limits and that shows the two values are in agreement. Intraclass Correlation Coefficients were calculated from the two values for n = 44, The ICC(2,1) was 0.987, which is an agreement too. Equation (4) can be used for Equation relating the JSCC RMP to HPLC value.
Discussions
To clarify the fundamental characteristics of the JSCC RMP, we have carried out additional performance studies and re-evaluated the data and come to the following conclusions. (1) The basic performance of the measurement (reproducibility, LOD, LOQ, addition recovery test, and correlation between two facilities) was confirmed to be satisfactory as a reference measurement procedure. (2) A strong correlation between the JSCC RMP and HPLC methods was observed, confirming the reliability of converting JSCC RMP values to the HPLC method. In other words, it was confirmed that it is possible to maintain traceability using the SI-traceable reference measurement method (mmol/mol) as an anchor, and to convert this and display the HPLC method (%).
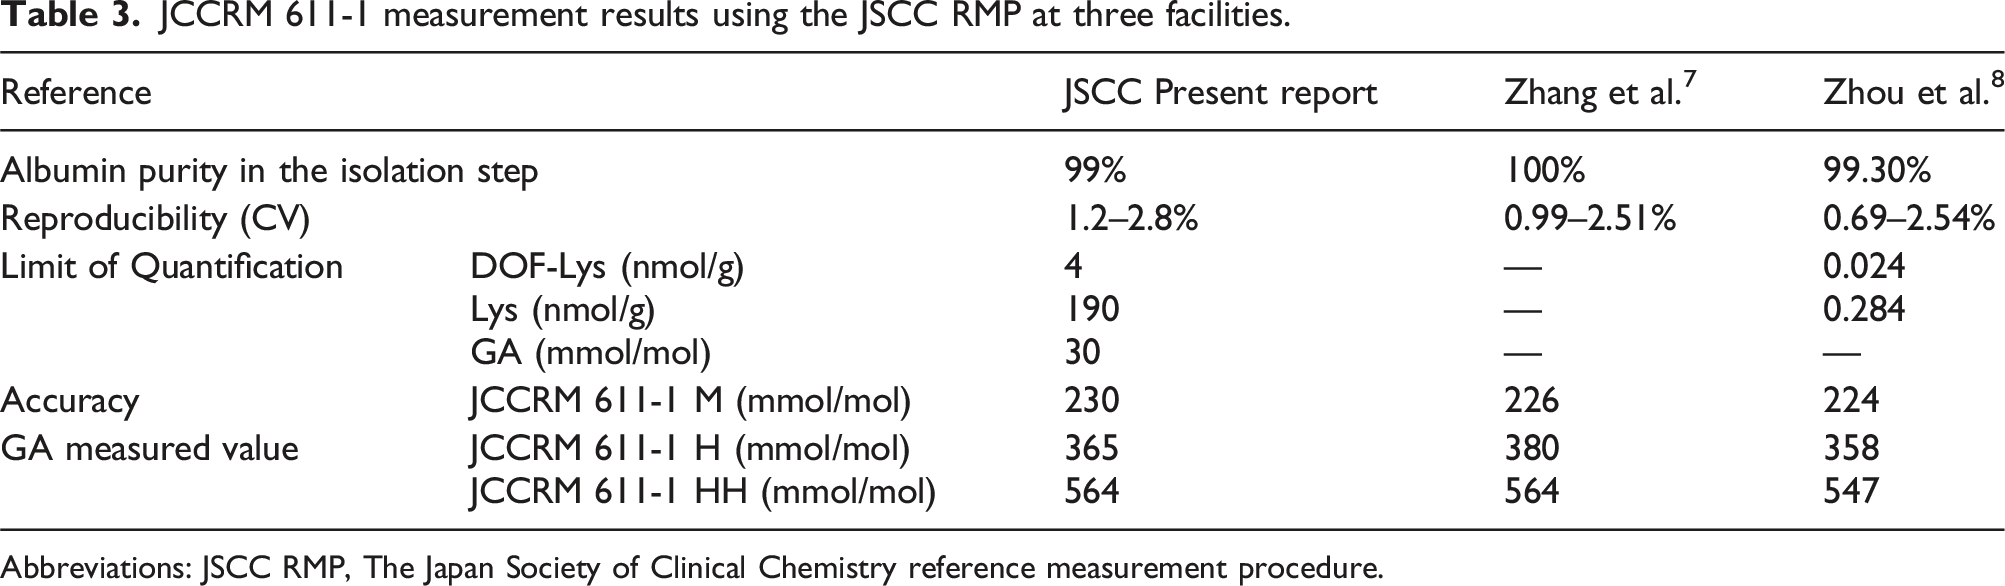
JCCRM 611-1 measurement results using the JSCC RMP at three facilities.
Abbreviations: JSCC RMP, The Japan Society of Clinical Chemistry reference measurement procedure.
Purity of ALB in the ALB isolation step
In a previous report, we reported that “The albumin sample separated from the scrum shows a single peak in HPLC using an analytical anion exchange column and a single band in electrophoresis” (native PAGE). In both cases, the amounts of coexisting proteins such as globulin and transferrin were below the limit of detection; from these results, the purity of the albumin in the sample is estimated to be at least 98%. 6 Therefore, 1.0% was used for the albumin isolation step in the calculation of the uncertainty. On the other hand, Zhou H et al. reported that the purity of Alb in this step was 100%, 7 and Zhang R et al. reported that the average purity was 99.3% with a standard SD of 0.4%. 8 It is therefore assumed that the purity of ALB purification by this method is high, and it was considered appropriate to use an uncertainty of 1%.
Reproducibility
In a previous report we reported a within-run reproducibility of CV = 1.2% (n = 10) and a daily reproducibility of CV = 1.4% (once a day for 15 days). 6 In this study, the CV values for the nine samples, including three albumin isolates and three isotope dilutions, measured six times by ID-LC/MS were 1.2%–2.8%. Even when the reproducibility of the albumin separation and hydrolysis process was included, the same good reproducibility as the previous time was observed.
On the other hand, Zhang et al. reported that “the total CVs ranged from 0.99% to 2.51%,” 7 and Zhou et al. reported that “the results of 3-day precision evaluation of low, medium, and high serum concentrations were 0.69%–1.97%, 1.13%–2.33%, and 1.37%–2.54% in intra-, inter-, and total coefficients of variation (CV).” 8 Since the CV for the JSCC RMP were almost the same and less than 3.0% (Table 3), the JSCC RMP can be performed with good reproducibility.
LOD and LOQ
In this study, we clarify the LOD and LOQ for DOF-Lys and lysine separately and then show the LOD and LOQ for GA (mmol/mol). In this study, the LOQs for DOF-Lys and lysine were considered to be approximately 4 nmol/g and 1000 nmol/g, respectively. Zhou H et al. reported that the LOQ for DOF-Lys and Lys were 0.024 nmol/g and 0.248 nmol/g, respectively. 8 Although the results obtained by Zhou H et al. are considerably lower than ours, this may be due to the performance of the LC/MS used. In any case, a sufficiently low LOQ was observed (Table 3).
Next, the LOD and LOQ for GA value (mmol/mol) was investigated, but since the JSCC RMP involves isolation of albumin and adjustment of its concentration to approximately 8000 nmol/g, the lysine concentration does not affect the LOD and LOQ for GA value (mol/mol). Therefore, the LOD and LOQ for GA value (mmol/mol) were calculated using those for DOF-Lys and a conversion formula equation (3). The obtained LOD and LOQ for GA (mmol/mol) of the JSCC RMP were 7.4 mmol/mol and 29.5 mmol/mol, respectively.
Previously, Tominaga et al. 5 determined the reference range for GA as 12.3∼16.9% using an enzyme method traceable to HPLC. Converting this reference range to JSCC RMP (mmol/mol) using the equation (4) described 3.6, it become 225∼306 mmol/mol.
The LOQ and LOD obtained in this study were 29.5 mmol/mol and 7.4 mmol/mol, respectively, which are well below the lower limit of the reference range and are considered satisfactory for the performance of the reference measurement method.
Accuracy
With regard to accuracy, we verified the measurement results of JCCRM 611-1 (Table 3) in previous reports.7,8 230 mmol/mol (uncertainty 7 mmol/mol) for JCCRM 611-1M were 226 mmol/mol and 224 mmol/mol, 365 mmol/mol (uncertainty 10 mmol/mol) for JCCRM 611-1H were 380 mmol/mol and 358 mmol/mol, and 564 mmol/mol (uncertainty 18 mmol/mol) for JCCRM 611-1HH were 564 mmol/mol and 547 mmol/mol. With the exception of the results of Zhang et al. for JCCRM-611-1H, the measurement results were within the uncertainty range and generally good accuracy was confirmed.
Correlation between JSCC reference measurement procedure and HPLC method
In this study, as described in 3.6, the results of measurements on the same samples using the JSCC Reference measurement Procedure (JSCC RMP: mmol/mol) and the HPLC method (%) were used to establish the following equation (equation (4)).
We also conducted validation of equation (4) using results of 44 samples that used for correlation study, and the calculated values and actual measured values were in good agreement in both cases. Equation (4) reflected the relationship between the JSCC RMP and the HPLC method well.
The limitations of this study
The limitations of this study are as follows. (1) The JSCC RMP is currently conducted at only one facility in Japan on a regular basis, and the number of facilities capable of conducting the JSCC RMP internationally needs to be increased in order to promote international standardization. (2) The JSCC RMP is an instrumental analysis using MASS, but since the performance of MASS is improving year by year, the amount of liquid used for pretreatment can be greatly reduced. It is desirable to modify the method as necessary to make it easier to perform according to the performance of the instruments. (3) The reproducibility was obtained with n = 6 and the correlation with n = 44, but more accurate confirmation should be possible by using a larger number of specimens. (4) The measuring GA by HPLC has been well-established by other research groups, so the measurement itself is feasible. However, the equipment used for the original data collection no longer exists and that the reproducibility of the HPLC data cannot be directly confirmed.
Conclusion
The JSCC reference procedure for GA measurement demonstrated reliable performance and robustness, with similar results obtained across multiple facilities. These findings support its suitability as a reference method for GA measurement. Furthermore, the equation for the relationship between the JSCC RMP (mmol/mol) and the values corresponding to the HPLC% used in clinical practice was also demonstrated.
Footnotes
Acknowledgements
The authors would like to thank Diagnostics Division, Asahi Kasei Pharma Corporation (currently Nagase Diagnostics Co., Ltd. as from July 2025), Tokyo, Japan for the contribution of the inter-laboratory comparison study.
Declaration of conflicting interests
The authors declared the following potential conflicts of interest with respect to the research, authorship, and/or publication of this article: K.T. is an employee of Asahi Kasei Pharma Corporation (currently Nagase Diagnostics Co., Ltd. as from July 2025). S.E. is an employee of Reference Material Institute for Clinical Chemistry Standards. Other authors declare no conflict of interest.
Funding
The authors received no financial support for the research, authorship, and/or publication of this article.
Ethical approval
Not applicable.
Guarantor
M.S.
Contributorship
All the authors have accepted responsibility for the entire content of this submitted manuscript and approved submission.