
Abstract
Objectives
The objective of this study was to develop deep learning models for the automated classification of serum protein electrophoresis (SPE) and immunofixation electrophoresis (IFE) images into oncologic, non-oncologic, and healthy categories, and to compare the predictive performance of single- and dual-modality approaches.
Methods
We retrospectively collected SPE and IFE images from 1,919 patients who underwent both tests at Kartal Dr Lütfi Kırdar City Hospital. MobileNetV2-based models were developed using transfer learning. Single-modality (SPE or IFE) and dual-modality (SPE and IFE) models were trained, and their performance was evaluated using accuracy, precision, recall, specificity, F1-score, and ROC-AUC. Grad-CAM visualizations were generated to assess model interpretability.
Results
The dual-modality model achieved higher accuracy and robustness compared to single-modality models. Oncologic cases were detected with near-perfect recall and ROC-AUC, while single-modality models demonstrated moderate performance in distinguishing non-oncologic and healthy groups. Grad-CAM outputs confirmed that the models focused on diagnostically relevant electrophoretic bands.
Conclusion
Deep learning models can reliably classify electrophoresis images into oncologic, non-oncologic, and healthy categories. Combining SPE and IFE improves diagnostic performance and may assist laboratory specialists and hematologists in reducing subjectivity, particularly in borderline cases. Validation in larger, multicenter cohorts is warranted prior to clinical implementation.
Introduction
Serum protein electrophoresis (SPE) separates major serum proteins into characteristic bands—albumin and the alpha, beta, and gamma globulin—by applying an electric field, which drives migration according to each protein’s size and net charge. 1 It is frequently employed in the diagnosis of monoclonal or polyclonal gammopathies, such as multiple myeloma (MM), Waldenström’s macroglobulinemia (WM), protein-losing enteropathies, chronic inflammatory conditions, liver diseases, and nephrotic syndrome. 1 Immunofixation electrophoresis (IFE) builds on similar affect by selectively binding antibodies to immunoglobulins in serum, revealing the presence and type of monoclonal proteins, including heavy (IgG, IgA, IgM) and light chains (kappa, lambda), allowing precise identification of monoclonal components. It is primarily utilized to determine the type of immunoglobulin responsible for a monoclonal band observed on SPE. IFE holds significant clinical value in diagnosing various hemato-oncological disorders, particularly MM and WM.2,3
Although the principles of SPE and IFE are long established, they remain central in modern hematology diagnostics. However, the accurate interpretation is dependent upon the proficiency of laboratory specialists, highlighting the critical role of experience. This reliance on subjective assessment may introduce variability in result interpretation, thereby increasing the margin of error and potentially leading to clinical misjudgments. Furthermore, reliance on expert evaluation compromises laboratory workflow efficiency, leading to prolonged turnaround times and increased workload.1,3,4 One notable interpretive challenge is analytical interference. Electrophoretic patterns can be distorted by interfering substances, ranging from endogenous proteins like hemoglobin and fibrinogen to external agents such as contrast media, antibiotics, or therapeutic antibodies. These interferences may mimic monoclonal bands and complicate interpretation.4,5
In recent years, artificial intelligence (AI) techniques—including deep learning and computer vision—have been increasingly integrated into various domains of medicine. These technologies have shown particular promise in diagnostic workflows, radiological and pathological image analysis, and clinical decision support systems.6,7,8 Their adoption has been associated with improved diagnostic accuracy, reduced workload, and enhanced operational efficiency.9,10,11,12 Despite these advances, the application of AI to electrophoresis interpretation remains limited in the current literature.
Emerging studies have begun to explore AI integration with electrophoresis. Shen et al. developed a MobileNetV2-based convolutional neural network (CNN) to detect low-concentration M-proteins in SPE, successfully identifying M-spikes often missed during manual evaluation. 13 Chabrun et al. introduced the SPECTR system, comprising four deep learning models for fractionation, anomaly detection, peak localization, and hemolysis identification, which collectively reduced observer-dependent variability. 14 Hu et al. applied a two-stage AI architecture to IFE analysis, classifying images as normal or abnormal and subsequently identifying immunoglobulin patterns using VGG-16, ResNet-18, and MobileNetV2. Their model achieved expert-level performance and incorporated Score-CAM for interpretability. 15
While these studies demonstrate promising advances, most remain technique-specific and are not yet fully integrated into routine clinical workflows. To address this gap, the present study aims to develop an AI-assisted classification model that leverages image processing and deep learning to categorize SPE and IFE images into oncological, non-oncological, and healthy groups. Additionally, the study evaluates the diagnostic utility of applying SPE and IFE individually or in combination. The overarching goal is to establish a laboratory support system that enhances diagnostic accuracy, reduces interpretation errors, streamlines workflows, and supports clinicians in diagnosis, treatment planning, and patient follow-up.
Materials and methods
In this retrospective study the data of 1919 patients aged 18 years and older who employed both SPE and IFE testing between September and December 2024 were used. SPE was performed on the Sebia Minicap system using the Protein(e) 6 kit, and IFE was carried out on the Hydrasys 2 instrument with the Hydragel 9 IF kit (Sebia S.A.S., France). To eliminate therapeutic antibody–related interference, the Sebia Hydrashift 2/4 Daratumumab kit was employed; when necessary, patient urine samples were analyzed simultaneously to confirm the results. Demographic data (age and sex), ICD-10 diagnostic codes, and corresponding SPE and IFE images were retrieved from the Hospital Information Management System and Laboratory Information System. After all data were anonymized patients were categorized into three groups based on ICD-10 codes: oncological (n = 596), non-oncological (n = 663), and healthy (n = 660). In accordance with common practices in artificial intelligence applications in medicine, our dataset was randomly divided into 70% for training, 20% for validation, and 10% for testing.16,17 The training set was used to train the model and update model parameters, whereas the validation set was used during training to optimize hyperparameters and evaluate model performance to reduce overfitting. This study was approved by the local ethics committee (25/12/2024-2024/010.99/11/6). Since this is a retrospective study, no consent was obtained; however, permission for data acquisition was obtained from the hospital administration.
Model architecture
Three models were developed: one using only SPE images, one using only IFE images, and a third combining both as input. All models shared a similar architecture to ensure consistent comparison. A pre-trained MobileNetV2—a convolutional neural network (CNN)-based model—was employed via transfer learning.18,19 The top classification layer was removed, and the input size was set to 384 × 384 × 3 pixels to enable the capture of fine-grained details, particularly those arising from variations in electrophoresis practice. To balance generalization and adaptability, only the last 50 layers were made trainable, enhancing the model’s ability to distinguish borderline cases. Training was conducted on a CPU, with each model requiring roughly 1 h and 15 min.
Data processing and augmentation
All images were standardized to 384 × 384 pixels, and their intensity values were rescaled to a 0–1 range, ensuring compatibility with the neural network input requirements. To increase data diversity and model robustness, the training images were augmented through geometric and intensity-based modifications, including rotation, zoom, shifts, shear, brightness adjustment, and flipping. These augmentation strategies were designed to enhance model robustness and generalization, enabling accurate interpretation of real-world variations—especially in samples with low band intensity. 20 For the validation and test sets, only rescaling was applied to maintain the reliability of evaluation outcomes.
Training settings and hyperparameters
Each network was trained for 30 cycles using mini-batches of 8 samples. Optimization was performed with Adam at a learning rate of 1e-4, and categorical cross-entropy served as the loss function.12,21 To improve training stability and mitigate overfitting, callbacks such as early stopping, ReduceLROnPlateau, and model checkpointing were implemented. 22 Class weighting was applied to address class imbalance, ensuring adequate representation of minority classes and enhancing overall performance. 23 Class weights were calculated based on the inverse frequency of each class in the training dataset and incorporated into the loss function during model training.
Statistical analysis
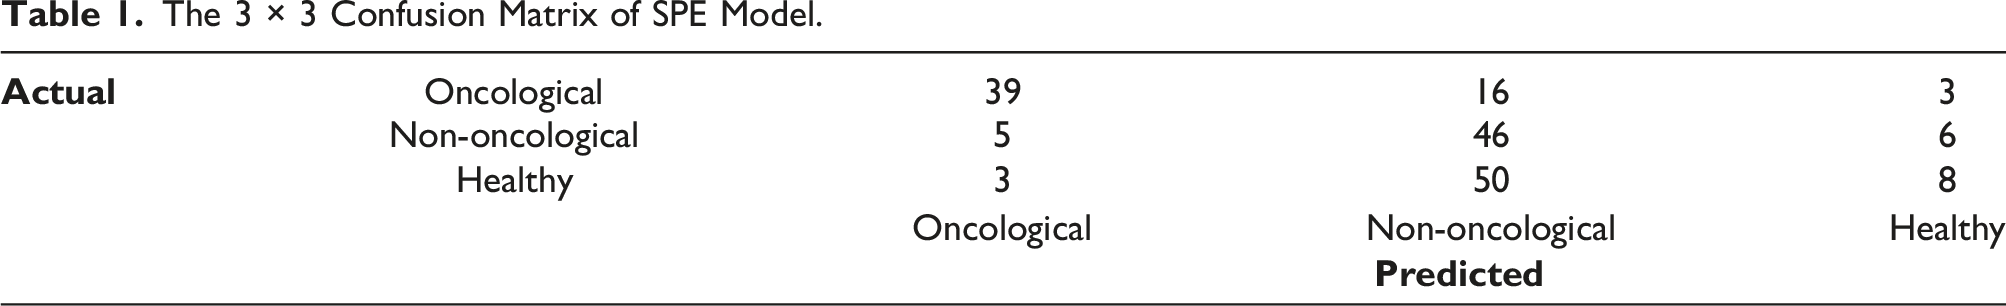
The statistical analysis of the study were performed using Python 3.10 (Python Software Foundation, DE, USA) and the libraries NumPy 1.23.5, Pandas 1.5.3, TensorFlow/Keras 2.11, Scikit-learn 1.2.2, SciPy 1.10.1 and Matplotlib 3.7.1. A 3 × 3 confusion matrix was generated to examine which classes the model tends to confuse. Correct classifications appear along the diagonal of the matrix. Model predictions were benchmarked against ground truth labels using confusion matrices, from which specificity, precision, recall, and F1-scores were derived for each class. 24 Predictions were categorized as follows: a true positive (TP) occurs when the model correctly assigns a case to its actual class; a true negative (TN) when it correctly excludes a case from a class; a false positive (FP) when it incorrectly assigns a sample to a class; and a false negative (FN) when it fails to identify a case that belongs to a class.
Model’s discrimination ability was further examined using Receiver Operating Characteristic (ROC) analysis. For the three-class setting, a one-versus-rest strategy was employed, generating separate curves for each model. The area under the curve (AUC) value of ROC analysis closer to “1” indicates the better the performance. 25
To visualize the regions, the model focuses on during decision-making, the Gradient-weighted Class Activation Mapping (Grad-CAM) method was employed. This technique generates heatmaps (attention maps) using the gradients of the last convolutional layer. These maps, overlaid on the input images, highlight the regions influencing classification decisions and enhance the interpretation of the model’s outputs. 26
Web application
After training and evaluation, each model was converted to TensorFlow Lite (TFLite) to enable efficient, low-latency performance in mobile and web environments. 18 The three TFLite models were integrated into a web application (https://www.aiphoresis.com.tr) featuring a user-friendly interface that allows users to select a model, upload a single SPE or IFE image, and receive predicted class labels along with probability scores. The Python-based backend operates via a REST API hosted on https://Render.com. User data is processed temporarily, with no permanent records stored. 17 This setup ensures secure and rapid deployment of model outputs, supporting both research applications and practical use cases.
Results
SPE model performance
The 3 × 3 Confusion Matrix of SPE Model.
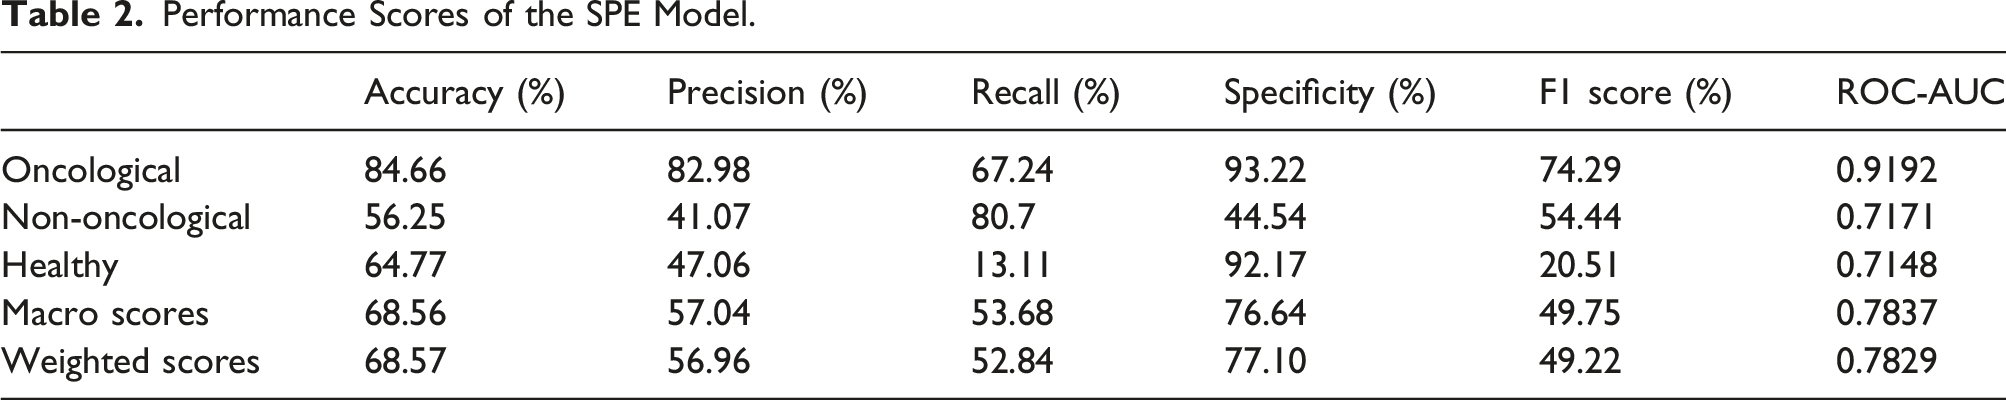
Performance Scores of the SPE Model.
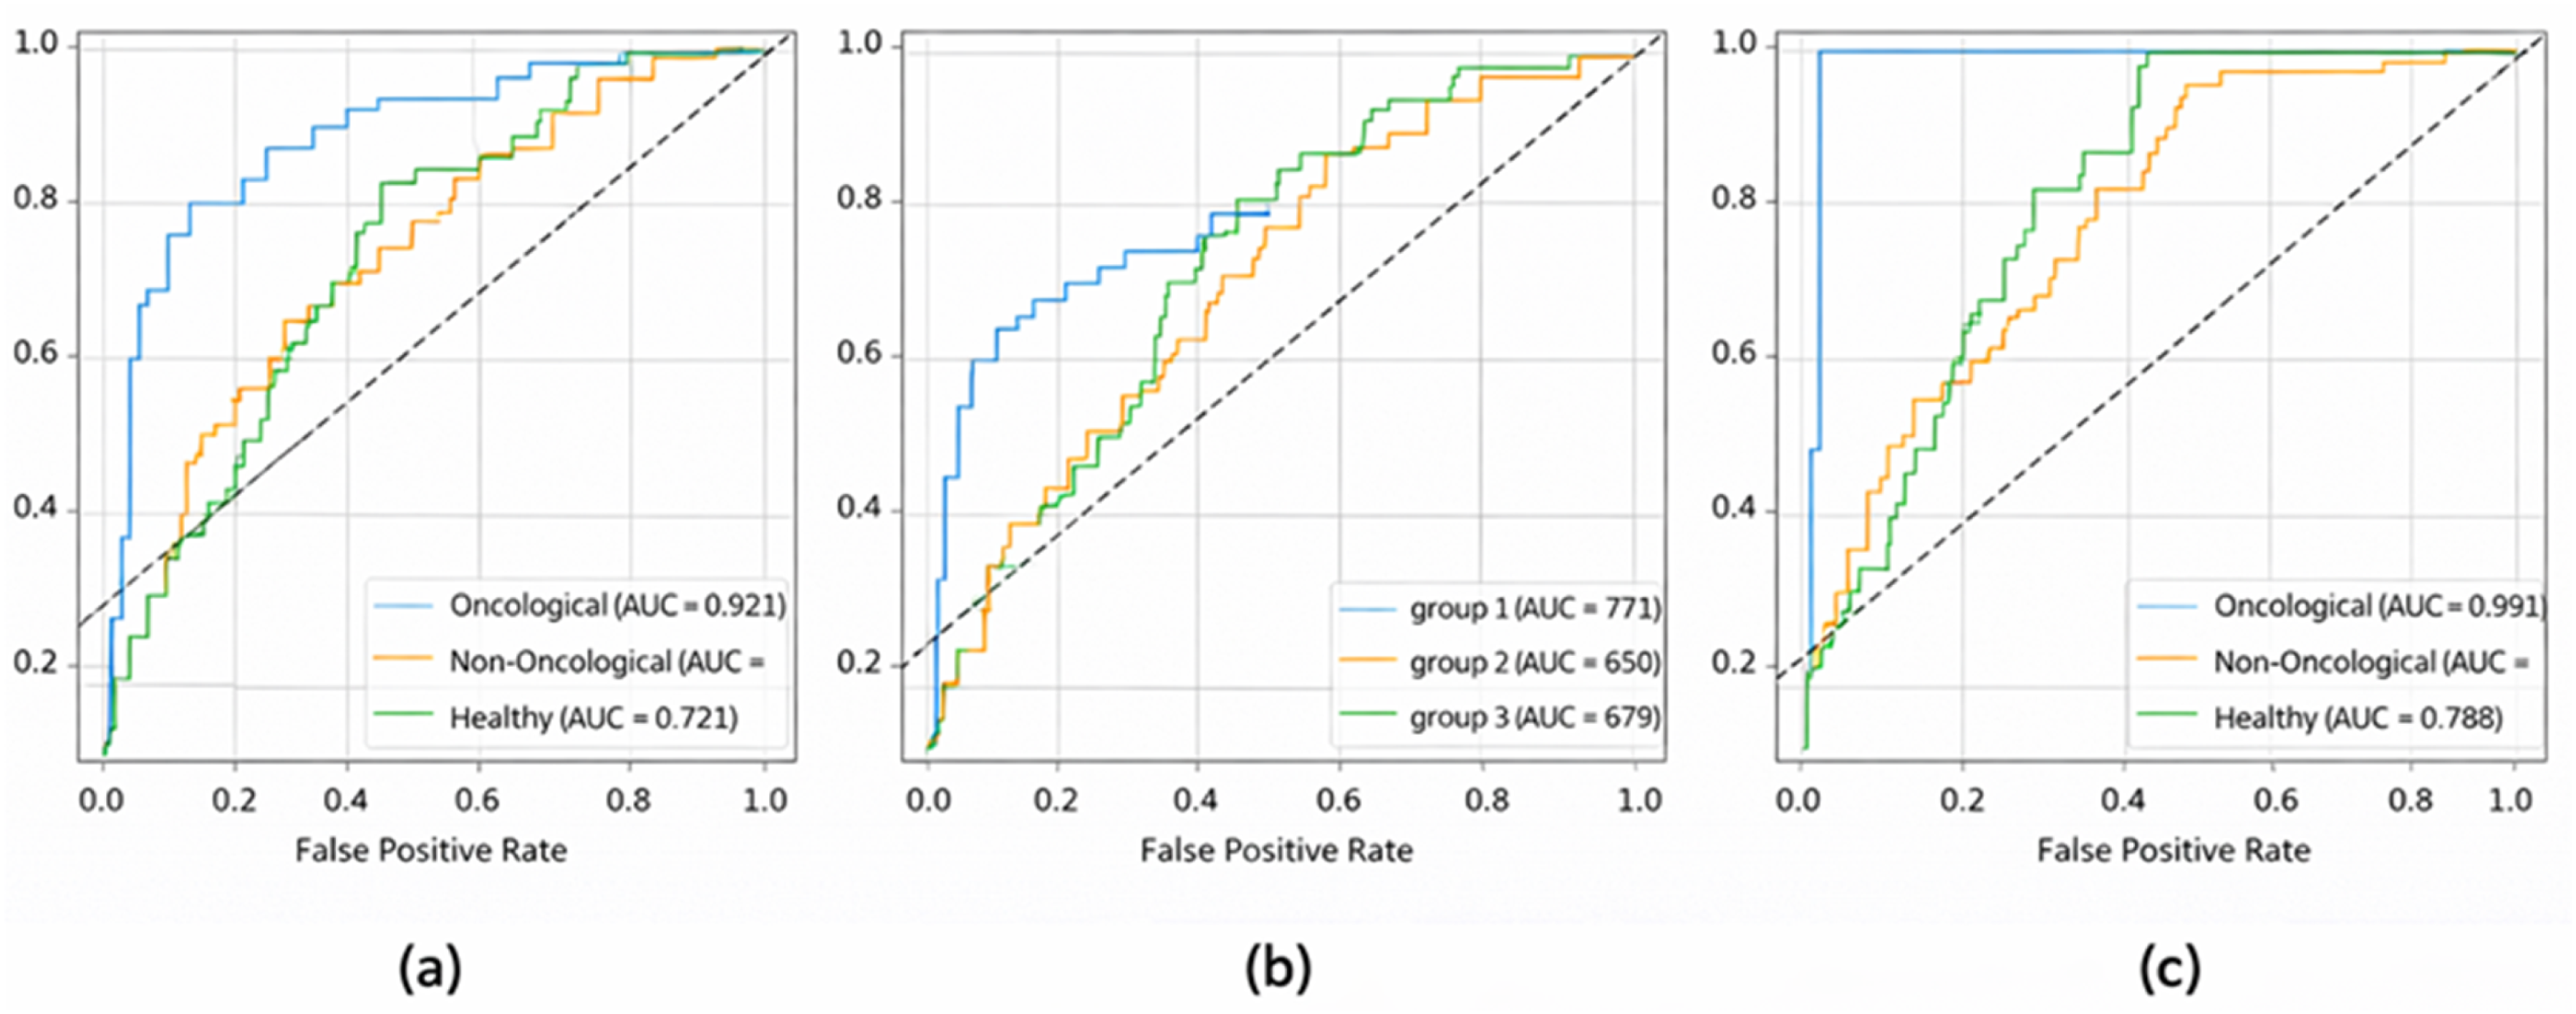
Receiver Operating Curve (ROC) of oncological, non-oncological, and healthy prediction performance of (a) SPE, (b) IFE and (c) SPE + IFE images by computer vision-based deep learning models.
IFE model performance
Confusion Matrix of IFE Model.

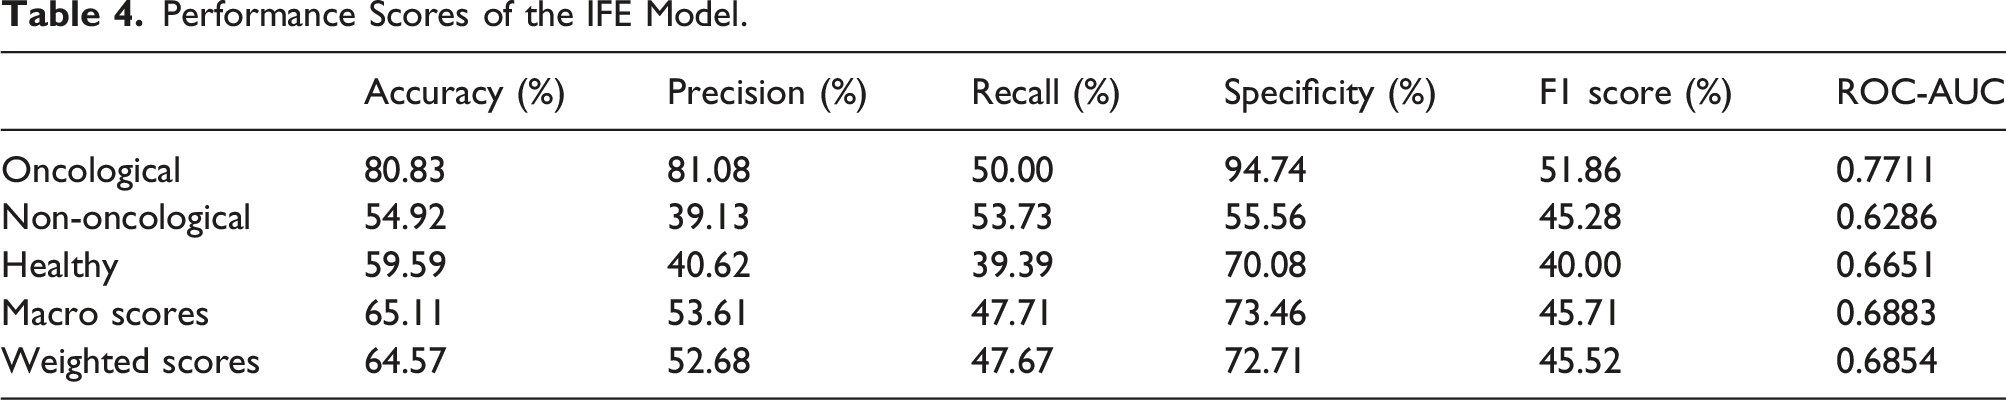
Performance Scores of the IFE Model.
Dual-input model performance
Confusion Matrix of Dual Model.

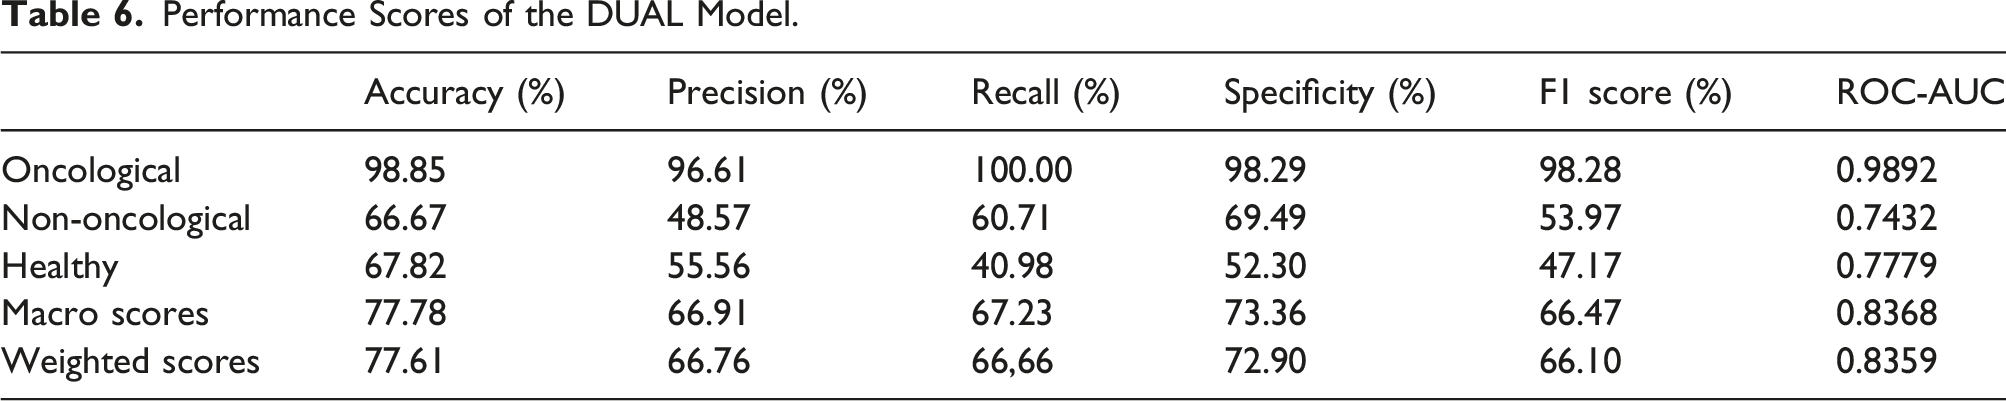
Performance Scores of the DUAL Model.
An example of SPE and IFE images, both alone and with Grad-CAM–generated visualizations of the respective models, is presented in Figures 2(a) and (b). These attention maps highlight the region’s most influential in the model’s classification decisions, offering insights into feature localization and interpretability. These visualizations further supported our findings: oncological cases exhibited focused activation over diagnostically relevant regions, while attention maps for healthy and non-oncological samples were more diffuse, reflecting model uncertainty and reduced feature saliency. SPE (a) and IFE (b) images, shown both alone and with Grad-CAM–generated visualizations of the respective computer vision–based deep learning models.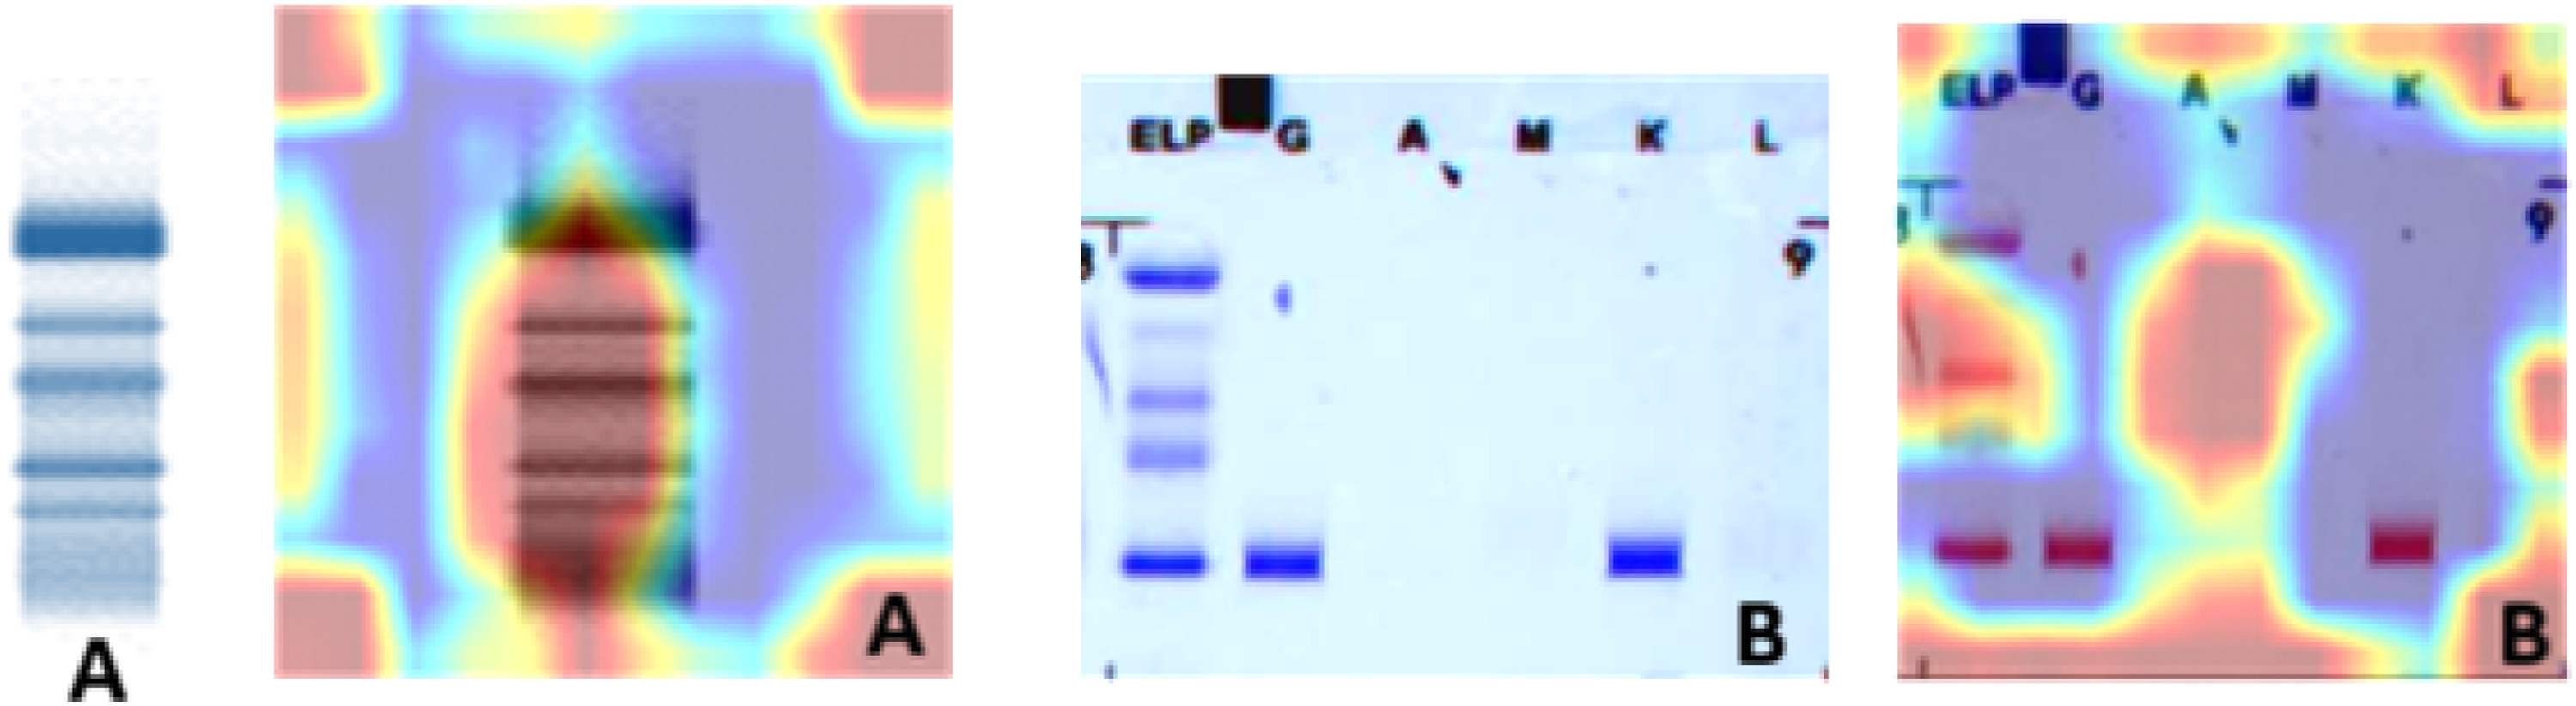
Discussion
The results of this study demonstrate that deep learning models can effectively classify SPE and IFE images into oncological, non-oncological, and healthy categories, with particularly strong performance in identifying oncological cases. These findings align with prior research highlighting the utility of artificial intelligence in enhancing electrophoresis interpretation; however, our approach introduces several novel dimensions that warrant further discussion.
Shen et al. developed a MobileNetV2-based model to detect low-concentration M-proteins in SPE, achieving high recall and successfully identifying M-spikes often missed during manual evaluation. 13 While their model focused exclusively on SPE and employed binary classification (presence vs absence of M-protein), our study expands the scope by incorporating both SPE and IFE modalities and implementing a three-class classification framework. Notably, our dual-modality model achieved near-perfect accuracy in identifying oncological cases, suggesting that combining modalities may offer superior diagnostic granularity compared to SPE alone.
Chabrun et al. introduced the SPECTR system, which utilized four specialized deep learning models to segment protein fractions, detect anomalies, localize peaks, and identify hemolysis in SPE data. 14 Their emphasis was on interpretive standardization and reducing observer variability. In contrast, our study focused on diagnostic classification rather than interpretive reporting. Nonetheless, both approaches share a common objective: minimizing subjectivity and enhancing reproducibility in electrophoresis analysis.
Hu et al. applied a two-stage architecture to IFE images, initially classifying them as normal or abnormal and subsequently identifying specific immunoglobulin patterns using multiple CNNs. 15 They reported performance comparable to specialists and enhanced interpretability using Score-CAM visualizations. Our study similarly employed computer vision techniques but aimed to classify broader clinical categories rather than specific immunoglobulin patterns. The methodological overlap—particularly the use of MobileNetV2 and multi-stage architectures—underscores the adaptability of these models across electrophoretic modalities.
A key distinction in our findings is the observed difficulty in differentiating non-oncological and healthy groups. Unlike oncological cases, which exhibited distinct electrophoretic features, the profiles of non-oncological and healthy samples often overlapped, particularly in conditions involving subtle biochemical alterations such as vitamin deficiencies. This nuance was not addressed in the referenced studies, which primarily focused on binary or anomaly-based classification. Our results highlight the need for more granular labeling and the potential integration of additional clinical parameters to improve differentiation between these groups.
Study limitations
This study has several limitations. The dataset, while tailored and clinically relevant, was drawn from a single institution within a limited study period, which may restrict the broader applicability of the findings. Diagnostic labeling relied solely on ICD-10 codes, potentially overlooking clinical nuances. Additionally, the exclusive use of MobileNetV2 and the absence of external validation or integration of clinical/laboratory metadata may constrain broader applicability.
Conclusion
In summary, while our study builds upon foundational work, it advances the field by introducing a clinically oriented, multi-class classification model that leverages both SPE and IFE data. The strong performance in oncological detection suggests promising potential for real-world implementation as a decision support tool. However, further refinement is needed to improve accuracy in more ambiguous clinical categories. Future AI-based models integrating biochemical test results with expanded multi-center datasets may enhance diagnostic granularity.
Footnotes
Funding
The authors received no financial support for the research, authorship, and/or publication of this article.
Declaration of conflicting interests
The authors declared no potential conflicts of interest with respect to the research, authorship, and/or publication of this article.
Ethical approval
■■■.
Guarantor
■■■.
Contributorship
■■■.