






Abstract
The homeostatic model assessment for insulin resistance (HOMA-IR) is one of the most commonly applied surrogate markers for the measurement of insulin resistance; however, the use of this metric does require sex-specific, age-specific, and body mass index (BMI)-specific reference ranges due to variations among populations and there is a lack of data in countries like Iraq on such reference ranges. The purpose of this investigation was to develop sex-, age-, and BMI-specific reference ranges for HOMA-IR in apparently healthy Iraqi adults aged 18 to 60 years. There were 2,160 participants enrolled in the study who were equally divided into sex-specific groups and age groups (18–30, 31–45, and 46–60 years) and BMI categories (normal weight, overweight, and obesity). In addition to measuring fasting glucose and insulin levels, the HOMA-IR was calculated. Reference ranges, which included the 2.5th and 97.5th percentiles of HOMA-IR, were developed using non-parametric statistical methods based on CLSI EP28-A3c guidelines. The results demonstrated that HOMA-IR values increased as both age and BMI increased (p < 0.001). Also, males consistently had higher HOMA-IR values compared to females within similar subgroups. All between-group comparisons were statistically significant. It is important to use sex-, age-, and BMI-specific reference intervals when interpreting HOMA-IR to avoid misclassifying subjects in clinical and epidemiologic studies. This investigation represents the first large-scale study to identify such reference intervals in Iraq and adds relevant regional data to the global research on the prevalence of insulin resistance.
Highlights
• Published the first sex, age, and BMI-specific HOMA-IR reference values in Iraq. • Utilized a CLSI EP28-A3c protocol to establish robust, population stratified reference intervals for this study. • Confirmed an association of rapid increase of HOMA-IR with BMI and age, while demonstrating that males consistently had higher scores than females. • Validated a national tool to detect early risk of developing insulin resistance.
Introduction
The pathological condition of insulin resistance (IR) lies at the root of many chronic metabolic conditions, which include type 2 diabetes mellitus (T2DM), metabolic syndrome (MetS), metabolic dysfunction–associated steatotic liver disease (MASLD), and cardiovascular diseases (CVDs).1,2 Tissue resistance to insulin causes increased levels of insulin to be released into circulation and disrupts normal glucose metabolism. For this reason, early identification of IR is critical for the prevention, risk stratification, and treatment of various metabolic disorders; particularly in regions of rapid epidemiologic transition—the Middle East.
The most commonly used tool for estimating IR in the context of clinical and epidemiological research is the HOMA-IR developed in 1985 by Matthews et al. 3 The HOMA-IR utilizes fasting plasma insulin (FPI) and fasting blood glucose (FBG) concentration values to calculate an indirect measurement of hepatic insulin sensitivity and pancreatic β-cell function. Although the hyperinsulinemic-euglycemic clamp (the “gold standard”) provides the most precise measurements of insulin action and glucose homeostasis, it is also the most costly and difficult to perform on a large scale. Therefore, HOMA-IR is useful as a low-cost, relatively easy-to-perform, and minimally invasive means of measuring insulin action that has been shown to correlate with the clamp in both healthy and diabetic subjects.4,5
The wide-spread utilization of HOMA-IR has been hampered by the lack of universally accepted cut-offs for the test’s result interpretation. Studies have demonstrated that the reference values used for HOMA-IR vary with several factors including ethnicity, age, sex, BMI, and pubertal status, as well as population-specific factors such as lifestyle (diet and physical activity),6–8 which will necessitate the creation of local reference ranges to properly interpret HOMA-IR results in both clinical and research environments.
There is now substantial evidence demonstrating the existence of significant variations in the distribution of HOMA-IR among different ethnic groups. A major U.S.-based study utilizing data from NHANES found that HOMA-IR values in non-Hispanic Blacks and Hispanics were greater than those observed in non-Hispanic White participants when adjusted for BMI and age. 9 By comparison, many Asian populations are characterized by higher levels of insulin sensitivity; however, they also demonstrate a high incidence of developing T2DM at relatively low BMI levels and thus represent a distinct metabolic pathway. 10 As a result, some researchers have started establishing HOMA-IR cut-offs that are specific to their respective geographic regions to help more accurately portray the local metabolic risks.
Several studies in Middle East countries have investigated determining HOMA-IR cut-offs for MetS and T2DM using criteria established in studies from Iran and Saudi Arabia. Esteghamati et al., in an Iranian cohort, identified an HOMA-IR cut-off of 1.775 for MetS based on Receiver Operating Characteristic Curve (ROC) analysis, 11 whereas Al-Daghri et al., in a cohort of overweight and obese children and adolescents from Saudi Arabia identified HOMA-IR values that were greater than the cohort of normal weight children and adolescents, further indicating the necessity for a localized benchmark. 12 These studies primarily utilized the population to classify diseases but did not focus on developing reference ranges for the healthy population.
The Clinical and Laboratory Standards Institute (CLSI) has published a standard (EP28-A3c), which provides guidance on how to develop reference ranges. The CLSI requires a minimum of 120 subjects for each sub-group (age, sex, BMI) to develop reference ranges utilizing nonparametric statistical methodology with 90% confidence. 13 Few studies in the region have employed this methodologically sound approach. Many of the regional studies do not report data simultaneously stratified by the relevant variables (sex, age groups, and BMI categories) and therefore may limit the clinical utility of the data reported.
Published studies in Iraq have not identified any reference ranges for HOMA-IR in the general adult population utilizing CLSI-compliant methodology. Thus, this presents an enormous void in both metabolic research and clinical diagnostics in this region. The Middle East is currently undergoing significant changes in terms of obesity and T2DM due to factors such as urbanization, sedentary lifestyles, and diet changes that are associated with post-conflict living.14,15 According to the World Health Organization (WHO) more than 60 percent of Iraqi adults are overweight or obese, and approximately 12 percent of the population suffer from diabetes, with the WHO indicating that these numbers may be underestimated. 16
Therefore, in light of the current public health crisis, there is an urgent need for reliable diagnostic tools. By establishing reference ranges for HOMA-IR specific to the Iraqi population, it will provide clinicians with the ability to identify individuals who are at risk for developing metabolic disease early on; thus, enabling them to implement appropriate lifestyle and/or pharmacological interventions. Additionally, through the inclusion of subgroups based upon sex, age, and BMI, clinicians will be able to utilize HOMA-IR as a more refined and individualized indicator of insulin resistance.
Recent initiatives internationally advocate for use of population-specific reference ranges in precision medicine projects. For instance, a recent study conducted by Zhang et al. (2023) in China produced the first comprehensive set of HOMA-IR percentiles for >5000 Chinese adults, with data collected from adults living in both urban and rural locations and who were categorized according to their age and BMI, using CLSI guidelines. 17 A similar initiative was taken by López et al. (2022). Lopez et al. established age- and gender-specific reference ranges for HOMA-IR in a cohort of Spanish adolescents and highlighted the need for use of region-specific reference values for accurate risk assessment for metabolic syndrome. 18 Together these studies demonstrate an increasing movement towards the development and use of evidence-based, standardized, and regionally relevant reference values for metabolic biomarkers; thus, this study will attempt to follow this trend and develop region-specific reference values for HOMA-IR in the Iraqi population.
Overall, despite the fact that HOMA-IR has been validated as an effective means for detecting insulin resistance and is cost-effective, it cannot be used clinically in Iraq effectively due to lack of reference ranges for HOMA-IR that are specific to the Iraqi population. Therefore, the purpose of this study is to establish HOMA-IR reference intervals for healthy adult Iraqi males and females, categorized by sex, age group, and BMI, based on the EP28-A3c CLSI protocol. The results from this study will have significant and direct implications for the improvement of diagnostic accuracy, patient care, and public health policy in Iraq.
Methods
Study design and setting
The design of this study is that of an observational population-based cross-sectional study with the purpose of determining sex, age, and BMI-specific reference values for HOMA-IR in a representative sample of healthy Iraqi adults. The study took place over the period from December 2021 through November 2025 at multiple urban and semi-urban health clinics in Baghdad, Iraq, in order to provide a diverse representation of various socio-economic demographics. All participants provided their verbal consent, and the study received ethics committee and institutional review board approval from the Ethics Committee and Institutional Review Board of the College of Applied Sciences/University of Technology as required by the Declaration of Helsinki.
Participant recruitment and eligibility criteria
Participants were recruited by using a variety of methods that included community outreach, local clinics, and hospitals. Screening was accomplished by conducting structured interviews and performing preliminary physical examinations. Participants were eligible to participate if they had a BMI of ≥18.5 kg/m2, were willing to provide informed consent and follow all study procedures, and if they met the age requirements of being between 18 and 60 years old. All participants needed to have been an Iraqi national and lived permanently in Iraq for the last 5 years. In addition, participants should be fasting for 8 to 12 hours prior to taking their blood sample. The following exclusion criteria were used to exclude individuals who may have confounding effects on insulin and glucose metabolism: • History of diabetes mellitus either self-reported or based on a fasting plasma glucose level ≥126 mg/dL. • Hypertension as diagnosed (BP ≥140/90 mmHg or currently taking antihypertensive medication). • Any endocrine disorder (thyroid, adrenal, or pituitary). • Currently taking any of the following types of medication known to affect glucose or insulin levels (e.g., corticosteroids, β-blockers, oral hypoglycemics, or insulin). • Liver or kidney disease. • History of an acute illness within 4 weeks of participation. • Current alcohol or illicit drug use. • Pregnant or breastfeeding.
Sample size and stratification plan
According to CLSI EP28-A3c recommendations, there should be a minimum of 120 participants in each subgroup to obtain the recommended number of values to generate a reference range using non-parametric methods; therefore, to enable strong stratification of participant subgroups, the participants were divided into three groups based on sex (male/female): Age groups: 18–30, 31–45, and 46–60 years. BMI groups: Normal weight (18.5–24.9 kg/m2), overweight (25.0–29.9 kg/m2), and obese (≥30.0 kg/m2).
The categorization above resulted in 18 different subgroups (3 age strata x 3 BMI strata x 2 sex strata). Therefore, it was determined that a minimum total of 2160 participants would need to be sampled to provide adequate numbers in all of the subgroups and to accommodate for oversampling to compensate for potential dropouts or to exclude some participants from the analysis.
Stratified enrollment methods were used in order to recruit participants so that there would be an appropriate representation by sex, age, and BMI, as described by the CLSI guidelines for establishing reference intervals (EP28-A3C). The prospective allocation of participants to predetermined strata (sex x age group x BMI category) occurred during participant recruitment. In addition, the process of enrolling participants within each defined stratum continued until the minimum of 120 eligible participants per stratum had been recruited. When the requisite number of participants in a particular subgroup had been enrolled, the recruitment for that subgroup was terminated while recruitment for all other strata proceeded. No post-hoc trimming of eligible participants was done to create the same size subgroups.
A participant flow diagram, which summarizes screening, exclusion, stratified recruitment, and the final number of participants in each group, is presented in supplementary figure 1.
Anthropometric and clinical data collection
Anthropometry measures were assessed for all participants via standardized methods that had been administered by trained personnel. Weight measurements were taken to the nearest 0.1 kilogram, using a calibrated digital scale; height measurements were taken to the nearest 0.1 centimeter, utilizing a stadiometer. The BMI was determined as the participant’s weight (in kilograms) divided by their height (in meters squared). Blood pressure readings were obtained from each participant while they sat down with a five-minute period of rest prior to measurement, using a calibrated sphygmomanometer. Demographic information (e.g., age, sex, and education level); lifestyle (i.e., smoking status and physical activity level); and medical history information were collected through administration of a structured questionnaire.
Sample collection and measurement of fasting plasma glucose and insulin
Blood samples from veins were taken during a morning time frame (between 8:00 and 10:00 AM) after participants had fasted for at least 8 h but no more than 12 h. The plasma glucose measurements via the enzymatic hexokinase method and the fasting insulin measurements via the Roche Cobas e411 analyzer were completed within 2 h of sample collection. Analytical accuracy was ensured by use of internal and external quality control processes. In addition, the reproducibility of results was verified by performing duplicate analyses on 5% of randomly selected samples. Coefficients of variation (CV) for the glucose assay and insulin assay were maintained at less than 3% and less than 6%, respectively.
Calculation of HOMA-IR index
The HOMA-IR index was calculated using the following validated formula 19 : HOMA-IR = Fasting Glucose (mg/dL) × Fasting Insulin (µU/mL)/405.
Statistical analysis
IBM SPSS Statistics v. 27.0 and R Software Version 4.3.1 were used for statistical analysis. The continuous variables were described using mean ± standard deviation (SD), for descriptive purposes. However, because the HOMA-IR values did not follow a normal distribution, a nonparametric statistical test was used to compare groups as well as estimate reference intervals. Nonparametric Shapiro-Wilk and Kolmogorov-Smirnov Tests were employed to assess normality of HOMA-IR distribution.
The Dixon and Tukey tests were applied as outlier screening methods in order to evaluate whether there existed outliers for any of the individual subgroups. Since none of the subjects in this study exceeded the threshold established by these tests, no data points had been removed based on their classification as an outlier. All subgroups continued to have a number of 120. The Mann-Whitney U Test was utilized for comparing two groups (i.e., sex differences), while the Kruskal-Wallis Test was used for comparison among multiple groups (i.e., age and BMI categories). The Bonferroni Correction was utilized for post-hoc pairwise comparisons. Correlation analysis was used to examine associations between HOMA-IR and continuous predictors (i.e., age and BMI) utilizing Pearson and Spearman’s rank correlations. Statistical significance was defined as a two-tailed p-value less than 0.05.
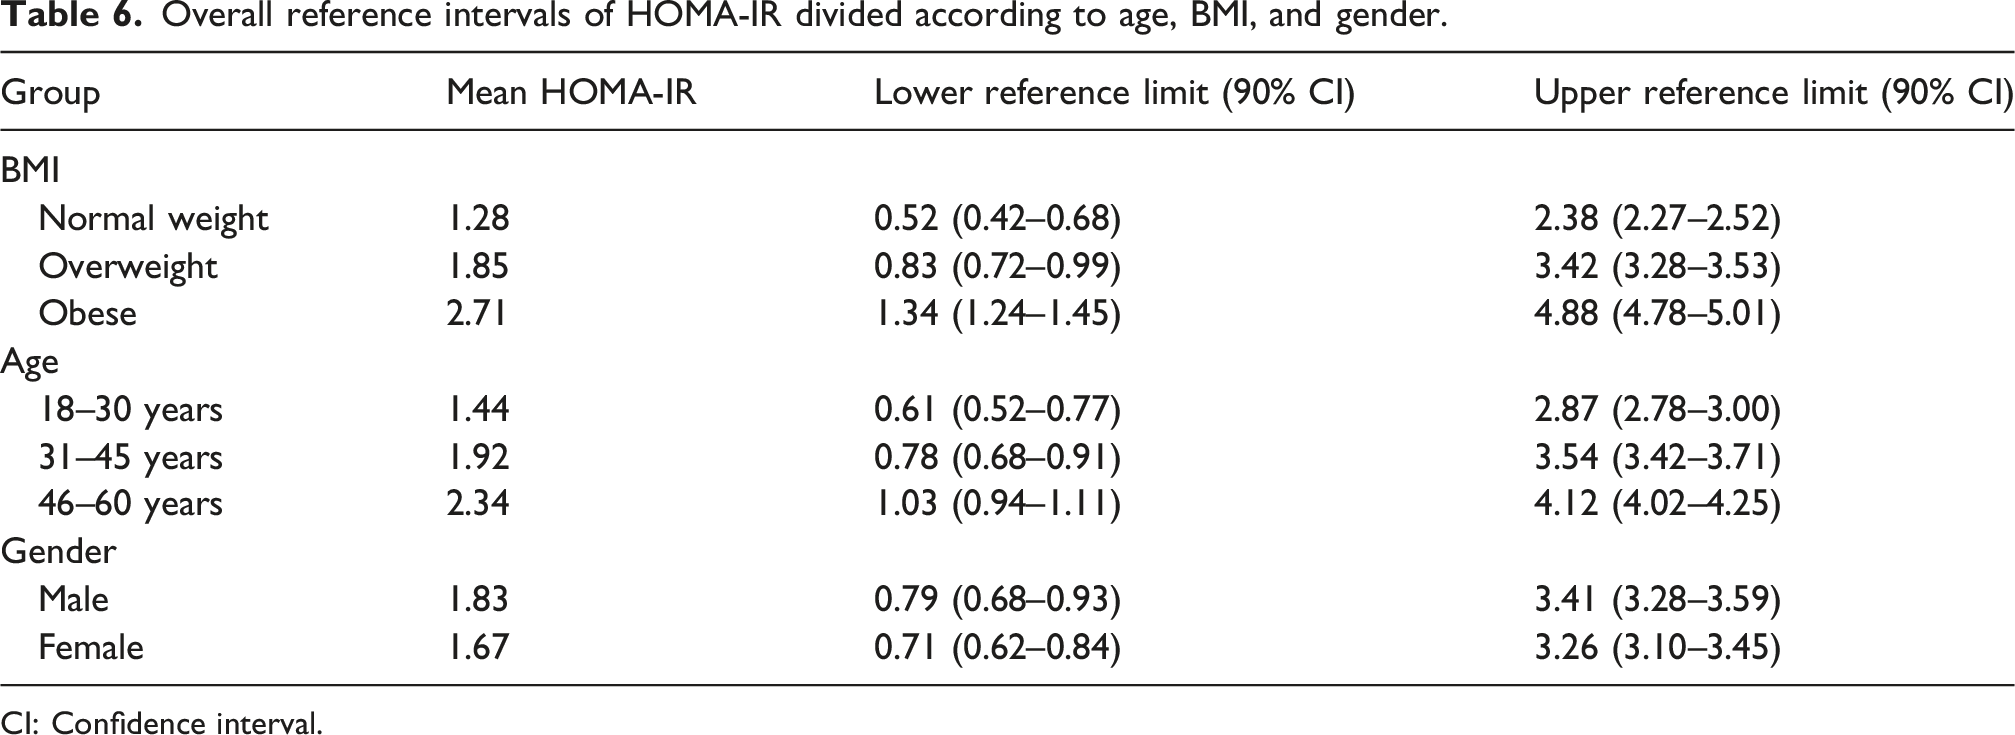
The reference intervals were estimated using a nonparametric approach that defined the 2.5th percentile and the 97.5th percentile based on CLSI EP28-A3c recommendations. In the case of the subgroups described in Tables 2 and 3 (each n = 120), reference limits for the lower end were defined as the third ranked value and those for the upper end as the 118th ranked value. The ninety percent confidence intervals (90% CIs) for these limits were obtained from the relevant ranked observations. CI lower limits were bounded by the first and seventh ranked observation while CI upper limits were bounded by the 114th and 120th ranked observation. Reference limits for the pooled categories presented in Table 6 were likewise calculated nonparametrically using CIs for each lower and upper reference limits. These CIs were similarly established using ranks consistent with the number of observations within each respective group.
Missing data were handled by employing pairwise deletion, and sensitivity analyses were performed to examine the effect of missing data on the results.
Results
Characteristics of study participants and laboratory results.
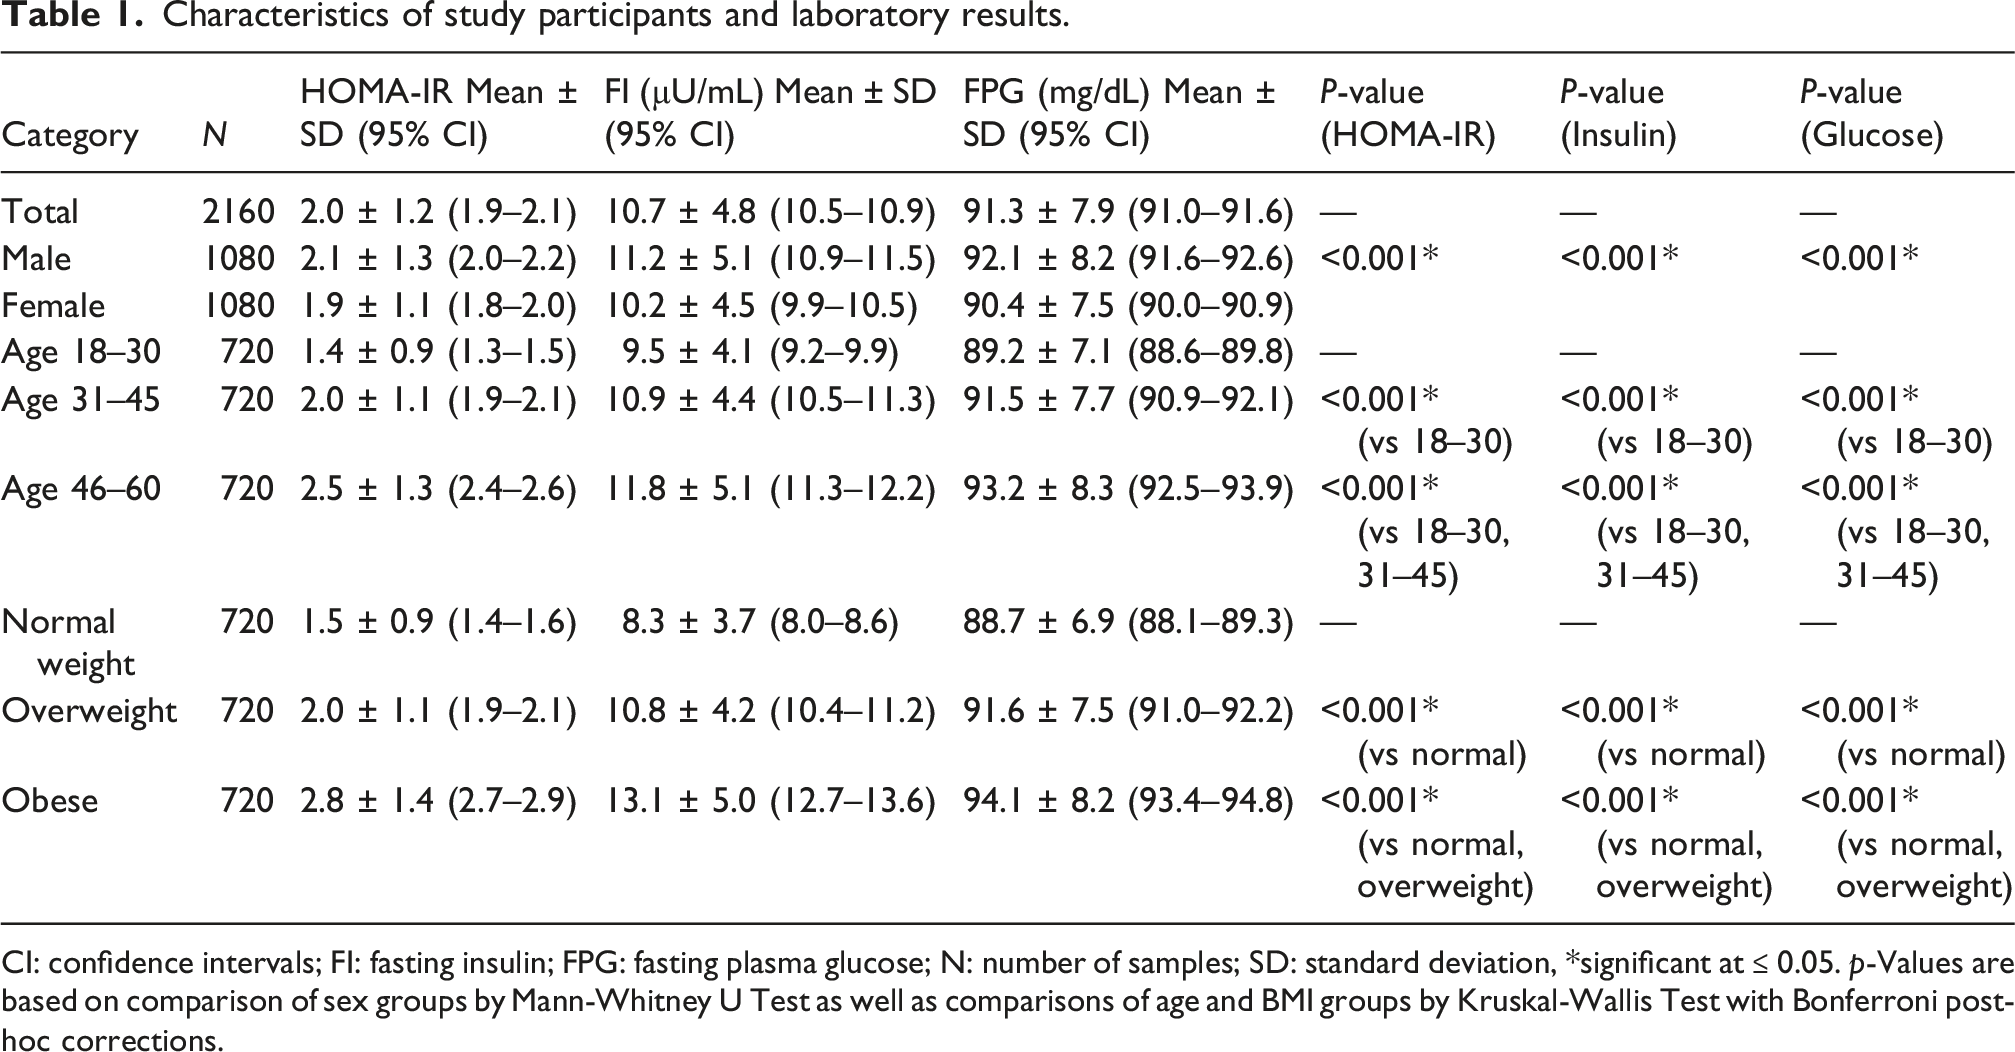
CI: confidence intervals; FI: fasting insulin; FPG: fasting plasma glucose; N: number of samples; SD: standard deviation, *significant at ≤ 0.05. p-Values are based on comparison of sex groups by Mann-Whitney U Test as well as comparisons of age and BMI groups by Kruskal-Wallis Test with Bonferroni post-hoc corrections.
The data from Table 1 demonstrates that HOMA-IR, fasting insulin, and fasting glucose were significantly different among age groups and BMI categories for both males and females. Additionally, each parameter was significantly different between genders; male subjects had significantly greater values for each of these parameters compared to female subjects.
Comparison of HOMA-IR between males and females
HOMA-IR values for males divided into age and BMI groups.
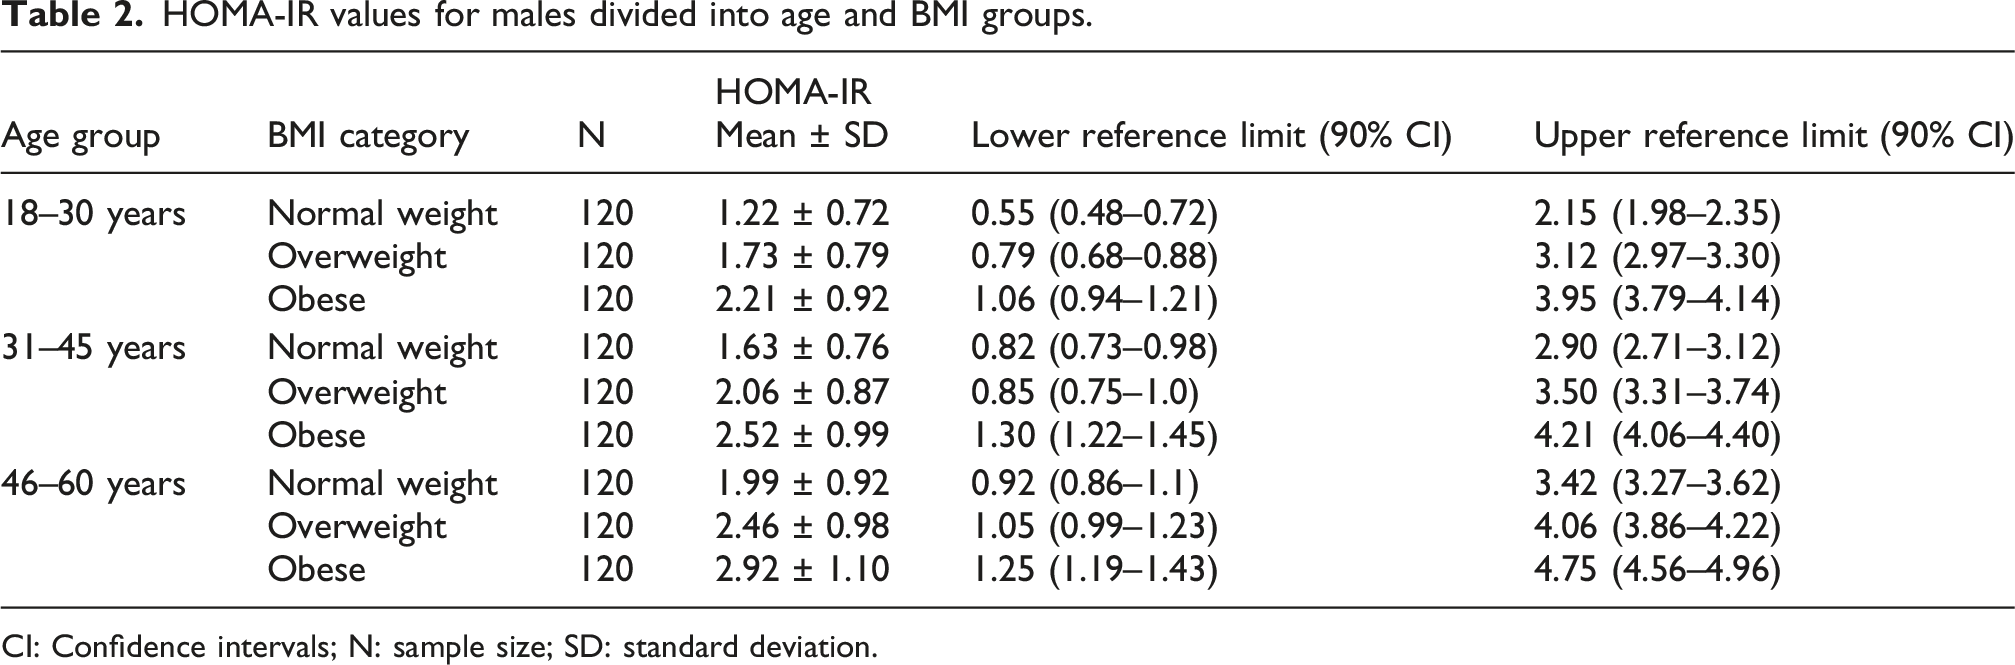
CI: Confidence intervals; N: sample size; SD: standard deviation.
HOMA-IR values for females divided into age and BMI groups.
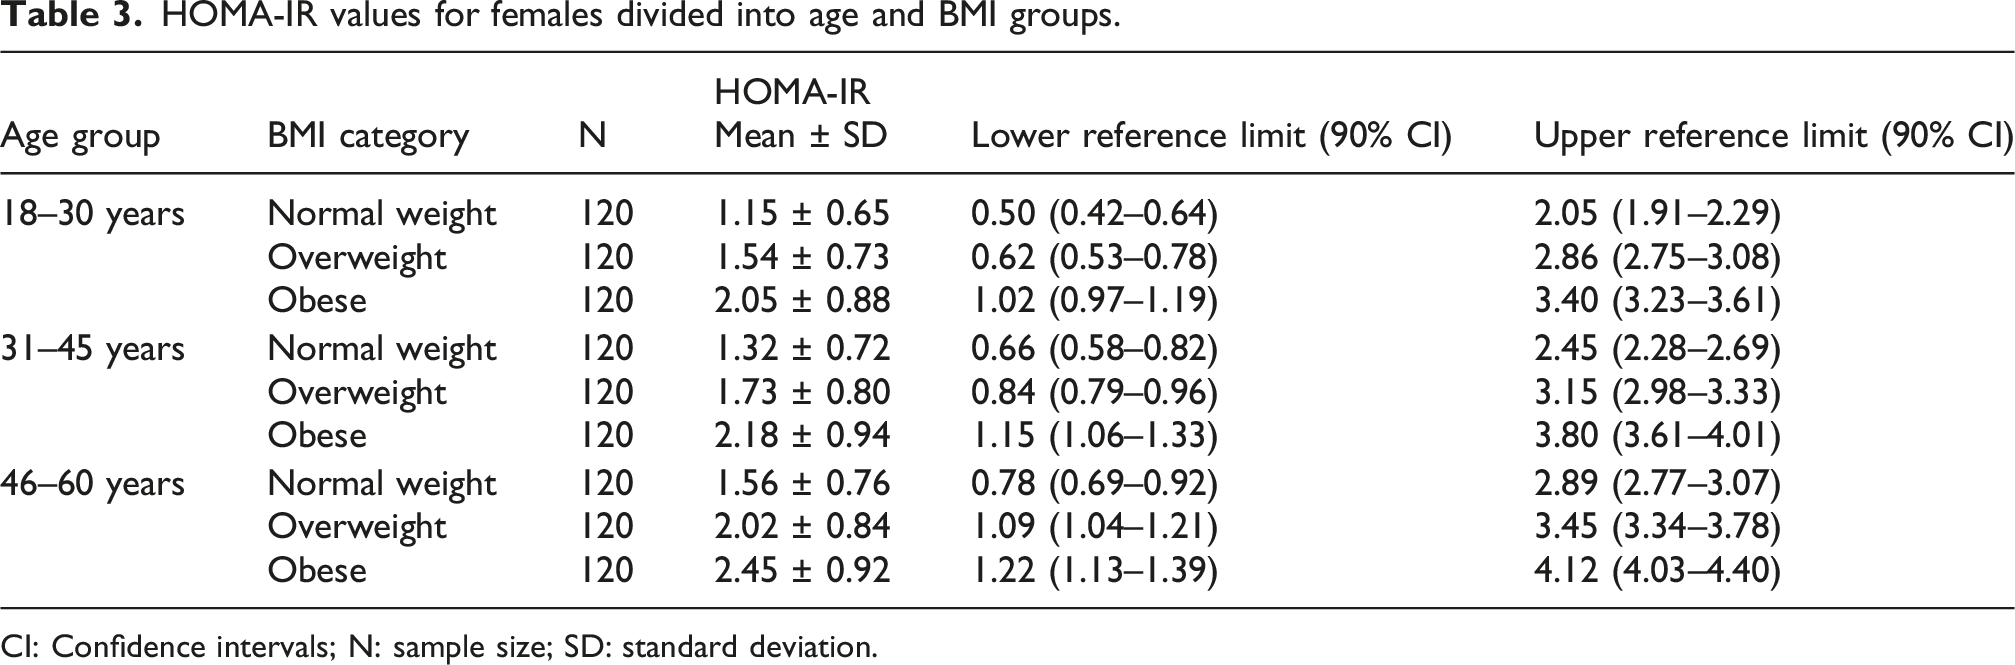
CI: Confidence intervals; N: sample size; SD: standard deviation.
Combined pairwise p-values for BMI and age groups by sex.
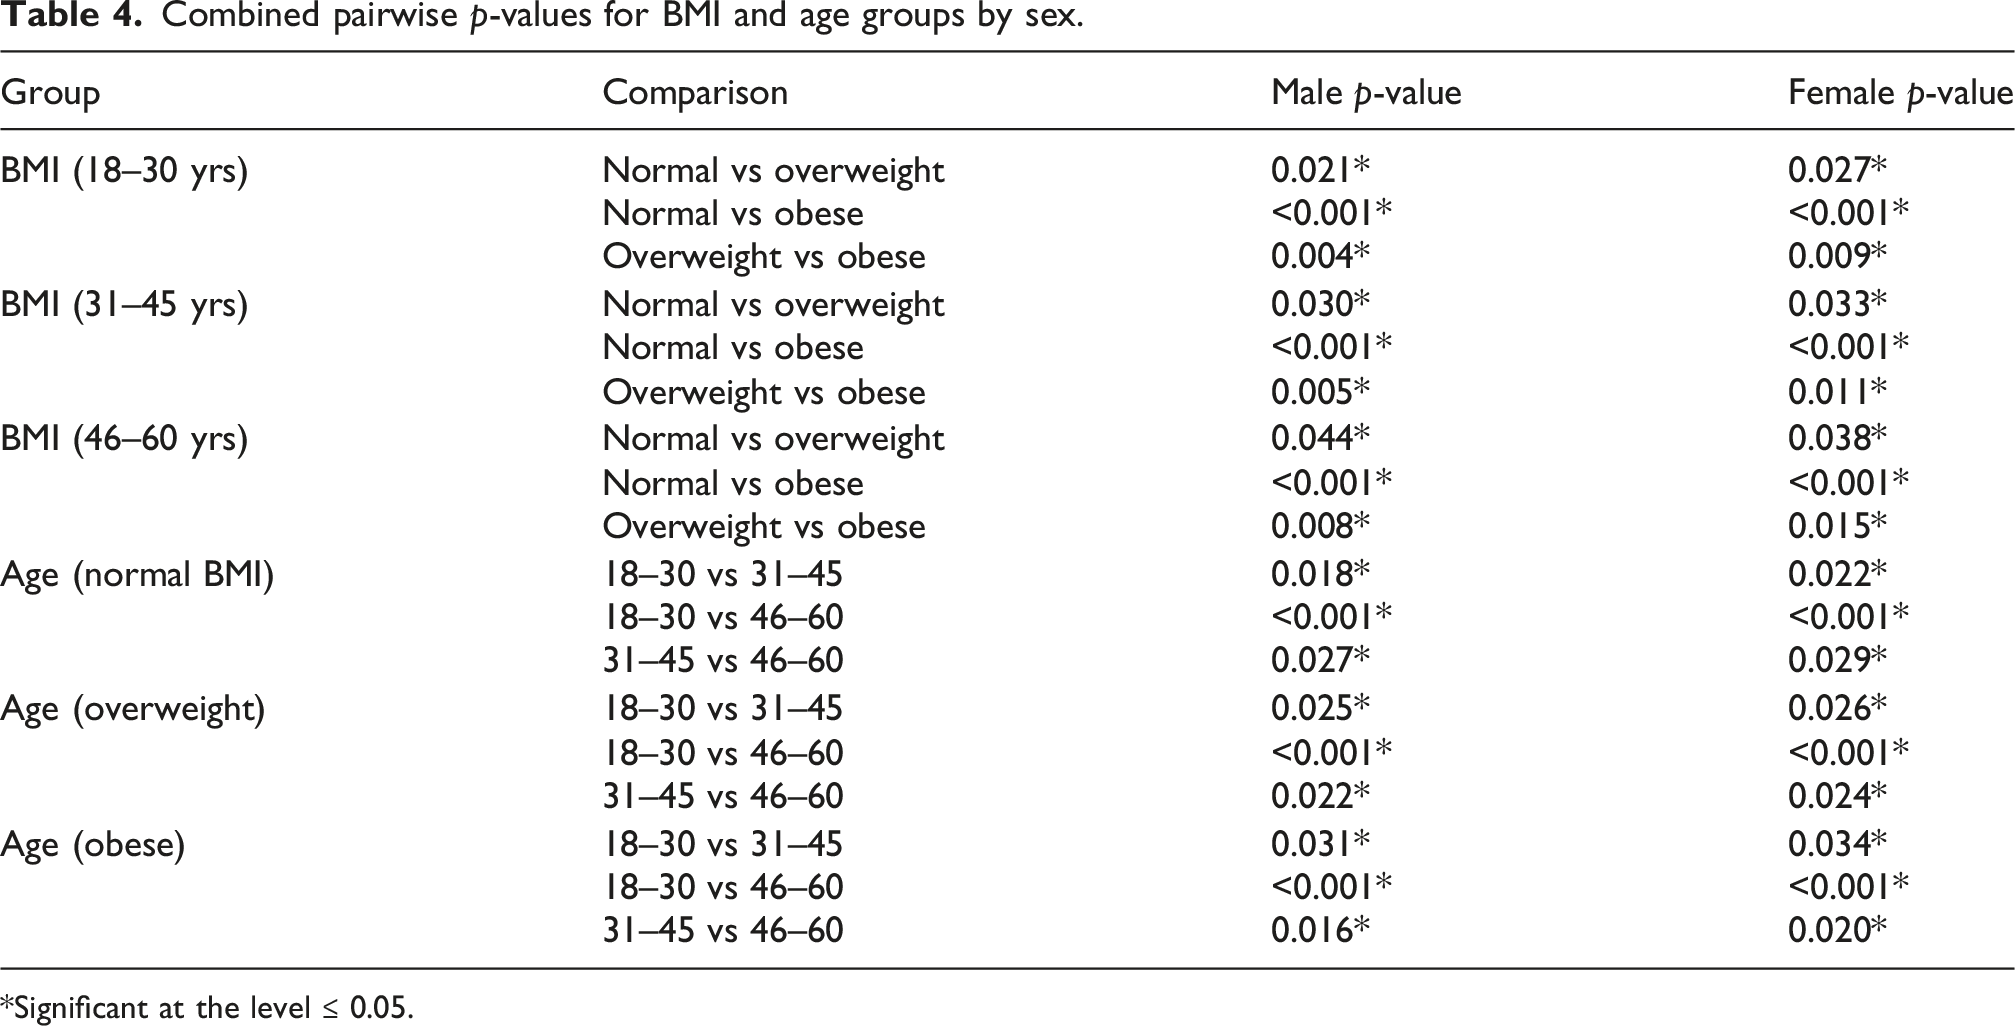
*Significant at the level ≤ 0.05.
HOMA-IR by BMI and age group categories across male and female groups
(18–30) years
The mean value of HOMA-IR for normal weight men was 1.22 ± 0.72, 1.73 ± 0.79 for overweight, and 2.21 ± 0.92 for obese men.
The mean value of HOMA-IR for normal weight women was 1.15 ± 0.65, 1.54 ± 0.73 for overweight, and 2.05 ± 0.88 for obese women.
In all BMI categories, males showed a greater mean HOMA-IR value compared to females. Statistically significant p-values (all p < 0.001) were obtained for the pairwise comparisons of means between sexes for each BMI category, showing that males demonstrated significantly higher insulin resistance than did females in this age range. These results support previous findings on sex-based differences in insulin sensitivity, as may be related to a greater amount of visceral adiposity and lower levels of estrogen in males.23–25
(31–45) years
In males, HOMA-IR mean values were as follows: normal weight: 1.63 ± 0.76, overweight: 2.06 ± 0.87, and obese: 2.52 ± 0.99.
In females, HOMA-IR mean values were as follows: normal weight: 1.32 ± 0.72, overweight: 1.73 ± 0.80, and obese: 2.18 ± 0.94.
Hence, males showed marginally higher HOMA-IR mean values than did females, especially in overweight and obese groups. All pairwise p-values were significant at a level of p < 0.001, thus there was more insulin resistance in men than women for each of the three BMI categories in this age group; these results are consistent with results found in the large-scale epidemiologic studies cited in references.26–28
(46–60) years
Males: For men of normal BMI, the mean value of HOMA-IR was 1.99 ± 0.92; for men that were overweight it was 2.46 ± 0.98; for obese men it was 2.92 ± 1.10.
Females: The mean value of HOMA-IR for women was 1.56 ± 0.76 for those that had a BMI of normal; 2.02 ± 0.84 for those that had a BMI of overweight; and 2.45 ± 0.92 for women that were obese.
There were no significant differences observed in HOMA-IR values between men and women in the age range of 46–60 years old in the normal weight category. However, the p-values for all pair-wise comparisons to assess differences between the overweight and obese categories were highly significant (p < 0.001). In addition, the mean value of HOMA-IR for men in the overweight category was significantly higher than the corresponding value for women in this same category. The results observed are consistent with previous reports from metabolic aging research.29,30
Overall comparison
Males in all age and BMI categories exhibited significantly (p < 0.001) higher HOMA-IR levels than females; with these findings supporting the general premise that males typically exhibit higher insulin resistance compared to females, and this is most evident in younger populations. Sex hormone, body fat distribution, and the metabolic response to insulin likely influence the sex differences in insulin resistance.21,23,25 Both males and females demonstrated increased insulin resistance with advancing age; however, males showed greater increases in insulin resistance with each BMI category.
It appears from the data that while both age and BMI contribute to insulin resistance in males and females, males tend to show higher HOMA-IR levels regardless of age or BMI category. These findings illustrate the necessity of establishing sex-specific reference ranges for insulin resistance, so as to prevent under/over diagnosis of metabolic dysfunction when utilizing the same reference range for both male and female populations. Furthermore, these results demonstrate the progressive nature of insulin resistance with BMI and age advancement and therefore support the importance of early screening and prevention of insulin resistance, particularly in high-risk populations such as males and those who are obese.3,4,31
Pearson correlation analysis
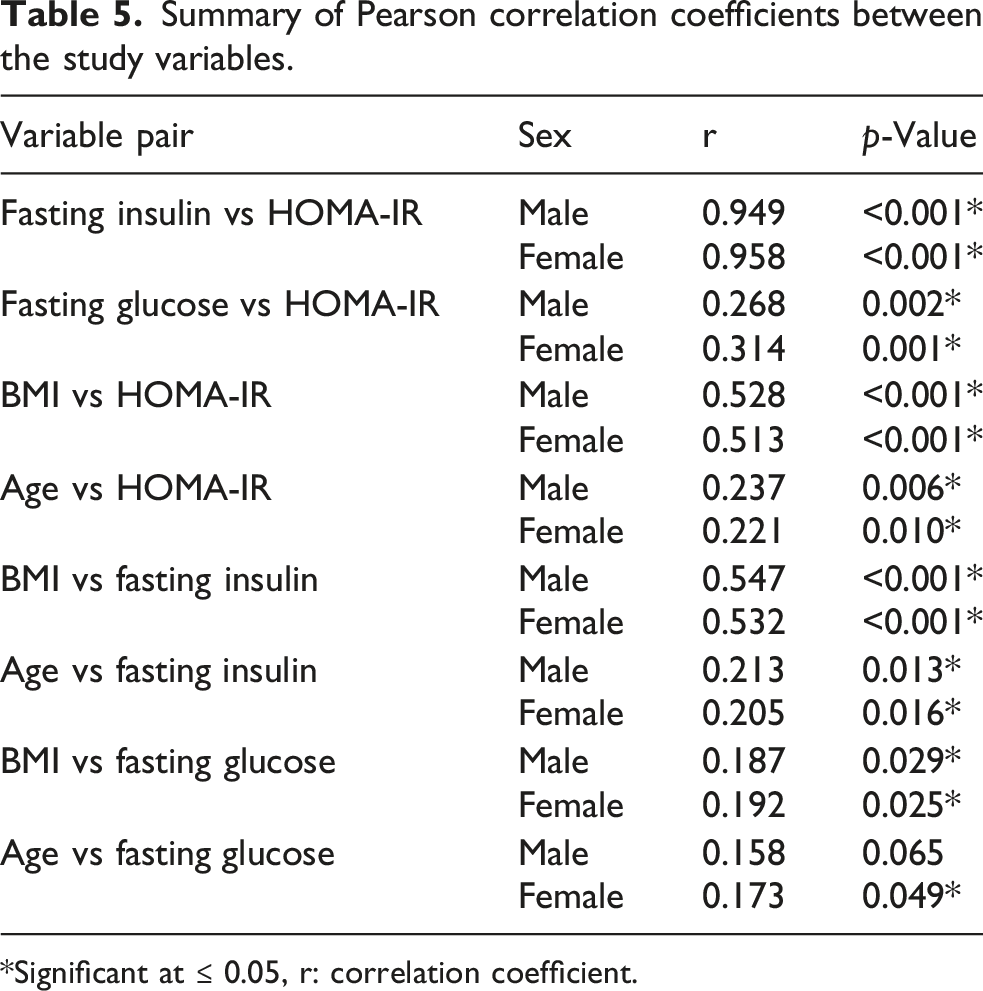
Summary of Pearson correlation coefficients between the study variables.
*Significant at ≤ 0.05, r: correlation coefficient.
Strongly positive correlations between fasting insulin and HOMA-IR were observed for both males (r = .949; p = < .001) and females (r = 0.958; p < 0.001), and these expected strong associations are due to the mathematical composition of HOMA-IR formula using fasting plasma glucose levels that were also positively associated with HOMA-IR in both sexes (males r = 0.268, p = 0.002; females r = 0.314, p = 0.001); however, the relationship was much weaker than that observed for fasting insulin.
There was a small positive association between age and both HOMA-IR (r = 0.237, p = 0.006) and fasting insulin (r = 0.213, p = 0.013), which indicates that as men grow older their level of insulin resistance and their levels of fasting insulin are slightly increased.
BMI had a medium positive association to both HOMA-IR (r = 0.528, p < 0.001) and fasting insulin (r = 0.547, p < 0.001) in male participants; therefore, BMI does have a positive effect on the level of insulin resistance and fasting insulin.
The association between age and both HOMA-IR and fasting plasma insulin for female subjects as well as male subjects was weak as evident from the pearson correlation values shown in Table 5.
Female subjects also demonstrated a moderate association (p < 0.001) between BMI and HOMA-IR (r = 0.513) as well as a moderate association (p < 0.001) between BMI and fasting plasma insulin (r = 0.532).
These results demonstrate moderate relationships of BMI to HOMA-IR and fasting insulin levels in each sex; whereas age and fasting plasma glucose were significantly less strongly correlated. The high correlation of fasting insulin to HOMA-IR is a function of the fact that fasting insulin is an input to the calculation for HOMA-IR.
These results indicated that there was a relationship between increased BMI and increased levels of both HOMA-IR and fasting insulin. As well, the high association between fasting insulin and HOMA-IR has been determined to be due to the mathematical properties of how HOMA-IR is calculated and therefore does not indicate an independent validation of the model. In addition, while fasting plasma glucose and age were each related to HOMA-IR, those associations were weak.
These findings support the need for caution in using one universal cut-off for HOMA-IR to diagnose insulin resistance across different populations due to variability in body composition and physiological differences in how glucose is metabolized. Additionally, using stratified reference values can improve accuracy in diagnosis of metabolic risks and reduce the risk of misclassifying (under or over) an individual’s metabolic risk. Furthermore, the creation of such stratified reference values will serve as a valuable resource for clinicians and researchers working in Iraq and other populations from the Middle East to aid in the accurate identification of individuals at increased risk of developing insulin resistance and associated cardiometabolic diseases.
Reference intervals
Overall reference intervals of HOMA-IR divided according to age, BMI, and gender.
CI: Confidence interval.
Discussion
The research provided reference ranges (sex-, age-, and BMI-stratified) of HOMA-IR that were based on apparently healthy Iraqi adults through the use of a nonparametric method as described by the CLSI guidelines for EP28-A3c. It demonstrated variability in the results of HOMA-IR among various demographically and anthropometrically defined subgroups, where BMI was associated with the largest amount of variance.
The rising trend in HOMA-IR as a function of rising BMI is supported by well-established evidence that obesity (adiposity) is associated with impaired insulin action. Impaired insulin signaling from increased adipose tissue can occur through mechanisms such as increased flux of free fatty acids into circulation; a low grade state of chronic inflammation; and abnormal regulation of adipocytokine secretion.32–34 The current study’s findings are consistent with many prior studies conducted regionally and internationally.35–37
The age-related increases in HOMA-IR are likely due to several age-related decreases in insulin sensitivity.38,39 These include decreased muscle mass, decreased physical activity, and cumulative metabolic stress. Additionally, similar age-related patterns of decreasing insulin sensitivity have been documented within other populations, including those from the Western world (NHANES) and some from the Middle East; which supports that the trend for an increase in HOMA-IR with increasing age can be generalized across populations.40,41
An interesting feature of the data is the relatively small magnitude of sex-differences for HOMA-IR, while at the same time there are notable sex differences. The gender differences in HOMA-IR may be related to the variation of how fat is distributed throughout the body as well as sex-related hormone impacts on insulin sensitivity. Sex-related differences have also been noted in various other populations that show higher levels of insulin resistance among males than females; the possible reason is greater visceral fat accumulation and androgen-mediated metabolic factors.42–45
The variations seen among subgroups clearly reinforce the idea that one should take into account both demographically (such as race/ethnicity) and anthropometrically (like BMI) factors to interpret the results from HOMA-IR. Furthermore, the fact that there are such obvious variations among these groups strongly supports the need to have a series of different reference ranges, which would be specific to each subgroup, in place of using a generic value for defining or assessing insulin resistance. This has also been confirmed by multiple large-scale meta-analysis and multicenter studies.5,46
The results from this research stress that it is important to develop reference levels for HOMA-IR for specific populations. Using reference levels developed from other populations could lead to incorrect classification of an individual’s level of insulin resistance due to differences in genetics, environment, and lifestyles. Previous studies have shown similar observations supporting the use of reference values generated from a local source to improve clinical interpretation.3,47
There was a very strong positive relationship between fasting insulin and HOMA-IR values for men and women. Nonetheless, there is some caution that needs to be taken when interpreting this observation since fasting insulin directly enters into the calculation of the HOMA-IR value. Thus, in populations where the variability in FPG is quite small, high degrees of association (i.e., strong correlations), based on mathematical necessity, will arise from the formula of the index and do not represent independent biologic validation. These concerns have also been previously identified by researchers examining interpretations of HOMA-IR data.5,48 The use of an independent reference measure for validation of HOMA-IR (e.g., hyperinsulinemic-euglycemic clamp), has not occurred within this research project.
These findings clearly show that adiposity is one of the main determinants of insulin sensitivity. As such, they support the idea that obesity is associated to an increased risk of developing insulin-resistance (which is confirmed by our results) and therefore confirm the interest of the use of anthropometric parameters in the evaluation of metabolic health.49,50
Thus, from a public health standpoint, the high HOMA-IR values found in older, obese Iraqi individuals are concerning, given the increasing prevalence of obesity and the associated metabolic syndrome in Iraq. From an epidemiological point of view, the observed patterns demonstrate the significance of identifying insulin resistance at the earliest opportunity, especially in persons whose BMI is higher than average and who are older. The results indicate that there could be value to including stratified reference ranges as part of the assessment process for clinicians and epidemiologists.
This study is limited by its cross-sectional nature, limiting causal relationships from being established. Although an effort was made to make the sample representative of the general adult population of Iraq, it is possible that some rural or underserved populations may have been under-represented. Another constraint was that the Metabolic Syndrome criteria from the Joint Interim Statement could not be evaluated completely, as some of the variables (e.g., triglycerides, HDL cholesterol, and waist circumference) were missing for many participants. As a result, the inclusion criteria based on fasting glucose, blood pressure, medical history, and drug usage approximated a “metabolically normal” group. Future studies should be designed as longitudinal studies and assess additional metabolic indicators (e.g., adiponectin and inflammatory cytokines) to enhance the analysis of the relationship between HOMA-IR and other metabolic indicators.
In conclusion, HOMA-IR reference intervals were established that are specific to an Iraqi population and that have been stratified by age, sex, and BMI. The findings of the study demonstrate the necessity to consider the individual’s age, sex, and BMI when evaluating a patient’s HOMA-IR value. Improved clinical assessments of insulin resistance can be achieved with these new reference intervals.
Conclusion
The present study was successful in developing sex-, age-, and BMI-specific reference ranges for HOMA-IR for an apparently healthy adult population in Iraq. These findings provided clear evidence that increasing BMI was associated with increasing insulin resistance with older age contributing to this relationship as well. While the sex-based differences found in HOMA-IR were small compared to the other factors (BMI and age) and not consistently statistically significant, males were typically slightly greater than females in HOMA-IR values when comparing most subgroups.
Supplemental material
Supplemental material - Population-specific HOMA-IR reference ranges in Iraq: Defining insulin sensitivity in a Middle Eastern cohort
Supplemental material for Population-specific HOMA-IR reference ranges in Iraq: Defining insulin sensitivity in a Middle Eastern cohort by Mustafa Kahtan Al-Bayaty, Mohammed Shamil Ali, and Ragheed H. Yousif in Annals of Clinical Biochemistry.
Footnotes
Acknowledgements
We are grateful to the Department of Molecular and Medical Biotechnology/ College of Biotechnology/ Al-Nahrain University, College of Applied Sciences/University of Technology and to all of those who supported and aided in the completion of this research.

CRediT authorship contribution statement
Mustafa Kahtan Al-Bayaty: Writing the original draft, methodology, investigation, and conceptualization. Mohammed Shamil Ali: Writing—review and editing, methodology, investigation, and conceptualization. Ragheed Hussam Yacoub: Writing—review and editing, methodology, investigation, and conceptualization.
Funding
The authors received no financial support for the research, authorship, and/or publication of this article.
Declaration of conflicting interests
The authors declared no potential conflicts of interest with respect to the research, authorship, and/or publication of this article.
Ethical approval
Verbally informed consent was obtained from all individual participants included in the study. All procedures performed in studies involving human participants were in accordance with the ethical standards of the institutional research committee and with the 1964 Helsinki Declaration and its later amendments or comparable ethical standards. The study was approved by the Ethics Committee of the University of Technology/College of Applied Sciences (Approval no. 42131).
Contributorship
All authors made substantial contributions to the conception and design of the study All authors reviewed and approved the final version of the manuscript, agreed to be accountable for all aspects of the work, and consented to its submission for publication.
Guarantor
Mustafa Kahtan Al-Bayaty and Mohammed Shamil Ali.
Supplemental material
Supplemental material for this article is available online.
References
Supplementary Material
Please find the following supplemental material available below.
For Open Access articles published under a Creative Commons License, all supplemental material carries the same license as the article it is associated with.
For non-Open Access articles published, all supplemental material carries a non-exclusive license, and permission requests for re-use of supplemental material or any part of supplemental material shall be sent directly to the copyright owner as specified in the copyright notice associated with the article.
