





Abstract
Growth is a fundamental aspect of a living organism. Growth curves play an important role in explaining the complex dynamics of growth trajectories. The development of a large class of growth models provides more choices to explain complex growth dynamics. However, identifying a suitable growth curve from a broad class of growth models becomes a challenging task. Relative Growth Rate (RGR) is the most popular measure in the growth-related study. It serves many purposes in growth curve literature, including constructing any goodness-of-fit index of some growth dynamics. However, the goodness-of-fit test based on RGR is restricted to only simple growth models. This study aims to develop a new growth rate function, instantaneous maturity rate (IMR), which can play an important role in identifying growth models. We have explored that the measure has synergy in mathematical form with IMR. However, unlike the hazard rate, IMR is a random variable when the size/RGR variable is stochastic. We have derived the exact and asymptotic distribution of this measure under the Gaussian setup of both the size and RGR variables. We have constructed a goodness-of-fit test for the extended Gompertz growth model based on the instantaneous maturity rate. We have checked the performance of the test through simulation studies as well as real data.
Introduction
The generalization of growth curves is an important aspect of growth curve literature and provides plenty of choices when growth curves are applied to real data.[1-6] Identification of a suitable growth curve is a challenging task in growth curve analysis since growth curves are generally sigmoidal type. Again if we plot the empirical relative growth rate (RGR) over size or time, we can identify the growth curve models suitable for the given data.[7] However, identifying growth curves using the shapes of RGR is a difficult task since RGR takes only two shapes, decreasing and bell shapes. So it is essential to develop a growth rate measure that can identify growth curves more accurately. A novel and unified growth rate called the Instantaneous Maturity rate (IMR) can address this issue. IMR at the time interval
In growth curve analysis, the goodness-of-fit index calculates the proximity between theoretical and empirical growth curves. A series of research works are carried out to propose more sophisticated goodness-of-fit tests for growth laws that can measure the proximity of the data to a given model Basu and Bhattacharjee[8] has offered a goodness-of-fit test explicitly for the exponential growth law extending the finite difference approach of Hill[9] through directly modelling the RGR variable. Ratios of logarithms of size data were used to offer interval-specific goodness-of-fit for the exponential polynomial growth curve model[10] Chakraborty and Basu[11] devolved the interval-specific goodness of fit test for the logistic growth curve model.
Chakraborty et al.[7] considered finite differences of the ratios of logarithms of the empirical RGR for testing goodness of fit for the Gompertz growth curve model. RGR plays a fundamental role in developing these goodness-of-fit tests. It is a better tool compared to the size variable. Note that the growth curves Gompertz, logistic take only decreasing shapes of RGR. We have also seen the extensions of these growth curves, which take non-monotone shapes of RGR.[4, 6] However, developing a goodness-of-fit test based on RGR is complicated. On the other hand, IMR is more beneficial to identify a growth model in comparison with RGR. In this study, we develop a goodness-of-fit test procedure for the extended Gompertz growth curve model (henceforth, Chakraborty-Bhowmick-Chattopadhyay-Bhattacharya model or CBCB model) proposed by Chakraborty et al.[6] We have checked the performance of this test through simulation studies as well as real data.
We organize the rest of the article as follows. We define a new growth rate measure and discuss some important aspects of this measure in Section 2. We derive the new measure's exact and asymptotic distributions in Section 3. We develop the goodness-of-fit test procedure for the CBCB model in Section 4. We present a simulation study and a real-data example in Section 5. Concluding remarks are given in Section 6.
Growth Rate and Its Proposed Extension
The RGR is the widely used measure to quantify the population growth.[12] The mathematical definition of the RGR function was proposed by Fisher[13] as the per-unit rate of change in the value of the size variable. Let
We observe that the RGR measure provides the information of growth rate for a specific time interval with respect to the size of the cohort. It indicates that RGR offers information regarding the earlier period and the current status but does not provide any information about the upcoming growth process. The experimenter needs to know that for any instant, how much RGR is necessary for a species to achieve to reach the usual size. We define IMR for a specific time interval
where
Gompertz model is one of the most frequently used curves, and it is well known for modelling tumour growth. The Gompertz growth law is governed by the equation
The size at time
The Gompertz model can only decrease if we plot RGR over time. However, there is also a bell-shaped RGR which motivated to extend the Gompertz growth curve. We want to mention two important extensions of the Gompertz growth in this context. The first one was proposed by Bhowmick and Bhattacharya.[4] and the second one was the CBCB model proposed by Chakraborty et al.[6] The CBCB model enjoys all important properties, including capturing monotone and non-monotone shapes of RGR like the model proposed by Bhowmick and Bhattacharya.[4] However, the CBCB model proposed by Chattopadhyay et al.[6] has an extra advantage because we can get the simple analytical form of size. We have considered the CBCB model in our study. So it is essential to study the IMR of the model since the IMR will be used to develop the goodness-of-fit test for this growth law.
The RGR of the CBCB model is given by
where
This is the Gompertz growth model when
The IMR of the CBCB model takes three different shapes; decreasing, constant and increasing. If
where
or equivalently
We can find the IMR using the RGR and the size.
In actuarial sciences and demography, the hazard rate provides the most intuitive way to introduce analysts’ assumptions and knowledge in mortality laws.[15] Hazard rate is the probability that an item will fail within the infinitesimal interval
Note that the minimum and maximum value cumulative relative growth rate are 0 and
The SCRGR can be interpreted as the proportion of CRGR that the species have achieved up to
Now we will focus on the properties of IMR, which are also common attributes of the hazard function.
Note that
Most importantly, IMR lies between 0 and
Distribution of IMR
In growth curve analysis we have the size/RGR at several time points which is not necessarily deterministic. Usually we assume the size vector
The IMR can be estimated empirically using the discrete analogue of the hazard rate function. Hence the IMR at time
Therefore IMR is the ratio of two random variables, which is not the case for hazard function. Again, Hazard functions track how the failure rate changes with time. Similarly, for a given empirical estimate of RGR, the IMR can state the species’ actual maturity status. Although both IMR and the hazard have some conceptual similarity, they diverge in terms of randomness. Actually, in growth curve analysis, the IMR can serve two purposes. Its empirical estimate based on the given data can characterize a broad family of growth curves. Finally, we can compare the growth of the same species’ precise maturity status in different locations or different species in the same locations by the test of equality of expected values of IMR. The exact and asymptotic distributions are the primary tool to construct the statistical test of equality. We have derived the exact distribution of IMR under normality assumption as a natural interest of theoretical statistics. However, it does not have a direct connection with the development of the goodness-of-fit test. We have also developed the asymptotic sampling distributions of IMR. We have identified a transformed variable of IMR so that the new variable's mean process is constant. The asymptotic distributions of the transformed variable of IMR are also derived which is a useful tool for the goodness-of-fit test for the CBCB model.
where
Proof The proof of this theorem is discussed in detail in Appendix A. 1.
We depict the plot of the probability density functions of IMR for the CBCB model with parameters
We can see that the form of the density function of IMR (Equation 3.2) is complicated. The moments of this distribution are difficult to calculate. We have calculated the distribution of IMR for theoretical interest. We derive the asymptotic sampling distribution of IMR for the goodness-of-fit test, shown in the next subsection.

Probability density functions of IMR for different values of σ on different time points when the RGR is taken from the multivariate normal distribution with mean vector from the CBCB model with parameters a = 0.01 ; b = 1 ; c = 2 .
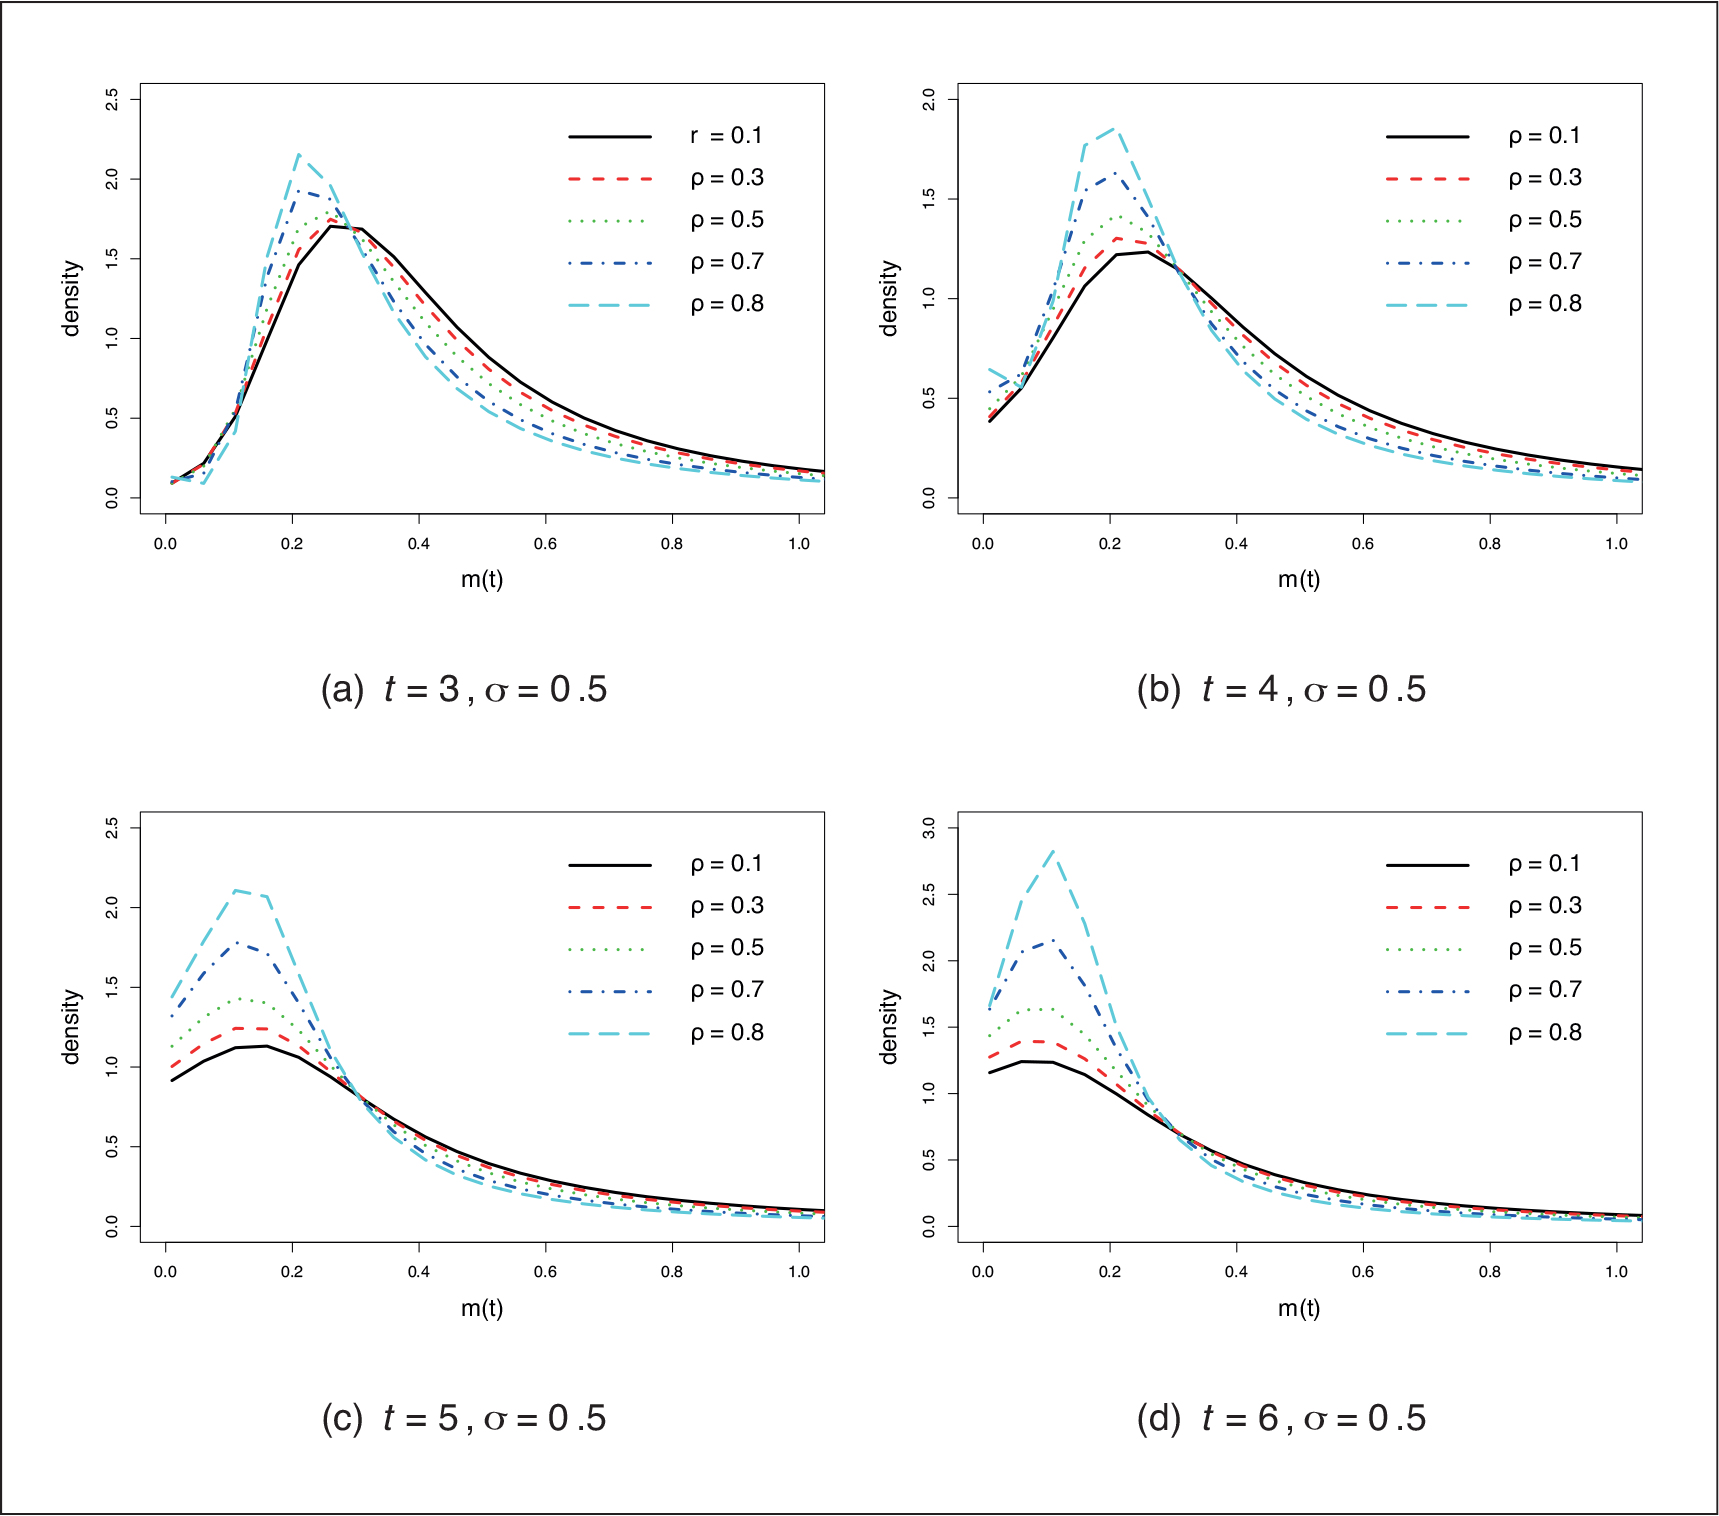
Probability density functions of IMR for different values of ρ and time. RGR is taken from the multivariate normal distribution with the mean vector from the CBCB model with parameters a = 0.01 ; b = 1 ; c = 2 .
The asymptotic distributions play a key role in finding solutions when the exact distributions are complicated and challenging to work. We derive the asymptotic distributions (taking the no. of individuals large) of IMR assuming normality on both the RGR variable and the size variable.
and
where
Proof Proof of theorem is given in Appendix A.2.
Note that for a given
In the next two theorems we provide the asymptotic distribution of IMR vector
where,
and
Proof
The proof of the theorem has been given in Appendix A.3.
and the IMR at time point
where
and
Proof
The proof of the above theorem can be done using the multivariate delta method.
We need to find a function of the size or the RGR which is constant over the size or the time to develop a goodness-of-fit testing method for a growth model. For the CBCB model (Equation 2.4) we have
We propose an appropriate function of IMR, which is a constant and provides an essential characterization of the CBCB model using IMR. We have already seen that IMR of CBCB model is
We call the function
Distribution of
Let us write the empirical estimator of
Let us denote
where
and
and
Proof.
The proof of the above theorem can be done using the multivariate delta method.
where
and
where
Proof.
The proof of the above theorem can be done using the multivariate delta method.
We have the following distributional assumptions when the data are generated from the CBCB model
Alternatively, we can write the null hypothesis as
The null hypothesis
We follow the following approach to test the null hypothesis (4.8). Let
Here
Simulation Study
We observe the power of the test with simulated data to study the performance of the proposed test. First, we assume normality on the RGR variable of the growth model and generate a data set. We have simulated the data from the growth curve model with the RGR
The model reduces to the CBCB model when
Now, we assume the multivariate normality on the size variable. We need the explicit form of the size variable (Equation 5.1) to simulate data. However, the closed form of size is not available. Hence we have approximated the RGR variable
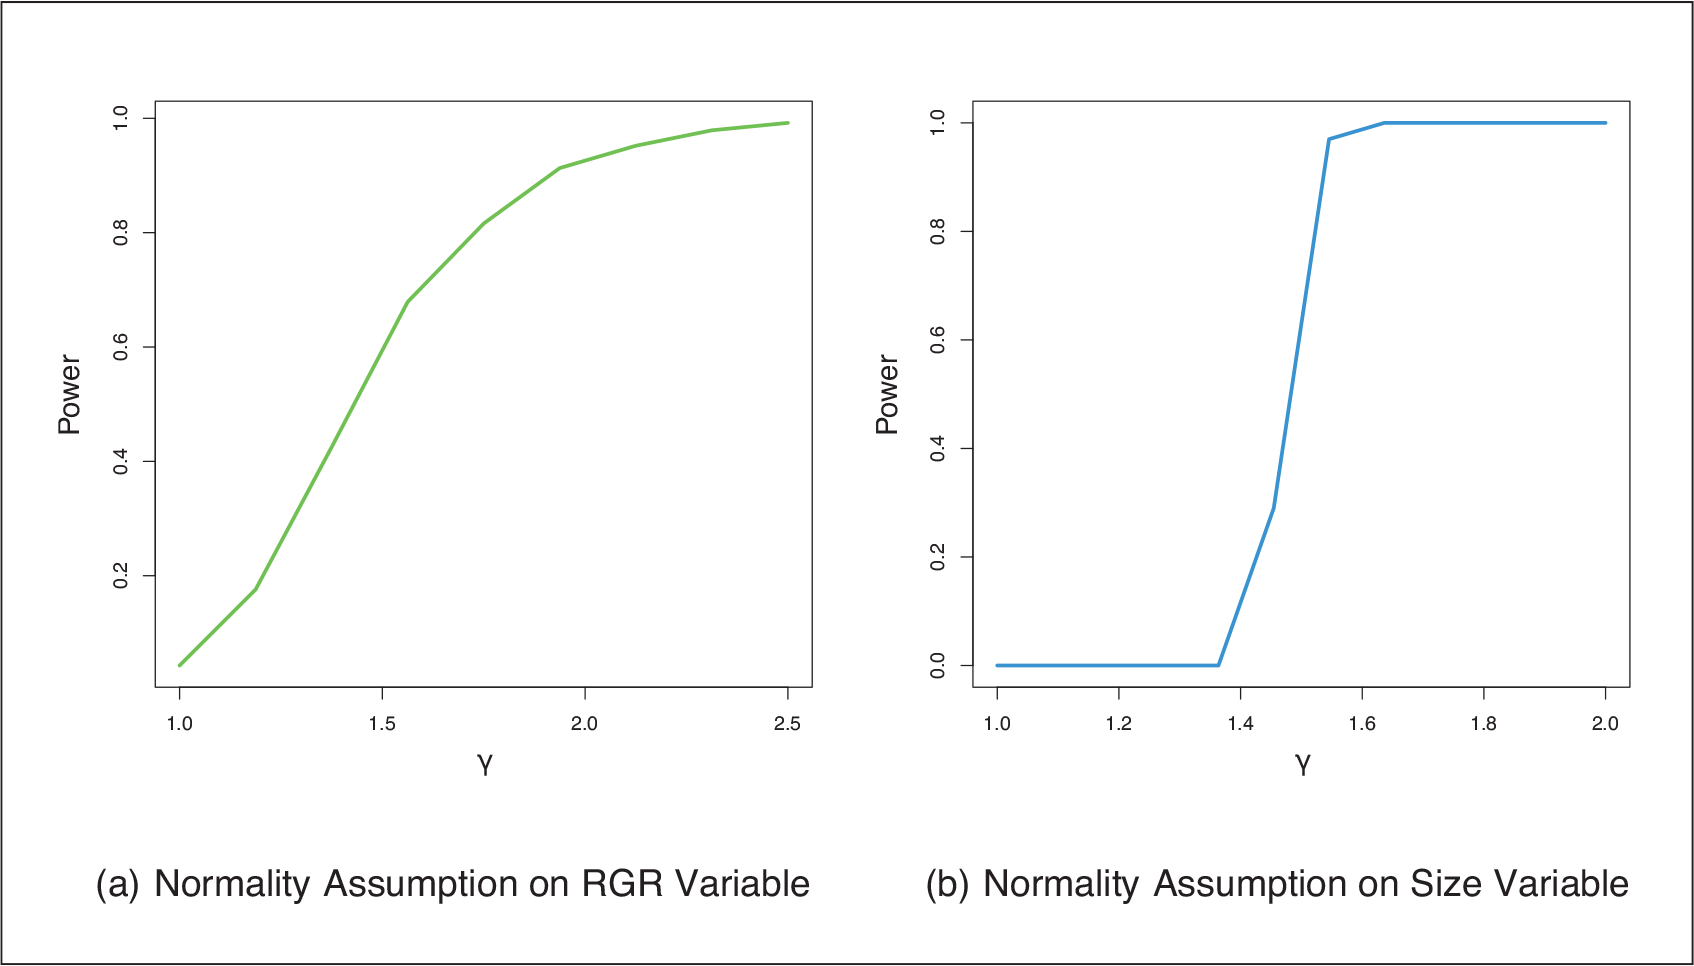
Plot of the power when the data are generated from a growth characterized by for different values of γ .
We study the performance of the proposed test based on a real-life data set. The data set consists of measurements on the body weights of 48 different pigs during nine successive weeks of follow-up. The entire data is available at the website
We calculate the Chi-square test statistic
Concluding Remarks
Development of Goodness of fit test has achieved significant importance since last decades[7, 10, 11] apart from the usual model selection criteria, namely R-square, adjusted R-square AIC, BIC, etc. In most of these studies, the authors developed the goodness-of-fit test by identifying transform functions of size and RGR variables. Note that RGR cannot capture the correct status of the species growth. Hence, a sophisticated and accurate measure of the growth of the species is demanding. Our study proposed a refined measure IMR for capturing the true status of growth and used this rate function for the goodness of fit test for a complex growth curve. The present study ensures that the proposed goodness-of-fit test based on IMR is powerful as the power increases with a slide departure from the underlying model. The goodness-of-fit test for some growth models, such as the extended Gompertz model proposed by Bhowmick and Bhattacharya.[4] can be developed using the IMR.
Footnotes
Acknowledgements
We are thankful to the anonymous reviewers for their suggestions that greatly improved the revised version of the manuscript from its earlier versions. We sincerely thank the Associate Editor Professor Aditya Chattopadhyay and the Former Editor-in-Chief Professor Uttam Bandyopadhyay for their valuable suggestions.
Declaration of Conflicting Interests
Funding
The authors received no financial support for the research, authorship, and/or publication of this article.