In this article, we have proposed a difference-cum-exponential type estimator for estimating population mean by using information on two auxiliary variables under non-response, in which the expressions of bias and mean square error of the proposed estimator have been derived up to the first order of approximation. The suggested estimator has been compared with other existing and adaptive estimators theoretically and empirically. Also, a simulation study has been performed; for this, we have generated two artificial data sets to demonstrate the efficiency of the proposed estimator than the other estimators.
The problem of non-response in sample surveys is encountered more frequently in mail than in personal interviews.[1] Hansen and Hurwitz[2] were the first to address this issue by proposing a sampling plan that involved drawing an initial sample through the first mail attempt, followed by taking a sub-sample from the non-responding population using personal interviews.
It is noted that the presence of auxiliary information can suggest improved estimators of the population mean in typical surveys and plays a vital role in addressing non-response problems as well. Authors such as Cochran,[3] Rao (1983, 1986, 1987),[4–6] Khare and Srivastava,[7–9] Okafor and Lee,[10] Tabasum and Khan,[11, 12] Singh and Kumar (2008a, 2008b, 2008c, 2009a, 2009b, 2010)[13–17] and Singh[18] have utilized auxiliary information to develop improved estimators of the population mean in the presence of non-response.
Consider a finite population of size , with the values of the study variable (say) for the units in the population being denoted by . The objective is to estimate the population mean of the values, denoted as . To estimate the population mean, a random sample of size , denoted by , is drawn without replacement from the population. In survey sampling involving human populations, it is observed that individuals respond on the first attempt, while individuals do not provide a response, resulting in non-response.
To adjust for non-response at the initial stage, Hansen and Hurwitz[2] proposed a double sampling plan for estimating the population mean, which is as follows:
A simple random sample of size n is drawn without replacement and a questionnaire is mailed to the sample units.
A sub-sample of size from non-responding units in the initial stage is contacted through personal interviews.
In Hansen and Hurwitz method, the population is supposed to consist of a response stratum of size and a non-response stratum of size . Let and denote the population mean and variance of the study variable y. Let and denote the mean and variance of the respondent group (or strata). Similarly, let and denote the mean and variance of the non-respondent group (or strata). The population mean can be written as:
where and . The sample mean denotes the mean of the responding units and denotes the mean of the non-responding units.
Let denote the mean of the sub-sampled units where . Hansen and Hurwitz[2] suggested an unbiased estimator for the population mean of the study variable is given as:
where and are the responding proportions and non-responding proportions of the sample. The variance is given as:
where and .
Let and denote the auxiliary variable correlated with the study variable , with population mean and variance given as , and , respectively. For the respondent group of size , let and , and denote the mean and variance of the respondent group (or strata) for auxiliary variables and , respectively. Similarly, let and and and denote the mean and variance of the non-respondent group (or strata) for auxiliary variables and , respectively. Let , denote the mean of all the units, and , denote the mean of the responding units and , denote the mean of the non-responding units for auxiliary variables and , respectively.
Let , denote the mean of the sub-sampled units from non-respondent strata for auxiliary variables and , respectively, where . With this background, an unbiased estimator of the population mean and is given as and . The variance of and is given as and , where and and where and .
Let us define the following terms:
Then
where, , and , ,
Review and Adaptive Estimators
When a few observations are missing in the sample, Hansen and Hurwitz[2] were the first to propose an estimator for estimating the population mean . Subsequently, many other researchers have worked on similar situations. Here, we present some of the existing estimators and adaptive estimators using two auxiliary variables for estimating the population mean in cases where some observations are missing.
Rao[5] proposed a ratio estimator for estimating the population mean of the study variable using a single auxiliary variable. Building on this, we adapt the ratio estimator to estimate the population mean of the study variable in the presence of non-response utilizing two auxiliary variables and . The adapted estimator is given as:
The bias and mean square error (MSE) of S1 are given as:
Khare and Srivastava[4] suggested a product estimator for estimating the population mean of the study variable for a single auxiliary variable. Adapting this, the product estimator for estimating the population mean of the study variable in the presence of non-response using two auxiliary variables and
The bias and MSE of are given as:
Singh et al. (2008a, 2008b), for estimating the finite population mean of a study variable having one auxiliary variable is known. Singh et al. (2008a, 2008b) suggested exponential ratio-type estimators for the population mean of the study variable using one auxiliary variable . The adapted exponential ratio-type estimator for estimating the population mean of the study variable in the presence of non-response using two auxiliary variables and is given as:
The bias and MSE of the are given as:
Singh et al. (2008a, 2008b) suggested exponential product-type estimators for the population mean of the study variable having one auxiliary variable . Building on this, we adapt the exponential product-type estimators for estimating the population mean of the study variable in the presence of non-response using two auxiliary variables and .
The bias and MSE of are given as:
Kumar and Bhougal[19] proposed a ratio-product type exponential estimator following Singh et al. (2008a, 2008b), for estimating the finite population mean of a study variable having one auxiliary variable . Following Kumar and Bhougal,[7] we adapt the exponential ratio-type estimators for estimating the population mean of the study variable in the presence of non-response, utilizing two auxiliary variables and , giving as:
The bias and MSE of are given as:
where .
Proposed Estimator
Following Hansen and Hurwitz[2] technique of dealing with non-response, and motivated by the estimators in the review section, in this article, we propose a difference-cum-exponential type estimator using two auxiliary variables and to estimate the population mean in the presence of few missing observations when the non-response occurs on both study variable as well as auxiliary variables ), and the population means of the auxiliary variable is known. The proposed estimator is given as:
where are real constant to be determined such that the MSE of is minimum.
Bias and MSE of the Proposed Estimator
The bias and MSEs of the proposed estimator to the first order of approximations are derived under large sample approximations.
Expressing in terms of s, we can write:
Expanding the right-hand side of Equation (3.2):
and neglecting the terms involving powers of s greater than two, we have
Taking expectation on both sides of Equation (3.3), we get the approximate expression for the bias of the estimator as:
Squaring of Equation (3.3) on both sides and neglecting terms of s involving powers greater than two, we have:
Taking expectation on both sides of Equation (3.5), we get the first order approximation of the MSE of as:
where
Optimum Choice of and the Minimum MSE of Proposed Estimator
To obtain the optimum values of and , corresponding to minimum variance, differentiate the expression of MSE in Equation (3.7) with respect to and and equate them to zero. The optimum value of and accordingly are obtained by solving the following set of simultaneous equations:
This system can be written in matrix form as:
where, , ,
Solving Equation (3.9), we get the optimum values of ( as:
where
Substituting the optimum values of , and in Equation (3.7), the resulting minimum MSE of the proposed estimator is given by:
If and are satisfied.
Theoretical Efficiency Comparison
The proposed estimator is better in terms of efficiency with and the other estimators , utilizing two auxiliary variates, if the following conditions are satisfied:
Numerical Illustration
To illustrate the efficiency comparison of the theoretical results, we consider a real data set used by Khare and Sinha.[20] The description of the dataset is given below:
Population 1: The data on physical growth of the upper socio-economic group of 95 schoolchildren of Varanasi under an Indian Council of Medical Research (ICMR) study, Department of Paediatrics, Banaras Hindu University, during 1983–1984 have been taken under study. The first 25 per cent (i.e., 24 children) units have been considered as non-responding units. Here, we have taken the study characters and the auxiliary characters as follows:
: weight (in kg) of the children
: skull circumference (in cm) of the children
: chest circumference (in cm) of the children
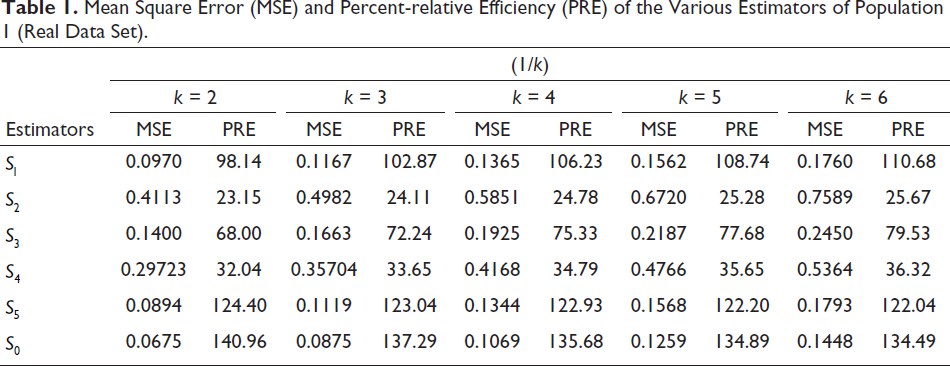
The MSEs and percent-relative efficiencies (PREs) of the proposed various existing estimators with respect to the usual unbiased estimator for different values of k are calculated by using the formulae:
Mean Square Error (MSE) and Percent-relative Efficiency (PRE) of the Various Estimators of Population 1 (Real Data Set).
Estimators
(1/k)
k = 2
k = 3
k = 4
k = 5
k = 6
MSE
PRE
MSE
PRE
MSE
PRE
MSE
PRE
MSE
PRE
0.0970
98.14
0.1167
102.87
0.1365
106.23
0.1562
108.74
0.1760
110.68
0.4113
23.15
0.4982
24.11
0.5851
24.78
0.6720
25.28
0.7589
25.67
0.1400
68.00
0.1663
72.24
0.1925
75.33
0.2187
77.68
0.2450
79.53
0.29723
32.04
0.35704
33.65
0.4168
34.79
0.4766
35.65
0.5364
36.32
0.0894
124.40
0.1119
123.04
0.1344
122.93
0.1568
122.20
0.1793
122.04
0.0675
140.96
0.0875
137.29
0.1069
135.68
0.1259
134.89
0.1448
134.49
Simulation Study
For the purpose of comparison of the proposed estimator, we conducted the simulation study and computed the PRE of the estimator for artificially generated data. We computed the PREs of various existing estimators with respect to the usual unbiased estimator for different values of k by using the formulae:
The simulation study has been carried out to illustrate and compare the performance of the proposed estimator with the existing and adaptive estimators . In this simulation study, we consider two artificial populations described as follows:
Population 2: A population of size , with one study variable and two auxiliary variables and , is generated from the normal distribution, where the study variable is correlated with auxiliary variables and . Non-response occurs in both study and auxiliary variables. The variables are generated using the MVNORM package in the R software. From this population, we draw a sample of size , and then consider cases as missing randomly, that is, there are non-respondent units in the sample. The values of MSE for all the considered estimators and PRE with respect to are calculated for the adapted and proposed estimators for different values of . The result of these calculations is shown in Table 2.
Population 3: An artificial population is generated of size , which involves one study variable and two auxiliary variables , where both the variables are correlated. Non-response occurs in both the study variable and auxiliary variables . The variables are generated using the MVNORM package in the R software. From this population, we draw a sample of size and consider as non-response from the sample and calculate PRE for different values of (shown in Table 3).
The PREs of the proposed estimators are computed through 10,000 repeated samples of size , following the non-response technique. The process involves the following steps:
Draw a random sample of size from the population of size .
From each selected sample units are treated as non-responses.
Calculate the estimators and their MSEs for each sample, and then compute the mean over all 10,000 samples.
The MSE and PREs are given by:
Based on 10,000 repeated samples, the values of PREs are recorded and reported in Tables 2 and 3.
Percent-relative Efficiency Based on Population 2 (Artificially Generated Normal Population).
k = 2
k = 3
k = 4
k = 5
k = 6
100.00
100.00
100.00
100.00
100.00
45.52
53.97
62.43
70.88
79.33
11.38
13.49
15.61
17.72
19.83
194.05
230.09
266.13
302.17
338.21
26.41
31.31
36.22
41.12
46.026
220.47
261.19
301.87
342.51
383.10
243.98
288.59
332.79
376.48
419.61
Percent-relative Efficiency Based on Population 3 (Artificially Generated Normal Population).
k = 2
k = 3
k = 4
k = 5
k = 6
100.00
100.00
100.00
100.00
100.00
43.5905
48.1178
52.6452
57.1725
61.6998
8.1391
8.9845
9.8298
10.6752
11.5205
189.3557
209.0224
228.6890
248.3556
268.0222
20.6617
22.8076
24.9536
27.0995
29.2454
219.0583
241.5701
264.0697
286.5604
309.0444
237.6378
262.7540
287.8705
313.0039
338.1565
Interpretation of the Computational Results
The following interpretation can be drawn from Tables 1–3:
For the real population, the results are shown in Table 1. It is evident that the proposed estimator outperforms the other existing estimators, including adaptive estimators, in terms of MSE and PRE. Table 1 indicates that the PREs of increase, while the PREs of the and decrease as the value of increases.
The PRE values calculated in Tables 2 and 3 for artificially generated populations from a normal distribution, for various values of and different non-response , show that the proposed estimator consistently yields better results than the existing and adaptive estimators. From Tables 2 and 3, it can be observed that the PREs of the and increase as the value of increases. The results of this simulation study clearly demonstrate that the proposed estimator performs better in comparison to the conventional estimators.
Conclusion
In this article, we have proposed an estimator of the finite population mean of the study variable using two auxiliary variables, considering non-response in both the study variable and the auxiliary variables. The proposed estimator is compared with the usual mean estimator, as well as other existing and adaptive estimators. Computational results based on one real and two artificial populations demonstrate the superiority of the proposed method.
The simulation results confirm the finding derived from the theoretical formula of the MSE. The simulation results also show that the proposed estimator under different populations and varying non-response rates performs better than the other estimators under optimality conditions, as shown in Tables 2 and 3. Therefore, the suggested estimator is to be recommended for practical use.
Footnotes
Acknowledgement
The authors are grateful to the experienced referees for their useful comments and suggestions.
Declaration of Conflicting Interests
The authors declared no potential conflicts of interest with respect to the research, authorship and/or publication of this article.
Funding
The authors received no financial support for the research, authorship and/or publication of this article.
ORCID iDs
Udita Gupta
Anjali Bhardwaj
References
1.
SrinathKP.Multiphase sampling in non-response problems. J Am Stat Assoc1971; 66(335): 583–586.
2.
HansenMH and HurwitzWN.The problem of non-response in sample surveys. J Am Stat Assoc1946; 41(236): 517–529.
3.
CochranWG.Sampling Techniques. 3rd ed. New York: John Wiley and Sons; 1977.
4.
RaoPSRS.Callbacks, follow-ups, and repeated telephone calls. In: MadowWG, OlkinI and RubinDB, editors. Incomplete Data in Sample Surveys; 1983. pp. 33–44.
5.
RaoPSRS.Ratio estimation with sub sampling the non-respondents. Surv Methodol1986; 12: 217–230.
6.
RaoPSRS.Ratio and regression estimators with sub sampling. 1987, pp. 2–16. doi: 10.1016/S0169-7161(88)06020-1.
7.
KhareBB and SrivastavaS.Estimation of population mean using auxiliary character in presence of non-response. Natl Acad Sci Lett India1993; 16: 111–114.
8.
KhareBB and SrivastavaS.Study of conventional and alternative two-phase sampling ratio, product and regression estimators in presence of non-response. Proc Indian Natl Sci Acad1995; 65(II): 195–203.
9.
KhareBB and SrivastavaS.Transformed ratio type estimators for the population mean in the presence of non-response. Commun Stat Theory Methods1997; 26(7): 1779–1791.
10.
OkaforFC and LeeH.Double sampling for ratio and regression estimation with sub-sampling the non-respondents. Surv Methodol2000; 26: 183–188.
11.
TabasumR and KhanIA.Double sampling for ratio estimation with non-response. J Indian Soc Agric Stat2004; 58(3): 300–306.
12.
TabasumR and KhanIA.Double sampling ratio estimator for the population mean in presence of non-response. Assam Stat Rev2006; 20(1): 73–83.
13.
SinghHP and KumarS.A general family of estimators of finite population ratio, product and mean using two phase sampling scheme in the presence of non-response. J Stat Theory Pract2008a; 2(4): 677–692.
14.
SinghHP and KumarS.A regression approach to the estimation of finite population mean in presence of non-response. Aust N Z J Stat2008b; 50(4): 395–408.
15.
SinghHP and KumarS.A general procedure of estimating the population mean in the presence of non-response under double sampling using auxiliary information. SORT2009a; 33(1): 71–84.
16.
SinghHP and KumarS.A general class of estimators of the population mean in survey sampling using auxiliary information with sub sampling the non-respondents. Korean J Appl Stat2009b; 22(2): 387–402.
17.
SinghHP and KumarS.Estimation of mean in presence of non-response using two phase sampling scheme. Statistical Papers. 2010; 50: 559–582. doi: 10.1007/s00362-008-0140-5
18.
SinghS.A new method of imputation in survey sampling. Statistics2010; 43(5): 499–511.
19.
KumarS and BhougalS.Estimation of the population mean in presence of non-response. Commun Korean Stat Soc2011; 18(4): 537–548.
20.
KhareBB and SinhaRR.Estimation of the ratio of the two population means using multi auxiliary characters in the presence of non-response. In: BN Pandey, editor. Statistical Techniques in Life Testing, Reliability, Sampling Theory and Quality Control. New Delhi: Narosa Publishing House; 2007. pp. 163–171.