
Abstract
This article deals with the problem of testing the variances of two normal populations under the assumption that the mean parameters are equal. We propose an approximate likelihood ratio test and a test based on bootstrap observations. Two computational approach tests are suggested using the maximum likelihood estimators of the model parameters. Further, several generalized test methods are discussed to test the variances. Through a detailed Monte Carlo simulation study, the performances of the proposed test procedures are compared numerically in terms of their sizes and powers. Finally, we present real-life data sets to demonstrate the potential applicability of the suggested test procedures.
Introduction
Suppose there are two independent random samples

where λ0 is some known specified value of λ1. Under the current model set-up, researchers were fascinated in inferring the common mean parameter μ because of its wide variety of applications in the meta-analysis, inter-block designs, medicine, agriculture, economics and other related fields. Graybill and Deal[1] were likely the first to look into the problem of estimating the common mean μ, and proposed a combined improved estimator for μ, which depends on the sample variances. This estimator outperforms the sample means when sample sizes exceed 10. Later on, many researchers conducted significant research to obtain certain classical as well as decision-theoretic results. For some interesting results and a detailed review of the point estimation of the common mean parameter of two independent normal distributions, we refer to the articles by Kubokawa,[2] Pal and Sinha,[3] Pal et al., [4] Tripathy and Kumar,[5], Rukhin,[6] and the references cited therein. From a Bayesian perspective, the common mean estimation problem has been investigated by Kelleher[7] and Mitra and Sinha[8].
Fairweather[9] studied the problem of interval estimation of the common mean μ. The author used a linear combination of Student’s t-statistics as the pivot variable and determined an exact confidence interval for parameter μ. Jordan and Krishnamoorthy[10] utilized the idea of Fairweather[9] and derived confidence intervals for μ using a linear combination of independent F-statistics. Cohen and Sackrowitz[11] derived several test procedures for parameter μ, such as t-tests, Fisher’s combined test, likelihood ratio test (LRT) and tests based on the Bayesian approach. For some noteworthy contributions and interesting papers concerning hypothesis testing and interval estimation on the common mean of two or more normal populations, readers may look into the articles of Krishnamoorthy and Lu,[12] Chang and Pal,[13] Li and Williamson,[14] Malekzadeh and Kharrati-Kopaei[15] and the references cited therein.
The common mean problem for two or more normal populations has received considerable attention in the literature on statistical inference. However, some researchers are also curious about inferring the scale parameter (namely, the variances) or any function of it. In one population case, Strawderman[16] proposed a class of minimax estimators and a class of generalized Bayes estimators for estimating positive powers of the variance. Maruyama and Strawderman[17] derived a class of minimax generalized Bayes estimators for the variance of a single normal population under entropy and quadratic loss. Using the linearly exponential (Linex) loss function, Zou et al.[18] proposed an improved Stein-type estimator for the standard error for the case of the single normal population. The authors further extended their results to any power of the standard deviation. In this sequel, Bobotas and Kourouklis[19] investigated the estimation problem of normal variance ratio and precision parameters when samples are available from two independent normal distributions with unknown means. The authors derived a class of smooth and simple estimators for the ratio parameter by considering the quadratic and entropy loss functions. From a decision-theoretic perspective, Tripathy et al.[20] investigated the problem of estimating the common standard deviation, whereas Patra et al.[21] studied the estimation problem for the common variance of multiple normal populations.
In this article, we revisit the model previously studied by Jena et al.[22] and focus on the problem of testing the hypothesis about the variances. In regression problems, the error variances or the standard errors play an important role; hence, it is vital to study them. Jena et al.[22] considered the point and interval estimation of powers of the variances for two normal populations under equality restriction on the mean parameters. The authors considered various interval estimators, including some generalized confidence intervals based on certain exciting estimators of ‘the common mean μ’. Utilizing the combined estimators of μ, several plug-in estimators are constructed for the variance parameters λi; (i = 1, 2), and corresponding generalized test variables have been derived to propose some generalized test methods. In addition, we have also presented a few more test procedures based on a computational approach and compared their performances with all these generalized test procedures. Our simulation investigation reveals that these generalized test procedures do not perform well, unlike in the case of confidence intervals, where the generalized intervals are the second best, the first being the highest posterior density interval.
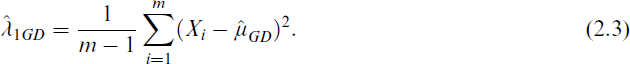
The organization of the article is structured in the following manner. Section 2 introduces some fundamental point estimators for λ1, including the maximum likelihood estimator (MLE), the unbiased estimator and several plug-in estimators using the existing estimators of ‘the common mean μ’. Section 3 is devoted for testing hypothesis on λ1. Specifically, Subsection 3.1 presents the asymptotic LRT, whereas in Subsection 3.2, we propose a bootstrap-based LRT. Subsection 3.3 discusses two computational approach tests (CATs) that use the MLEs of the model parameters. In Subsection 3.4, we utilize the plug-in estimators and propose several test methods with the help of generalized p value method. A comprehensive simulation study is carried out to measure the effectiveness of the suggested tests with respect to their sizes and powers. Section 4 demonstrates the practical relevance of the proposed methodologies utilizing real-life data examples and concludes with a summary of key observations in Section 5.
This section provides a review of point estimation methods for the variances of two normal populations under the assumption that their means are equal.
Various point estimators, such as the MLEs and different plug-in estimators for the powers of the variances, have been derived by Jena et al.[22] by incorporating information from both populations through existing well-established estimators of μ. One can directly get all these estimators for λ1 by substituting k = 1. However, for the sake of completeness, we discuss these without giving the details. Let us consider independent random samples

Closed-form expressions for the MLEs of parameters μ, λ1 and λ2 are not available.[4] Consequently, we obtained the MLEs numerically by solving a non-linear system of three equations in three unknowns, as given in Jena et al.[22] The resulting solutions, denoted as
Further,

It is challenging to obtain a uniformly minimum variance unbiased estimator for λ1 because the sufficient statistics
Similarly, using the other combined estimators
The primary focus of this study is to construct several testing procedures for testing the hypothesis H0 against the alternative Ha. The above point estimators will be utilized in constructing certain generalized test procedures (see Subsection 3.4). In the subsequent section, we discuss various test procedures, including these generalized tests.
Several test procedures to test hypothesis about the variance of the first population, that is, for testing hypothesis on λ1 are discussed in this section. Specifically, we derive the conventional LRT, a parametric bootstrap version of the LRT, two computational approach-based tests and certain generalized p value approach tests.
The Likelihood Ratio Test
Let the observed values of

To construct the LRT statistic, it is needed to maximize the likelihood function L over the whole parameter space
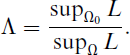
The exact distribution of the LRT statistic Λ cannot be obtained since it is difficult to derive the closed-form expression of the MLEs of the associated parameters under null hypothesis H0 and also over the complete parameter space Ω. Therefore, we use Λ* = −2 log Λ as the test variable, which is asymptotically a

Since the LRT is asymptotic and its cut-off points are found using the chi-square random variable, it may provide inappropriate findings for small sample sizes. Because of this, LRT is often not appropriate for real-life situations. To handle this problem, Chang et al.[23] suggested the PBLRT method, where the distribution of the test variable Λ* is repeated many times using the bootstrap replications generated under H0. As a consequence, the test’s cut-off points are found automatically. Step-by-step instructions for implementing the PBLRT procedure’s algorithm for computing size values and power functions are as follows:
Step-1: Based on the sample observations(X1, X2, …, Xm) and (Y1, Y2, …, Yn) from two populations N(μ, λ1) and N(μ, λ2), one determines the value of the test variable Λ*. Step-2: Assume that the null hypothesis H0 is true. Under this situation, determine the MLEs for parameters μ and λ2, call them as Step-3: Compute the estimates Step-4: Define

Pal et al.[24] proposed a general approach for testing hypothesis, known as the CAT. In general, the CAT technique is a parametric bootstrap-based testing procedure; it is a computational method that utilizes the MLEs and operates without requiring prior knowledge of the sampling distribution of the test variable. This section applies the CAT procedures to our model problem to test H0 against Ha. Step-by-step instructions for implementing the CAT procedure’s algorithm for calculating size values and power functions are given below:
Step-1: Based on the sample observations (X1, X2, …, Xm) and (Y1, Y2, …, Yn) from two populations N(μ, λ1) and N(μ, λ2), one must evaluate the associated MLEs Step-2: Assuming that H0 holds, obtain restricted MLEs ˆμRML and λˆ2RML for the parameters μ and λ2,, respectively. Step-3: Generate bootstrap replicates Step-4: Let

Further, we consider a modified version of the CAT known as the modified CAT. The two-sided hypothesis testing problem given in Equation (1.1) can be reformulated as a one-sided test as:

The algorithmic steps needed to perform the modified CAT (denote as Bootstrap replicates are generated as described earlier and the quantity Compute the statistic

This well-known technique was first introduced by Tsui and Weerahandi[25] and has since been effectively employed by academicians for constructing test statistics; for example, see Khatun et al.[26] It is noted that these test methods have been generalized for fiducial inference by Hannig[27] and Hannig et al.[28] The following definition and remark facilitate the construction of test statistics for hypothesis testing.
Consider a variable Y, whose distribution depends on parameters (β, κ), where β represents the parameter of primary interest and κ is a nuisance parameter. Suppose the interest is in testing the hypothesis:

where β0 is a known constant.
For a fixed y, the distribution of Q(Y; y, β, κ) is free from the nuisance parameter κ.
The value of Q(Y; y, β, κ) at Y = y, that is, the observed value of Q(Y; y, β, κ) is free of any unknown parameters.
When the values y and κ are fixed, the distribution of Q(Y; y, β, κ) is either stochastically increasing or decreasing with respect to β.

and when the distribution of Q(Y; y, β, κ) exhibits a stochastically decreasing behaviour with respect to β, the generalized p-value is determined by:

Next, we explore the idea of the generalized p value approach to test the hypothesis about the variance parameter λ1. Considering the unbiased estimator
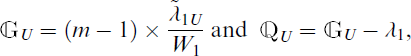
respectively, where

It is noted that for testing hypothesis about λ1, the generalized test based on the unbiased estimator
where

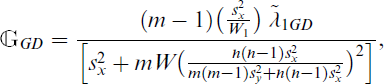
In a very similar manner, we use the other plug-in estimators of λ1, namely
Note that none of the above test methods has a closed-form expression, except for the generalized p value approach tests. Also, it is hard to figure out the exact distribution of the generalized test variables. As a result, an analytic evaluation of either their size values or power functions is quite impossible. Therefore, in this section, we try to assess and compare the efficiencies of the suggested test techniques in terms of size values and power functions numerically using the high-level computing resources accessible today.
To compute the sizes and powers of the suggested test techniques, we have generated 10, 000 random observations of size m and n from N(μ, λ1) and N(μ, λ2), respectively. The simulation study has been done using the program through R software version 4.3.1. The inner loop has been replicated 10, 000 times for the PBLRT, CATs and generalized test procedures. The size of each suggested test is evaluated by setting μ = 0, λ1 = 1, and varying ρ via the value of
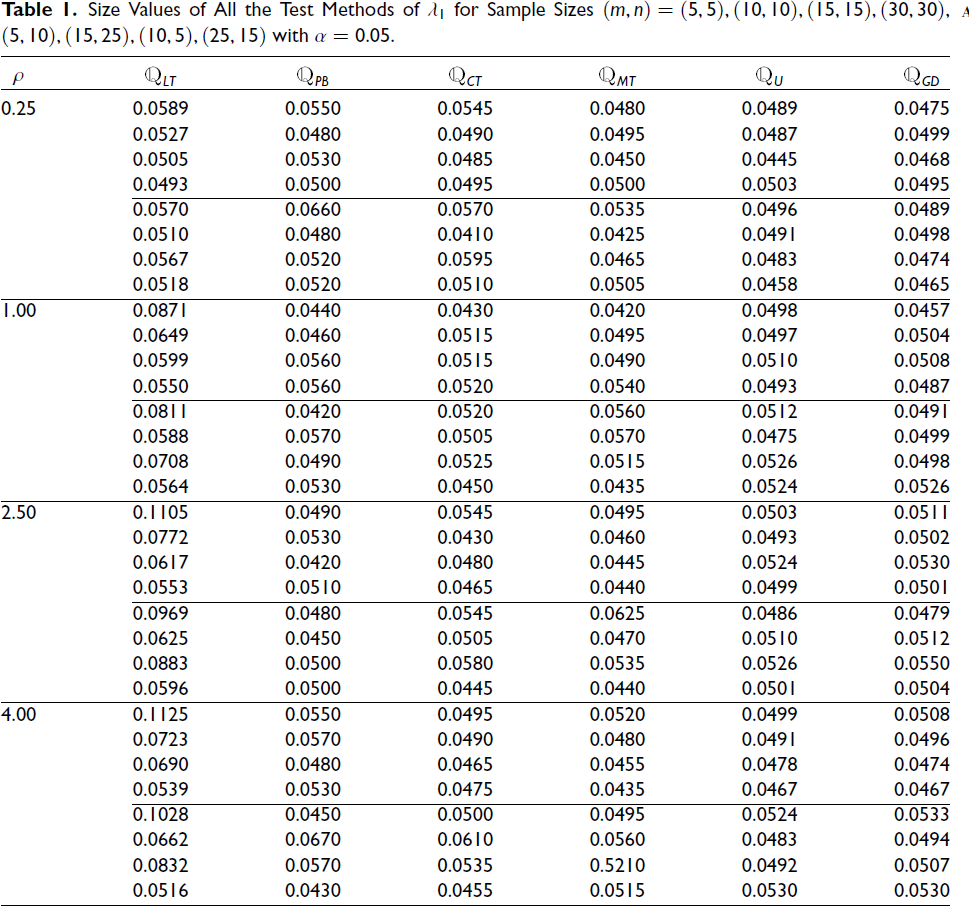
Size Values of All the Test Methods of λ1 for Sample Sizes (m, n) = (5, 5), (10, 10), (15, 15), (30, 30), (5, 10), (15, 25), (10, 5), (25, 15) with α = 0.05.
Size Values of All the Test Methods of λ1 for Sample Sizes (m, n) = (5, 5), (10, 10), (15, 15), (30, 30), (5, 10), (15, 25), (10, 5), (25, 15) with α = 0.05.
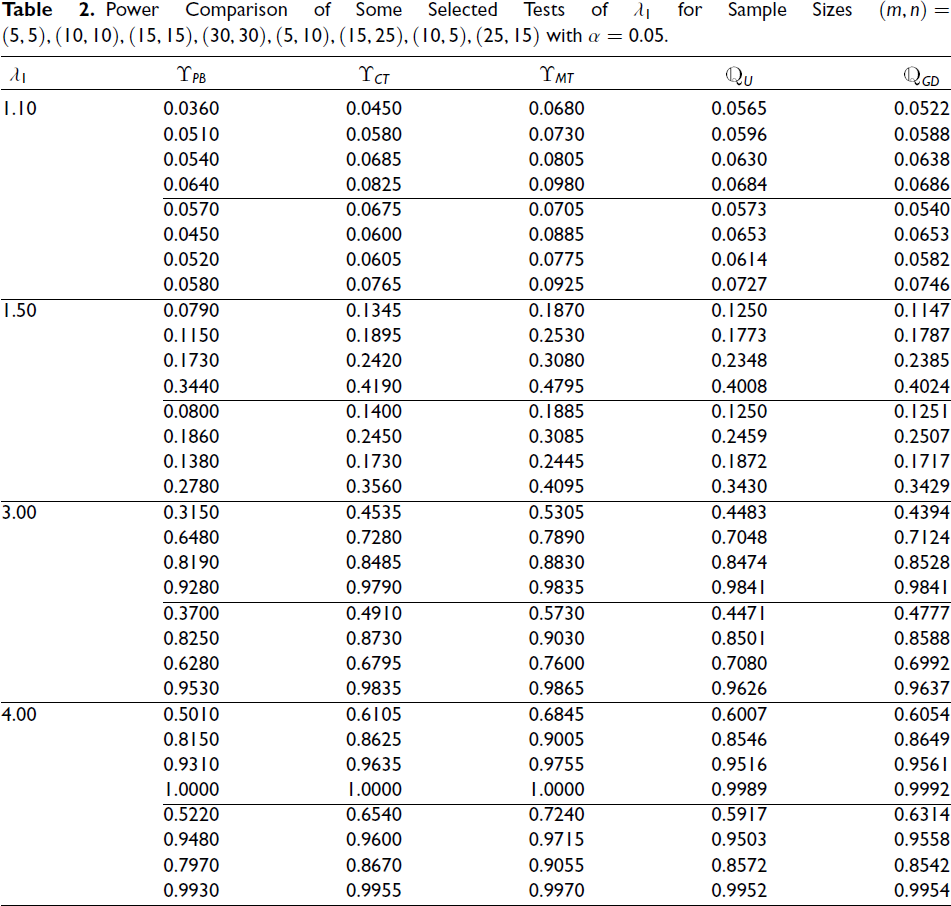
An extensive simulation analysis was carried out for a range of sample size combinations and parameter values, but for the sake of concise presentation, only the size and power functions corresponding to selected configurations are reported. Initially, we determined the size values of all test methods using the null hypothesis H0 and the simulated results are reported in Table 1. In Table 1, for each choice of ρ (in the first column), there are eight values representing the size values corresponding to eight different sample combinations. Moreover, the powers of some selected tests (those that attain the significance level within 20 per cent) are computed for several sample size combinations, and these are tabulated in Table 32. In Table 2, for a particular value of λ1, there are eight values that represent the powers for eight different sample combinations. The entries in the tables are to be interpreted sequentially from top to bottom according to the specified order of the sample sizes. A detailed summary of the performance of all the test methods, along with the key findings from Tables 1 and 2, is presented below:
For testing the hypothesis about λ1, except for the LRT, the tests The tests obtained using the generalized p value approach are pretty much conservative, in the sense that they more consistently achieve the level α = 0.05. The PBLRT and both CAT and modified CAT are quite liberal and attain the size value less frequently. In comparing the efficiencies of the selected tests (those that attain the size value α = 0.05 within 20 per cent) based on their powers, it is observed that the power increases with an increase in sample sizes. Furthermore, for a fixed sample size, the power functions of these tests are seen to increase as the values of λ1 become larger. In terms of power, a clear-cut ranking among all the generalized test procedures, namely In terms of power performance, the modified
Power Comparison of Some Selected Tests of λ1 for Sample Sizes (m, n) = (5, 5), (10, 10), (15, 15), (30, 30), (5, 10), (15, 25), (10, 5), (25, 15) with α = 0.05.
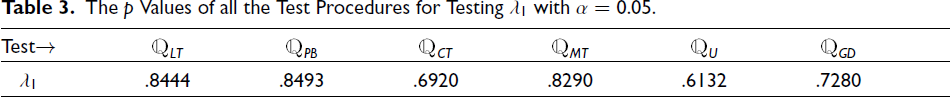
The p Values of all the Test Procedures for Testing λ1 with α = 0.05.
In this section, two real-life applications are considered, and the corresponding datasets are utilized to demonstrate the proposed test methodologies.
Utilizing the Shapiro–Wilk test, it is seen that both the data sets follow a normal distribution at α = 0.05 level, and the corresponding p values are obtained as .7309 and .2702, respectively. Using the F-test, as the ratio of the sample variances (
Again, the equality of the mean parameters is checked at α = 0.05 significance level considering Welch’s t-test, and it holds true with a p value of 0.5829. Considering these two data sets, the hypothesis (i) H0 : λ1 = 209.4191 versus
The p Values of all the Test Procedures for Testing λ1 with α = 0.05.

The p Values of all the Test Procedures for Testing λ1 with α = 0.05.
For the present analysis, two groups have been selected, with summary statistics given by
In this article, we studied the problem of hypothesis testing about the variances of two normal populations under the constraint of a common mean. The main purpose is to propose some test procedures based on information from the other population through common mean estimators. Several test procedures are proposed, such as the LRT, the PBLRT, the CAT along with its modified version, and tests based on the generalized p value framework. It is noteworthy that, with the exception of the generalized test
Interestingly, all the generalized tests, including the test
The theoretical and computational results regarding the performances of all the test procedures presented in this study remain valid for testing hypotheses on the standard deviation, precision and other powers of the variances under the common mean set-up for two normal populations.
Footnotes
Acknowledgements
The authors would like to express gratitude to the reviewers and the editor-in-chief for their insightful comments that led to substantial improvement of the manuscript. The first author (Pravash Jena) gratefully acknowledges the support of the Odisha State Higher Education Council (OSHEC), Odisha, India, under the Mukhyamantri Research and Innovation Program [MRI/24EM/MT/89]. The second author (Manas Ranjan Tripathy) gratefully recognizes the financial assistance provided by the Science and Engineering Research Board (SERB), Department of Science and Technology [CRG/2023/002586].
The Link for R-Codes
Declaration of Conflicting Interests
The authors declared no potential conflicts of interest with respect to the research, authorship and/or publication of this article.
Funding
The authors received no financial support for the research, authorship and/or publication of this article.