
Abstract
Objective. To report the prevalence of favorable growth patterns, including healthy weight maintenance (HWM) and return to healthy weight (RHW) among US school-age children. Methods. A longitudinal analysis of childhood growth patterns from the Early Childhood Longitudinal Study–Kindergarten Cohort was completed (n = 9416). The primary outcome included describing the prevalence of HWM/RHW patterns using consecutive child growth data from kindergarten to fifth grades. Multivariate logistic regression was used to explore predictors of HWM/RHW. Incidence of RHW is calculated by grade level. Results. Seventy percent (n = 6617) of children enter kindergarten at a healthy weight and approximately 70% maintained a healthy weight through fifth grade. Among overweight/obese kindergartners, only 17.1% outgrew their weight risk (RHW) by fifth grade. Conclusions. Fewer than 1 in 5 at-risk children outgrow their weight risk during school-age yet a majority of healthy weight children can maintain healthy weight during a critical growth period. Future work should explore additional socioecologic factors associated with favorable growth.
Background
Although increased attention to the incidence and prevalence of pediatric obesity have informed predictors for disease,1-5 few studies have informed what factors may predict a child’s ability to remain at or return to a healthy weight. Consideration of those unaffected by disease has historically yielded meaningful insights into disease physiology6-10 thus an enhanced focus on children able to maintain a healthy weight during the pediatric obesity epidemic is worthy of study. Furthermore, despite a growing body of evidence that delineates the importance of early childhood weight in predicting long-term weight outcomes,2,11-13 expectations that most young children will “outgrow” being overweight or obese and are highly prevalent.14-17 Interestingly, the frequency by which children outgrow their obese status in later childhood has infrequently been reported. Prior studies have described children returning to healthy weight (5%) in a limited sample of children with psychiatric illness over an eight year observational period. 18 Among adolescents, Nonnemaker et al 1 described the prevalence (8%) of a group of subjects described as “low risk for obesity trajectory" when youth were followed into adulthood but a description of their earlier life trajectory in the context of their later risk was not reported. Though these studies are helpful and reveal the infrequent prevalence of favorable growth patterns among two populations, a description of the prevalence of return to healthy weight among a diverse sample of young children is a necessary epidemiologic piece to address prevailing growth misperceptions 19 that may pose barriers promoting early behavior change. Thus, an examination of factors relating to healthy weight maintenance (HWM) and return to healthy weight (RHW) may provide novel insights into the pediatric obesity epidemic.
The concept of resilience to a disease state has received increased attention secondary to the observation that not all at-risk individuals are predestined for adverse outcomes. The study of resilience is concerned with individual variations in response to risk and underlines the need to assess interactions between risk factors and protective factors in addressing health issues. 20 Because racial/ethnic and socioeconomic disparities are substantial in pediatric obesity,21,22 an understanding of factors that may promote resilience to obesity as manifested by patterns like HWM or RHW, among at-risk populations would be critical. In a population of disadvantaged minority women, Ball et al 23 determined that younger age, higher education, and higher income promoted resilience to obesity. Though the factors analyzed in this context of resilience may be considered immutable factors that may not be behaviorally modified, such unique epidemiologic patterns are often initially described in this manner4,22,24,25 with additional socioecologic factors (ie, behaviors, environment, physiologic) later identified. A similar descriptive analysis of resilience in a diverse population of young children would be of great value, however, robust longitudinal samples, including racially/ethnically diverse groups such as Hispanic and Asian children have been limited.
The primary objective of this study is to report the prevalence of patterns that may reflect obesity resilience (HWM and RHW) during the prepubertal school age. By using a diverse, nationally representative sample of 5- to 11-year-old US children, we examine the frequency of these growth patterns and determine whether these patterns vary by child age, race/ethnicity, and parental socioeconomic status (SES). We hypothesize that child starting kindergarten as overweight or obese will infrequently be able to return to healthy weight by later school age whereas children who initiate school at a healthy weight will demonstrate the greatest likelihood of maintaining their weight at later school age. This focused, descriptive approach will serve to gain a preliminary understanding of these patterns by which additional work can continue to explore the socioecologic factors related to these patterns. Prior longitudinal studies1,5,18 have described trajectories relative to the development of overweight or obesity but have not explicitly reported the prevalence or incidence of these HWM or RHW patterns in a diverse, national sample of children. This analysis provides a valuable opportunity to describe individual differences that may pertain to obesity resilience.
Methods
Study Population
The study examined data from the Early Childhood Longitudinal Study–Kindergarten Cohort (ECLS-K), a nationally representative sample of 21 260 US children designed and conducted by the National Center for Education Statistics. The multistage probability sampling design included counties/groups of counties as the primary sampling units, schools within the counties as secondary sampling units, and students within schools as tertiary sampling units. 26 We excluded children in the final data collection wave (spring, eighth grade) to limit the likelihood of pubertal changes from confounding growth estimates, especially in the absence of pubertal assessment available within the dataset. Participants with study assessments during kindergarten through fifth grades were identified (kindergarten Spring 1999, first grade Spring 2000, third grade Spring 2002, fifth grade Spring 2004; n = 10 673).
We further identified children within this subset who had complete height and weight measurements in all 4 data collection waves of interest (n = 9657). A comparison of age, gender, race/ethnicity, SES, and weight status at baseline in the sample of children with complete anthropomorphic data with the original sample was completed. This analysis revealed similar distributions of all variables in the 2 samples with the exception of 1% fewer Hispanic children in the analytic sample suggesting that our analytic subsample was representative of the larger sample. In light of these results and in consideration of the low percentage of missingness for height/weight (<4%), we did not elect to impute missing data as it would have offered little advantage; an analytic approach recently described by Cumming. 27 Additionally, children with biologically implausible height/weight measurements in this group were excluded (eg. children who had a height decrease >2 cm on subsequent waves and children with weight gain >20 lbs per study year). This excluded 241 participants with a final analytic sample of 9416 children. The recommended ECLS-K sample weight, which accounts for missing data and oversampling, was used in all descriptive and regression analyses.
Variables including age, gender, race/ethnicity, and SES were selected as key variables by which to describe school-age growth patterns. Oversampling of Hispanic, Asian and Pacific Islander children was achieved with subsequent sample weights provided to account for participant selection and for the effects of nonresponders. 26 Based on parent report, children were categorized as non-Hispanic white, non-Hispanic black, Hispanic, Asian and other race (includes children of more than 1 race, Native Hawaiians/Pacific Islanders, and American Indians/Alaskan Natives. Socioeconomic quintiles were collapsed into 3 categories for the multivariate regression analysis (highest quintile = high income, quintiles 2-3 = middle income, quintiles 4-5 = low income). This study was approved by the Johns Hopkins University School of Medicine Institutional Review Board.
Evaluation of Data
At each data collection wave, 2 measurements of both child height and weight were taken with the average of the measures reported. ECLS-K staff measured child height and weight using the Shorr Board for height and a digital scale for weight. Age- and gender-specific body mass index (BMI) were calculated using measured height/weight with Epi Info 3.5 software. 28 Child BMI was then used to classify children into key weight categories: underweight (<5th percentile), healthy weight (≥5th percentile to <85th percentile), overweight (≥85th percentile to <95th percentile), and obese (≥95th percentile). 29 The latter 2 categories were combined into an “at-risk” category for the purposes of describing growth patterns. Child BMI classification was conducted for each of the 4 data collection waves such that each participant contributed 4 distinct BMI assessments over the study period.
We first explored all variable weight category transitions exhibited by participants in a manner similar to other studies investigating weight change over time using the ECLS-K data set.30,31 Details of all growth patterns identified in this first stage of analysis are provided (see the appendix). We then began our focused analysis of obesity resilient patterns, including healthy weight maintenance (HWM) and return to healthy weight (RHW) that were defined in the following manner:
Healthy weight maintenance (HWM): Healthy weight at all 4 waves (BMI ≥5th to <85th percentile)
Return to healthy weight (RHW): Overweight in prior wave (BMI ≥85th percentile) with subsequent transition to healthy weight (BMI ≥5th to <85th percentile)
Because we were specifically interested in these 2 mutually exclusive groups based on weight status in 4 different waves to reflect resilience, we did not use trajectory analysis for our prevalence estimation. This strategy of defining unique growth patterns to understand epidemiologic trends has been used successfully in previous studies.30-32 Thus, our prevalence estimates were completed such that participants demonstrating HWM (as defined above) were compared with participants who started within the cohort at healthy weight and later transitioned to becoming at risk (see the appendix, Healthy Weight Overweight group, HWOW). Similarly, participants demonstrating the RHW were compared with children who remained at-risk in all 4 waves (see the appendix, At-Risk Maintenance group, ARM). Overweight/obese children were classified as “returning to healthy weight” after demonstrating 2 or more data points in healthy weight category to promote and understanding of a sustained growth pattern versus one that was transitory. We described the baseline prevalence of growth patterns as well as the prevalence of growth patterns observed over the 5-year study period.
Statistical Analyses
As with prior weight prevalence reports,3,25 we stratified our growth pattern prevalence according to gender, race/ethnicity, and by socioeconomic tiers to best understand growth patterns. Logistic regression models, accounting for the multilevel design of ECLS-K, were used to estimate odds ratios (OR) and 95% confidence intervals (95% CI) for the associations between covariates and HWM or RHW growth patterns. As previously described two separate regression models were completed whereby (1) participants demonstrating HWM were compared to participants who started at healthy weight and transitioned to becoming at risk and (2) participants demonstrating RHW was compared with children who remained at risk in all 4 waves. A focused analysis of incidence of RHW was completed to further explore the role of age in predicting this pattern. Estimates of proportions and ORs in our regression models were weighted using the variables provided by ECLS-K. 26 All statistical analyses were performed using SAS version 9.3 (SAS institute, Cary, NC, USA).
Results
Sample Characteristics
Weighted distributions of sample characteristics are presented in Table 1. The mean age at each wave was 6 (Kindergarten), 7 (first grade), 9 (third grade), and 11 years (fifth grade). Sixty percent of the children were white/non-Hispanic, 13% were African American, 19% were Hispanic, 2.9% were Asian with the remainder defined as other (eg, Native Hawaiian/Pacific Islander, American Indian or multiracial). The majority of children were from low-income (18.3%) or middle-income (61.4%) homes.
Early Childhood Longitudinal Study–Kindergarten Sample Characteristics Kindergarten to Fifth Grades. a
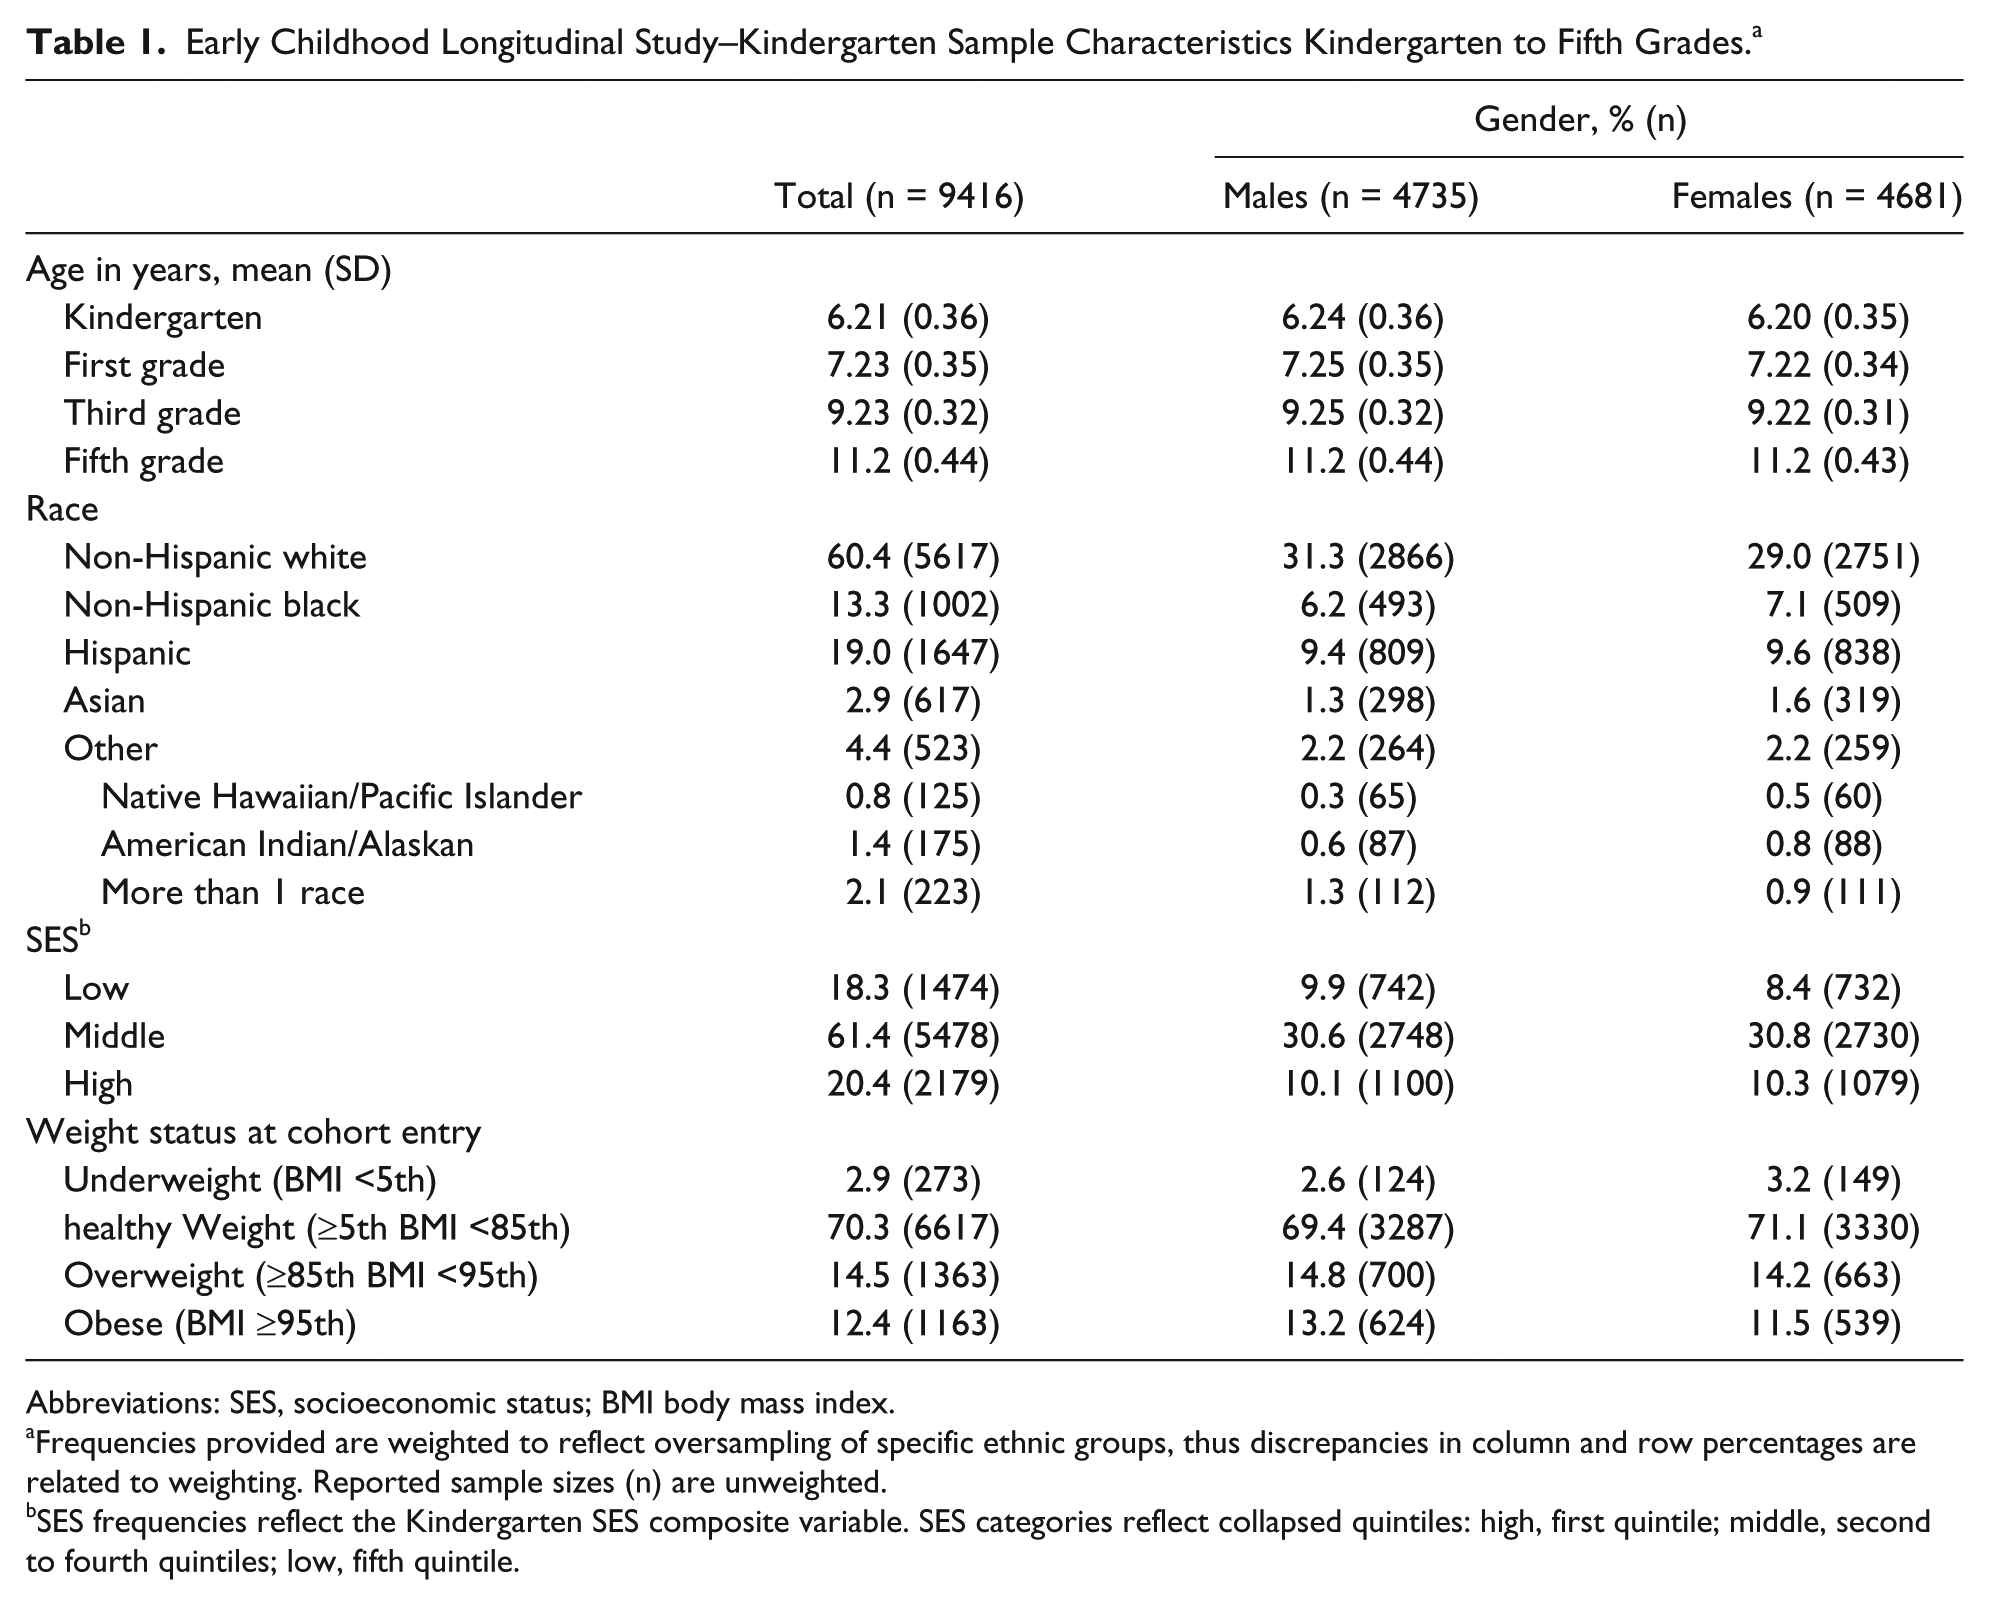
Abbreviations: SES, socioeconomic status; BMI body mass index.
Frequencies provided are weighted to reflect oversampling of specific ethnic groups, thus discrepancies in column and row percentages are related to weighting. Reported sample sizes (n) are unweighted.
SES frequencies reflect the Kindergarten SES composite variable. SES categories reflect collapsed quintiles: high, first quintile; middle, second to fourth quintiles; low, fifth quintile.
At the start of kindergarten 3% of children were underweight, 70% were healthy weight, 14.5% were overweight, and 12.4% were obese (Table 1). On review of weight status change between kindergarten and fifth grades, 10 mutually exclusive growth patterns were identified (see the appendix), including the 2 patterns of interest (HWM and RHW).
Healthy Weight Maintenance
Among children starting at a healthy weight in kindergarten (n = 6617), 69.4% (95% CI 67.2% to 71.6%) maintained their healthy weight during the 5-year study period with girls demonstrating statistically significantly higher prevalence than boys (72.4%, 95% CI 69.6% to 75.2%, P < .001). The prevalence of HWM was greatest among younger children at kindergarten entry (boys, 65.4%; girls, 71.8%) compared with older age children (boys, 45.5%; girls, 65.1%). These differences were statistically significant (P < .0001). Children of higher SES had the greatest rates of HWM, with high-income girls demonstrating the greatest rates of this growth pattern (84.0%, 95% CI 80.4% to 87.6%). The prevalence of HWM was highest among Asian and non-Hispanic white children.
In a multivariate model controlling for age, race/ethnicity, and SES among boys, likelihood of HWM was not associated with key sample factors (Figure 1A). However, in an identical model among girls (Figure 1B), we found that Asian race/ethnicity was statistically significant in predicting HWM when compared with non-Hispanic white girls (OR 2.65, 95% CI 1.29 to 5.42) and non-Hispanic black girls (OR 2.78, 95% CI 1.26 to 6.1; results not shown). Additionally, females within both the middle- and low-income groups were noted to have statistically significantly decreased odds of healthy weight maintenance compared to higher income girls in the sample. This trend, observed for middle-income boys, however, did not achieve statistical significance.
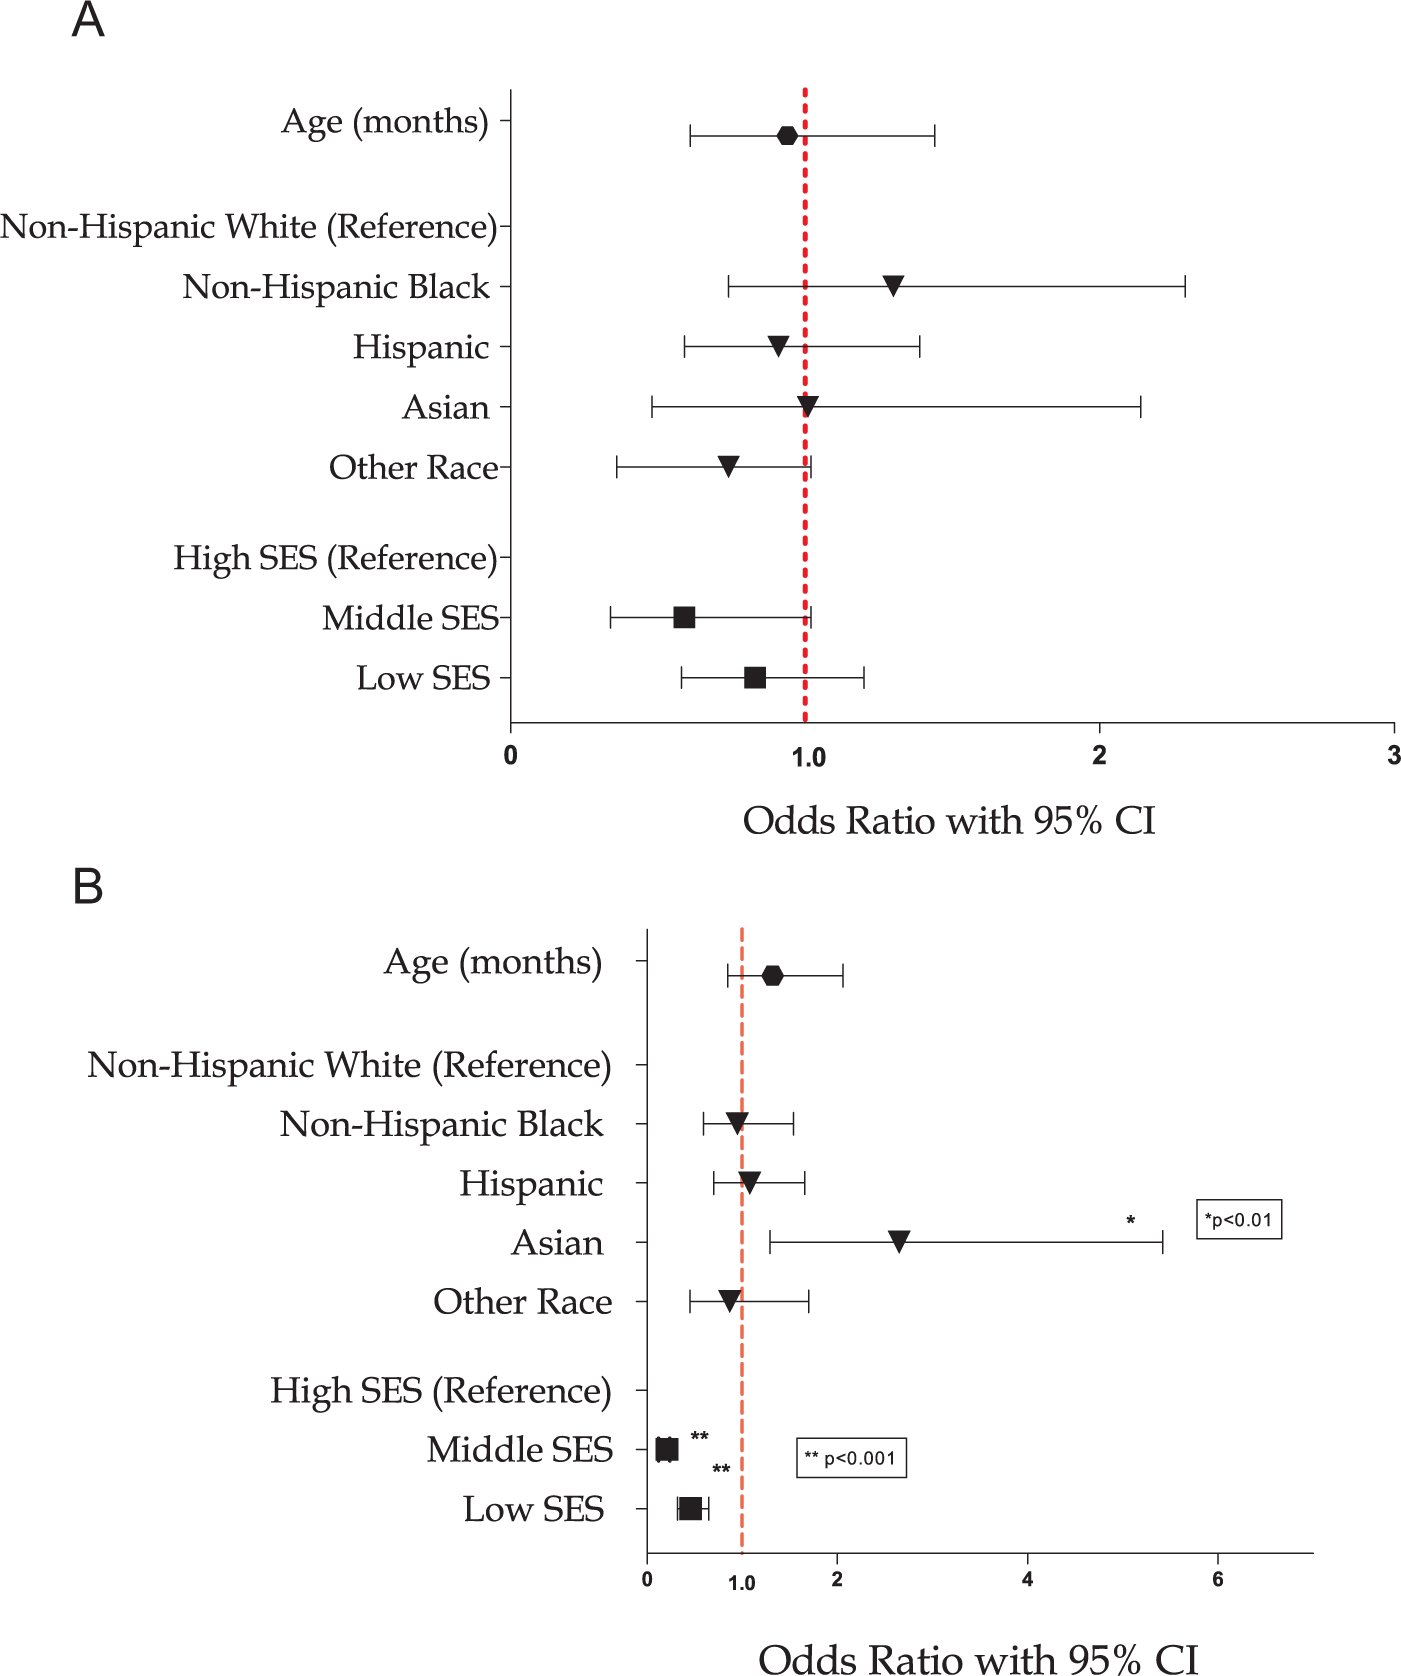
Early Childhood Longitudinal Study–Kindergarten Cohort (kindergarten to fifth grade). Multivariate regression model: healthy weight maintenance. (A) Boys and (B) girls.
Return to Healthy Weight: Prevalence
Though 25% of children started kindergarten as overweight or obese, only 17.1% returned to a healthy weight by fifth grade (n = 432, 95% CI 14.4 to 19.8). Girls had a statistically significantly higher prevalence of “outgrowing” obesity than did boys (Table 2; P < .001). Younger girls (23.9%) and older boys (23.1%) had statistically significant higher rates of RHW compared with other age categories (both P values <.0001). Children of higher SES were noted to have the highest rates of RHW (30.9%, 95% CI 21.9% to 39.9%). Hispanic and Asian males demonstrated the lowest prevalence of RHW (10.3% and 11.0%, respectively).
Prevalence of Obesity Resilient Growth Patterns by Key Sample Demographic Factors, ECLS-K (Kindergarten to Fifth Grade). a
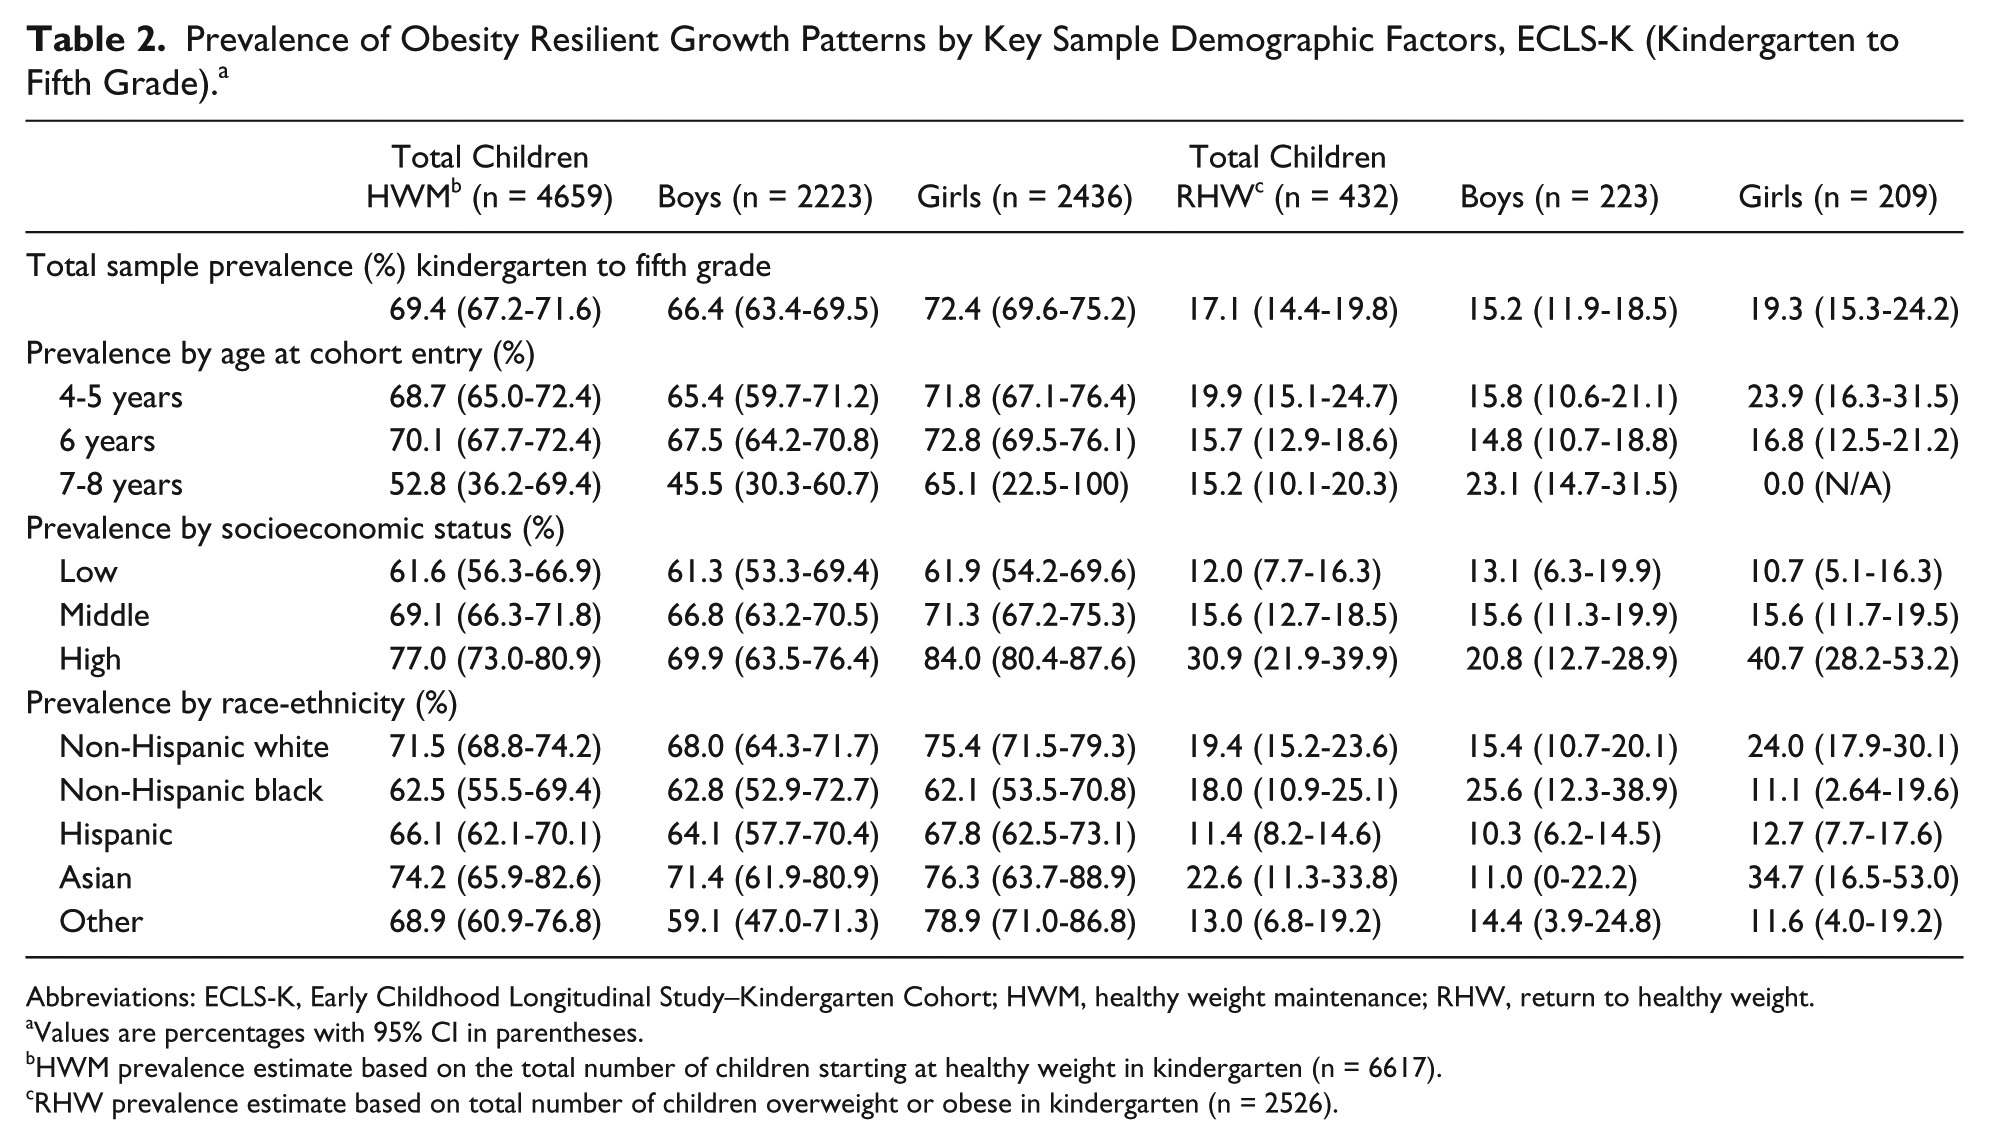
Abbreviations: ECLS-K, Early Childhood Longitudinal Study–Kindergarten Cohort; HWM, healthy weight maintenance; RHW, return to healthy weight.
Values are percentages with 95% CI in parentheses.
HWM prevalence estimate based on the total number of children starting at healthy weight in kindergarten (n = 6617).
RHW prevalence estimate based on total number of children overweight or obese in kindergarten (n = 2526).
In the multivariate regression analysis, we found that Hispanic boys (OR 0.54, 95% CI 0.31 to 0.95) and girls (OR 0.51, 95% CI 0.28 to 0.92) were the least likely racial/ethnic group to return to healthy weight compared with non-Hispanic white children (Figure 2A and B). Hispanic boys remained less likely to return to healthy weight (OR 0.36, 95% CI 0.16 to 0.80; results not shown) when compared with non-Hispanic black children. This relationship was not observed between Hispanic and non-Hispanic black girls. Asian boys in this sample were also noted to have significantly lower likelihood of returning to healthy weight compared with non-Hispanic white and black boys (OR 0.27, 95% CI 0.31 to 0.95 and OR 0.16, 95% CI 0.05 to 0.66, respectively). After adjusting for age and race-ethnicity, girls in the low (OR 0.30, 95% CI 0.16 to 0.58) and middle SES (OR 0.20, 95% CI 0.08 to 0.48) were less likely to return to a healthy weight when compared to their high-income counterparts. Girls of older age at the start of kindergarten were noted to have statistically significantly decreased likelihood of returning to healthy weight compared with younger girls in the cohort (OR 0.38, 95% CI 0.17 to 0.83).

Early Childhood Longitudinal Study–Kindergarten Cohort (kindergarten to fifth grade). Multivariate regression model: return to healthy weight. (A) Boys and (B) girls.
Return to Healthy Weight: Incidence
The highest incidence of outgrowing obesity occurred among overweight kindergarten children at each age interval (Figure 3; incidence: 21.6%, 95% CI 19.4% to 24.0%). Overweight children, compared with obese children, consistently demonstrated a higher incidence of RHW at each grade interval. Obese children in later grade intervals had the lowest incidence of outgrowing their weight risk (first to third grade: 7.3%, 95% CI 5.7% to 8.8%; third to fifth grade 3.4%, 95% CI 2.1% to 4.7%). No significant differences in incidence of RHW were noted by gender.
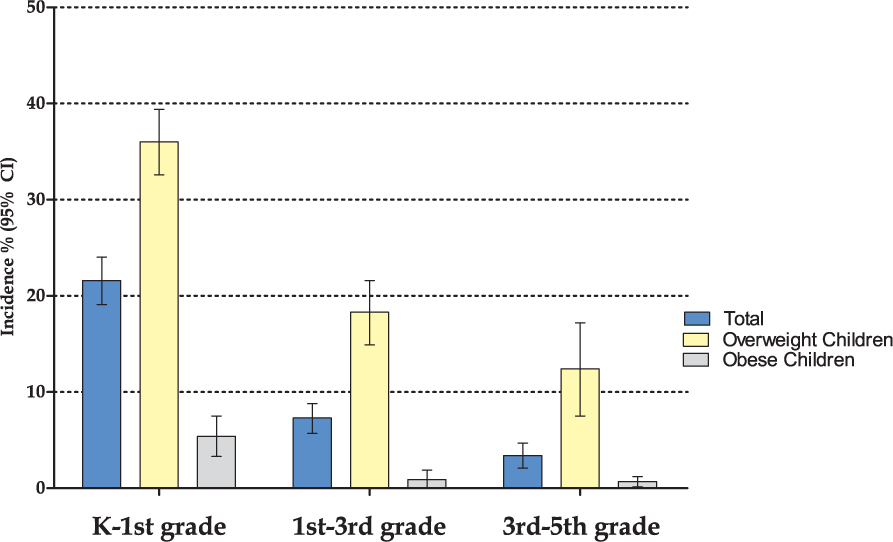
Return to healthy weight (RHW) incidence by grade interval, weight status.
Discussion
In 2001, the Surgeon General published a call to action to treat and prevent obesity among children. 33 Within this sample of children living during a time (1999-2004) where obesity had only recently become a national health priority, nearly 70% of US children were able to maintain a healthy weight during school age. That a majority of children demonstrated this favorable growth pattern during a socioecologic window where factors, including ubiquitous obesogenic built environments, underprioritized school nutritional policies, and only early awareness of the obesity epidemic may have contributed to child weight risks,34,35 supports the hypothesis that HWM may itself reflect resilience to existing socioecologic risk factors. Additionally, with more than 25% of children starting at an overweight or obese status in kindergarten, we found that the fewer than 1 in 5 children (17.1%) initially overweight/obese in kindergarten were able to outgrow their obesity by the fifth grade. Thus, pervasive expectations that children will ultimately outgrow their weight risk are unlikely based on our analysis of a nationally representative sample. With a focus on prepubertal children during school age, this is the first study to our knowledge to explore associations between gender, race/ethnicity, and SES in predicting favorable growth patterns such as HWM and RHW.
With a growing body of work relating obesity disparities to poverty, 36 our findings support SES as a strong predictor of the broader nutritional state of school-age children in that fewer middle- and low-income children were able to maintain a healthy weight or return to healthy weight. In prior studies exploring resilience to obesity in socioeconomically disadvantaged females,20,23,37 factors including youth and higher educational levels were associated with increased resilience against obesity. Our findings support these initial results in that the lowest rates of both HWM and RHW were found in low-income girls after adjusting for age and race-ethnicity. Though interventions targeting low-income children have received increased attention in recent years,38,39 our findings suggest that an assessment of what may confer obesity resilience among low- and middle-income girls during a critical growth window is necessary. In a review by Wang et al, 40 the well-known associations between risks for obesity were identified to be more complex than to be explained simply by individual SES and that a bidirectional causal relationship may be present where nutritional status predicts educational/socioeconomic opportunities and that these opportunities predict nutrition status. A focused assessment on the educational and socioeconomic opportunities experienced by low-income girls, specifically in older age intervals (first to fifth grade) may further explain differences in HWM and RHW prevalence for this population.
We additionally identified that the highest grade-related incidence of RHW occurred among younger overweight school-age children (21.6%) compared with those in later grades (7.3% and 3.4%, respectively). Age was also identified as a significant predictor of RHW among girls in the sample. Our data support recent findings by Cunningham et al 3 indicating that growth trajectories are largely determined by 5 years of age. These data challenge long-standing expectations that older children make healthy weight transitions more commonly than younger children15,17 and in fact validate ongoing discussions prioritizing preschool age as a time of where critical assessment and robust intervention are needed. Moreover, with an understanding that overweight kindergartners (BMI ≥85th to <95th percentile) were most likely to demonstrate obesity resilience with a RHW pattern (36% incidence in kindergarten), new policies, programs, and campaigns focusing on this “lower risk” population may yield the greatest impact in promoting favorable growth transitions.
In accordance with a number of other studies that have outlined disparities among young Hispanic children for obesity,24,25,41 our analysis found that Hispanic children were the least likely racial/ethnic group to outgrow their obesity risk. Whereas Asian girls demonstrated a greater prevalence of HWM, Asian boys demonstrated lower likelihood of outgrowing obesity along with Hispanic males. This constellation of findings supports prior work that has described complex socioecologic interactions between genetics, culture and normative beliefs on child growth influencing obesity onset and validates the expectations that similar factors also influence healthy transitions between weight categories during childhood. Furthermore, the similarities observed between Asian and Hispanic boys in demonstrating reduced resilience suggest that parallel socioecologic interactions, particularly surrounding polarization of male and female growth expectations,19,42 may exist within these cultural groups that limit obesity resilience. Support of future studies using sampling designs where oversampling and assessment of Hispanic and Asian ethnic subgroups are consistently performed, is a means by which to further study these interactions and begin to more effectively address obesity health disparities in children.
Strengths to our study include the use of a longitudinal, nationally representative, and diverse data set of school-age children whereby growth patterns are likely generalizable to many populations. In addition, an assessment of obesity resilience during a socioecologic time when obesity prevention was not yet a central health priority (1990s-2000s) adds value to consider variations in disease when risk is more uniformly elevated. Additional strengths include the ability to use multiple, sequential data collection points to add rigor to our assessment of growth transitions and patterns.
There are important limitations to note within our study sample and analytic approach. Our data restriction of only including participants with intact height and weight measurement may have introduced some selection bias. Specifically, our sample comparison indicated that 1% fewer Hispanic participants were included in our analytic sample, which may have led to underestimates of resilient growth patterns in this racial-ethnic group. We feel that use of the ECLS-K sample weights where oversampling and missingness were included, minimized the likelihood of selection bias. Also, collapsing of multiple racial groups into a larger “Other” race/ethnicity category, limited our ability to explore HWM and RHW among Native American, Pacific Islander, and multiracial children. Next, our definition of HWM and RHW might have limited our ability to identify other favorable growth patterns in this population of children. In addition, we limited our exploration of covariates associated with HWM and RHW to age, gender, SES, and race/ethnicity. Clearly, other factors should be considered as predictors of growth in school-age children however, as these growth patterns had not previously been explored, we felt that an analysis focused on key, immutable factors would inform next steps.
Conclusion
Curbing the pediatric obesity epidemic will depend on exploring all aspects of growth in children, including an understanding of obesity resilient growth patterns. Although many school-age children demonstrate HWM, few children exhibit RHW. Identifying strategies where clinicians can promote HWM and RHW patterns among groups demonstrating disparities in these patterns may be a necessary next step in advancing clinical practice. A comprehensive socioecologic approach where these patterns of interest are studied will add substantial depth to our understanding of risk and resilience to pediatric obesity.
Footnotes
Appendix
Prevalence of All Observed Growth Patterns by Key Demographic Factors, ECLS-K Cohort (Kindergarten to Fifth Grade).
| Variable | Total (n = 9416) | HWM (n = 4659) | OWM (n = 2088) | HWOW (n = 1569) | RHW (n = 432) | OWHW (n = 269) | UWHW (n = 183) | HWUW (n = 114) | UWM (n = 76) | UWOW (n = 14) | Other (n = 12) |
|---|---|---|---|---|---|---|---|---|---|---|---|
| Gender | |||||||||||
| Boys | 50.5 (4735) | 47.1 (44.3-49.9) | 22.3 (19.7-24.8) | 20.3 (17.9-22.6) | 4.2 (3.3-5.2) | 2.4 (1.7-3.2) | 1.7 (1.2-2.2) | 1.3 (0.7-1.9) | 0.5 (0.2-0.7) | 0.1 (0.0-0.1) | 0.2 (0.1-0.3) |
| Girls | 49.5 (4681) | 52.5 (50.0-55.1) | 21.4 (19.3-23.6) | 14.7 (12.8-16.6) | 4.9 (3.6-6.2) | 2.1 (1.5-2.7) | 1.6 (1.0-2.1) | 1.4 (0.8-2.0) | 0.8 (0.3-1.4) | 0.3 (0.0-0.8) | 0.2 (0.0-0.5 |
| Age at cohort entry | |||||||||||
| 4-5 years | 30.2 (2782) | 49.2 (45.7-52.7) | 20.3 (17.6-23.0) | 18.1 (15.5-20.8) | 6.5 (4.7-8.2) | 2.1 (1.4-2.8) | 1.2 (0.7-1.6) | 1.3 (0.7-2.0) | 0.6 (0.1-1.2) | 0.5 (0.0-1.3) | 0.2 (0.1-0.3) |
| 6 years | 68.5 (6457) | 50.1 (48.0-52.3) | 22.7 (20.8-24.5) | 17.0 (15.4-18.6) | 3.7 (3.0-4.5) | 2.4 (1.7-3.0) | 1.8 (1.3-2.3) | 1.3 (0.8-1.9) | 0.6 (0.3-0.9) | 0.1 (0.0-0.1) | 0.2 (0.0-0.5) |
| 7-8 years | 1.3 (177) | 43.9 (31.1-56.7) | 13.8 (7.8-19.7) | 28.6 (12.1-45.2) | 3.3 (1.7-5.0) | 4.4 (1.1-7.7) | 0.9 (0.0-2.7) | 1.3 (0.0-2.7) | 2.5 (0.0-5.5) | 1.3 (0.0-3.3) | 0.0 (NA) |
| Socioeconomic status | |||||||||||
| Low | 18.3 (1474) | 42.2 (38.1-46.3) | 25.9 (22.1-29.6) | 25.0 (20.9-29.1) | 3.0 (1.9-4.0) | 1.3 (0.7-2.0) | 1.4 (0.5-2.3) | 0.9 (0.1-1.6) | 0.1 (0.0-0.3) | 0.1 (0.0-0.2) | 0.1 (0.0-0.2) |
| Middle | 61.4 (5778) | 49.4 (47.1-51.7) | 22.9 (20.8-24.9) | 16.7 (15.0-18.4) | 4.2 (3.3-5.1) | 2.5 (1.8-3.2) | 1.5 (1.0-2.1) | 1.6 (1.0-2.2) | 0.6 (0.2-1.0) | 0.3 (0.0-0.7) | 0.3 (0.0-0.5) |
| High | 20.4 (2179) | 57.7 (53.2-62.2) | 15.2 (12.4-18.0) | 13.1 (10.7-15.6) | 7.1 (4.6-9.6) | 2.5 (1.5-3.5) | 2.1 (1.4-2.7) | 0.9 (0.3-1.5) | 1.2 (0.5-1.9) | 0.0 (NA) | 0.1 (0.1-0.2) |
| Race-ethnicity a | |||||||||||
| Non-Hispanic white | 60.4 (5617) | 52.5 (49.8-55.1) | 18.7 (16.6-20.9) | 17.2 (15.1-19.2) | 4.8 (3.7-6.0) | 2.5 (1.8-3.2) | 1.8 (1.3-2.4) | 1.4 (0.8-2.0) | 0.7 (0.3-1.2) | 0.0 (0.0-0.1) | 0.2 (0.0-0.5) |
| Non-Hispanic black | 13.3 (1002) | 49.5 (44.0-55.0) | 23.1 (18.2-28.0) | 18.2 (14.1-22.2) | 5.2 (2.6-7.9) | 2.0 (0.9-3.0) | 0.6 (0.0-1.2) | 0.8 (0.0-1.8) | 0.4 (0.0-0.8) | 0.2 (0.0-0.5) | 0.0 (NA) |
| Hispanic | 19.0 (1647) | 42.4 (38.6-46.1) | 30.3 (26.9-33.7) | 18.4 (15.3-21.4) | 3.3 (2.2-4.5) | 1.7 (1.0-2.5) | 1.2 (0.5-1.8) | 1.4 (0.6-2.2) | 0.3 (0.1-0.5) | 0.7 (0.0-1.9) | 0.3 (0.0-0.6) |
| Asian | 2.9 (617) | 52.9 (44.3-61.4) | 21.9 (15.2-28.7) | 11.4 (6.6-16.1) | 3.7 (0-7.3) | 1.5 (0-3.3) | 4.0 (1.1-7.0) | 1.9 (0.5-3.2) | 1.9 (0.5-3.3) | 0.8 (0.0-1.9) | 0.0 (NA) |
| Other | 4.4 (523) | 43.6 (36.4-50.8) | 24.4 (18.4-30.4) | 20.3 (14.0-26.5) | 4.2 (1.9-6.6) | 3.1 (0-6.3) | 2.5 (0.0-5.4) | 1.0 (0.0-1.9) | 0.6 (0.0-1.3) | 0.1 (0.0-0.3) | 0.1 (0.0-0.4) |
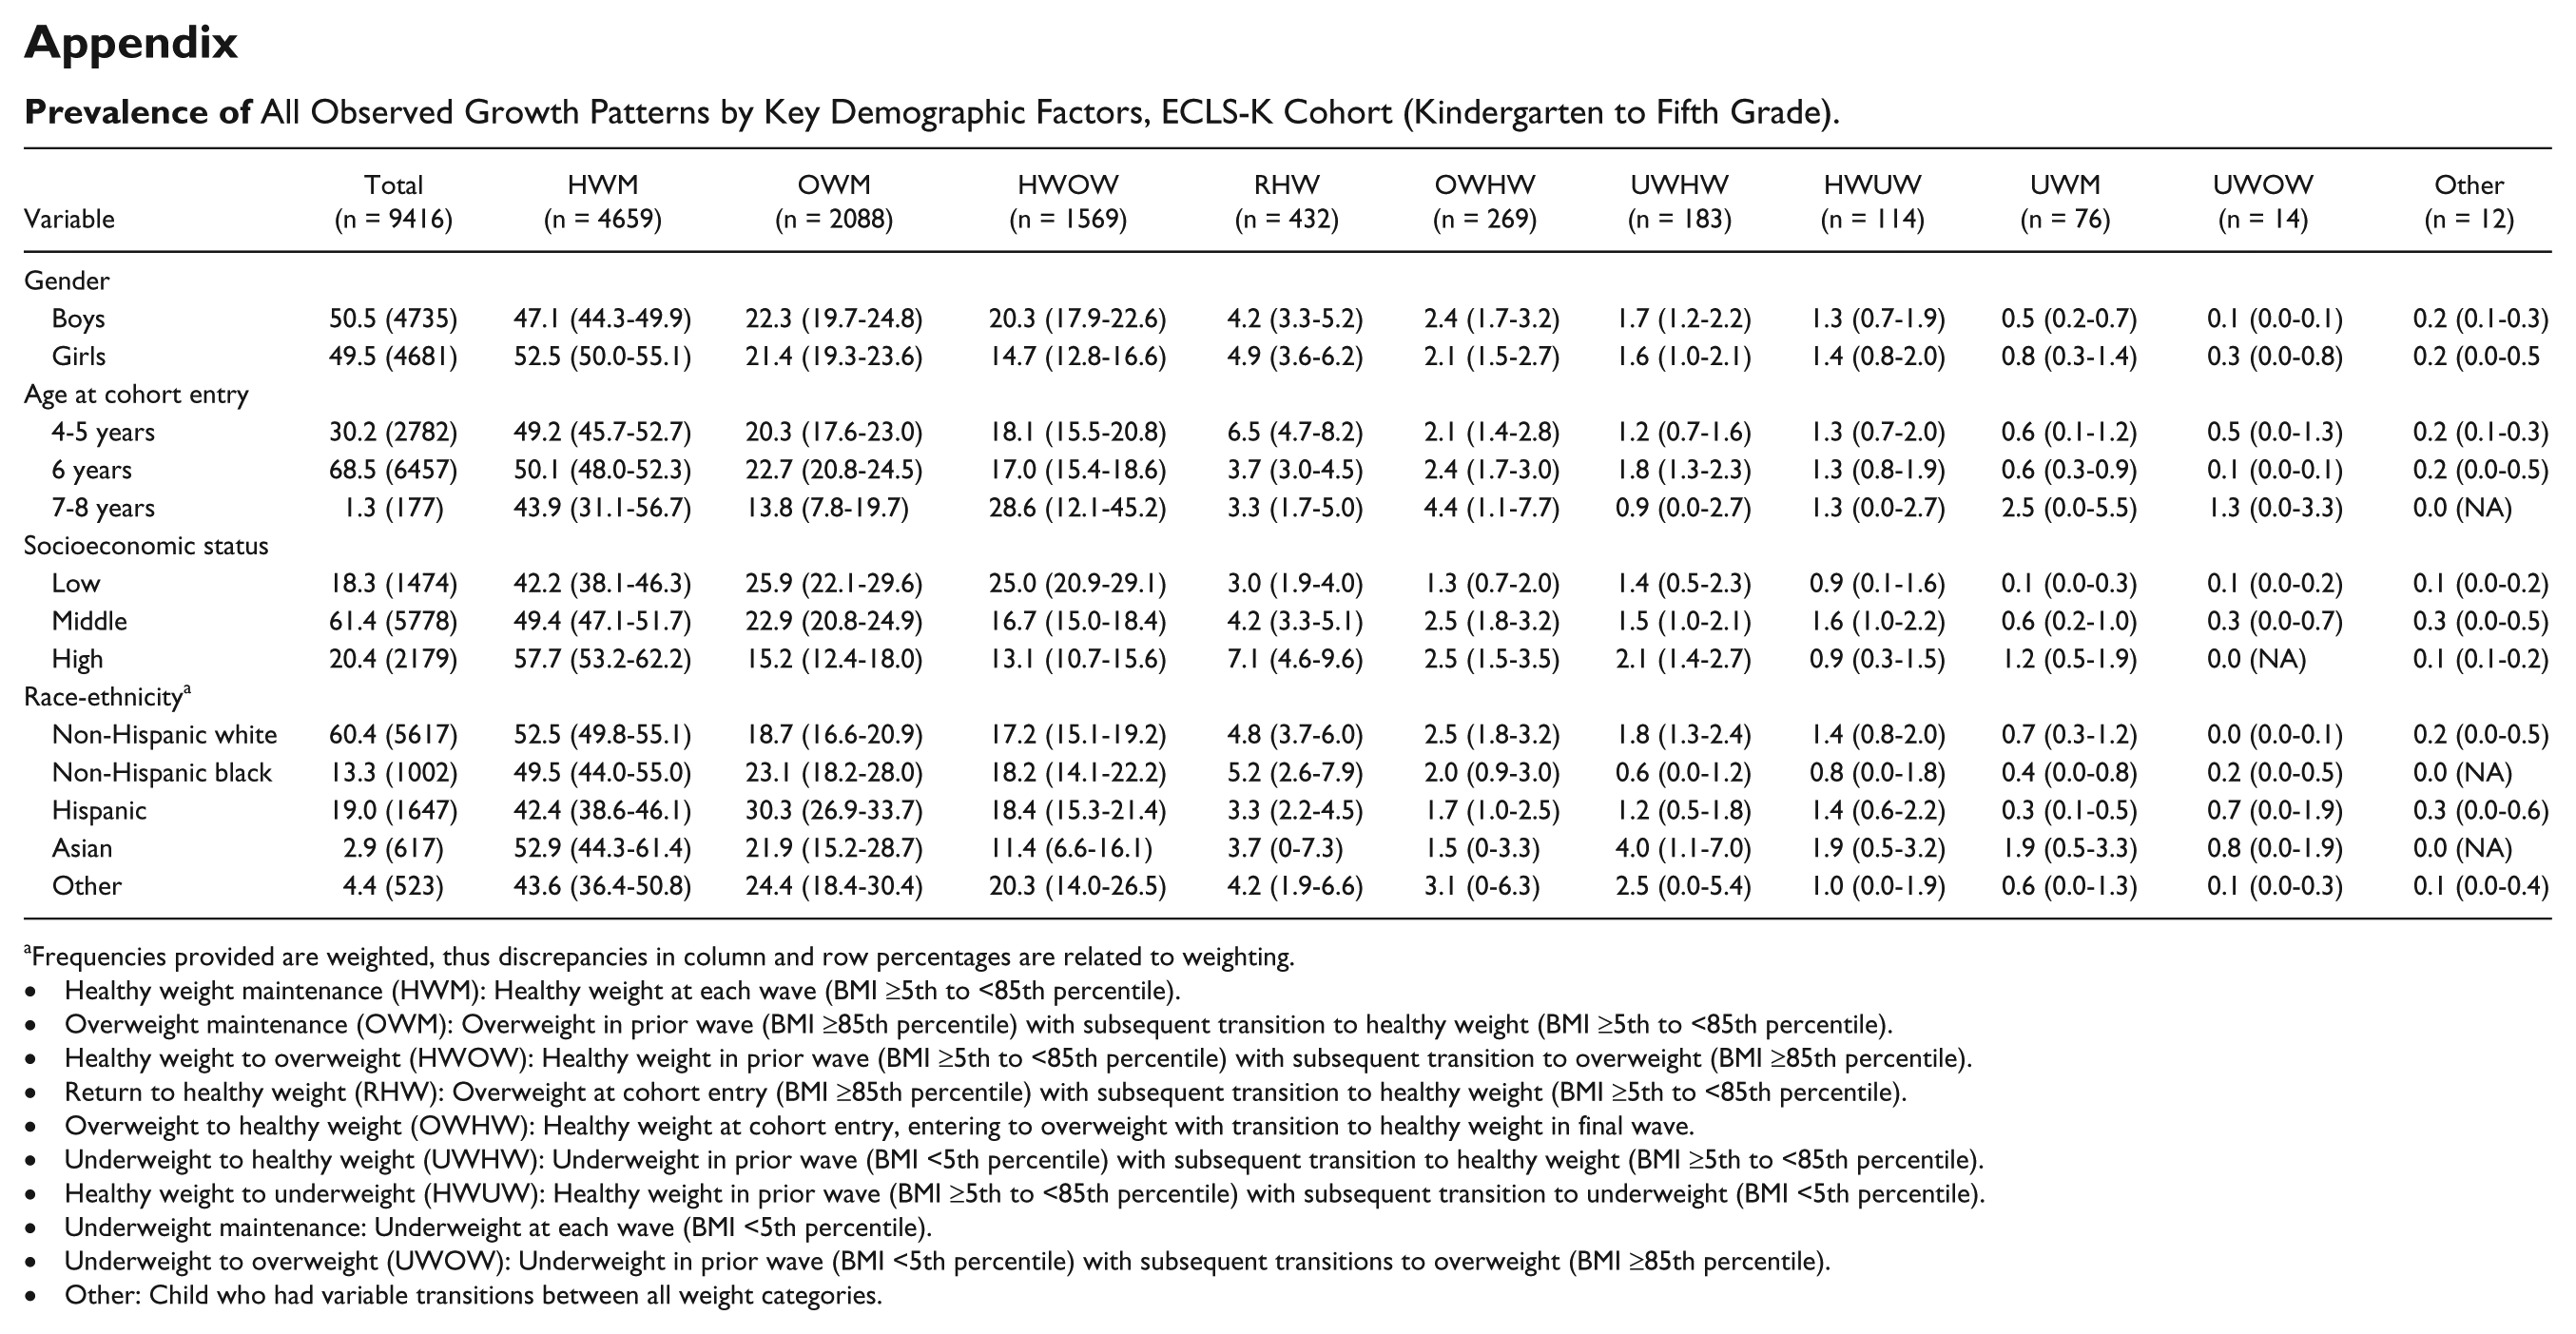
Frequencies provided are weighted, thus discrepancies in column and row percentages are related to weighting.
• Healthy weight maintenance (HWM): Healthy weight at each wave (BMI ≥5th to <85th percentile).
• Overweight maintenance (OWM): Overweight in prior wave (BMI ≥85th percentile) with subsequent transition to healthy weight (BMI ≥5th to <85th percentile).
• Healthy weight to overweight (HWOW): Healthy weight in prior wave (BMI ≥5th to <85th percentile) with subsequent transition to overweight (BMI ≥85th percentile).
• Return to healthy weight (RHW): Overweight at cohort entry (BMI ≥85th percentile) with subsequent transition to healthy weight (BMI ≥5th to <85th percentile).
• Overweight to healthy weight (OWHW): Healthy weight at cohort entry, entering to overweight with transition to healthy weight in final wave.
• Underweight to healthy weight (UWHW): Underweight in prior wave (BMI <5th percentile) with subsequent transition to healthy weight (BMI ≥5th to <85th percentile).
• Healthy weight to underweight (HWUW): Healthy weight in prior wave (BMI ≥5th to <85th percentile) with subsequent transition to underweight (BMI <5th percentile).
• Underweight maintenance: Underweight at each wave (BMI <5th percentile).
• Underweight to overweight (UWOW): Underweight in prior wave (BMI <5th percentile) with subsequent transitions to overweight (BMI ≥85th percentile).
• Other: Child who had variable transitions between all weight categories.
Author Contributions
Dr Raquel G. Hernandez conceptualized and designed the study, carried out the study analyses, drafted and reviewed the initial manuscript, and approved the final manuscript as submitted. Dr Janelle Garcia acquired and analyzed the data. She additionally contributed to the initial manuscript and approved of the final manuscript as submitted. Dr Ernest K. Amankwah acquired, analyzed, and interpreted the data, critically reviewed the manuscript and approved the final manuscript as submitted. Dr Arik V. Marcell contributed to the study design, critically reviewed the manuscript, and approved the final manuscript as submitted. Dr Tina L. Cheng critically reviewed the manuscript and approved the final manuscript as submitted.
Declaration of Conflicting Interests
The author(s) declared no potential conflicts of interest with respect to the research, authorship, and/or publication of this article.
Funding
The author(s) disclosed receipt of the following financial support for the research, authorship, and/or publication of this article: All phases of this study were supported by the All Children’s Johns Hopkins Medicine Foundation. Grant number: 506427-6800.