
Abstract
With discouragingly low vaccination rates for human papillomavirus (HPV), we sought to improve the HPV vaccine completion rate for adolescents by increasing the consistency and quality of provider recommendations. Baseline data was extracted for vaccine completion rates among patients aged 13 to 17 years. Quality improvement measures led to interventions targeting factors associated with vaccine noncompletion, in particular, weaknesses in provider recommendations and patient characteristics most strongly correlated with missed vaccination opportunities. Vaccine completion rates increased overall from 50.9% to 61.7% (P < .05), an increase seen in both males (42.6% to 57.3%, P < .001) and females (60.0% to 66.5%, P = .04). One-dose rates improved to 88.4% for males (P = .02) and 91.5% for females (P = .43). Vaccination also occurred more consistently, increasing from 77.5% of visits (95% CI 71.2-83.0) before study onset to 90.9% of visits (95% CI 85.4%-94.8%) afterward (P < .01). HPV vaccination rates can increase through focused provider-level prompts and by offering the vaccine consistently.
Keywords
The human papillomavirus (HPV) is the most common sexually transmitted infection in the United States, with more than 40% of women aged 20 to 24 years infected at any given time.1,2 It causes considerable morbidity and mortality with more than 11 000 women diagnosed with cervical cancer annually in the United States; thousands more have precancerous disease requiring costly, invasive interventions. Given that HPV also affects men, including >12 000 annual cases of oropharyngeal cancer, there is strong evidence to support vaccinating both genders. In total, effective delivery of the HPV vaccine can eliminate up to 28 500 cancers each year. 3 Despite this disease prevalence and corresponding morbidity, vaccination rates remain low. 4 According to the 2016 Morbidity and Mortality Weekly Report National Immunization survey, just 41.9% of adolescent females and 28.1% of males have completed the recommended HPV series. 5
While there are complex barriers to HPV vaccine delivery, an initial focus on provider behavior, including how and when to recommend the vaccine, is feasible and evidence-based. Data show that a strong provider recommendation to get vaccinated correlates with higher vaccine initiation rates.6-9 Furthermore, a large survey of physicians highlighted a lack of quality recommendations for HPV vaccination given that their recommendations are inconsistent, behind schedule, or without urgency. 10 More than 25% of respondents admitted that they do not strongly endorse the vaccine. This aligns with what parents and adolescents say they hear at primary care visits: surveys reveal that between 35.6% and 58.4% of families do not recall receiving a recommendation from their provider. 11 For parents of boys, the top reason reported for vaccine reluctance was that the vaccine was “not recommended” by their provider. For both males and females, those that did recall receiving a recommendation from their provider were more likely to have received the first dose.11,12
This evidence provided the basis for a quality improvement (QI) initiative at one of the Cincinnati Children’s Hospital Medical Center (CCHMC) primary care centers that sought to bolster HPV vaccination completion in adolescents. In 2015, the Hopple Street Neighborhood Health Center (HPC) began an investigation into systematic weaknesses and missed opportunities in the delivery of the HPV vaccine. This was followed by implementation of provider-based changes designed to improve the frequency and quality of providers’ recommendations. Specifically, the aim of this study was to increase the successful completion rate of the 3-dose HPV series recommended at the time across 13- to 17-year-olds receiving care at HPC from a baseline of 50.9% to ≥80% in line with the Healthy People 2020 goals. 13 As a key step toward achieving this aim, we also sought to administer the HPV vaccine more regularly at adolescent clinic visits.
Methods
Context
CCHMC is a large, urban, pediatric academic medical center. This QI project was conducted at the HPC, a hospital-affiliated, community-based outpatient primary care center that is the medical home for 6700 predominantly low-income patients (~13 000 visits annually). HPC has 2.4 full-time equivalent physicians and 15 support staff that include medical assistants and registered nurses. It is the continuity clinic site for 32 CCHMC pediatric residents. Each year, there are ~1275 patients older than 9 years who are eligible to receive the HPV vaccine.
Planning and Executing the Interventions
A multidisciplinary improvement team was assembled to guide QI efforts. A CCHMC second-year pediatric resident led the team (LK). The team also included HPC attending physicians, residents, nurses, and medical assistants. To help plan tests of change and facilitate identification of key drivers, we collected three sources of baseline data to characterize HPV vaccine receipt and absence of vaccination for the target patient population. The first source was an existing registry of current patients’ vaccination status. The second dataset included all patient visits over a 1-month period in which the patient was identified as being due for the HPV vaccine at that visit. The final dataset assessed provider knowledge of the vaccine.
The first dataset extracted information from the electronic health record (EHR) through an existing HPC patient registry. Documentation of HPV vaccine receipt in the EHR was compared with documentation in IMPACT, a state vaccine registry administered by the Ohio Department of Health. This was done to account for any patients who may have received a vaccine in a location outside of CCHMC (eg, school, pharmacy). Thus, we were able to define vaccine completion for our patient panel using both sources.
We assembled additional datasets to facilitate process measurements and guide our tests of change. First, data were extracted from the EHR to investigate our key process measure—the percentage of adolescents who received (or were offered) the HPV vaccine during an eligible visit opportunity. For this, we were particularly interested in missed opportunities for vaccination, focusing on those adolescents who were eligible for, but did not receive, HPV vaccination at their visits. During the preintervention period, we reviewed each adolescent clinic visit in which a patient was eligible for the vaccine. Once we identified those visits that did not result in delivery of the vaccine, we looked for documentation of patient refusal. If there was no evidence of refusal, these visits were defined as “visit misses.” This data extraction allowed us to review visit-level information and illustrate how consistently the HPV vaccine was provided to eligible patients, which yielded an estimated “miss rate.” We tracked both an overall receipt rate and a “recommended,” or “offered,” rate. To determine whether a vaccine was recommended or not, we used an automated phrase present within the visit’s documentation from the provider. Refusals were not counted as part of this calculation as we did not consider them to be provider or operational failures as the vaccine was appropriately offered. However, patients refusing vaccination were included in the population-level data for analysis of overall completion rates.
Once these datasets were calculated for each visit (primary process measure) and for the overall population (primary outcome measure), we looked more deeply at other variables present in patient charts to guide tests of change. We looked specifically at patient age, gender, and visit type. Age was treated as a continuous variable. Visit type categories included ill and well child checks. Ill visits were subdivided into visits for attention deficit hyperactivity disorder (ADHD) and “other.” The subcategory of ADHD visits was used because anecdotal evidence suggested providers often forgot to offer any vaccines at ADHD follow-ups and ADHD adolescent patients are less likely to come for well-child checks. Bivariate relationships between these variables and HPV completion were assessed using the chi-square or Fisher’s exact test. Differences in age were tested by an independent-samples t test.
To supplement our review of the EHR, we obtained data regarding provider knowledge about the vaccine through an online survey. The survey, designed de novo, asked respondents about the prevalence of HPV disease in the United States as well as recommended HPV dosing guidelines. This survey was required for all residents and attending physicians at HPC.
We planned the execution of interventions along 2 key drivers: (1) quality of provider recommendation regarding HPV vaccine (to patients and families) and (2) frequency of those recommendations (Figure 1).
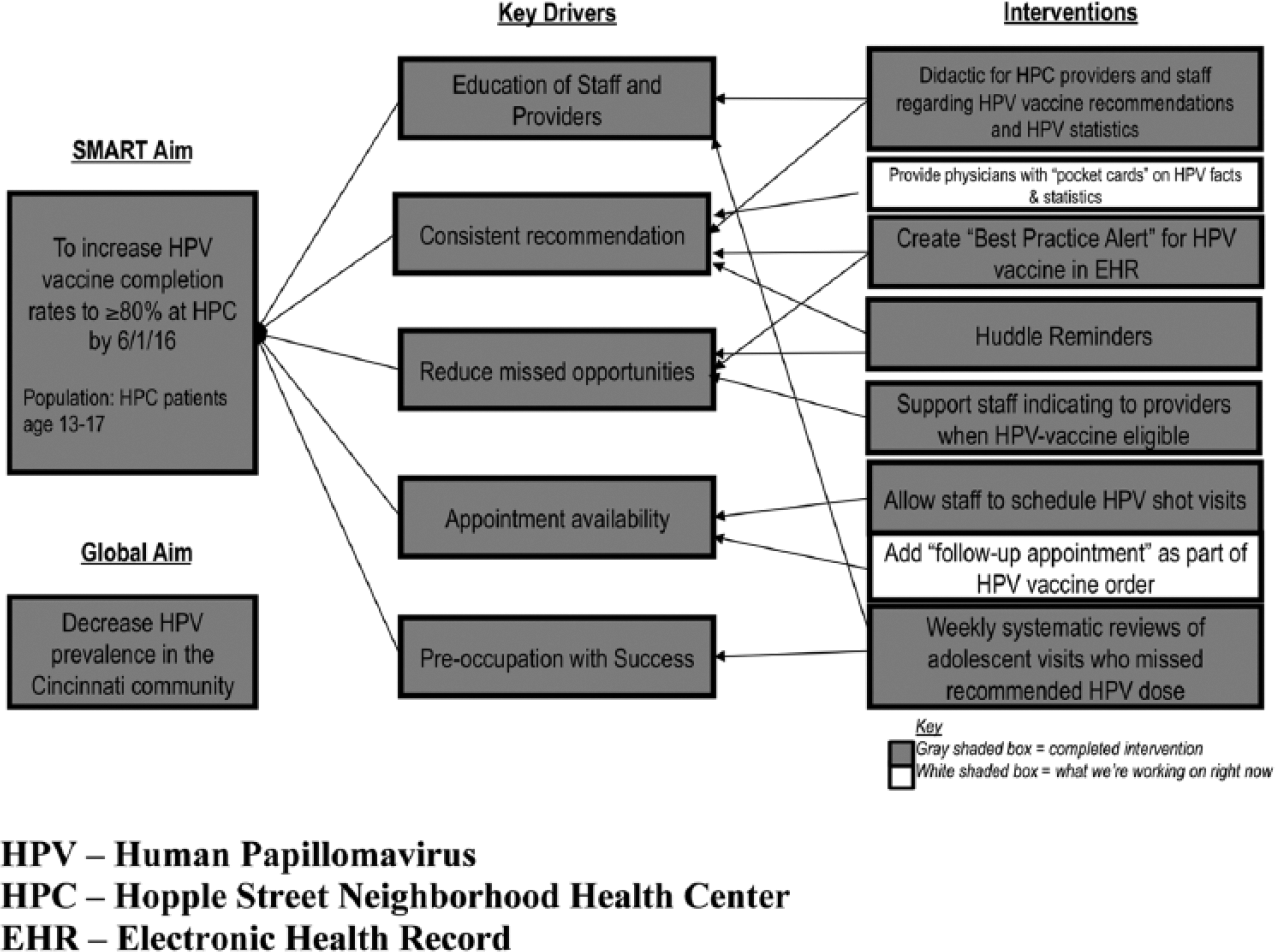
Key driver diagram used in the planning and execution of interventions to increase successful completion of the 3-vaccine HPV series among adolescents. HPV, human papillomavirus; HPC, Hopple Street Neighborhood Health Center; EHR, electronic health record.
The first intervention was an educational seminar for physicians, residents, nurses, and medical assistants. The seminar included information on the prevalence of HPV in the United States, the morbidity and mortality resulting from the virus, and clinic-specific obstacles to vaccination discovered through baseline data collection. The seminar also reviewed practical aspects of HPV vaccine delivery, including dosing intervals and preferred messaging around vaccine recommendation. 14 We encouraged providers and staff to discuss the HPV vaccine objectively, in the same manner as other vaccines are discussed, following guidelines proposed by the Centers for Disease Control and Prevention. Providers were also instructed to review the full HPV vaccine series with families and enforce the need to return for future doses. We provided additional guidance on potential ways to respond to parental vaccine refusal, including on where to direct parents for further information. The presentation was required for all residents on their day of continuity clinic. It lasted 15 minutes and was repeated at 6-month intervals. Subsequent interventions that offered targeted feedback to providers (see below) included emails that referenced highlights of the presentation. Slides from the presentation, most notably the recommended dosing intervals for the HPV vaccine, were posted in work areas around the clinic. Presentation attendance was also required for nurses, medical assistants, and attending physicians during a monthly team meeting and repeated annually.
The second set of interventions focused on increasing the frequency of provider-to-patient recommendations. Knowing the importance of data transparency to QI success, the improvement team provided weekly, individualized audits to providers who missed an opportunity to vaccinate a patient against HPV. To ensure accurate recording of all patient visits, the primary investigator conducted manual review of eligible patient visits weekly. This consisted of reviewing each adolescent visit for the week, determining which visits were due for an HPV vaccine, and then noting those that received the vaccine and those that were missed, as well as the provider for that visit. Demographic data for each patient (see above under “Methods”) were also extracted. HPC averaged 22 adolescent visits per week in which an HPV vaccine was due. Manual review took approximately 30 to 60 minutes per week. Monthly audit results were shared clinic-wide, encouraging friendly competition between clinic staff. This also allowed for the monitoring of monthly trends in vaccination delivery rates. Feedback was provided to staff via email, run charts posted in clinic, and at staff meetings. Feedback techniques evolved over time in reaction to process measure data (see below under “Results”).
Measures Used to Study the Interventions
Our primary objective was to increase the percentage of adolescents, aged 13 to 17 years, who completed the recommended 3-dose HPV series. To measure this outcome, data were extracted from the EHR and compared with IMPACT records. The numerator was patients who received all 3 doses of the HPV vaccine. The denominator was the total number of patients aged 13 to 17 years considered active patients of the clinic per the HPC registry. To be considered “active” in the registry, a patient must have been seen in clinic in the preceding 2 years. The first extraction for completion rates occurred in January 2015 before any QI activities had commenced. The second occurred in March 2016 after 9 months of interventions. We compared the postintervention rate with the rate before the 9-month study period. We also looked at the change in those who received ≥1 vaccine dose. Data were analyzed for the entire clinic population and also stratified by gender.
As our key process measure, we assessed visit-level HPV vaccination administration over time, tracking the percentage of adolescents aged ≥11 years, who received the HPV vaccine, if eligible and due, at a clinic visit opportunity. The numerator was patients receiving vaccination. The denominator was the number of adolescents seen during the tracking period who were eligible and due for the HPV vaccine. These visit-level data, in contrast to population-level data, were collected on all patients 11 years or older seen in clinic with the goal that patients complete the series by age 13 years.
Analyses
Differences in rates of vaccine completion before and after intervention were assessed using the Fisher exact test. Visit-level vaccine completion was also tracked over time using statistical process control charts. This provided the QI team the ability to observe and respond to changes over time, using predefined statistical rules to distinguish between common and special cause variation. Common cause variation is the typical variation that occurs inherent to a process. In contrast, special-cause variation results from causes that are from specific circumstance or from a change in the underlying system. The goal in using control charts was to identify if special-cause variation could be attributed to our interventions, as well as to determine if our actions led to a reduction in the inherent common-cause variation. Our main chart followed the percentage of patients 11 years and older who received the HPV vaccination at their clinic visit (ie, their “opportunity”). Rates were calculated at 25-visit intervals in order to provide a consistent denominator and account for periods with inconsistent adolescent visits. Baseline data for the control chart were collected starting in March 2015. Interventions began in June 2015, and data collection continued until March 2016.
To look deeper into the data, the percentage of patients appropriately receiving HPV vaccination at their visits were calculated at baseline, during the education and reminder interventions for all patients, and then separately for those attending ill visits. Confidence intervals (CIs) for the percentage vaccinated were calculated using the Clopper-Pearson exact method. Fisher’s exact tests were used to test for differences in the proportion of patients receiving the HPV vaccine at baseline and during the education and reminder interventions.
Ethical Considerations
This study was reviewed by the CCHMC Institutional Review Board and approved (study #2015-0467).
Results
During the study period, the HPC patient population was 74% African American, 18% white, 3% Hispanic, 1% Asian, and 4% other. The payer mix was 80% Medicaid, 10% private insurance, and 10% self-pay. During the month of visit-level data collection prior to interventions, 105 patients were eligible to receive the HPV vaccine and were seen in clinic. Of the 105 patients in the pre-intervention period, 82 appropriately received the vaccine and 23 did not. When comparing those groups, children were significantly less likely to receive the vaccine during ill and ADHD visits (both P < .001) (Table 1). There was no significant difference in gender (P = .34) or age (P = .44). Mean age for vaccinated patients was 13.1 years (SD = 1.8 years) and that for unvaccinated patients was 13.4 years (SD = 2.0 years).
Preintervention Comparison of Characteristics for Adolescents Appropriately Vaccinated Against HPV and Those With a Missed Opportunity to Vaccinate.
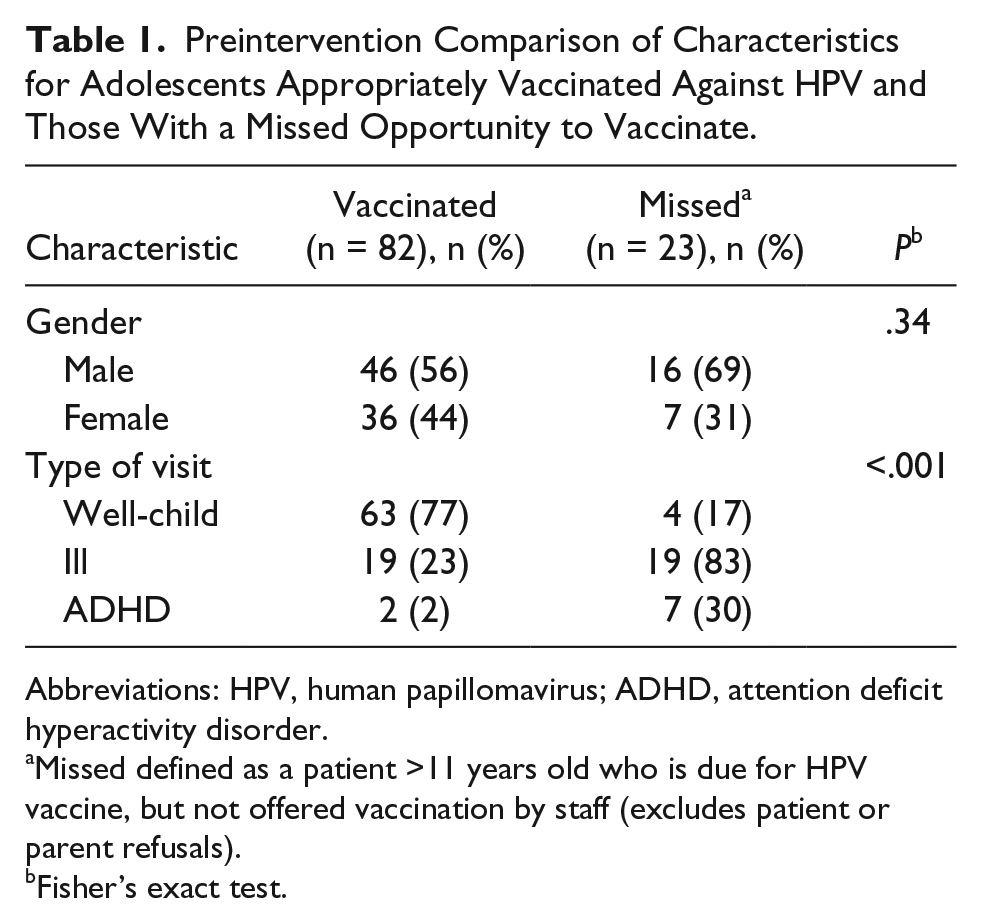
Abbreviations: HPV, human papillomavirus; ADHD, attention deficit hyperactivity disorder.
Missed defined as a patient >11 years old who is due for HPV vaccine, but not offered vaccination by staff (excludes patient or parent refusals).
Fisher’s exact test.
Baseline survey results of providers were also used to design interventions. Only 14% of providers (including 40% of attending physicians) were knowledgeable of accurate minimum dosing intervals for the HPV vaccine. In contrast, 100% of providers were aware of the recommend ages for vaccination. Provider awareness of national vaccination rates was accurate. Given these findings, vaccine intervals were stressed during educational interventions.
Figure 2 illustrates the main process measure tracked over time. After interventions, the mean increased on the chart in accordance with control chart rules. Table 2 provides another way of viewing this increase over time. At baseline, adolescents were vaccinated at 77.5% (95% CI 71.2%-83.0%) of eligible visits. This increased to 89.4% (95% CI 83.1%-93.9%) of eligible visits after educational and reminder interventions, a significant increase (P < .01). We deduce that the educational intervention drove the initial increase while reminder interventions sustained it. Initially, reminders took the form of chart audits and feedback directed to providers. Ultimately, these efforts were not sustainable as they were retrospective and manual rather than proactive and automated, and were impractical in certain instances due to time constraints.
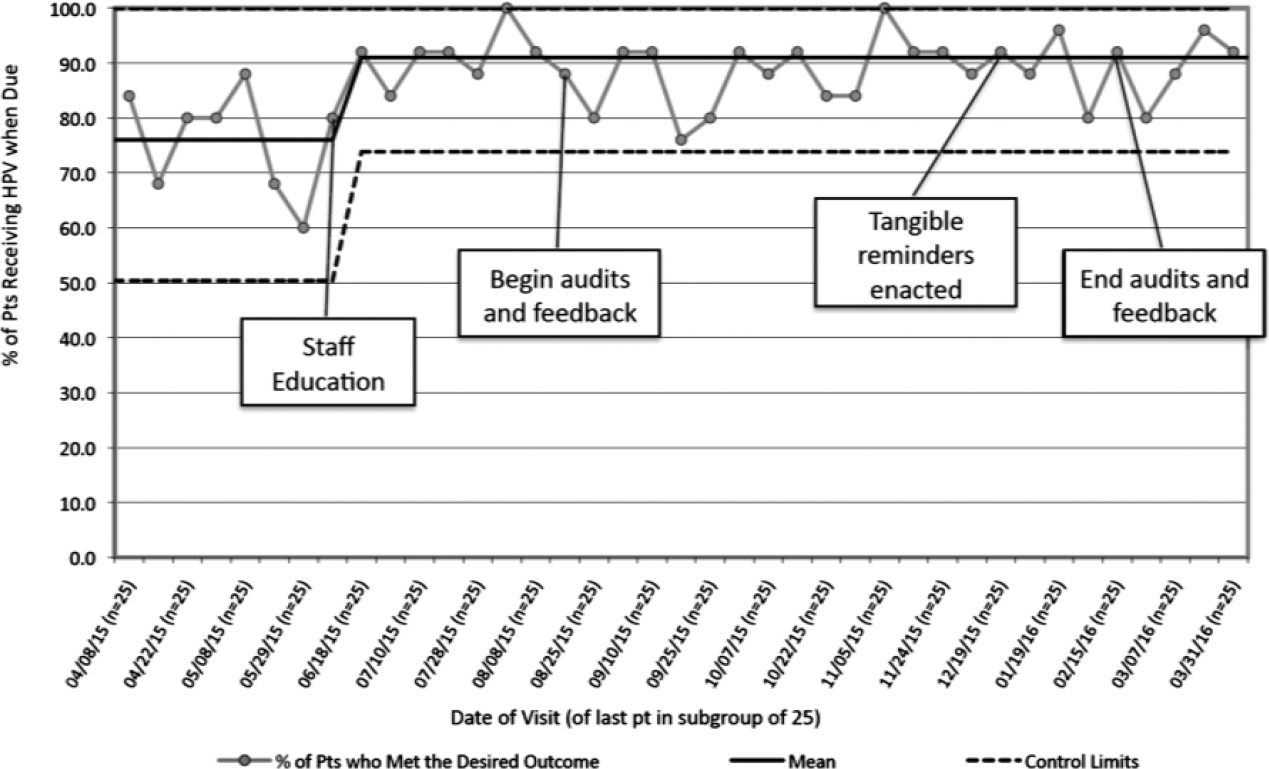
Percentage of adolescents who received the human papillomavirus (HPV) vaccine during an eligible visit opportunity (by intervals of 25 visits), March 30, 2015 to March 31, 2016 (n = 975 visits).
HPV Vaccinations Given According to Visit Type and Enacted Intervention as Compared With Baseline Data.
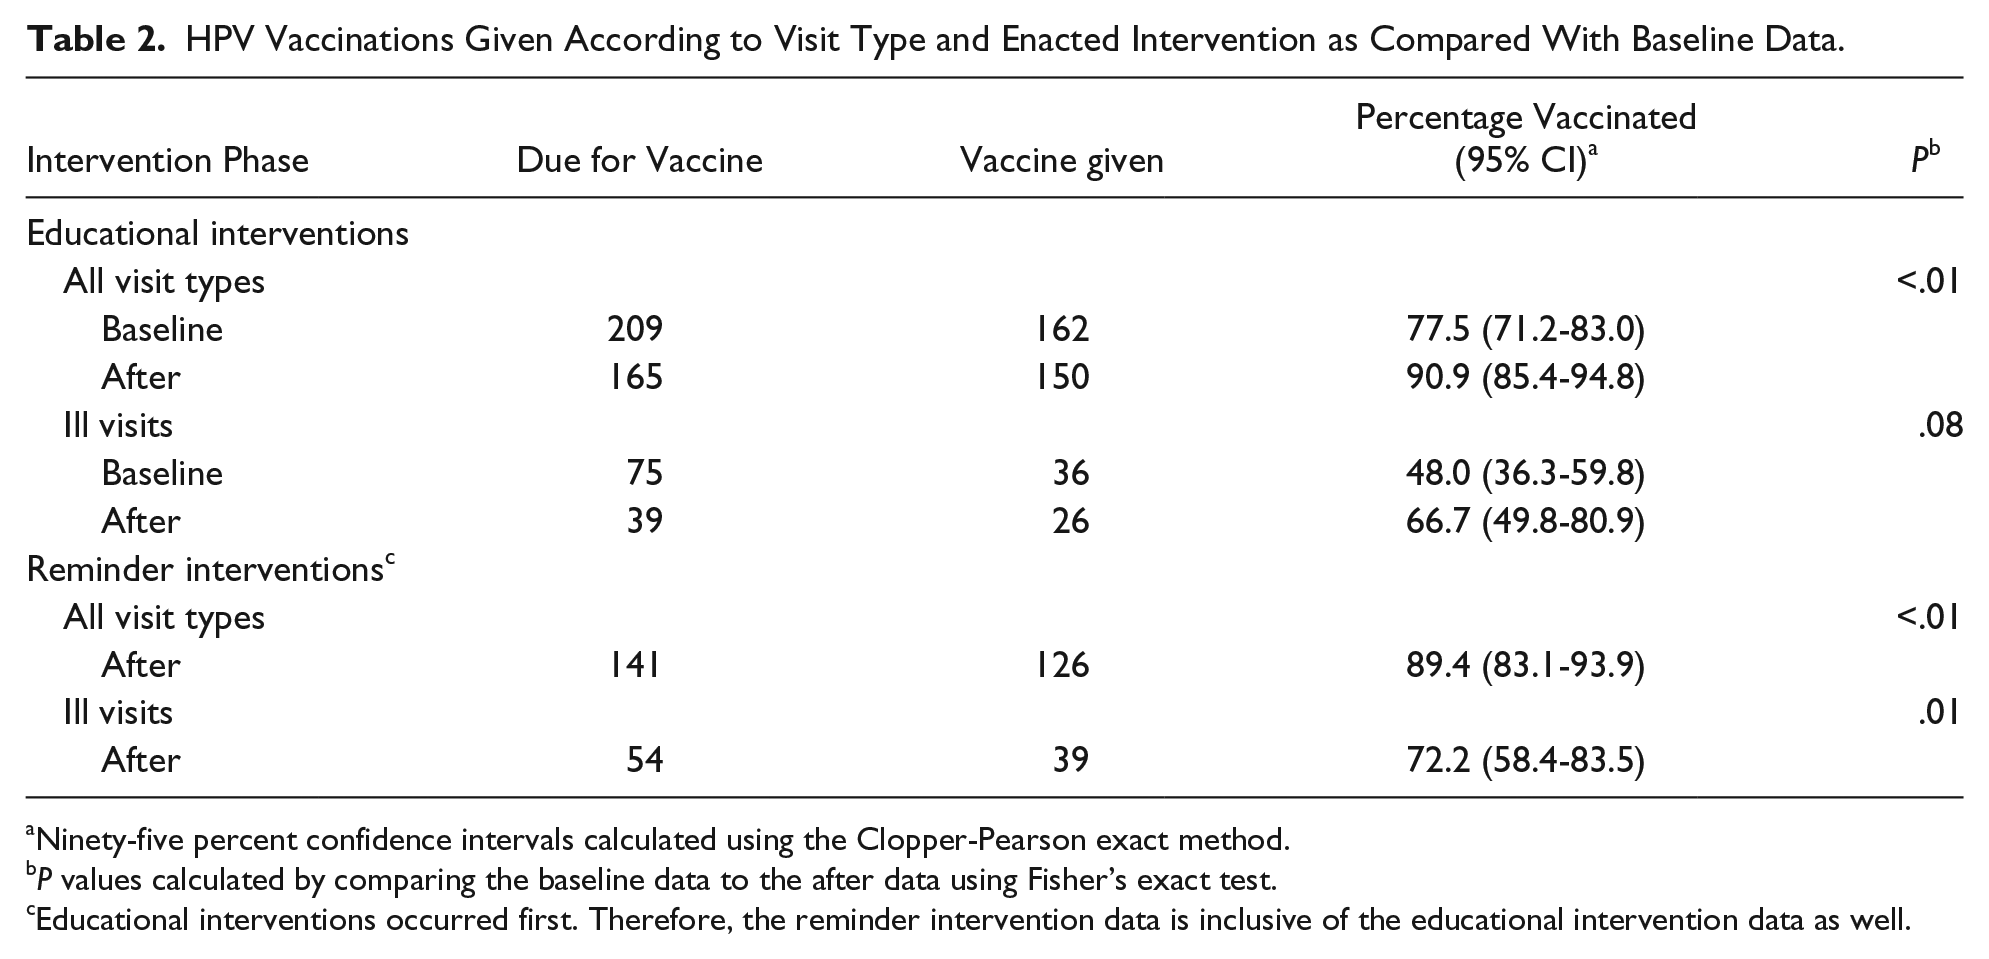
Ninety-five percent confidence intervals calculated using the Clopper-Pearson exact method.
P values calculated by comparing the baseline data to the after data using Fisher’s exact test.
Educational interventions occurred first. Therefore, the reminder intervention data is inclusive of the educational intervention data as well.
Tangible reminders to vaccinate patients were posted in high traffic clinic areas to replace the manual audit system. Given that failing to vaccinate during ADHD visits was detected as a clinic-specific weakness in Table 1, reminders for HPV vaccine were physically attached to patient forms required at ADHD visits. EHR changes were also instituted to provide automated best-practice alerts to remind providers to vaccinate at any visit opportunity (Figure 3). This created a more highly reliable recommendation system to prompt providers to offer HPV vaccination.
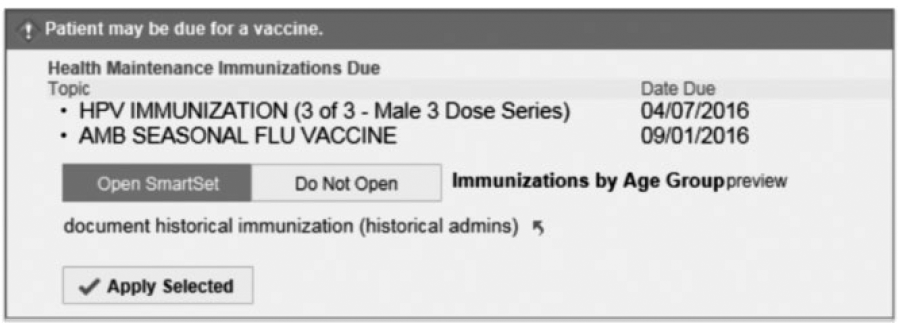
Screenshot of best practice alert from the electronic health record.
We also noted differences in vaccination rates between well and ill visits, so those were analyzed separately. For ill visits, with educational interventions alone, there was the suggestion of an increase in completion rates from 48.0% to 66.7% (P = .08). After adding on reminder interventions, the ill visit vaccination rate rose to 72.2% (95% CI 58.4-83.5) (P = .01).
After completion of our interventions, there was a significant increase in 3-dose completion rates for both males (42.6% to 57.3%, P < .001) and females (60.0% to 66.5%, P = .04). The total population increase was 50.9% to 61.7% (P < .05). Figure 4 compares these rate increases with the national data provided by the NIS-Teen survey. 5 The ≥1 dose rates also improved for males (83.4% to 88.4%, P = .02) and were stable for females (89.8% to 91.5%, P = .43).
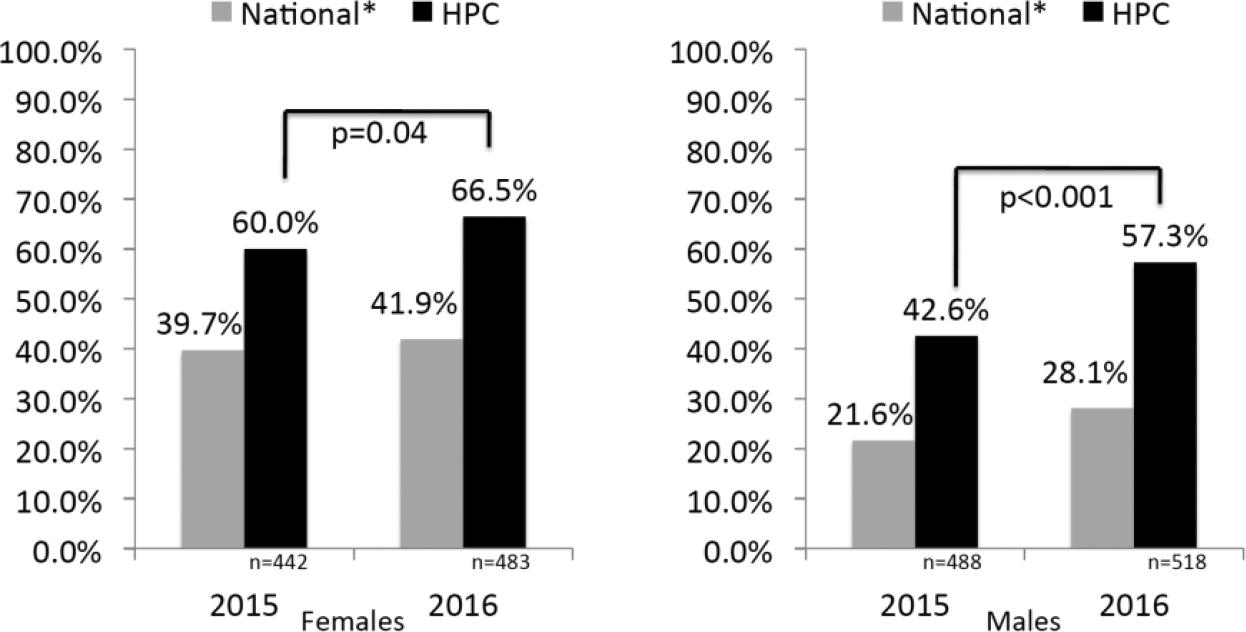
Human papillomavirus (HPV) vaccine completion rates for patients 13 to 17 years old before and after intervention with national* HPV vaccine completion rates during similar time periods.
Discussion
Using QI methods, we significantly increased HPV vaccine rates for adolescents in our clinic. We anticipate that improved vaccination will lead to reduced HPV infections in both our vaccinated and unvaccinated patients. 15 While many factors contribute to poor delivery of the HPV vaccine, we chose to single out one feasible, evidence-based factor: provider recommendation. Using clinic-specific analyses to guide our interventions, we focused on improving the quality and frequency of provider vaccine recommendations, and determined whether that resulted in increased vaccination rates for our entire patient population.
We developed interventions that focused on education and reminders in order to enhance awareness, with particular attention to our discovered weaknesses—ill visits, ADHD follow-up visits, and provider knowledge about dosing intervals. Although isolated educational interventions have low reliability and often lack sustainability, the repetitious educational curriculum in academic clinics helps address this. Multiple studies have stressed the significance of this type of support for a strong provider recommendation for HPV vaccination. By educating providers with accurate information about the vaccine, we attempted to enhance the “strength” of their recommendation, but standardization of this remains difficult to measure. Indeed, for the long-term success of this initiative, however, we see the embedding of EHR-based electronic reminders as a sustainable method for prompting providers to consistently recommend this vaccine. Indeed, a recent project showed the value of similar low-cost system-wide changes in improving HPV vaccine delivery. 16
Patient refusals of the vaccine were excluded in visit-level data since provider education and prompts to consistently and effectively recommend the vaccine were the primary interventions being measured. However, all patients, even those who refused HPV vaccination, were included in our population-level data to accurately reflect the entire population. Therefore, this study demonstrates that on its own, an accurate and consistent recommendation for immunization from the provider can increase vaccination rates across an entire population. Efforts to address parent refusals will augment this study’s impact, though those efforts were outside the scope of this work.
While we do see rates of HPV vaccination increasing in the United States, the effect of our interventions was larger than the national trends. From 2014 to 2015, national rates for HPV vaccine completion rose from 21.6% to 28.1% for males and from 39.7% to 41.9% for females.4,12 We saw larger increases within our sample. Thus, we expect that although rates of HPV vaccination are rising across the country, our interventions accelerated this trend even if we did not meet our preset goal of 80%. Considering recent recommendations from the Centers for Disease Control and Prevention to provide two doses of the HPV vaccine to adolescents if started prior to age 15 years, the impact of this methodology could increase effective delivery of the vaccine even further. 17
Our study was not without limitations. First, without a control group, we cannot rule out whether changes in the rate of HPV vaccination over time affected changes seen at HPC. Second, our interventions were conducted for a total of 9 months. Measurable change required a multiphase approach and testing interventions in plan-do-study act cycles. Data on the longer-term effect of our efforts are not yet available. Third, this QI project was conducted in a single mid-size academic-based pediatric health center, so the ability to generalize may be limited.
Conclusion
Quality improvement methods to improve HPV vaccine delivery can be effectively implemented in a busy primary care center. Targeting providers with education and clinic-specific feedback has dramatically improved the quality and quantity of recommendations to patients, and in doing so, better protected them against HPV-associated disease.
Author Contributions
LK conceptualized this project, drafted and revised the manuscript, and approved the final manuscript as submitted. NJO conceptualized this project, drafted and revised the manuscript, and approved the final manuscript as submitted. AFB conceptualized this project, drafted and revised the manuscript, and approved the final manuscript as submitted. MCB conceptualized this project, drafted and revised the manuscript, and approved the final manuscript as submitted.
Footnotes
Declaration of Conflicting Interests
The author(s) declared no potential conflicts of interest with respect to the research, authorship, and/or publication of this article.
Funding
The author(s) received no financial support for the research, authorship, and/or publication of this article.