






Abstract
Background:
Malnutrition is a critical clinical condition that requires early intervention due to its potential for causing preventable fatalities and complications. This study aims to assess the impact of outpatient enteral nutrition support (ENS) as a therapeutic intervention on anthropometric measurements, intolerance, and micronutrient values in malnourished children.
Methods:
This observational study included 344 patients in ages 1 to 18 treated with standard enteral nutrition (1.5 kcal/mL energy with fiber). Patient data recorded at admission, in 3 and 6 months, including weight, height, body mass index (BMI), intolerance symptoms, and micronutrient levels. Data were also compared by age groups (1-2, 3-5, 6-12, and 13-18 years of age).
Results:
Malnutrition was prevalent in the 1- to 5-year age group (63.6%). Age-based analysis showed significant height and BMI z-score improvement in all age groups (P = .009 and P < .001, for all age groups, respectively), except the 13- to 18-year age group (P = .102 and P = .091, respectively). Micronutrient values remained within healthy ranges with minimal fluctuations. The ENS was well tolerated by 62.5% of patients, and the most common intolerance symptoms were constipation (15.4%), vomiting (8.1%), and nausea (7.3%).
Conclusion:
This study demonstrates that outpatient ENS therapy for 6 months significantly improved anthropometric measurements in malnourished children and was well tolerated. The 1 to 2 age group exhibited the most substantial response to treatment, whereas the 1 to 5 age group required at least 6 months of nutritional therapy to prevent stunting. However, the effect of ENS therapy on height and BMI z-scores in the 13 to 18 age group appeared insufficient after 3 months.
Introduction
Malnutrition is a serious condition that arises when an individual’s diet lacks the necessary nutrients or contains an excess of nutrients, adversely impacting the prognosis of other diseases. It accounts for 45% of child mortality under the age of 5 and contributes to over 3 million deaths annually. 1 As per the Turkey Demographic and Health Survey-2018 (TDHS 2018) data, 6% of children below the age of 5 in our country suffer from stunting, 1.5% experience severe stunting, less than 2% are underweight, with less than 1.5% being severely underweight. 2
The emergence of new definitions in the assessment of malnutrition has led to the concepts of “non-illness related; primary” and “illness-related; secondary” malnutrition, distinguishing between etiologies. 3 In the presence of comorbidities, malnutrition exacerbates the body’s adverse response to medical care and heightens sensitivity to side effects of treatment. Malnutrition results in a systemic negative impact due to disruptions in energy metabolism. These effects include unstable fluid balance, cardiomyopathy, impaired electrical conduction in the cardiovascular system, diminished hepatic gluconeogenesis, and an elevated risk of hypoglycemia. In addition, malnutrition leads to reduced intestinal absorption capacity due to villous blunting and atrophy in the small intestine, cerebral atrophy in the central nervous system, and changes in the ventricles and periventricular white matter. Cell-mediated immunity is suppressed, secretory IgA and complement levels decrease, phagocytosis becomes inadequate, and patients become more susceptible to infections.4-6 Malnutrition is linked to prolonged hospital stays, higher hospitalization costs, increased risk of readmission, and elevated mortality rates. 7 Timely recognition and treatment of malnutrition are of utmost importance due to its multifaceted adverse effects on health.
Enteral nutritional supplements are extensively employed in the treatment of malnourished children. The composition and dosages of enteral nutritional supplements can vary depending on the patient’s nutritional requirements, clinical condition, age, and tolerance levels. Globally, the utilization of enteral nutrition support (ENS) therapies is on the rise due to their personalized approach aligned with each patient’s clinical needs. 8 Consequently, in order to optimize the efficacy of treatment for children with malnutrition, it is imperative to conduct further research examining the impacts of ENS on relevant indicators, any potential intolerance, and anthropometric measurements. The objective of this study is to evaluate the impact of therapeutic ENS in outpatient malnourished children, focusing on weight, height, body mass index (BMI), tolerance, and micronutrient levels.
Materials and Methods
Sample
This observational study included 344 patients aged 1 to 18 years with primary or secondary malnutrition who were admitted as outpatients to the pediatric gastroenterology outpatient clinic at our tertiary care center and who had no indication for hospitalization due to malnutrition or complications of malnutrition. The patients were provided with ENS for a period of 6 months, with their progress monitored in an outpatient setting at the pediatric gastroenterology polyclinic. For treatment purposes, a standard enteral nutrition product containing 1.5 kcal/mL energy with added dietary fiber was administered. Formula macronutrients for 100 mL of ENS were as follows: 3.4 g protein (3.3 g casein + 0.1 vegetable), 18.8 g carbohydrate (0.2 g glucose, <0.025 g lactose, 4.4 g maltose, 14.1 g polysaccharides), 6.8 g fat (0.7 g saturates, 4.1 g monounsaturates, 2 g polyunsaturates), and 1.5 g fiber (0.9 g soluble, 0.6 g insoluble). The ENS treatment was administered in a volume that would meet at least 50% of the energy requirement, determined in accordance with the patient’s weight, in liquid form, ready to be consumed, and accompanied by instructions regarding the storage conditions. The Holliday and Segar equations were used to calculate the energy requirements. 9 The volume of the ENS was determined on an individual basis, taking into account the patient’s specific consumption patterns. In older children who were able to express their preferences, the dosage was set at 2 to 3 times per day, whereas younger children were instructed to follow their parents’ guidance in this regard. Patients younger than 12 months or older than 18 years, those unable to take ENS orally, those requiring tube feeding, and those with infections that could affect oral intake such as urinary tract infections, bronchiolitis, bronchopneumonia, and otitis media were excluded from the study.
Observation
All patients, spanning over various age groups (1-2, 3-5, 6-12, 13-18), had their weight, height, and body mass index (BMI) z-scores, along with their ferritin, folic acid, B12, and 25-Hydroxyvitamin D (25-OH D) levels documented and compared at admission, as well as at the 3- and 6-month marks. Throughout the ENS treatment process, weight, height, and BMI z-scores were also assessed for patients diagnosed with primary and secondary malnutrition. Intolerance symptoms were examined during the third and sixth months of the treatment initiation. Intolerance findings included the patient’s subjective complaints and objective indications of gastrointestinal dysfunction (such as vomiting, diarrhea, and constipation), in addition to physical examination findings (eg, abdominal distension). 10
Statistical Analysis
The statistical analysis of the data was conducted using the IBM SPSS (Statistical Package for the Social Sciences) Statistics software (IBM Corporation, Armonk, New York). To determine normality, the Shapiro-Wilk test was employed. Non-parametric data sets were compared using the Wilcoxon test for 2 data sets, and the Friedman test for more than 2 data sets. Student’s t-test was utilized for categorical analysis when the data followed a normal distribution, whereas the Mann-Whitney U-test was employed for categorical analysis when the data did not exhibit a normal distribution. The level of statistical significance was set at P < .05.
Ethical Statement
The study obtained approval from the Bahçeşehir University Clinical Research Ethics Committee on May 3, 2023, under protocol number 2023-09/03. Furthermore, all participants provided informed consent in accordance with the approved format prescribed by the ethics committee.
Results
Table 1 provides demographic information along with patient counts and the corresponding percentages for various age groups. Among the total cohort of 344 patients, aged 1 to 18 years, who were diagnosed with primary or secondary malnutrition and received outpatient ENS therapy, 50.9% were female (n = 175), and 49.1% were male (n = 169), with a mean age of 5.7 ± 4.81 years. Of the patients in the study, 158 (45.9%) were diagnosed with primary malnutrition, whereas 186 (54.1%) were diagnosed with secondary malnutrition. Notably, malnutrition was prevalent in patients older than 1 year but younger than 5 years, constituting 63.6% of the entire cohort (n = 219), and among these, those aged 1 to 2 years accounted for 39.8% of the entire cohort (n = 137).
Patient Demographics.

Abbreviations: SD, standard deviation; IQR, interquartile range; y, year; PM, primary malnutrition; SM, secondary malnutrition.
Among patients under 5 years of age, there were no significant differences in the baseline, 3-month, and 6-month anthropometric values when comparing genders (P > .05 for all). Furthermore, no differences were noted in the rate of improvement in weight, height, and BMI z-scores from admission to the sixth month mark across gender subgroups within the entire cohort (P = .762, P = .062, and P = .309, respectively). It is worth noting that in the study cohort, the prevalence of primary malnutrition was notably higher among patients older than 5 years of age (40.2% vs 56.0%), whereas secondary malnutrition had a higher prevalence among patients aged 5 and under (59.8% vs 44.0%) (P = .005).
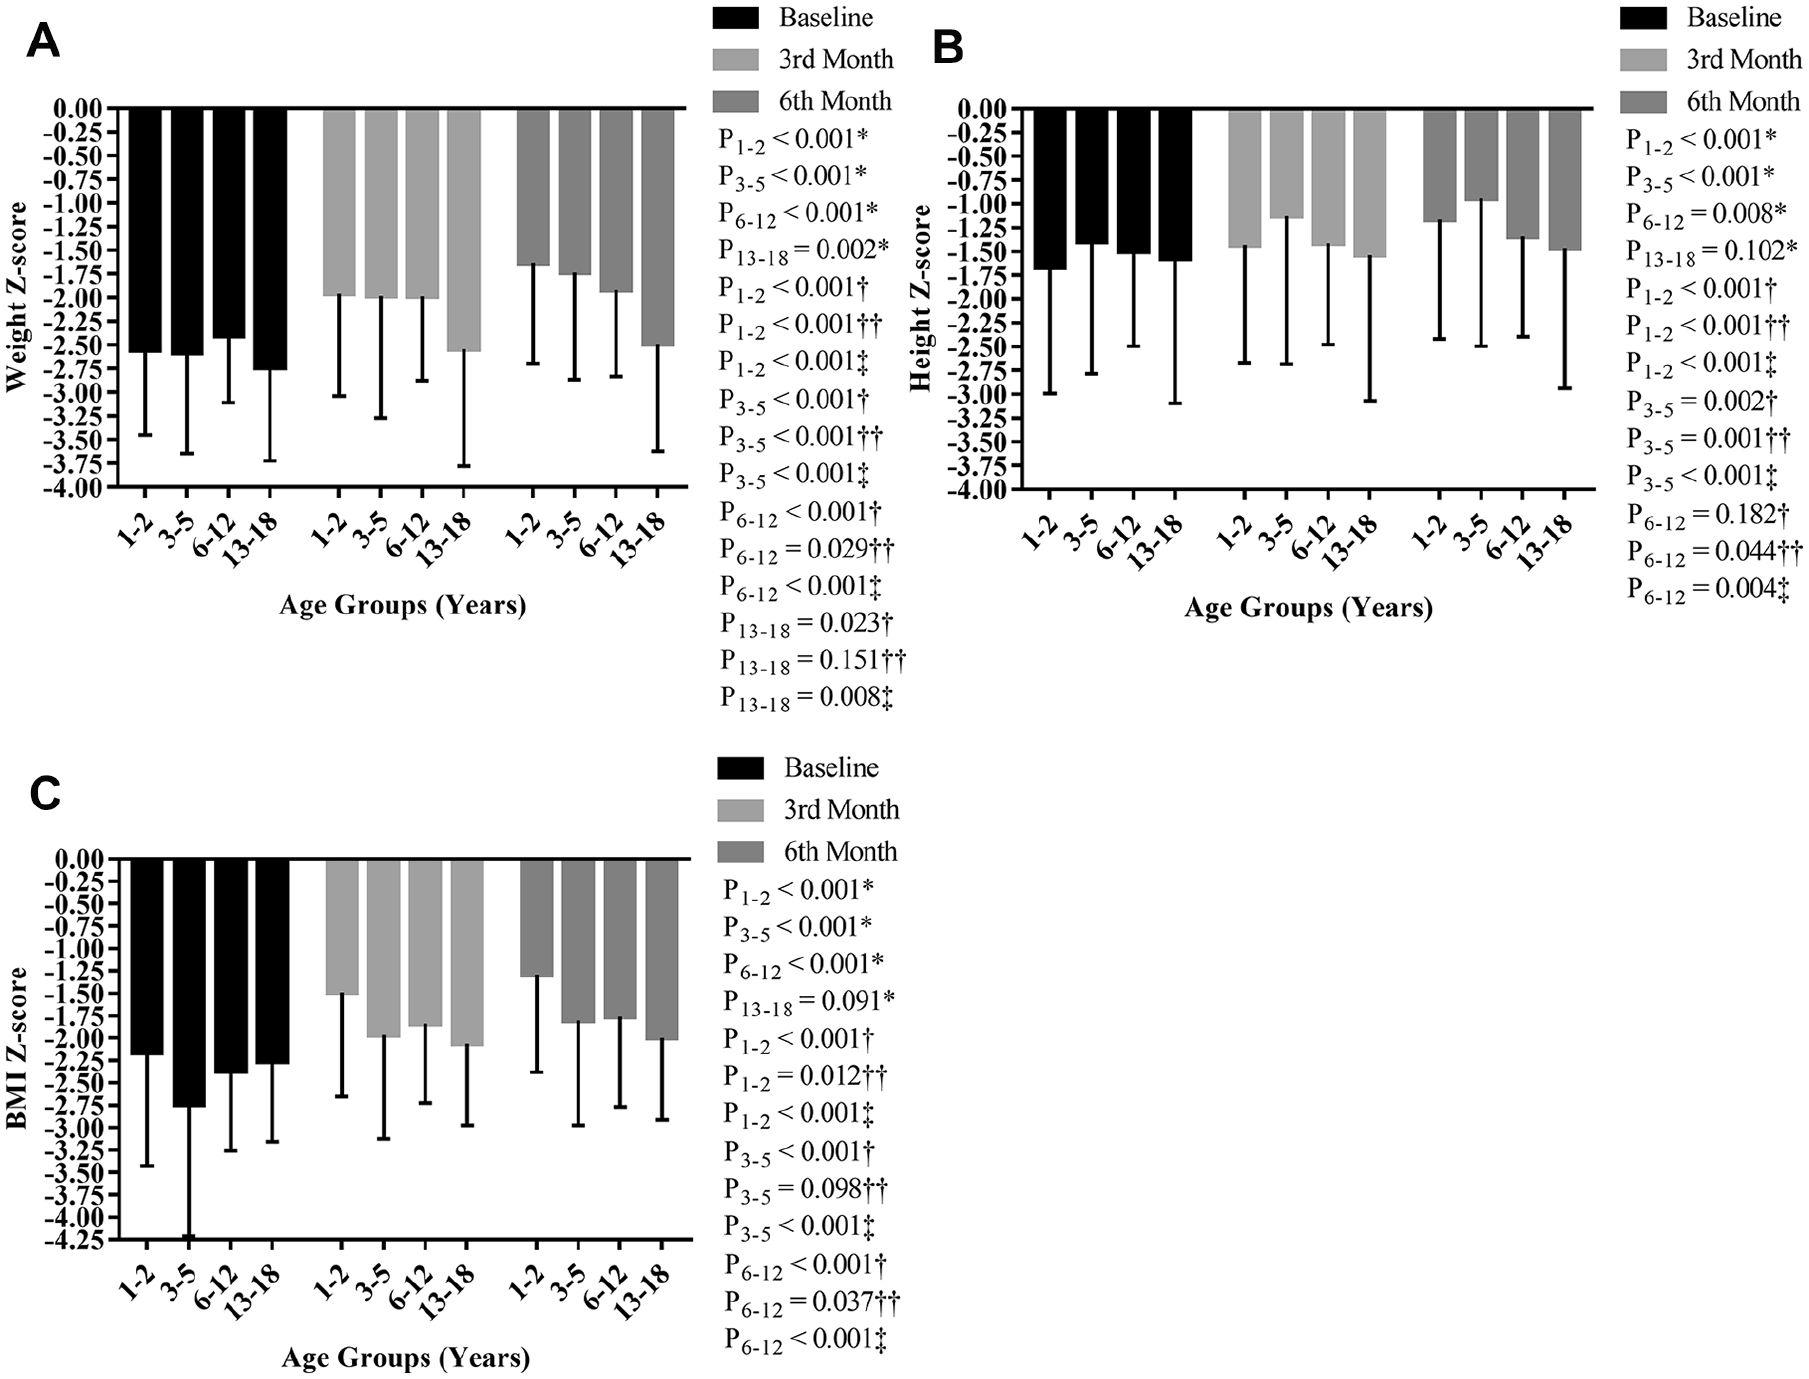
Figure 1 presents the changes in weight, height, and BMI z-scores of patients at admission, during the third and sixth-month follow-ups, categorized by age groups (1-2, 3-5, 6-12, and 13-18 years of age) as well as for patients aged 5 years and under and those over 5 years, along with the corresponding P values. Significant improvements in weight z-scores were observed in all age groups at the end of the sixth month (P < .003 for all age groups). When comparing weight z-score measurements at baseline and follow-ups separately, significant improvements were noted in all age groups (P < .05 for the rest), with the exception of the 13 to 18 age group from the third month to the sixth month (P = .151). Height z-scores also showed significant improvement in all age groups (P < .009), except for the 13 to 18 age group (P = .102). When examining the time intervals of the age groups displaying significant improvement in height z-scores, significant improvement was noted (P < .05, for the rest), except for the period between the baseline and the third month for the 6 to 12 age group (P = .182). Similarly, a significant improvement in BMI z-scores was observed in all age groups (P < .001 for the rest), except for the 13 to 18 age group (P = .091). The extent of improvement decreased as age increased across all anthropometric values. When comparing weight and height z-scores between ENS baseline and the 6-month follow-up, the least improvement was seen in the 13 to 18 age group (0.25, P = .002 and 0.11, P = .102, respectively), whereas the most significant improvement was observed in the 1 to 2 age group (0.92, P < .001 and 0.51, P < .001, respectively). Furthermore, patients aged 5 years and under exhibited healthier weight and BMI values (P = .022 and P = .026, respectively) at the 3-month mark, and weight, height, and BMI values (P < .001, P = .007, and P = .004, respectively) at the 6-month mark in comparison to patients over 5 years of age. The rate of positive changes in weight, height, and BMI values in patients aged 5 and under was significantly higher when compared with patients over 5 years of age (P < .001, P = .007, and P = .004, respectively). Except for the increase in height between the baseline and the third month in patients aged 5 and under (P = .099), all patients over 5 years of age experienced substantial improvements in anthropometric values to a healthy level within the 6-month period (P < .025 for all).
Improvement in anthropometric z-scores was assessed in various age groups of malnourished patients (1-2, 3-5, 6-12, and 13-18 years of age) and among those aged ≤5 years and >5 years, over a 6-month period of ENS therapy. (A) Weight z-score improvement of age groups. (B) Weight z-score improvement by ≤5 years and >5 years of age. (C) Height z-score improvement of age groups. (D) Height z-score improvement by ≤5 years and >5 years of age. (E) BMI z-score improvement of age groups. (F) BMI z-score improvement by ≤5 years and >5 years of age.
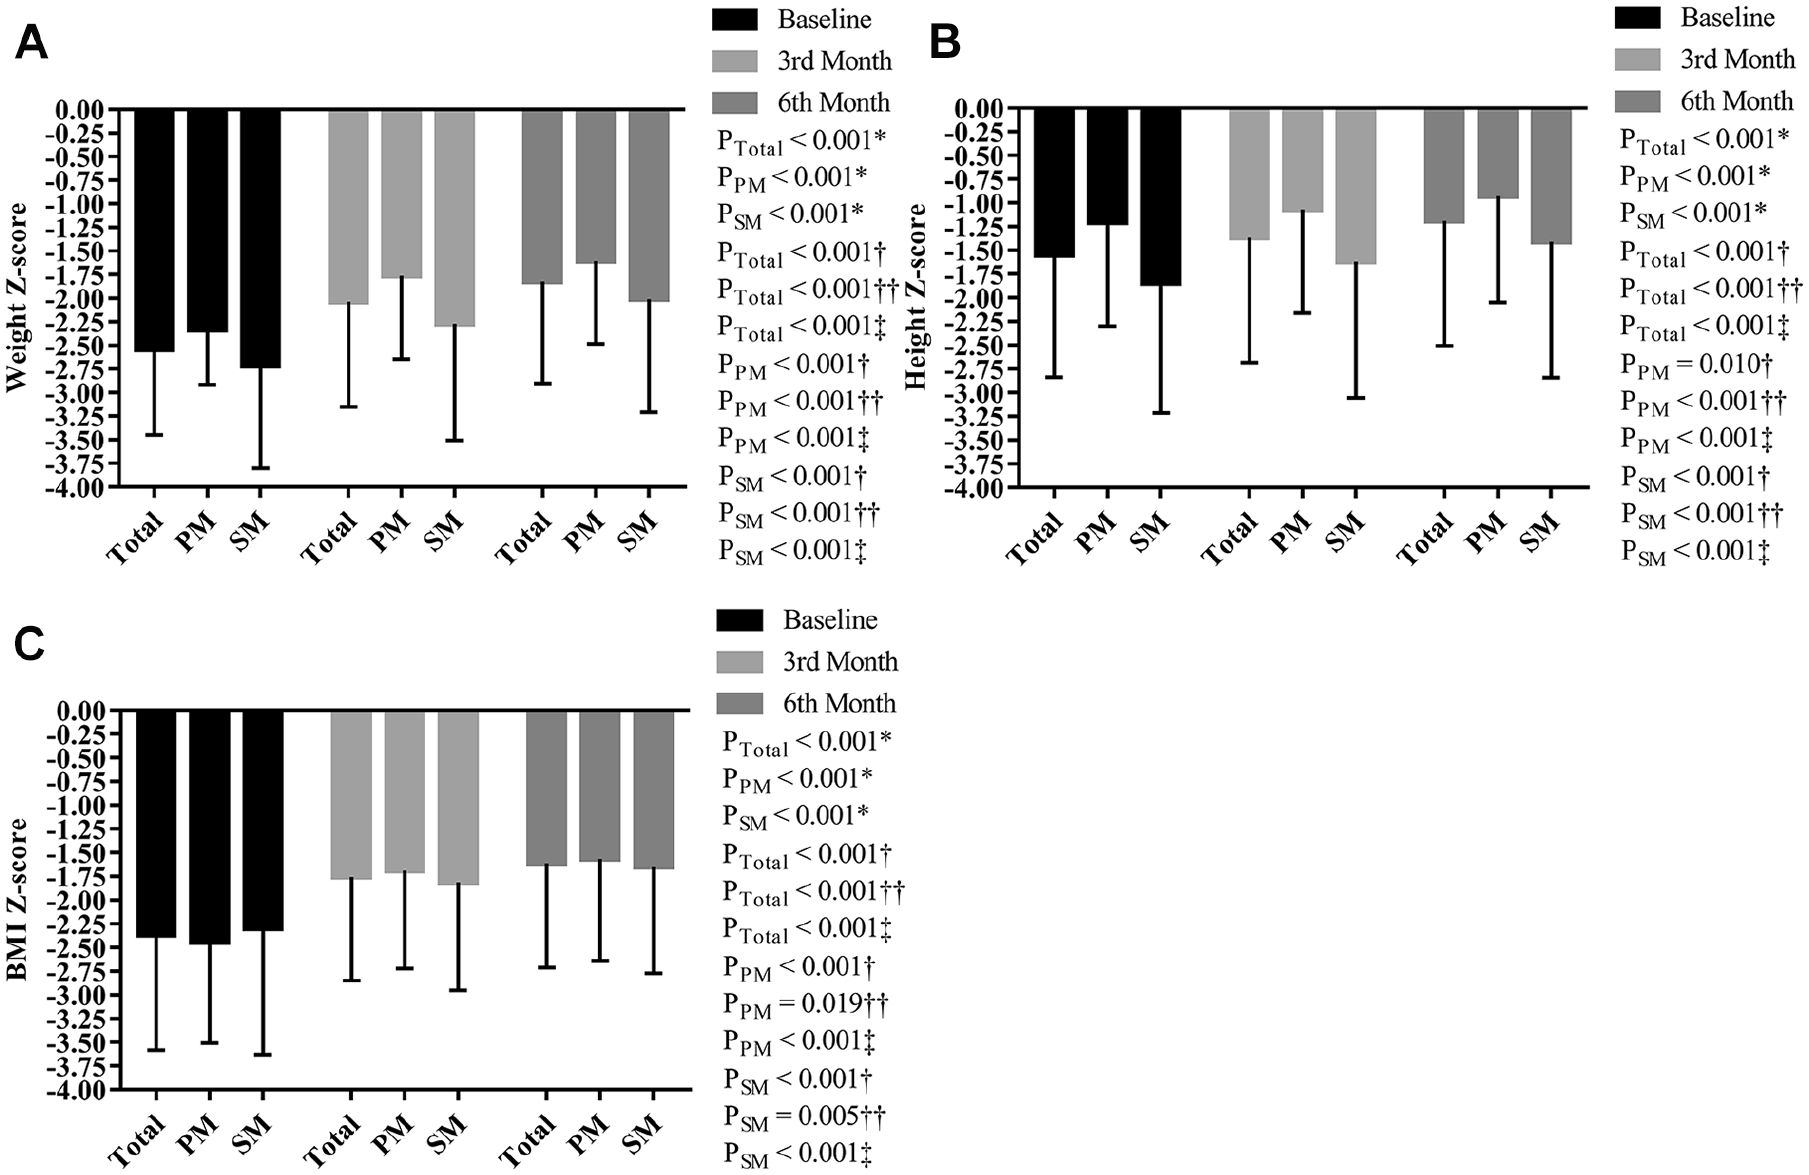
Figure 2 presents the changes in weight, height, and BMI z-scores at baseline, the 3-month, and the 6-month follow-ups for all patients with both primary and secondary malnutrition, along with the corresponding P values. Notably, significant improvements were observed in these parameters (P < .001 for all) for both types of malnutrition. The comparison of the follow-up time intervals revealed a significant improvement both between the baseline and the 3-month follow-up and between the 3-month and 6-month follow-ups (P < .05 for all). When comparing the mean increase in weight z-scores for patients diagnosed with primary and secondary malnutrition during the study period, no significant difference was noted (0.73 vs 0.71, respectively; P = .179). However, the increase in the mean height z-score for patients diagnosed with secondary malnutrition during the study period was significantly higher in comparison to patients diagnosed with primary malnutrition (0.43 vs 0.28, respectively; P = .030).
Anthropometric z-score improvement of patients aged ≤ 5 and > 5 years along with patients diagnosed with primary or secondary malnutrition over 6 months of ENS therapy. (A) Weight z-score improvement by diagnosis. (B) Weight z-score improvement by age. Height z-score improvement. (C) BMI z-score improvement.
Table 2 presents the findings, patient counts, and percentages of those who experienced intolerance at the 3rd and 6th months of ENS therapy. Notably, 62.5% of patients were able to tolerate the treatment without any issues. Among those who did experience intolerance, the most commonly reported symptoms included constipation (15.4%), vomiting (8.1%), and nausea (7.3%). The percentage of constipation intolerance did not exhibit a significant difference between primary and secondary malnutrition (P = .161). It is important to note that other intolerance findings could not be statistically analyzed due to the insufficient patient number. The number of patients who tolerated nutritional therapy did not vary significantly between primary and secondary malnutrition (P = .096). Remarkably, despite the presence of intolerance findings, neither patients nor physicians deemed it necessary to alter the ENS therapy. Moreover, Table 3 shows that weight and height z-scores measured at baseline were significantly higher in primary malnutrition (P = .002 and P < .001, respectively).
Overall Intolerability Incidences and Percentages by Primary and Secondary Malnutrition Sub-Groups Recorded in Third and Sixth Months.

Abbreviations: PM, primary malnutrition; SM, secondary malnutrition.
Some patients have more than 1 adverse effect and some patients.
Primary and Secondary Malnutrition Diagnosed Patient Distribution and Their Differences of Weight and Height z-Scores at First Hospital Admission.

Significantly higher results were written in bold.
Figure 3 illustrates the changes in micronutrient values at baseline, during the third month, and the sixth month of treatment. With the exception of ferritin and folic acid, which displayed changes between the third and sixth months (P = .051 and P = .115, respectively), all other micronutrients showed minimal fluctuations throughout the treatment, remaining within acceptable upper and lower limits (P < .05 for the rest). Ferritin and folic acid levels reached their peak in the third month and subsequently decreased at the sixth month. In contrast, vitamin B12 and 25-OH D reached their highest levels in the sixth month. Baseline values of folic acid, B12, and vitamin 25-OH D were significantly higher in patients with secondary malnutrition (P = .003, P = .002, and P = .006, respectively). In the third month, micronutrient values did not differ significantly between primary and secondary malnutrition patients (P > .05 for all). However, in the sixth month, only the B12 value was notably higher in patients with secondary malnutrition compared to those with primary malnutrition (P = .002).
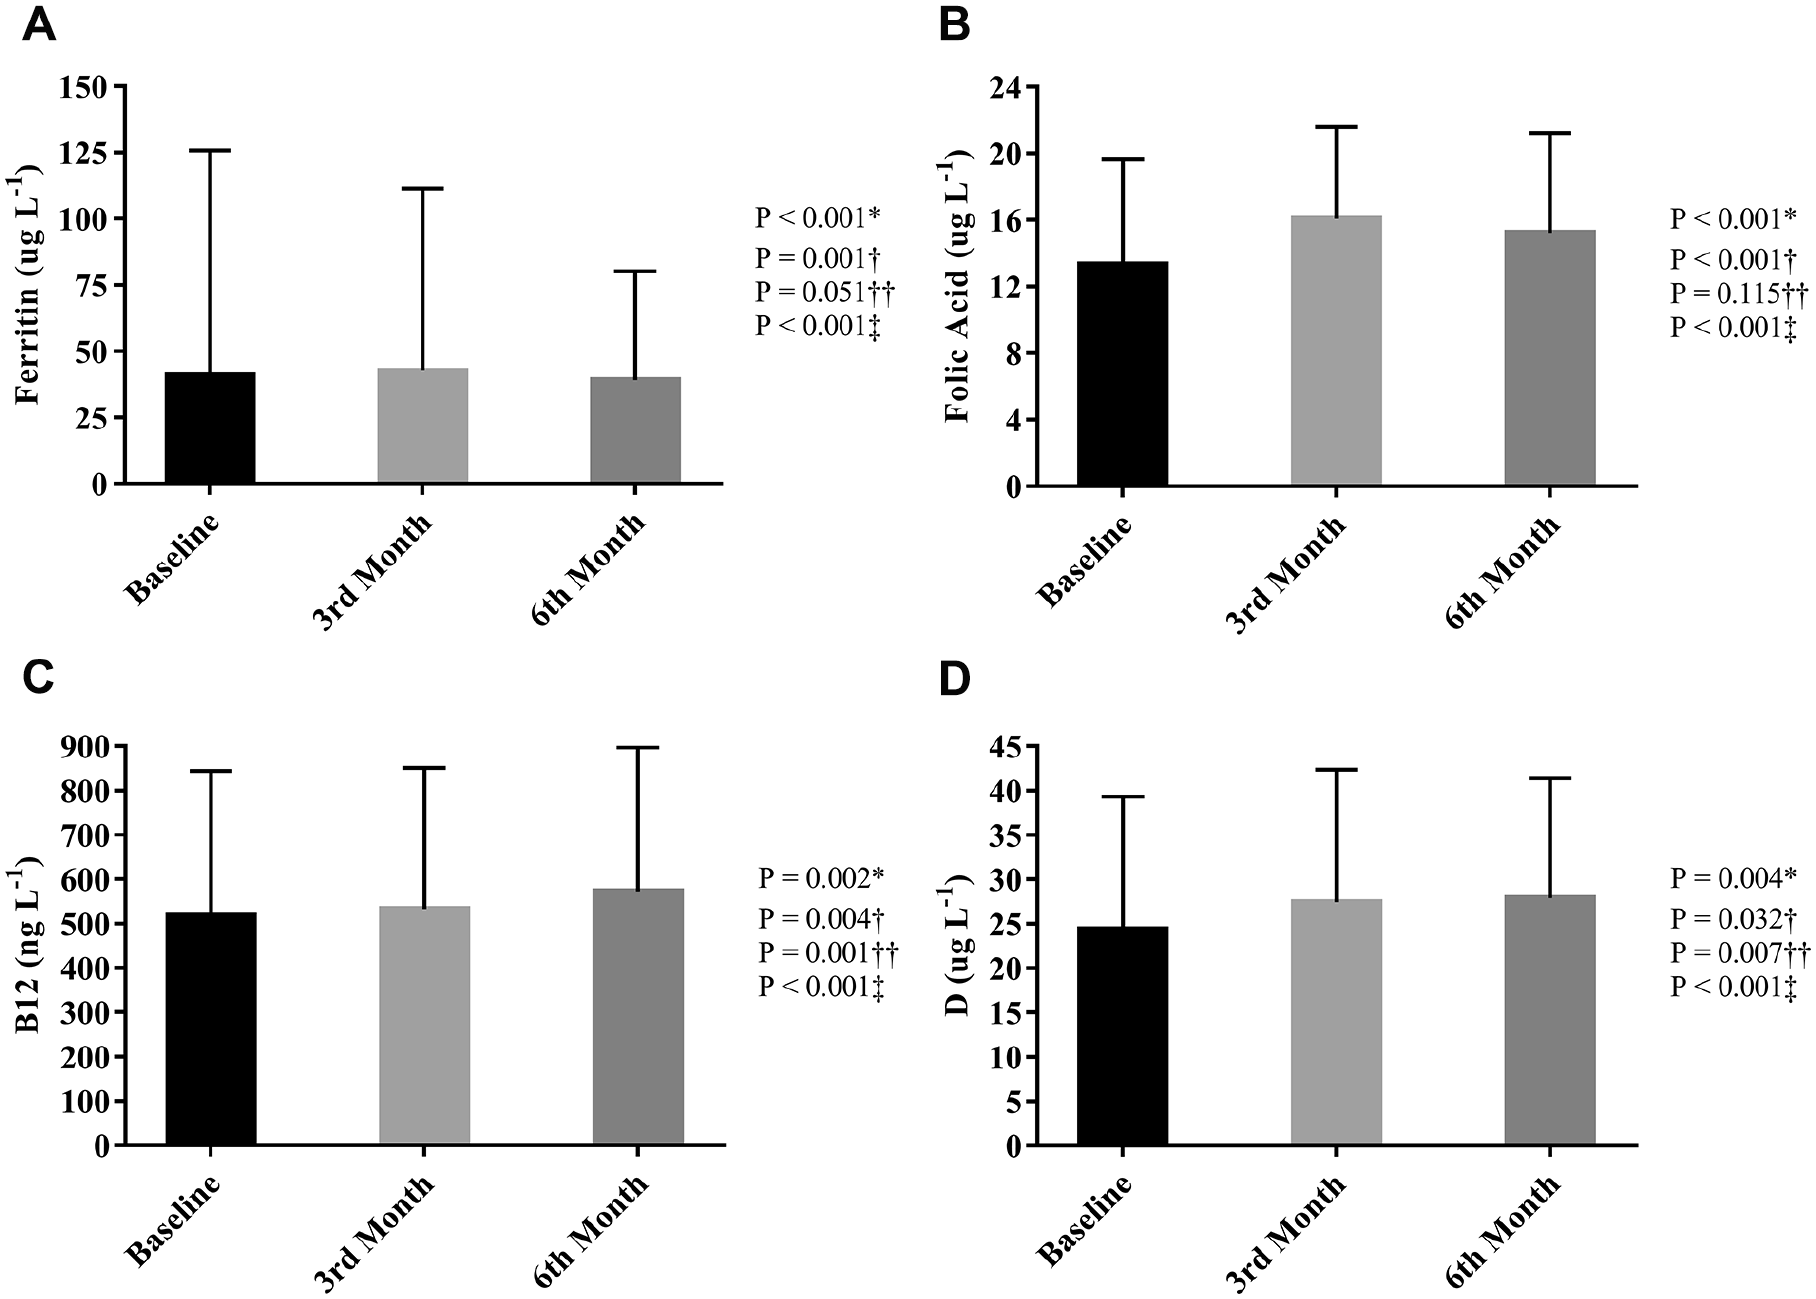
Micronutrient plasma concentration changes of patients with malnutrition over 6 months of ENS therapy. (A) Plasma ferritin concentration. (B) Plasma folic acid concentration. (C) Plasma vitamin B12 concentration. (D) Plasma vitamin D concentration.
Discussion
Malnutrition is a critical determinant of mortality and morbidity in young children worldwide. Recent observations indicate that malnutrition is a contributing factor to nearly half of all deaths among children under 5 years of age. 11 A 2015 review about malnutrition reported that it accounted for almost one third of all children deaths under the age of 5 and had a lasting impact on survivors, leading to intellectual impairment. 12
In our study, malnutrition, which is a risk factor for mortality, was more prevalent in young children, constituting 63.6% of the entire cohort in those aged over 1 year but under 5 years and accounting for 39.8% of the entire cohort among children aged 1 to 2 years. Malnutrition often develops during the accelerated growth and high-level brain development phases typically occurring between 6 and 18 months of age. This underlines the importance of comprehensive assessments and timely interventions, particularly for children aged 0 to 4 years, to mitigate the adverse effects of malnutrition. 13 Although therapeutic foods are employed to address severe acute malnutrition in children aged 5 years and younger in low- and middle-income countries, ENS is utilized to treat malnutrition in high-income societies. Our study investigated the impact of ENS therapy and its duration on anthropometric data across different age groups. The results of the study revealed that after 6 months of treatment and monitoring, weight z-scores displayed significant improvements in all age groups.
This result is in line with the results of a multicenter study conducted by Kansu et al 14 on patients aged between 1 and 10 years, who underwent outpatient ENS therapy for malnutrition. The most notable improvements in weight and height z-scores were observed in the 1- to 2-year age group. Our results indicated that ENS therapy resulted in significant improvements in weight and BMI z-scores after 3 months for patients under 5 years of age when compared with patients over 5 years of age. Moreover, significant improvements in weight, BMI, and height z-scores were noted after 6 months of treatment. Based on these results, we postulate that ENS treatment should be maintained for a minimum of 6 months to prevent stunting in children under 5 years of age. Stunting remains a significant public health issue among children under the age of 5 in many low- and middle-income countries worldwide, contributing to the death of approximately 1 million children annually.15-18
Despite the abundance of nutritional data available for children under the age of 5, there is a noticeable absence of global nutrition targets for older children and adolescents. 19 Nutrition plays a crucial role in the transition from adolescence to healthy adulthood. Malnutrition among children and adolescents is associated with delayed growth, impaired cognitive development, reduced intellectual capacity (intelligence quotient [IQ]), behavioral issues, and an increased risk of infectious diseases. 20 A recent meta-analysis failed to find any studies evaluating the impact of macronutrient supplementation on the health and nutritional status of adolescents. 21 Enteral nutrition products are designed with comprehensive nutritional content, covering macro and micronutrients tailored to meet the needs of 95% of the healthy population. In the case of products intended for use during childhood, they fulfill 100% of the daily recommendations for vitamin and mineral intake when consumed at a volume of 1000 to 1200 mL per day. 22 Our study aimed to demonstrate the effects of macronutrient support with ENS therapy on anthropometric data in adolescents. It was observed that the height z-scores exhibited significant improvement in all age groups, except for the 13 to 18 age group, following 6 months of treatment. In the 13 to 18 age group, no significant improvement was identified in BMI z-scores after 6 months of treatment. In this age group, a significant improvement was observed solely in the weight z-score at the third month, which was not sustained at the sixth month. A similar study conducted in Turkey by Kansu et al 14 did not include data for adolescents, as it solely evaluated patients between the ages of 1 and 10 years. Eating disorders have been identified by the World Health Organization (WHO) as a priority mental health concern for children and adolescents due to the health risks they pose and their association with significant psychiatric conditions. 23 Adolescents with eating disorders may experience malnutrition due to inadequate food intake, self-starvation, and/or disordered eating or purging behaviors. 24 It is worth noting that height standard deviation (SD) shows a rapid increase, reaching its peak at approximately 15 years for boys and 13.5 years for girls, after which it decreases steadily. 25 This increase in height SD reflects the biological maturation variation within the reference population and the individual growth differences influenced by genetic and environmental factors. In our study, the lack of height z-score increase in patients aged 13 to 18 years may be attributed to the conclusion of the rapid growth phase. In addition, this situation could be linked to developmental delays resulting from early malnutrition, which are more apparent in this age group. The long-term consequences of experiencing malnutrition during early childhood have been previously emphasized. 26 Our study suggests that ENS treatment may not be sufficiently effective in improving weight, height, and BMI z-scores in adolescents when administered for more than 3 months. However, it is important to note that the complex nature of malnutrition and anthropometric assessments, influenced by population, race, environmental factors, and individual characteristics, necessitates more comprehensive research in adolescents.
The ENS therapy is widely utilized for both primary and secondary (illness-related) malnutrition. However, research on its efficacy in secondary malnutrition is relatively limited, with most of the available evidence originating from studies conducted on elderly patients, except for specific patient groups in children such as those with chronic renal failure, end-stage liver disease, or congenital heart diseases. 27 Failure to diagnose and treat secondary malnutrition promptly can result in an increased risk of infection, delayed healing of wounds or burns, and a generally poor response to the treatment of the underlying diseases. 28 Our study demonstrates significant improvements in weight, height, and BMI z-scores for patients diagnosed with both primary and secondary malnutrition across all age groups. It has been demonstrated that implementing a nutrition-focused program after surgery for congenital heart disease leads to increased growth compared to previous assessments. 29 Furthermore, short stature, underweight, and overweight conditions have been linked to a heightened risk of mortality in chronic kidney disease patients undergoing dialysis.30,31 The guidelines established by the National Kidney Foundation Kidney Disease Outcomes Quality Initiative (KDOQI) recommend early initiation of oral, enteral, or parenteral nutrition as support when energy and growth targets are not met. 31 Children with chronic liver disease are at high risk of malnutrition, and given the association between malnutrition and adverse outcomes in liver disease, it has been suggested that the threshold for initiating additional enteral or parenteral nutritional support therapy should be set at a low level.32,33 In patients with cystic fibrosis, having a height below the 5th percentile is recognized as an independent risk factor for mortality. 34 In our study, the rate of recovery in height z-scores was higher in patients with secondary malnutrition compared to those with primary malnutrition. This result is intriguing in the context of ENS therapy, especially when considering the connection between short stature and mortality in cases of secondary malnutrition. Larger-scale studies are needed to further investigate these relationships.
Feeding intolerance lacks a consistent and universally agreed-upon definition, leading to significant variation in clinical practices. 35 It is well established that malnourished patients can experience rapid recovery when provided with well-tolerated and appropriate nutritional supplements.36-39 Enteral feeding intolerance is a common occurrence among critically ill patients globally, and clinical studies on intolerance have predominantly focused on intensive care patients. In our study, a substantial majority of patients, specifically 62.5%, tolerated the treatment without any issues. Among those who did experience intolerance, the most commonly reported symptoms included constipation (15.4%), vomiting (8.1%), and nausea (7.3%). The absence of any signs of intolerance necessitating the discontinuation or alteration of ENS therapy highlights the favorable tolerability of the treatment in outpatient malnutrition patients. This result aligns with the observations of Kansu et al, 14 who reported that ENS therapy was well tolerated in their study, with adverse events related to the enteral feeding regimen occurring in only 1 patient (0.3%). Our notably high tolerance rate is likely attributable to the fact that our study focused on malnourished patients who were not hospitalized in intensive care and could receive oral ENS therapy. In addition, the observation of differences in intolerance findings between patient groups with primary and secondary malnutrition underlines the importance of intolerance as a significant issue in malnourished patients requiring intensive care and hospitalization, particularly those with infections, malabsorption, severe inflammatory conditions, congenital heart diseases, and other related conditions.
The micronutrient levels exhibited minimal changes during the treatment and consistently remained within the normal limits. This indicates that ENS treatment does not lead to unhealthy micronutrient levels. The variations in micronutrient levels, as depicted in Figure 3, can be attributed to a combination of factors, including the frequency of the patient’s nutrition, the nutritional content of their diet, potential micronutrient supplements that families may have administered without our knowledge during the study, and their living standards throughout the 6-month duration. This further emphasizes the low effect of the enteral product utilized on micronutrient balance.
Conclusion
The highest prevalence of malnutrition, a condition associated with mortality and morbidity, was observed in the 1- to 5-year age group, accounting for 63.6% of cases. Therefore, the most effective intervention response is between 0 and 4 years. After 6 months of treatment and follow-up, anthropometric z-scores significantly improved in patients diagnosed with both primary and secondary malnutrition across all age groups. The most remarkable improvement was observed in the 1- to 2-year age group, with the exception of the last 3 months in the 13- to 18-year age group. This improvement was achieved with the administration of a complete nutrition product with 1.5 kcal/mL energy content and added fiber over a 6-month period. To prevent stunting in patients under 5 years of age, it is imperative to continue nutritional therapy for at least 6 months. However, for the 13- to 18-year age group, it was evident that the use of ENS for more than 3 months may not be sufficient in terms of anthropometric outcomes. As the study cohort excluded patients requiring intensive care or those unable to orally feed, the majority of patients tolerated the enteral product well. In addition, during this treatment period, micronutrient values remained within healthy ranges and exhibited minimal fluctuations.
Author Contributions
Footnotes
Data Availability
The retrospective data used to support the findings of this study are restricted by the Bahcesehir University Clinical Research Ethics Committee in order to protect patient privacy. Data are available from Hanife Ayşegül Arsoy (Bursa Yüksek İhtisas Training and Research Hospital, University of Health Sciences of Medicine, Department of Pediatric Gastroenterology, Hepatology and Nutrition) (Postal Code: 16310; Phone: +90 505 933 19 30; Mail:
Declaration of Conflicting Interests
The author(s) declared no potential conflicts of interest with respect to the research, authorship, and/or publication of this article.
Funding
The author(s) received no financial support for the research, authorship, and/or publication of this article.
Ethical Approval
The study was conducted in accordance with the ethical principles stated in the Declaration of Helsinki and approved by Bahcesehir University Research Ethics Committee (date of approval: May 3, 2023; decision no. 2023-09/03).
