
Abstract
We assessed associations of pediatrician demographic characteristics with patient satisfaction (PS) scores. We performed a retrospective analysis of PS scores among pediatricians at a single academic institution and their associations with individual demographic features including gender, race, and geographic location of medical school education. We analyzed PS survey results for 153 pediatricians, 48.4% of whom were female. Males received higher scores in 4 out of 10 questions including “Likelihood of your recommending this care provider to others” (P = .007). We observed similar findings for white pediatricians compared to Black, Indigenous, and People of Color (BIPOC) (P = .033) and US medical school graduates compared to international school graduates (P = .044). Overall, we observed that pediatricians who are female, BIPOC, or international medical school graduates receive lower PS scores than their counterparts. The impact of potential survey responder bias should be acknowledged when interpreting PS scores for pediatricians.
Keywords
Introduction
Surveying patients regarding their satisfaction with the medical care they have received has become common practice in the United States over the last 10 years since the Affordable Care Act directed the US Secretary of Health and Human Services to compare physicians using patient satisfaction (PS) survey data. 1 There has been no consistent association between quality of care and PS scores, with some studies suggesting a direct correlation,2-7 while others suggest an inverse correlation.8-13 Despite the lack of clear evidence that PS scores reflect better medical care, some institutions alter physician compensation based on PS scores. 14 The impact of this system on physicians has been studied in adult medicine;15,16 however, there have only been limited studies assessing the impact on pediatricians. Recently, our group demonstrated that PS scoring systems negatively impact pediatricians’ practice behavior and job satisfaction, 17 and there is some evidence that pediatricians may receive systematically lower scores than adult physicians. 18
One of the potential concerns with PS scoring systems is the possibility that survey scores may be influenced by rater implicit bias. 19 In this study, we sought to investigate the impact of physician demographics on PS scores, highlighting the potential role of rater implicit bias.
Methods
Patient satisfaction surveys are administered by Press Ganey at the study institution (Mayo Clinic), a single academic quaternary health care organization in Rochester, Minnesota. Following a clinical visit, PS surveys are sent to a random subset of patients and/or caregivers. Around 30 000 surveys are sent to pediatric patients’ families per year with a response rate typically around 15%. The target is for each physician to have at least 100 survey responses per year. Physicians receive a quarterly score report of the survey responses from their patients. A key survey question asks families to rate their “Likelihood to Recommend” (LTR) a specific physician who provided care by selecting one of the 5 choices: Very Poor, Poor, Fair, Good, and Very Good. The physician’s score report highlights the percentage of patients/caregivers who responded that the likelihood for them to recommend the specific physician was “Very Good.” Maximizing “Very Good” scores, deemed the “Top Box Score” (TBS) as it reflects the top rating a physician can receive for each survey question, is the highest priority metric for physicians to achieve at the study institution.
For this analysis, physicians with primary or secondary appointments in the Department of Pediatric and Adolescent Medicine who had PS surveys returned between January 2017 and December 2020 were included. Physician demographic data regarding gender, race, ethnicity (Hispanic or non-Hispanic), presence of a detectable accent that was not typical of the United States or United Kingdom, domestic (Doctor of Medicine [MD] or Doctor of Osteopathic Medicine [DO]) or foreign medical school, years since medical school graduation, and years since joining the faculty at Mayo Clinic were collected from institutional databases and personal interaction by the study team. Subjective categories (gender, race, ethnicity, and accent) were determined by at least 2 study team members, and any discrepancies were reconciled through discussion with the entire team. To facilitate analysis for this article, race was dichotomized into 2 categories: “white” and “BIPOC” (Black, Indigenous, and People of Color, which includes those who responded as Black or African American, Asian, Middle Eastern, or Mestizo). The authors acknowledge that race is a social construct and included this analysis specifically to identify biases that hinder marginalized people.
All Press Ganey PS surveys for included physicians were obtained from Press Ganey for the study time period. Based on recommendations from Press Ganey, we excluded from the analysis any physician with fewer than 8 survey responses over a period of 3 months (n = 512) to avoid the limitations created by small sample sizes. Surveys for patients age >18 (n = 1293) or who declined Minnesota Research Authorization were excluded (n = 960). All surveys were from outpatient visits, as inpatient surveys do not reflect individual physicians at our institution. Telemedicine visits were not included, as surveying procedures changed significantly over the study period and were not deemed consistent enough for analysis. A total of 9888 surveys from 153 physicians were included in analysis.
Data from survey responses to 10 questions (over 98 000 responses) related to physician performance were analyzed. Responses were aggregated into a single score for each physician in 2 different formats: (1) “TBS” and (2) “Average Linear Score” (ALS). To calculate both scores, individual question responses were assigned a value ranging from 1 (Very Poor) to 5 (Very Good). The TBS of a single question for an individual provider represents the percentage of responses of 5, where 5 is the best score achievable; the possible range of the TBS is 0 to 100. The ALS of a single question for an individual provider represents the average of responses for that provider; the possible range of the ALS is 1 to 5. If a provider had at least 1 non-missing response for a given survey question, the TBS and ALS were calculated for that question for the given provider.
Provider demographics were summarized as frequency (n) with percentage (%). The TBS and ALS were summarized as median, interquartile range (IQR = Q1-Q3), and range. To investigate associations between physician demographic data and PS score results, Kruskal-Wallis tests compared TBS and ALS by physician demographics. P < .05 was considered significant. All analysis was performed using SAS version 9.4 (SAS Institute Inc, Cary, North Carolina). This protocol was approved by the Mayo Clinic IRB.
Results
Survey data for a total of 153 pediatrician subjects were analyzed, and physician demographic distribution is displayed in Table 1. Half of physicians (48.4%) were female, 22.9% were BIPOC, and 22.9% attended an international medical school. Figure 1A and B illustrates the distribution of survey responses to the LTR query as analyzed with TBS and ALS methods by gender. Table 2 displays the TBS data by gender. Males received higher scores in 4 out of 10 questions: care providers’ discussion of any proposed treatment (options, risks, benefits, etc) (median [IQR: Q1-Q3] = 90.5 [82.1-94.4] vs 85.4 [76.2-90.2], P = .005); degree to which the care provider talked with you using words you could understand (87.5 [81.8-92.8] vs 84.8 [78.6-89.8], P = .025); your confidence in this care provider (88.5 [82.4-92.8] vs 83.3 [77.8-89.5], P = .004); likelihood of your recommending this care provider to others (LTR; 87.5 [82.8-92.1] vs 83.8 [77.4-89.0], P = .007). We observed similar gender differences on the same questions when analyzed by ALS (Table 3 and Figure 2). Median TBS or ALS was not higher for females on any question.
Summary of Physician Characteristics.
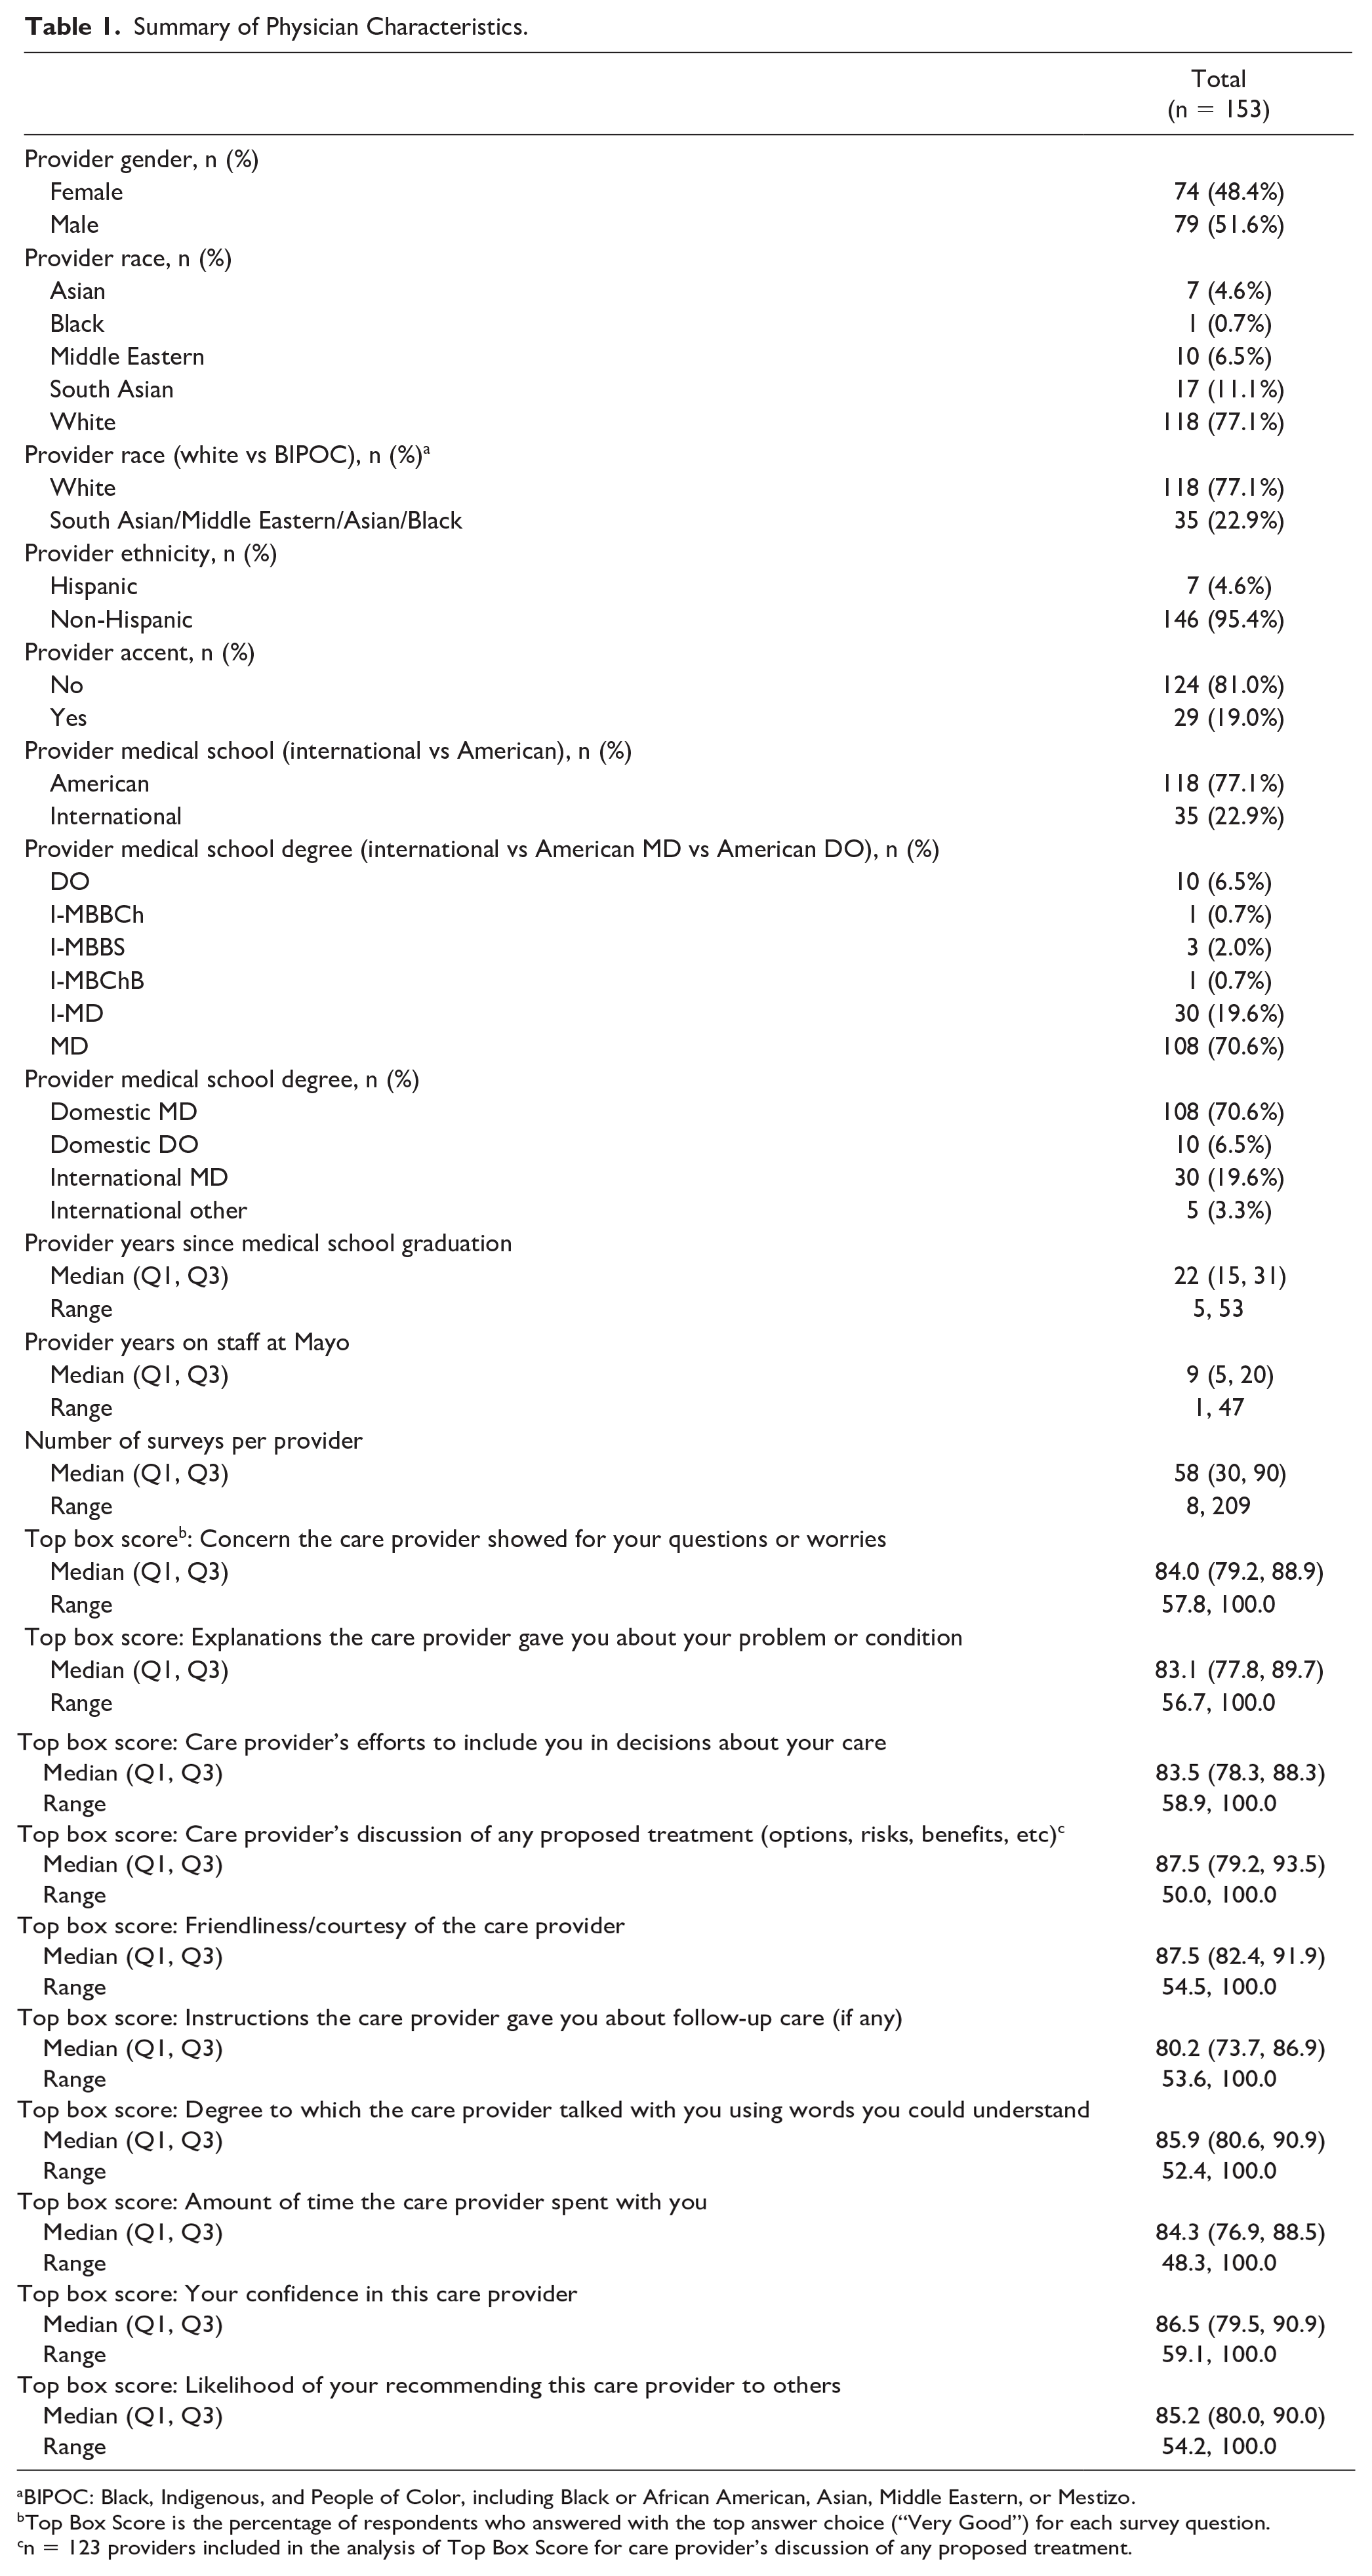
BIPOC: Black, Indigenous, and People of Color, including Black or African American, Asian, Middle Eastern, or Mestizo.
Top Box Score is the percentage of respondents who answered with the top answer choice (“Very Good”) for each survey question.
n = 123 providers included in the analysis of Top Box Score for care provider’s discussion of any proposed treatment.
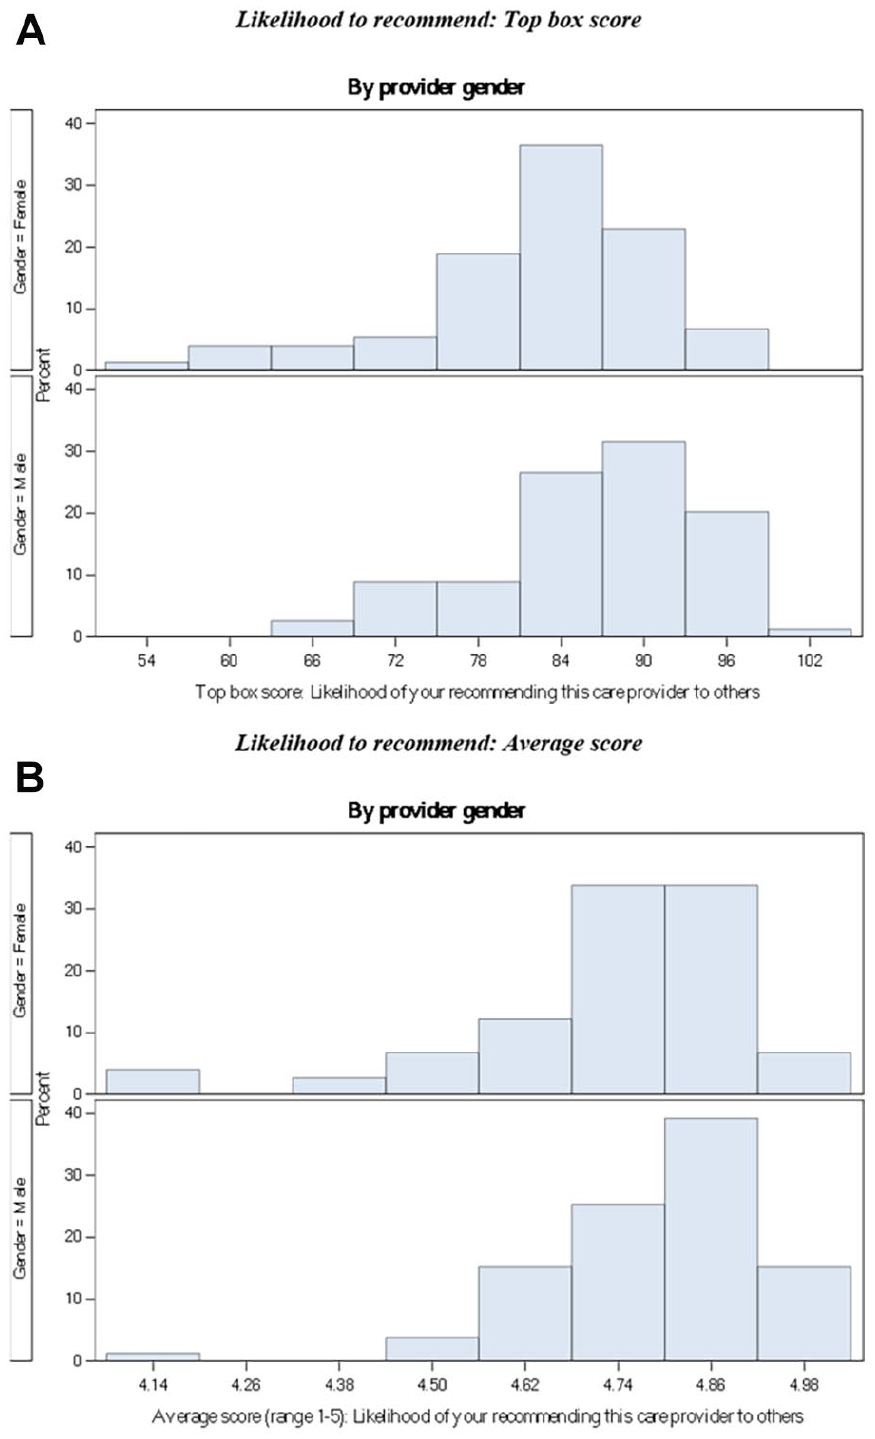
(A) Distribution of “Top Box Score” (TBS) rating for “likelihood to recommend” (LTR) by gender. (B) Distribution of physicians’ average linear score (range = 1-5) for “likelihood to recommend” (LTR) by gender. Top Box Score is the percentage of respondents who answered with the top answer choice (“Very Good”) for each survey question.
Top Box Score by Provider Gender.
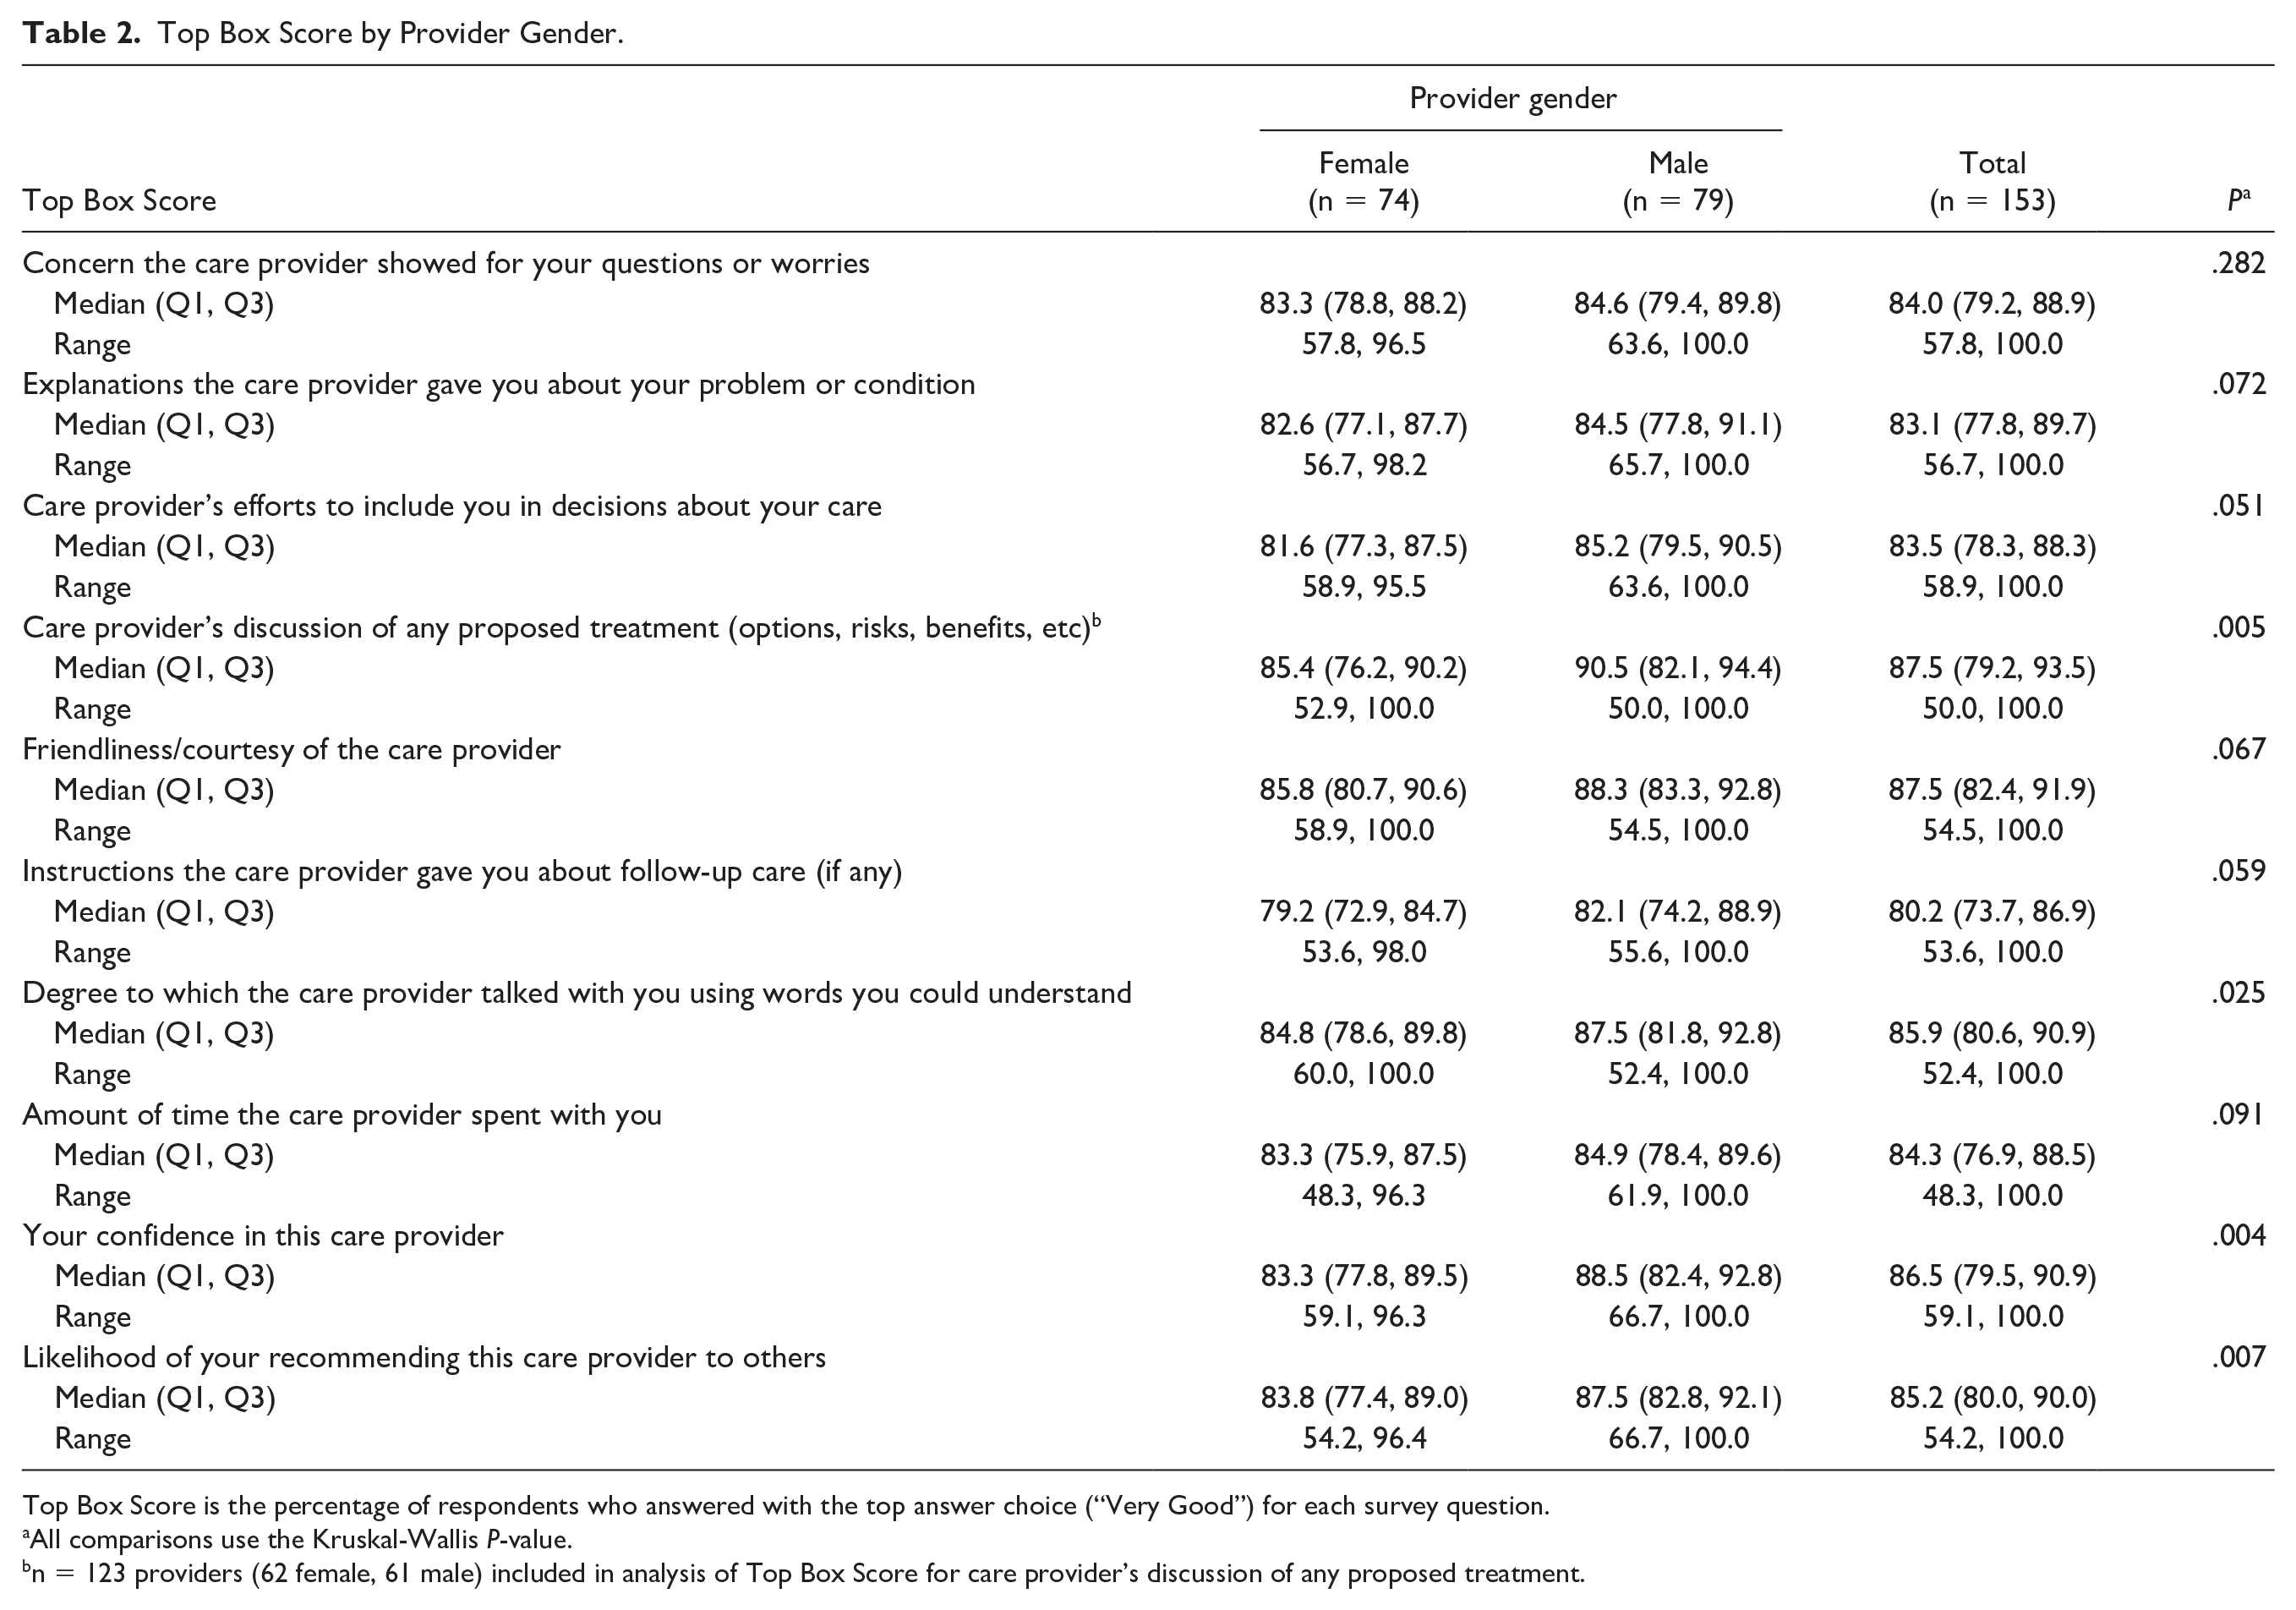
Top Box Score is the percentage of respondents who answered with the top answer choice (“Very Good”) for each survey question.
All comparisons use the Kruskal-Wallis P-value.
n = 123 providers (62 female, 61 male) included in analysis of Top Box Score for care provider’s discussion of any proposed treatment.
Average Linear Score by Provider Gender.
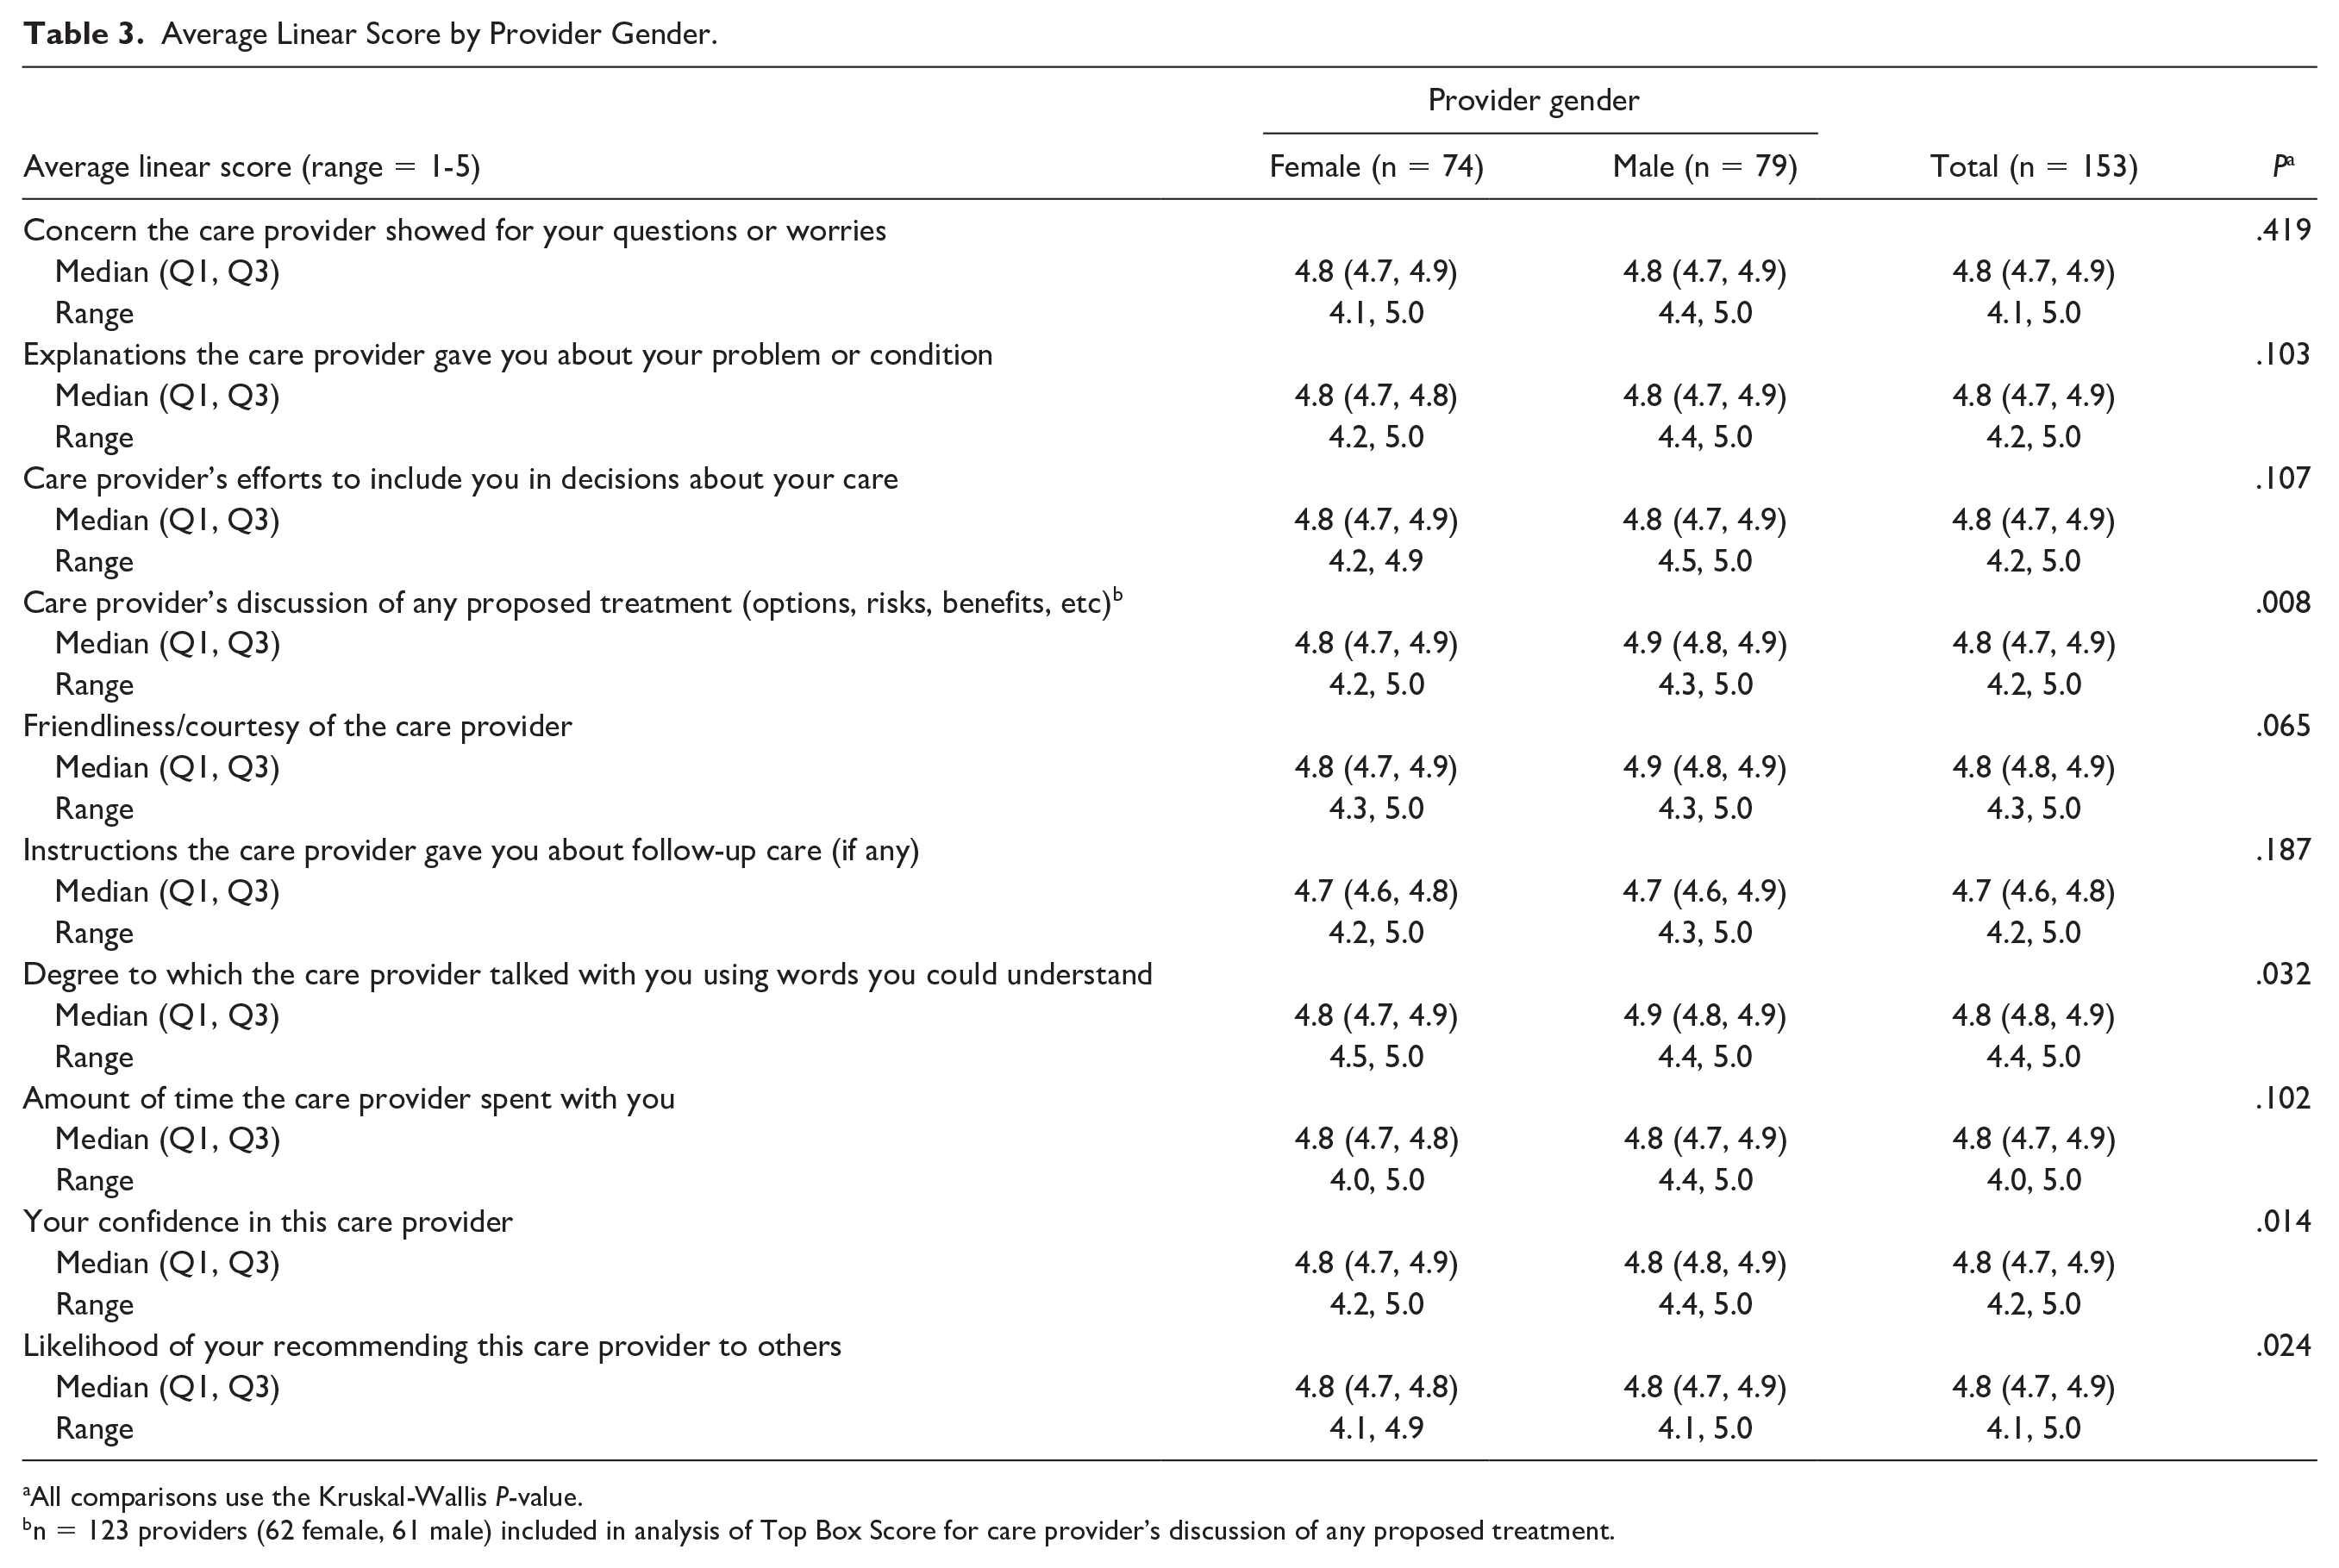
All comparisons use the Kruskal-Wallis P-value.
n = 123 providers (62 female, 61 male) included in analysis of Top Box Score for care provider’s discussion of any proposed treatment.

Average linear score by provider gender. Lower, middle, and upper values of each box represent 25th percentile, median, and 75th percentile, respectively, and whiskers and individual points display the range. P-values are from Kruskal-Wallis tests.
We did not observe significant differences in TBS by race. However, analysis of ALS by dichotomized race demonstrated higher scores for white physicians for 4 questions (Table 4 and Figure 3): explanations the care provider gave you about your problem or condition (median [IQR: Q1-Q3] = 4.8 [4.7-4.9] vs 4.7 [4.7-4.8], P = .013); care provider’s efforts to include you in decisions about your care (4.8 [4.7-4.9] vs 4.7 [4.7-4.8], P = .025); friendliness/courtesy of the care provider (4.9 [4.8-4.9] vs 4.8 [4.7-4.9], P = .046); likelihood of your recommending this care provider to others (4.8 [4.7-4.9] vs 4.7 [4.7-4.8], P = .033). We did not observe any differences when grouped by ethnicity (data not shown), and this is likely due to our small number of Hispanic physicians (n = 7) in the cohort.
Average Linear Score by Provider Race (white vs BIPOC).
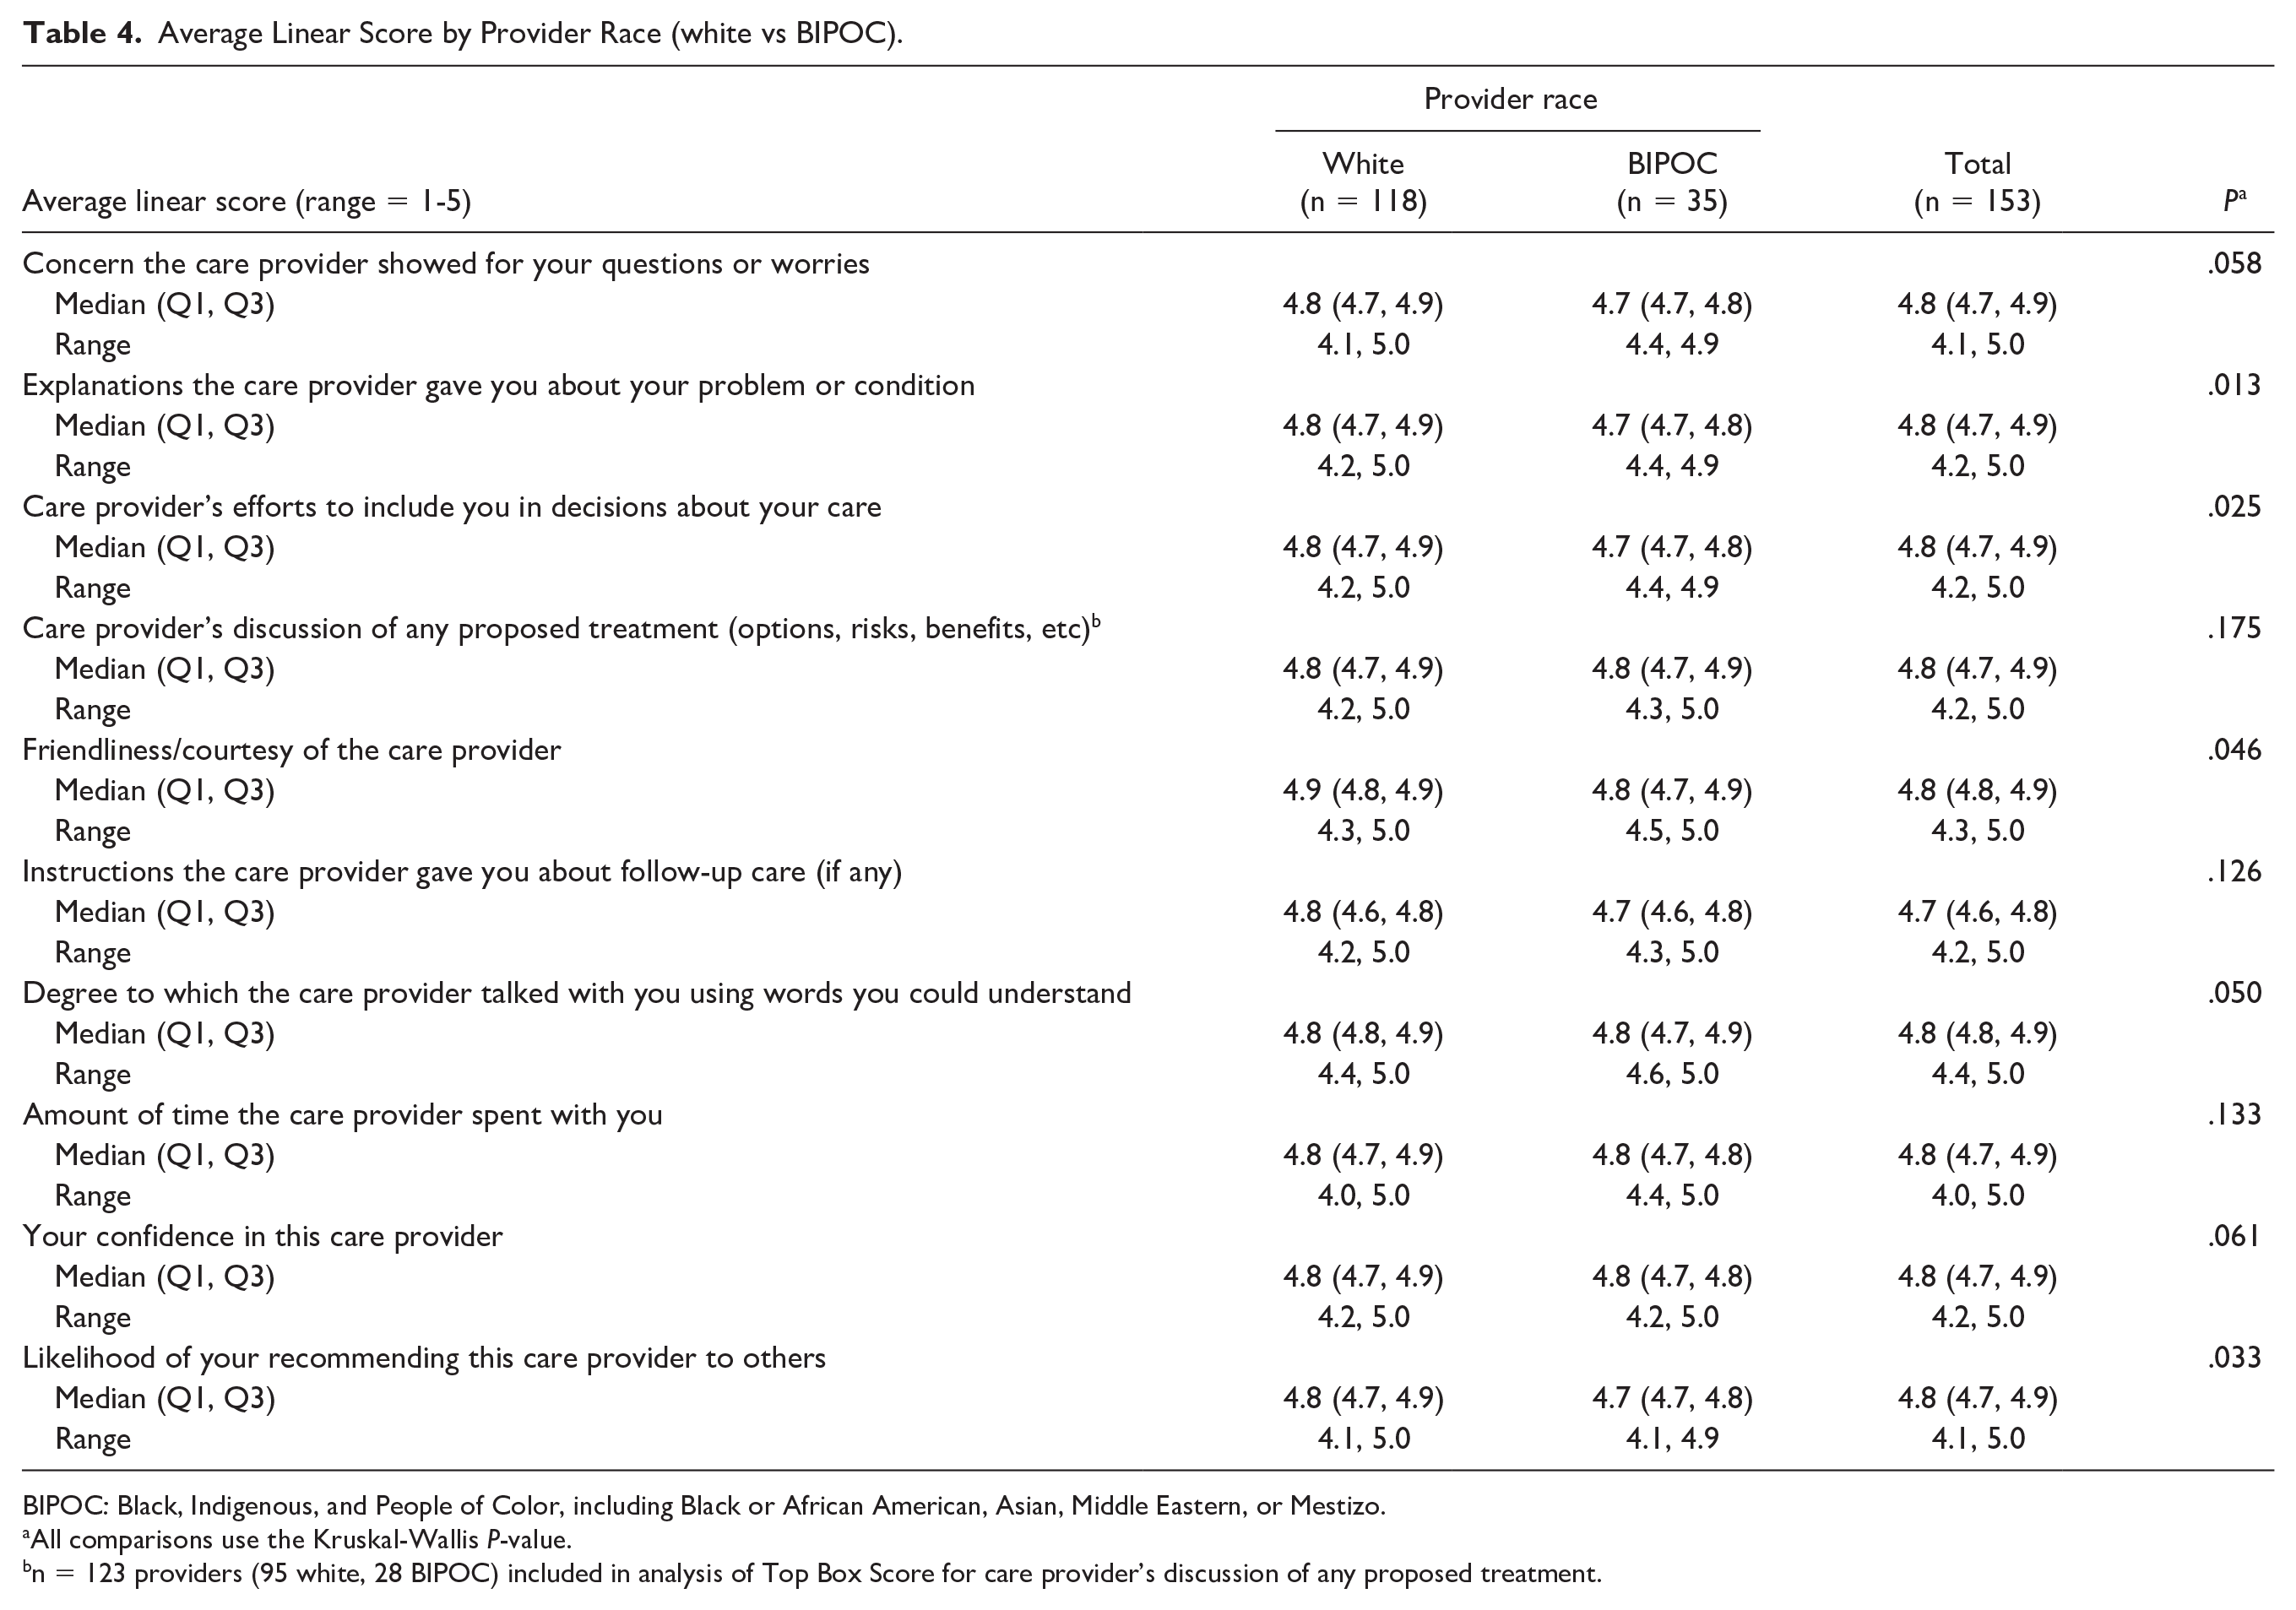
BIPOC: Black, Indigenous, and People of Color, including Black or African American, Asian, Middle Eastern, or Mestizo.
All comparisons use the Kruskal-Wallis P-value.
n = 123 providers (95 white, 28 BIPOC) included in analysis of Top Box Score for care provider’s discussion of any proposed treatment.

Average linear score by provider race (white vs BIPOC). Lower, middle, and upper values of each box represent 25th percentile, median, and 75th percentile, respectively, and whiskers and individual points display the range. BIPOC includes Black, Indigenous, and People of Color, including Black or African American, Asian, Middle Eastern, or Mestizo. P-values are from Kruskal-Wallis tests.
When we analyzed TBS for physicians based on where they attended medical school, we observed higher scores for US medical school graduates compared to international school graduates on 1 question (care provider’s efforts to include you in decisions about your care, median [IQR: Q1-Q3] = 85.0 [79.5-90.0] vs 79.8 [76.9-86.4], P = .017; data not shown), but 4 questions when analyzed by ALS (Table 5 and Figure 4): explanations the care provider gave you about your problem or condition (median [IQR: Q1-Q3] = 4.8 [4.7-4.9] vs 4.7 [4.7-4.8], P = .023); care provider’s efforts to include you in decisions about your care (4.8 [4.7-4.9] vs 4.7 [4.7-4.8], P = .017); degree to which the care provider talked with you using words you could understand (4.8 [4.8-4.9] vs 4.8 [4.7-4.9], P = .023); and likelihood of your recommending this care provider to others (4.8 [4.7-4.9] vs 4.8 [4.7-4.8], P = .044). Similar trends were observed when we compared accented to non-accented physicians, although these did not reach statistical significance (data not shown). No differences were observed between MD and DO physicians, and this is likely due to our small number of DO physicians (n = 10) in the cohort.
Average Linear Score by Physician Medical School Location.
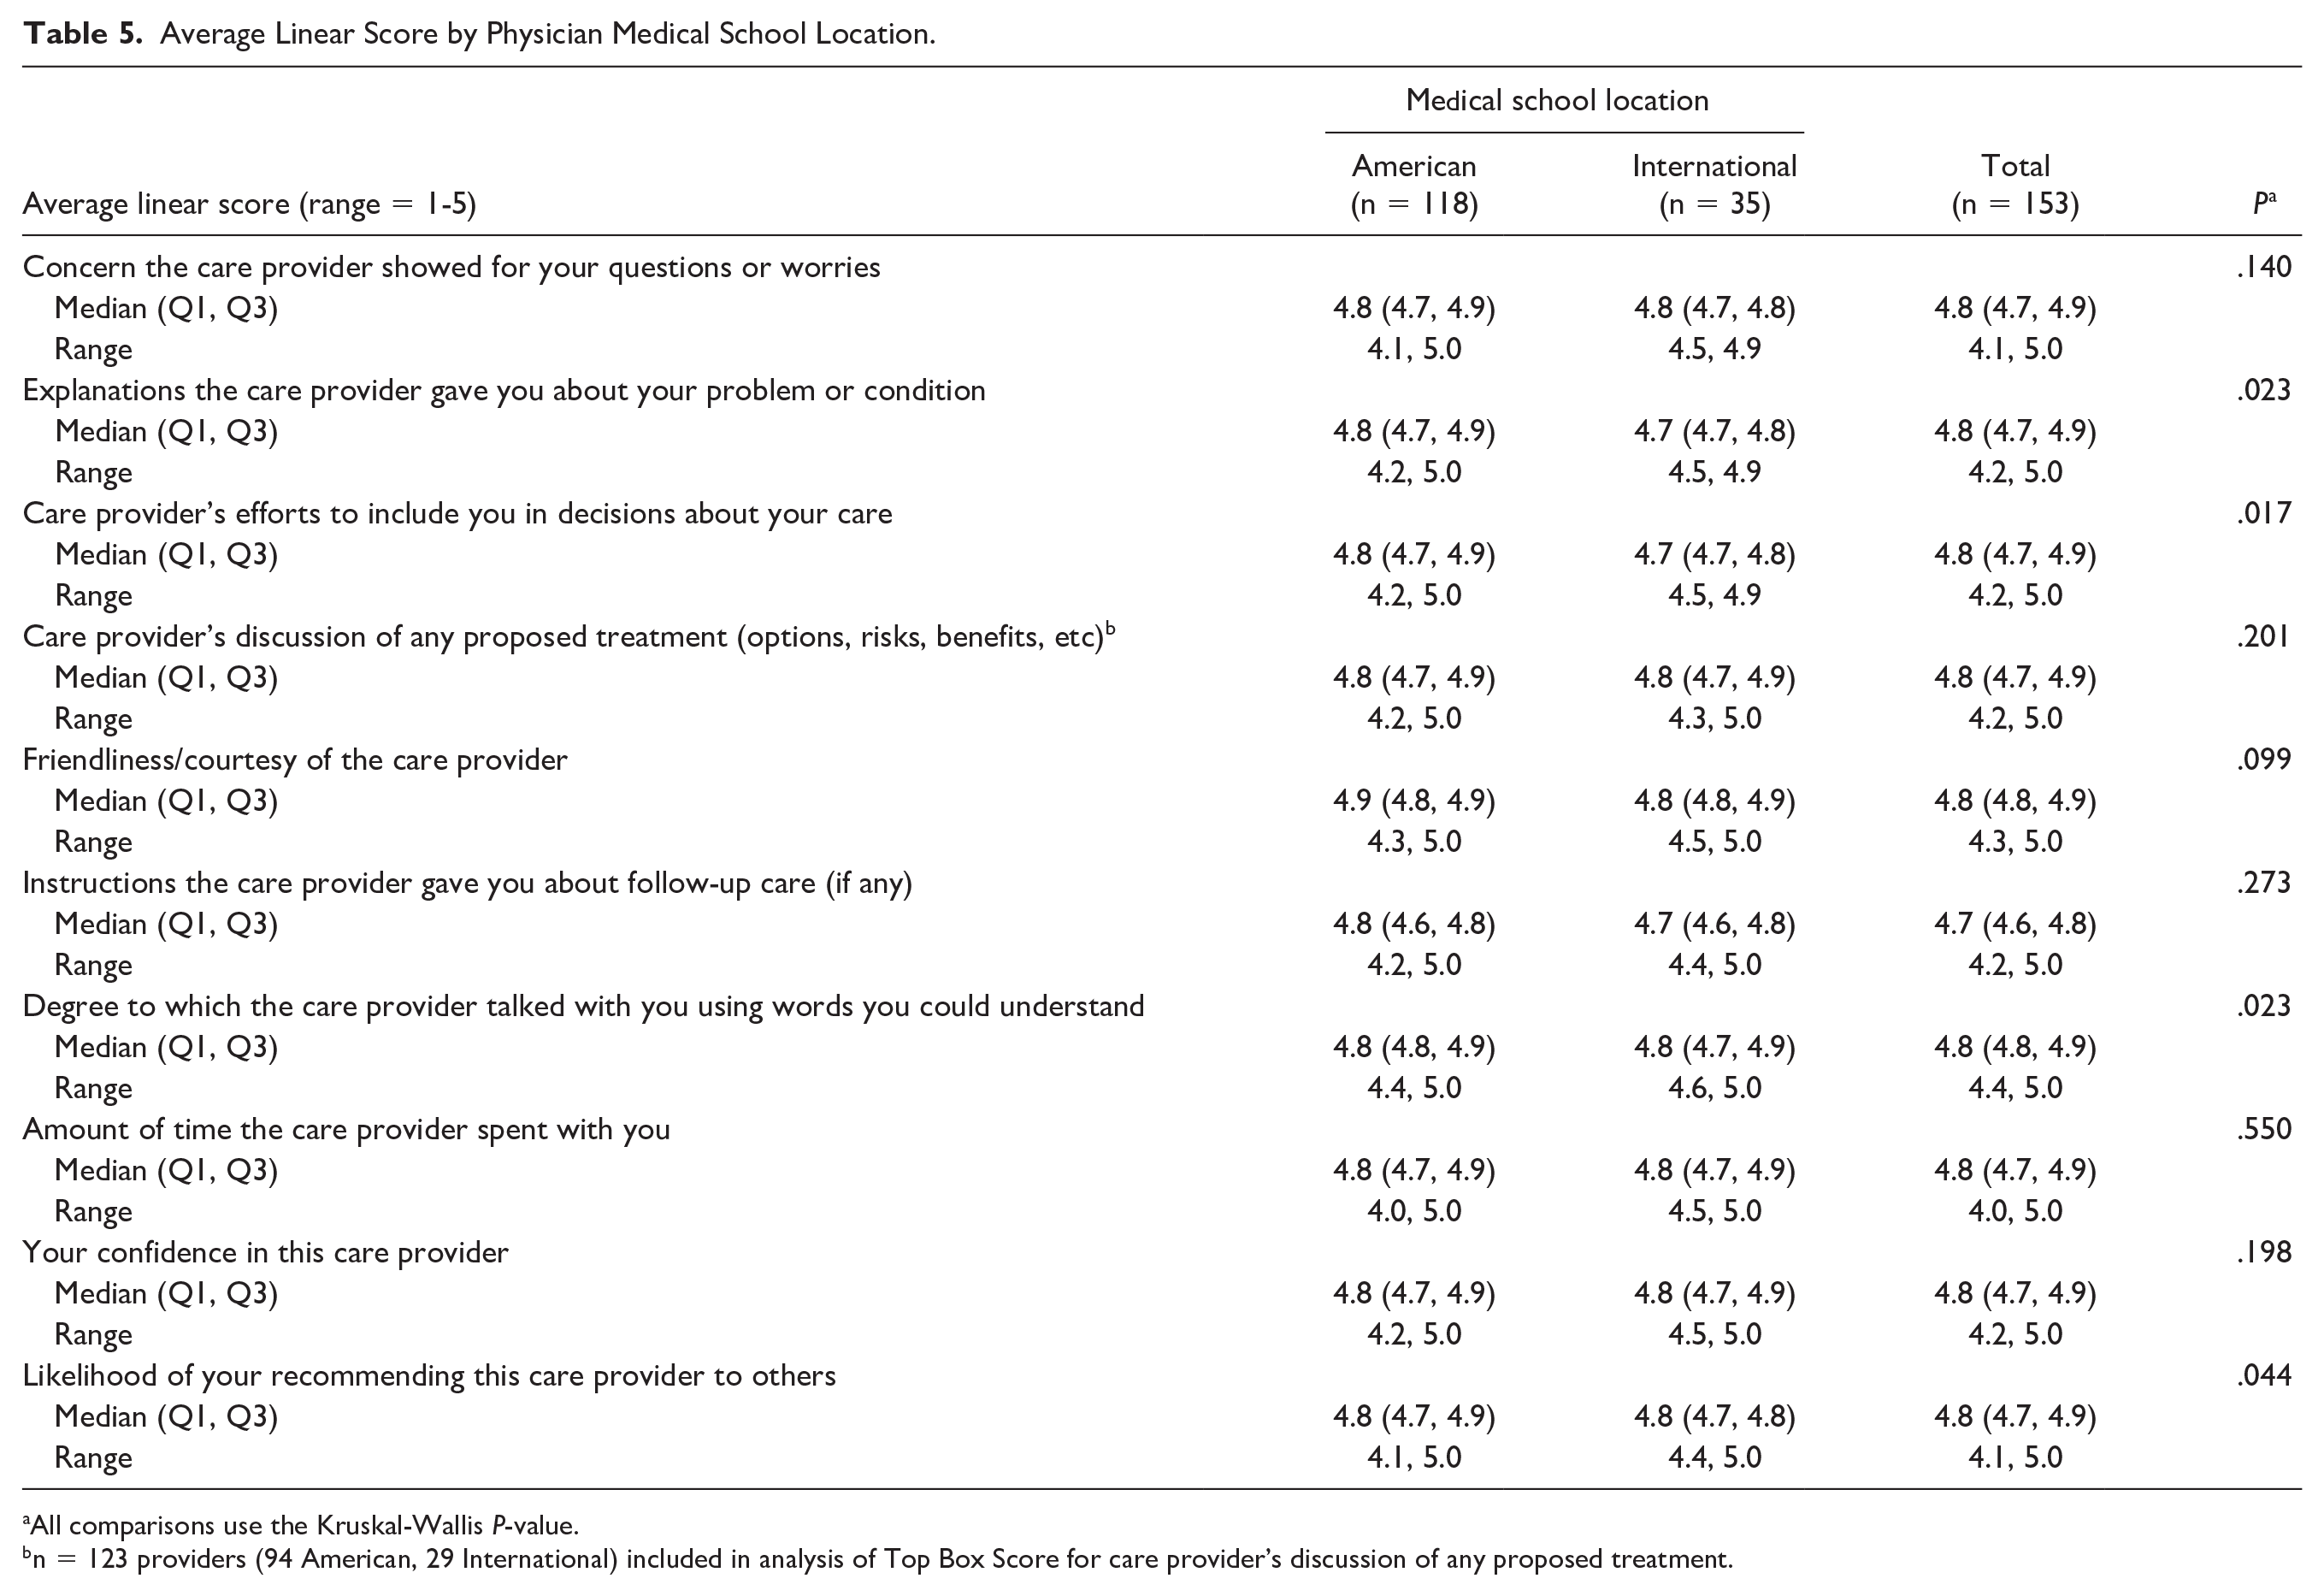
All comparisons use the Kruskal-Wallis P-value.
n = 123 providers (94 American, 29 International) included in analysis of Top Box Score for care provider’s discussion of any proposed treatment.

Average linear score by physician medical school location. Lower, middle, and upper values of each box represent 25th percentile, median, and 75th percentile, respectively, and whiskers and individual points display the range. P-values are from Kruskal-Wallis tests.
Discussion
This study is the first to evaluate the association between physician gender, race, training background, and PS scores for pediatricians in an outpatient practice. In our study, we observed differences in PS scores related to physician demographic characteristics. Specifically, the data demonstrate that pediatricians who are female, BIPOC, or international medical school graduates receive lower PS scores than pediatricians who are male, white, and graduates of US medical schools.
The use of different modalities to survey patients’ satisfaction with the health care they receive has become standard practice. Every day thousands of patients receive phone calls, electronic communication, or traditional mail with questions asking about their care after being evaluated or discharged from the US medical health system. Patient satisfaction surveys were designed to evaluate patient experiences with physicians and health care staff, as well as the entire institutional experience (eg, parking, ease of making an appointment, and wait time), as a tool for improving the care provided by individual physicians, medical health system, or networks. 20 Many employers and health insurance companies are using patient satisfaction scores as a metric to determine a portion of physician compensation and/or promotion (although not the institution in which this study was performed), which can result in significant stress and pressure to change behavior in order to receive higher scores. 14
While most of the focus has been on the US health care system, other regions of the world are also measuring PS and exploring the impact. A recent paper compared US and European methods for evaluating PS and found a wide variety of approaches including incorporating Internet-based narrative feedback in the United Kingdom and posting all results publicly in Finland. 21 Reports out of China, Japan, and Korea support growing interest in studying PS in Asian health care systems as well.22-24 As the appetite to incorporate metrics for measuring PS grows worldwide, the priority remains that the patient/physician relationship should start with mutual respect and collaboration to reach the best outcome for the patients.
Most health organizations have implemented programs to mitigate implicit bias against patients and change any policies or practices that perpetuate it. These policies and education efforts are predominantly directed at the health care providers. Often overlooked are the biases of patients and how they can affect the care relationship, harm health care provider well-being, subject health care providers to discrimination, or impact PS survey results. One major concern about reporting individual PS scores for each provider is that they are often reported as percentiles, so very small differences can lead to a large variation in force-ranked percentile and lower scores, which results in significant stress, anxiety, and burnout among physicians. 16 Our group has demonstrated a negative impact of PS scores on pediatricians, especially those who are female, BIPOC, subspecialists, younger, and attended non-US medical schools. 17
Our findings are similar to some previous reports. Soto-Santiago et al 25 observed lower PS scores for female and non-white physicians. Martinez et al 26 noted lower scores for South Asian and East Asian physicians among physicians providing care to adults via telemedicine. Asian ethnicity was also associated with a lower likelihood of receiving a 5-star likelihood of recommending orthopedic surgeons. 27 The small sample size of BIPOC physicians in our cohort did not allow us to examine differences between Asian and Black American physicians. Higher PS scores have been associated with racial/ethnic concordance between patients and their physicians. 28 Given this, the higher PS scores we observed in white physicians may be partly related to the demographics of the patients served by our medical center, with the vast majority being white. While we are not aware of any PS measurement methods that include bi-directional surveying in which physicians rate patients in parallel, this could be an intriguing next step to provide insight into the impact of concordance and other deeper associations affecting PS and physician well-being.
We found women physicians had lower PS scores in comparison to their male colleagues. The data on the association between PS scores and physician gender are mixed. A study among gynecologists demonstrated that female providers are less likely to receive top scores when compared to their male colleagues, 29 while no association was found among otolaryngologists. 30 A meta-analysis investigating associations regarding gender in adult physicians showed that female physicians generally scored better, especially with younger patients. 31 In a randomized clinical trial in which a clinical vignette was presented to participants with a black or white, male or female physician, no significant differences were found in simulated patients’ evaluations of female or black physicians. 32 Furthermore, many studies support that female providers face common stereotypes and biases at work like their physician role being misidentified by patients 33 or getting referred to by their first name rather than their professional name by patients and male colleagues.34,35
We found higher PS scores for physicians from American medical schools in comparison to those from foreign medical schools and a similar trend in physicians with an accent. We are not aware of any other studies that have examined the association between medical schools and accent with patient experience scores, although it is well-documented that international medical graduates do experience bias. 36
Strengths of our study include investigating the associations between PS scores in pediatrics, a specialty in which data are lacking. We wish to emphasize the importance of studying PS within pediatrics because the inherently different logistics in surveying make extrapolation from adult studies problematic. Specifically, the major difference is that in pediatrics (in most cases), the patient themselves does not complete the survey, but rather it is completed by the patients’ parent. This added layer of complexity could, perhaps, lead one to speculate that PS scores are even more difficult to link to quality of care than in adult medicine.
In addition, our cohort of pediatricians is well-balanced in terms of gender and had reasonably good representation among pediatricians who are BIPOC and international medical school graduates. Another strength is the availability of a large number of survey data points. It is also notable that we chose to have the investigators assign physician gender, race, and ethnicity rather than have them self-reported. This was an intentional choice based on the notion that this method would more accurately reflect that the survey responders are also making these same judgments of the physicians detached from the physicians’ own self-reporting.
Limitations of our study include that the cohort is from a single institution with limited sample size and patient ethnic diversity. In addition, the study design is cross-sectional and applied only univariate analysis, thus limiting interpretation of the results. Another limitation is the absence of data on patient race and ethnicity, given that racial and ethnic concordance between patients and their physicians has been associated with higher patient experience scores. 28 Also, patient race by itself has also been shown to influence patient experience scores with Asian patients less likely to give the highest patient’s satisfaction scores regardless of provider race and ethnicity. 37 We did not have information on the gender of the adult caregiver completing the survey, which previous studies suggest could impact the results.31,38,39 Other potential causes of differences in PS scores must be acknowledged, such as physician experience and ability, patient load, duration of time spent with patients, ease of navigating the clinic visit, underlying medical condition(s) of the patient, and patient demographics/socioeconomic status, among others. Our study design did not allow for accounting for these and other potential confounding factors. We also acknowledge the challenge in determining the clinical relevance in differences where we identified statistically significant differences.
Acknowledging the above limitations, our findings highlight the potential bias in PS surveying within pediatrics, significantly impacting pediatricians who are female, BIPOC, and graduates of international medical schools. Although the study was not designed to determine a causal relationship between surveyor implicit bias and PS scoring, the results suggest that implicit bias could play a role and may require future study into the mechanisms undergirding the differences found here.
These observations, combined with the concern for the negative impact of PS surveying on pediatricians, should compel administrators and physicians to carefully weigh the risks and benefits of PS surveying and develop strategies to minimize harm while still making available the potentially useful information from this method of feedback. At the very least, our findings suggest that using PS scores to determine compensation or other tangible factors contributing to quality of life is inappropriate. Rather, physician compensation should be based on more objective metrics like outcomes, years of training and experience, and productivity. In an effort to promote an inclusive and diverse workforce in health care, we propose that PS scores should be used only as a tool to identify areas of improvement for patient experience and not as metrics for physician performance or competence. Larger controlled studies are needed to better understand the true role of implicit bias in patient experience and PS scoring.
Conclusions
Pediatricians who are female, BIPOC, or international medical school graduates are more likely to receive lower PS scores. The impact of these findings must be acknowledged when addressing institutional systems for utilizing PS scores as a performance metric, as well as addressing workforce burnout and physician well-being.
Author Contributions
Footnotes
Declaration of Conflicting Interests
The author(s) declared no potential conflicts of interest with respect to the research, authorship, and/or publication of this article.
Funding
The author(s) disclosed receipt of the following financial support for the research, authorship, and/or publication of this article: Funding for this study was from benefactor gifts through the Mayo Clinic Children’s Research Center, which had no role in the design or execution of this study or in the decision to submit the article for publication. None of the authors received any honorarium, grant, or other form of payment for contributing to this project. The funder/sponsor did not participate in the work.
Ethical Approval
This study was approved by the Mayo Clinic Institutional Review Board.