






Abstract
To assess the feasibility of an electronic nose (e-nose) for volatile organic compounds (VOCs) to classify respiratory diseases and establish a protocol for use. We analysed exhaled air samples with Cyranose 320 nose from 67 children (14 healthy, 34 asthmatics and 19 other respiratory diseases) (mean age 11.4 years). Three samples were collected for each patient. We used machine learning models to generate an algorithm to classify children according to disease. There were significant differences in 30/32 sensors between plastic and tedlar bags. The Cronbach alpha was <0.5 in all cases, so that the consistency of the measurements was low. An analysis was performed to distinguish between healthy and asthmatics, P < .05 in 27/32 sensors. The algorithm predicted asthma disease with high sensitivity (over 99%) and accuracy (over 96%). The negative and positive predictive values were over 90%. The e-nose seems a valuable tool for screening asthma disease in the paediatric population in clinical practice.
Introduction
Analysing airway inflammation in exhaled air using noninvasive techniques is challenging. More frequently used breath tests include the fraction of nitric oxide in expired gas (FENO) and the analysis of exhaled breath condensate (EBC), both having official recommendations for standardized procedures.1,2
The measurement of volatile organic compounds (VOCs) in exhaled breath has been used at the research level using gas chromatography-mass spectrometry (GC-MS), which is expensive and complicated. However, the electronic nose (e-nose) may be a potentially easy and nonexpensive device for analysing exhaled VOCs.3,4 Even though some research has started in this field, the protocol for the collection and analysis is not well established, holding the spread of their use in clinical practice.2,3
The use of the e-nose as a diagnostic tool in some respiratory diseases has been shown among adults. 5 Previous studies showed that e-nose differentiates between asthmatics, chronic obstructive pulmonary disease (COPD) and healthy controls, 6 or asthmatics and COPD. 7 E-nose also discriminated among different asthma phenotypes 8 and several bacterial pathogens colonizing the respiratory airway. 9 Besides, e-nose has been successfully tested in the detection of lung cancer 10 or obstructive sleep apnea (OSA). 11
Similarly, studies carried out in paediatrics detecting exhaled VOCs measured by GC-MS have shown their usefulness as an early marker of asthma exacerbations.12-14 In addition, paediatrics studies have demonstrated differences in the e-nose breathprints in patients with cystic fibrosis (CF) and primary ciliary dyskinesia (PCD), compared with healthy children 15 or paediatric patients with CF and severe or moderate asthma versus healthy controls.16,17 Also, there are alterations in the patterns of breathprints in children affected by OSA. 18 In patients with CF and PCD, the e-nose breathprint had a sensitivity greater than 80% for early detection of respiratory exacerbations. 15
It is important to use noninvasive tests that require little collaboration in children. The e-nose is a potentially useful tool for diagnosing respiratory diseases in children, although there is not a standardized procedure for its use in children.
We hypothesized that analysing breathprints in children using an e-nose can be an easy-to-apply, noninvasive tool for detecting respiratory diseases such as asthma.
First, our main objective was to assess the utility of e-nose VOCs analysis to distinguish asthma from healthy controls and other respiratory diseases. Second, we studied different technical aspects related to the sample collection and analysis of VOCs to contribute to the standardization of the technique.
Materials and Methods
This is a pilot study conducted from May to November 2024. The study was approved by the ethical committee and all the participants and legal guardians gave their written informed consent.
Inclusion criteria were children and adolescents aged 3 to 19 years with asthma according to the GINA (Global Initiative for Asthma) guidelines, 19 and with other respiratory diseases who attended the outpatient clinics and healthy controls. 20 Healthy children were recruited among subjects tested for suspected allergic reactions with negative provocation studies or companions of patients.
Sample Collection
Before collecting the sample, patients were instructed to avoid eating (except water), vigorous exercise, or smoking for 2 hours to reduce the impact of confounding factors. 2
We collect the total breath sample, including death space air, 2 using the wash-in technique. Just before sampling collection, children perform 20 tidal volume breaths of VOC-free air using a VOC filter.2,4
To collect the sample, starting with tidal breathing, the children blew through the mouth into the bag with the “inflating a balloon” technique, exhaling once or several times until the sample bag was full. Usually, adolescents took 1 or 2 exhaled air efforts to inflate the bag, and preschoolers or younger children usually required more than 2 efforts. Appendix A shows the 3-step recommendations for the sample collection procedure.
To explore the suitability of different bag types, we collect the samples in 2 single-use bag types for every patient: (1) a handmade transparent noncommercial plastic bag. A 17 × 24 cm transparent plastic bag was used, joining it manually to a mouthpiece with adhesive tape. When using these bags, we perform the analysis in the first 60 minutes and avoid direct exposure to sunlight. (2) Tedlar bags (SKC-Flexfoil, SKC Inc., Eighty Four, Pennsylvania or Quintron, Quintron Instrument Company Inc., Milwaukee, Wisconsin) (Figure 1).
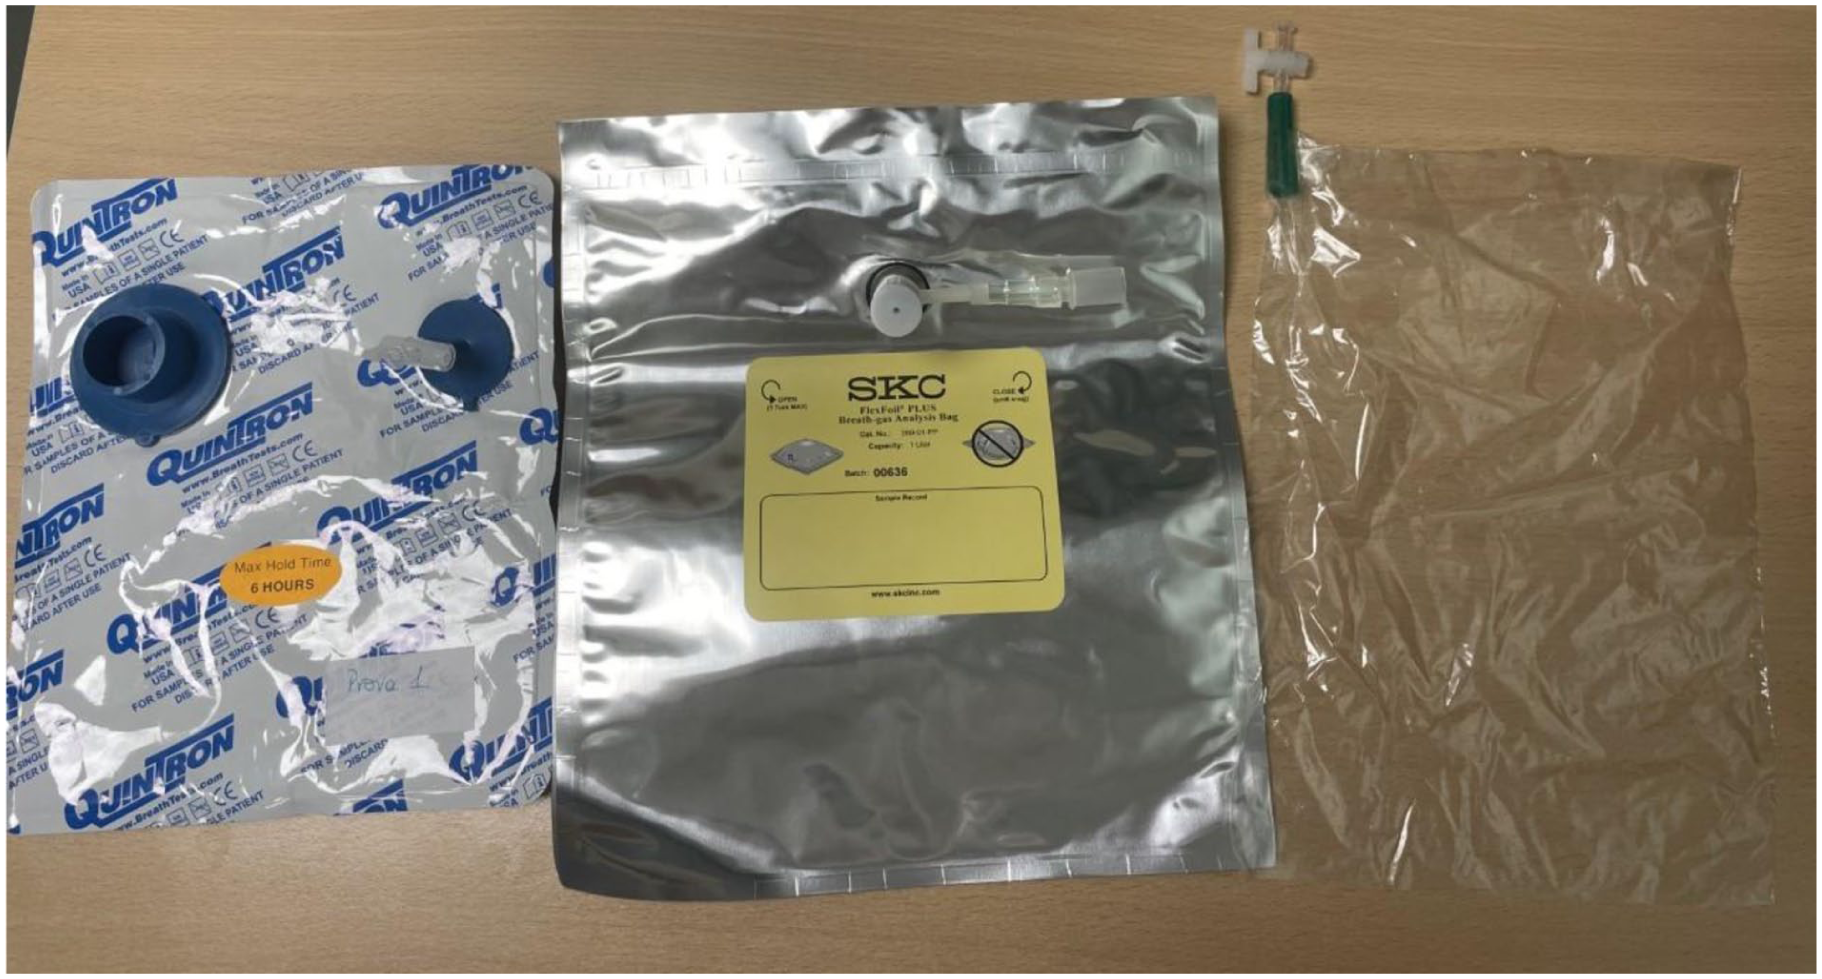
Types of collection bags used: Tedlar bags (Quintron and SKC-Flexfoil) and transparent plastic bags.
All samples were collected in a properly ventilated hospital room, without sunlight, so that the plastic bags would not be influenced by it, and with an ambient temperature record of between 20 °C and 26 °C.
Measurements of the Air Exhaled Obtained
The analysis of the air in the sample bags in the e-nose were carried out during the first 60 minutes after their collection in the case of transparent plastic bags. In the Tedlar bags, the analysis was carried out always before the limit established by the manufacturer company. For Quintron bags, the maximum hold time was 6 hours, and for SKC Flexfoil PLUS bags, a maximum of 24 hours.
We use Cyranose 320 (Sensigent, Baldwin Park, California), a nano-composite array with 32 polymer sensors, and the PC-nose software. 21 We established a 15-second baseline purge of the Cyranose with ambient air passing through a VOC filter, then analysed the patient’s gas sample for 60 seconds. The mixture of VOCs makes the polymers swell, inducing a change in their electrical resistance. The values obtained in the 32 sensors form the subjects’ breath print (see Figure 2).
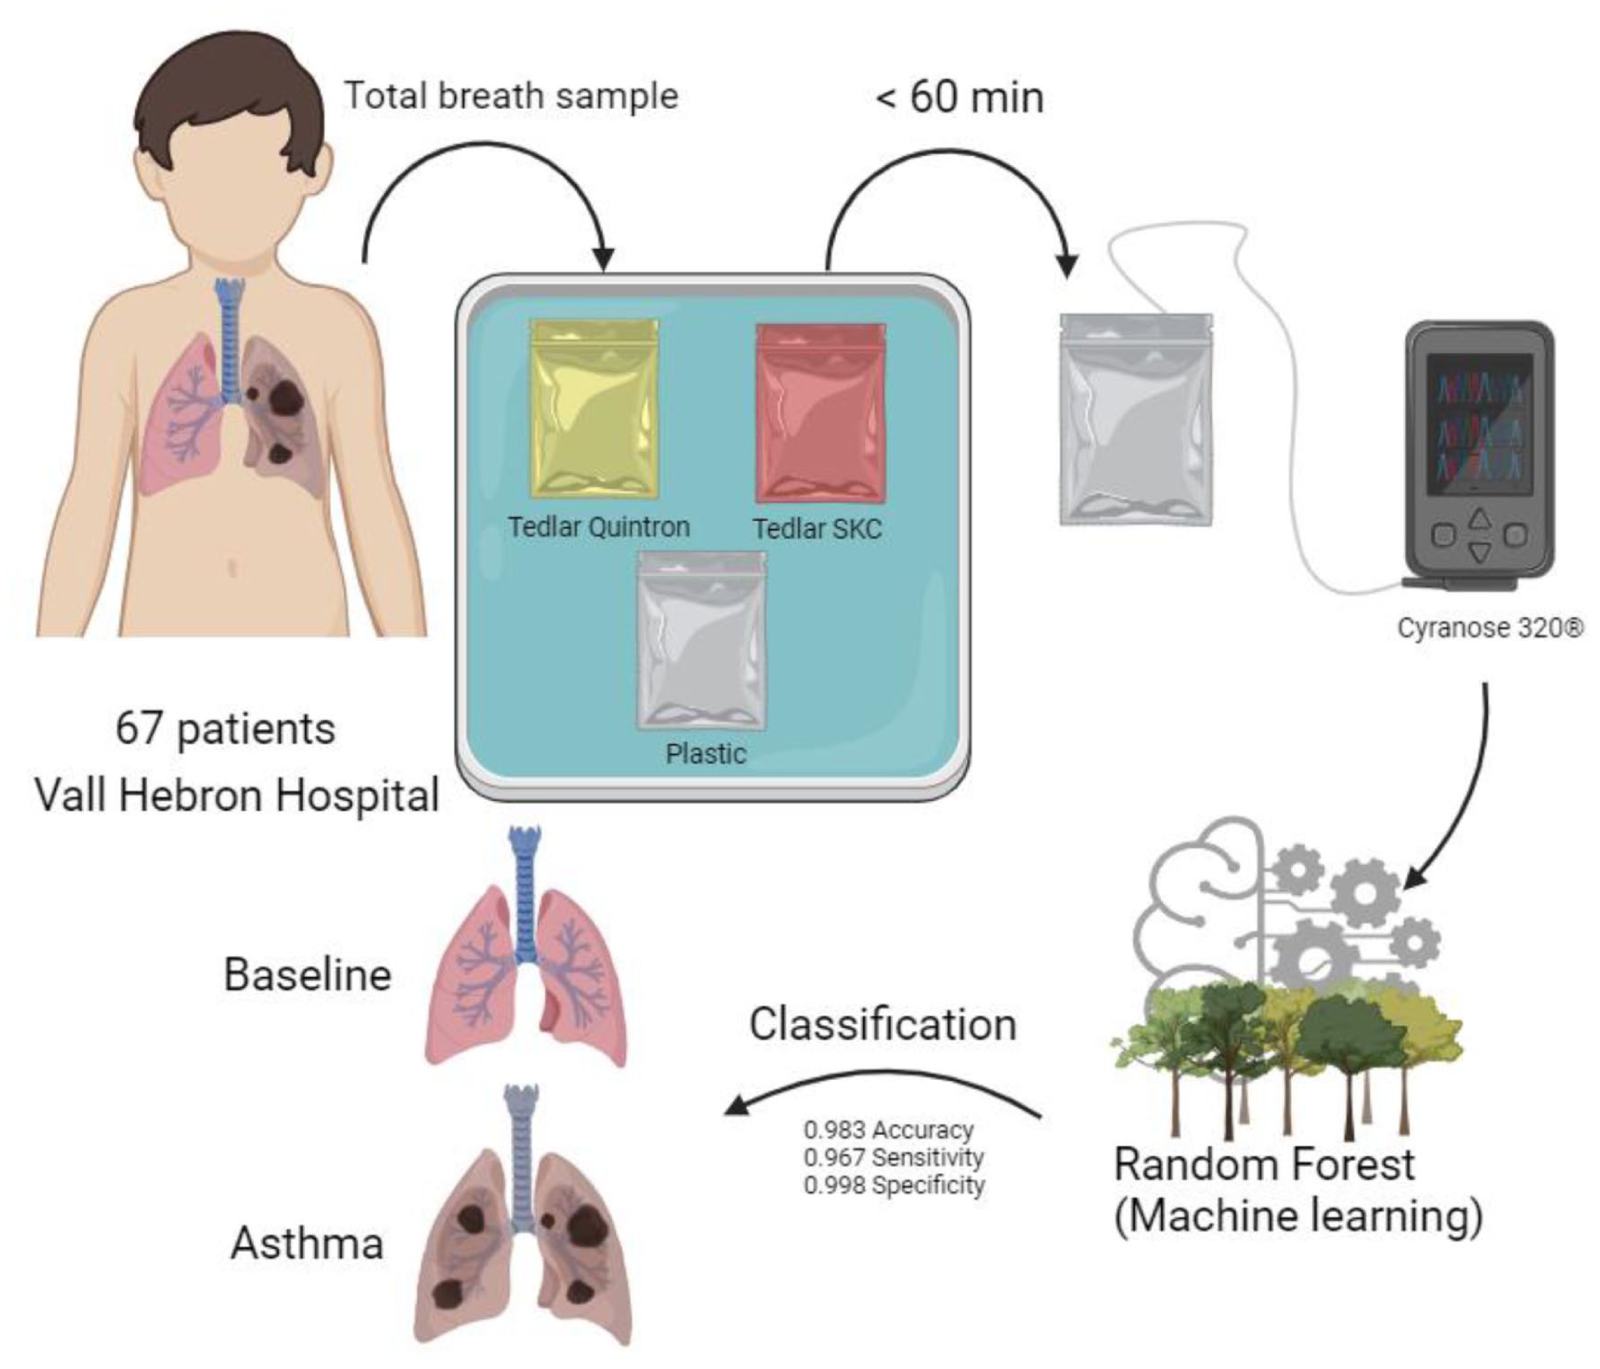
Graphical summary of the methods collection and analysis.
The samples were analysed in the collection room under the same environmental characteristics described previously.
Data Analysis
We used the Wilcoxon paired samples test to compare the results of the analyses according to the type of bag used to collect the sample. We calculated Cronbach’s alpha as a measure of consistency for each comparison. In addition, we performed the same procedure to compare the sensor values according to the type of previous pathology.
Two analysis approach were used, a principal component analysis (PCA) and a random forest model.
As a classification algorithm, we train a random forest model with 1000 trees and 5 variables to split in each node for each type of bag and time of measure (30, 60, 90, 120, 150 and 180 seconds). We use 70% of the sample as a training data set and 30% to evaluate the classification quality.
Random forests are particularly effective in classification tasks as they combine multiple decision trees to enhance prediction accuracy. Each tree in the forest makes its own prediction, and a majority vote is then conducted to determine the final class of the observation, which renders the model robust and capable of handling complex data sets.
Results
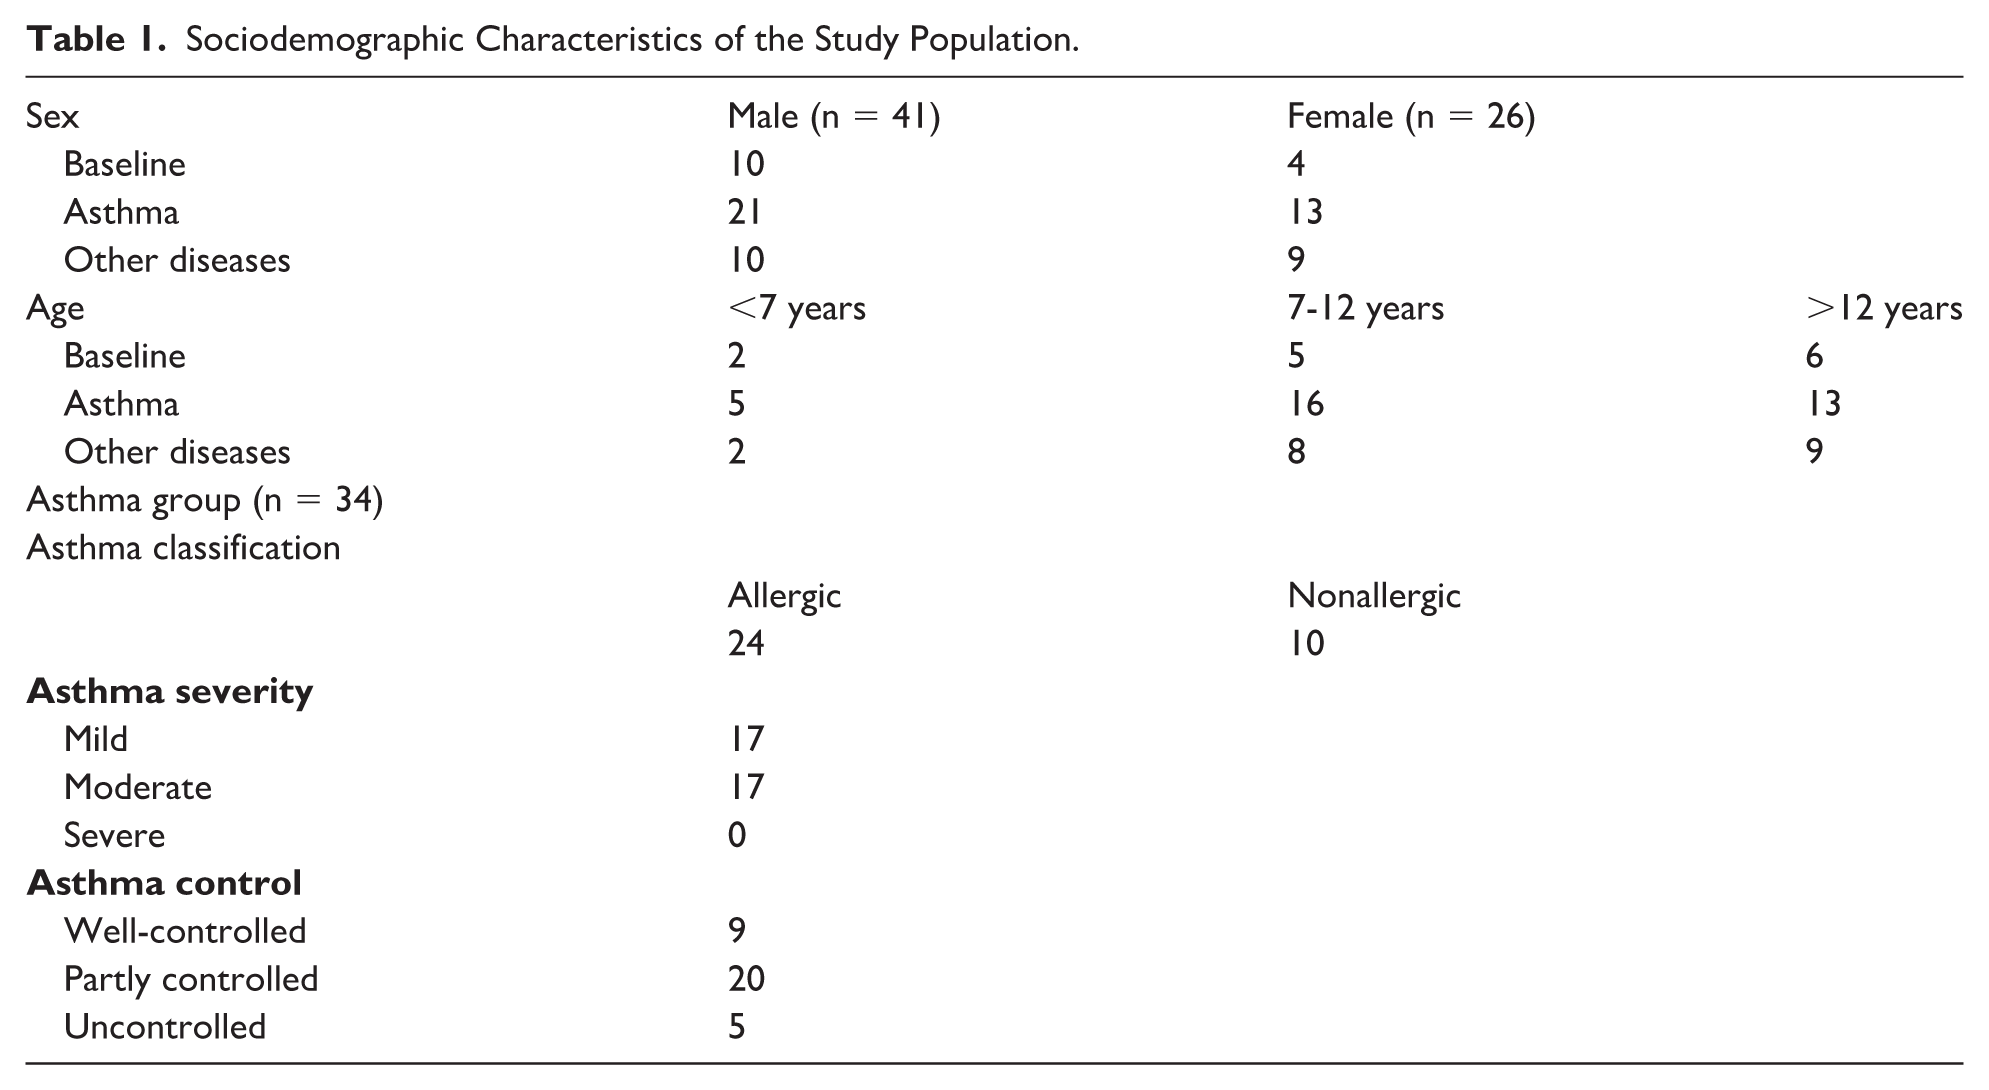
We analysed exhaled air samples from 67 subjects: 14 healthy, 34 asthmatics and 19 other respiratory diseases. Regarding the asthmatic population, 17/34 (50%) had mild asthma and 17/34 (50%) had moderate asthma. In addition, 24/34 (70%) had an allergic or T2 profile.
The group with other respiratory diseases includes patients with: PCD (n = 3), pulmonary hypertension (n = 3), bronchopulmonary dysplasia (n = 1), bronchiolitis obliterans (n = 2), OSA (n = 2), post-hematopoietic stem cell transplantation (n = 2), bronchiectasis (n = 2), rhinitis (n = 1), Rendu-Osler syndrome (n = 1) and bilateral lung transplant patients (n = 2). Twenty-six were female. The mean age was 11.4 years (range 3-19 years). Eight participants were preschoolers (<7 years), 29 were 7 to 12 years old and 30 were adolescents. The sociodemographic characteristics are described in Table 1.
Sociodemographic Characteristics of the Study Population.
Groups Comparison and Asthma Prediction
The variability captured by the factors in PCA was unrelated to the diagnosed pathology, and statistically significant differences were not found in the analysis (Appendix B). However, it is worth highlighting the evidence of a personal exhaled breathprint when performing the analysis for each patient.
A comparative analysis was performed to distinguish between healthy subjects and those with asthma, with statistically significant differences in 27 of the 32 sensors, and between asthmatics and other respiratory diseases, finding differences in 31 of the 32 sensors. There were only statistically significant differences in 8 of the 32 sensors between the healthy group and the heterogeneous group of “other respiratory pathologies.”
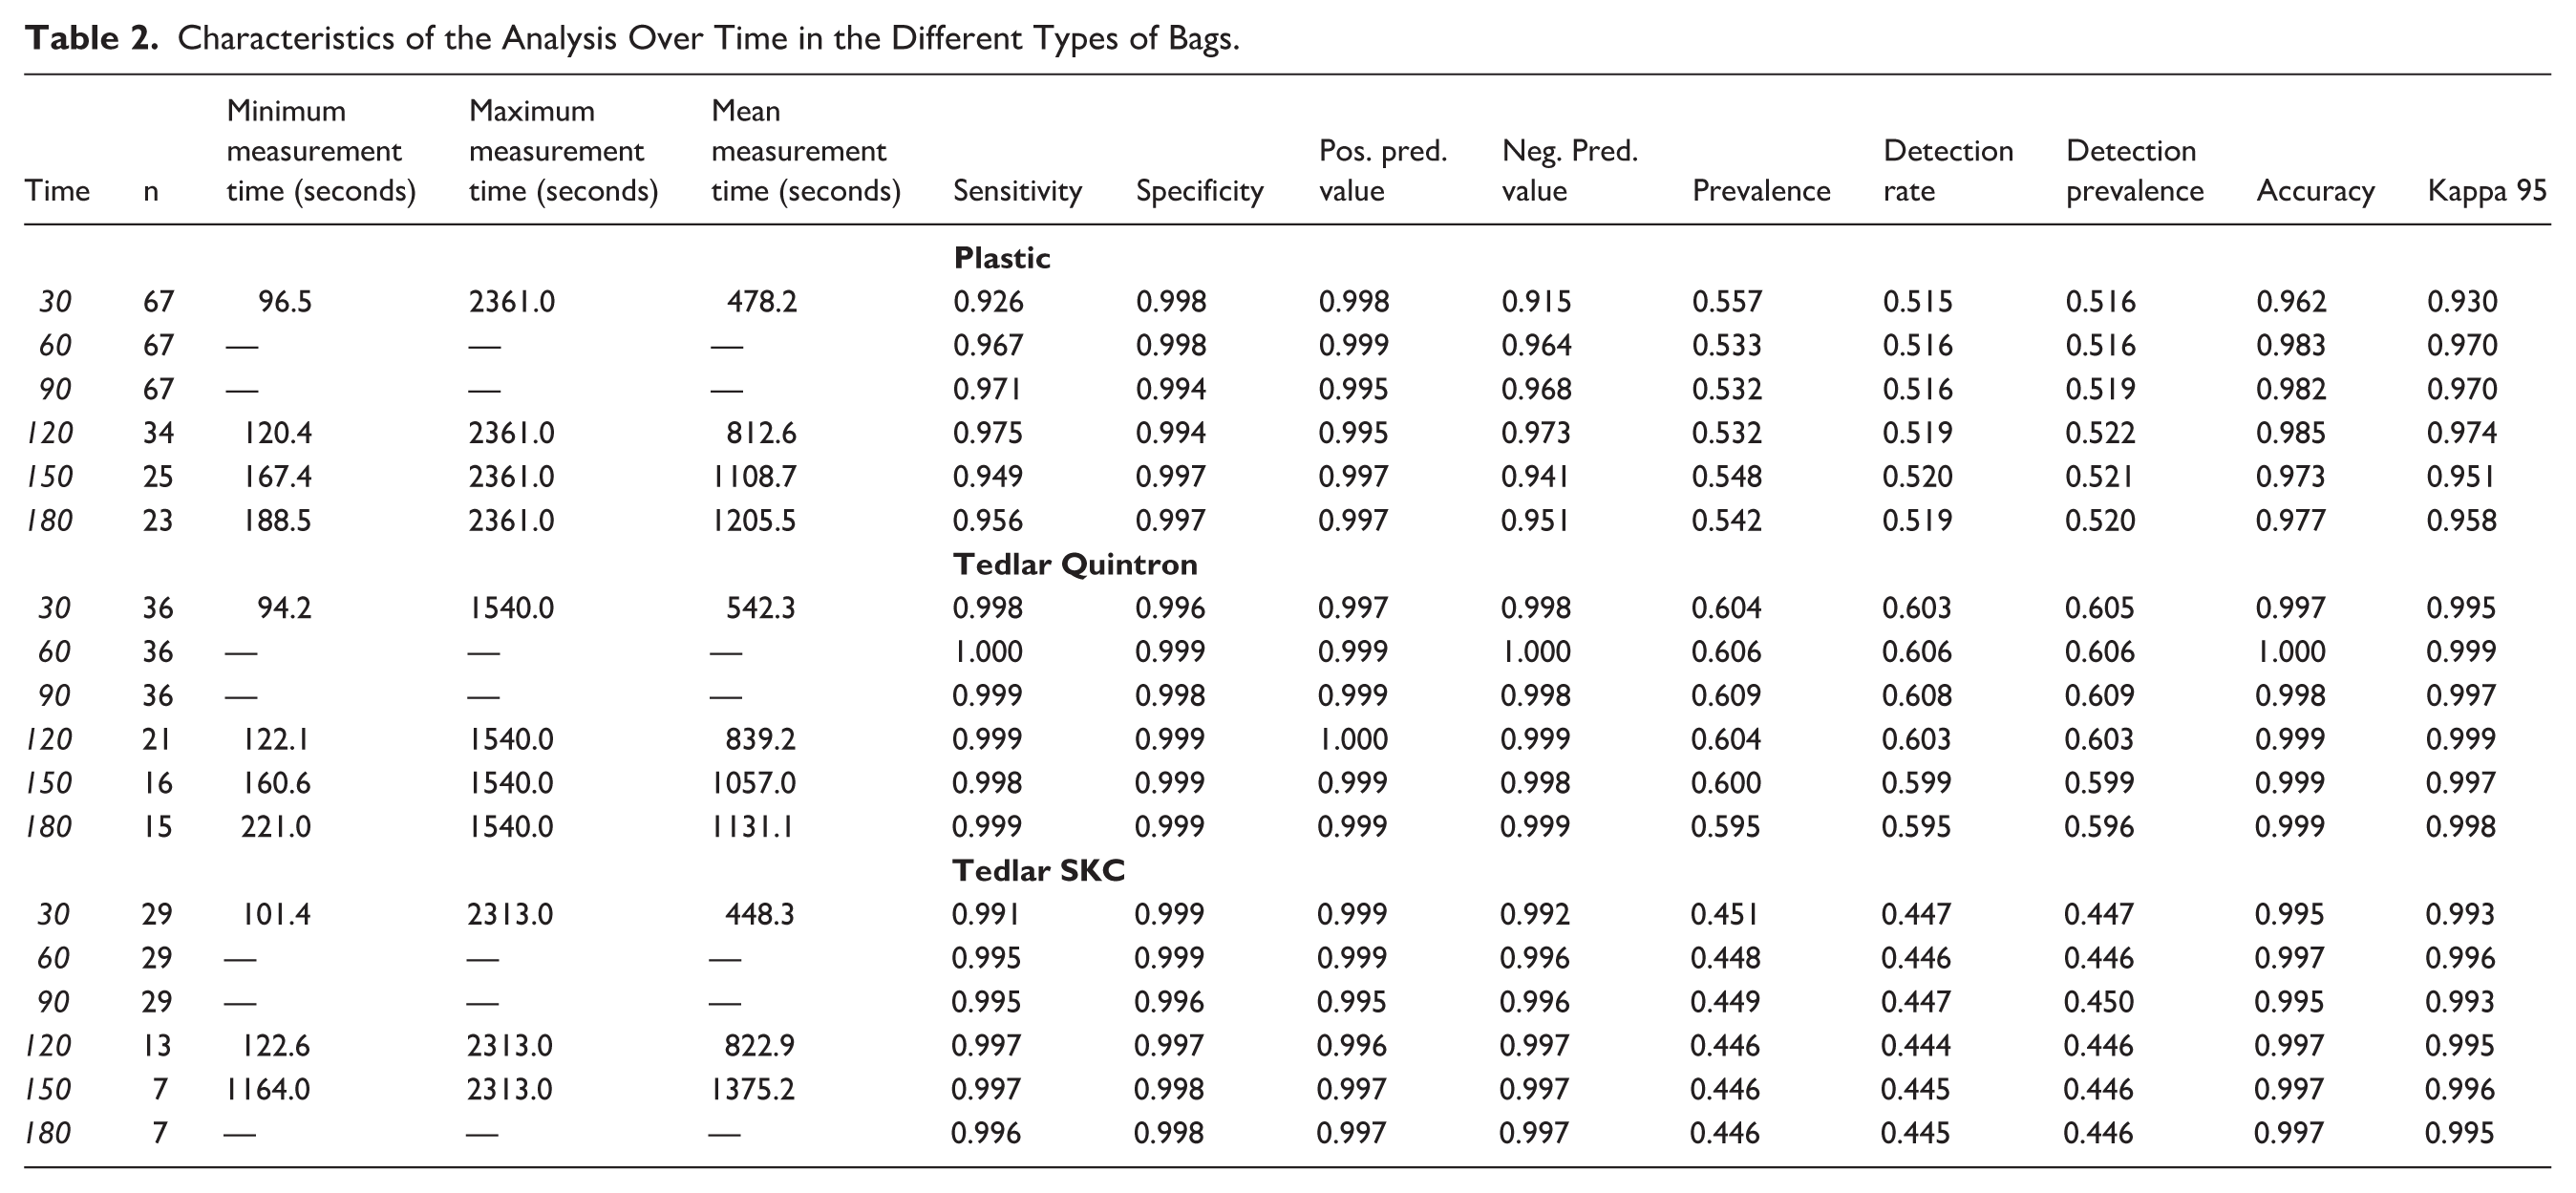
Predictions for asthma were made based on the data obtained for plastic, Tedlar Quintron and Tedlar SKC FlexFoil bags (Table 2) with accuracies over 0.962, 0.997 and 0.995 (respectively). Kappas were under 0.930, 0.995 and 0.993 for each type of bag. Sensitivity and negative predictive values were at least 0.90 for the data sampled with plastic bags and at least 0.99 for the other two. All specificity and positive predictive values were over 0.990. The prevalence of the asthmatic group in the training sample was around 0.55 for the plastic bag, 0.60 for the Tedlar Quintron bag and 0.45 for the Tedlar SKC FlexFoil PLUS bag. Detection rates and detection prevalences were similar to each observed prevalence.
Characteristics of the Analysis Over Time in the Different Types of Bags.
Technical Aspects
To ensure consistency, between 6 and 10 analyses of each bag were carried out. After performing an average of 8 analyses per sample of the different bags, we established that 3 reproducible measurements were adequate (trying to have the curves as similar as possible operator-depending).
We observed statistically significant differences in 30 of 32 sensors between Quintron and plastic bags (P < .05), in 18 of 32 sensors between plastic and SKC Flexfoil bags (P < .05) and 29 of 32 sensors between Quintron and SKC Flexfoil (P < .05). However, the pattern of the curve during the measurement of the difference sensors according to the types of bags was similar, although a change in the scale was demonstrated (Figure 3A).
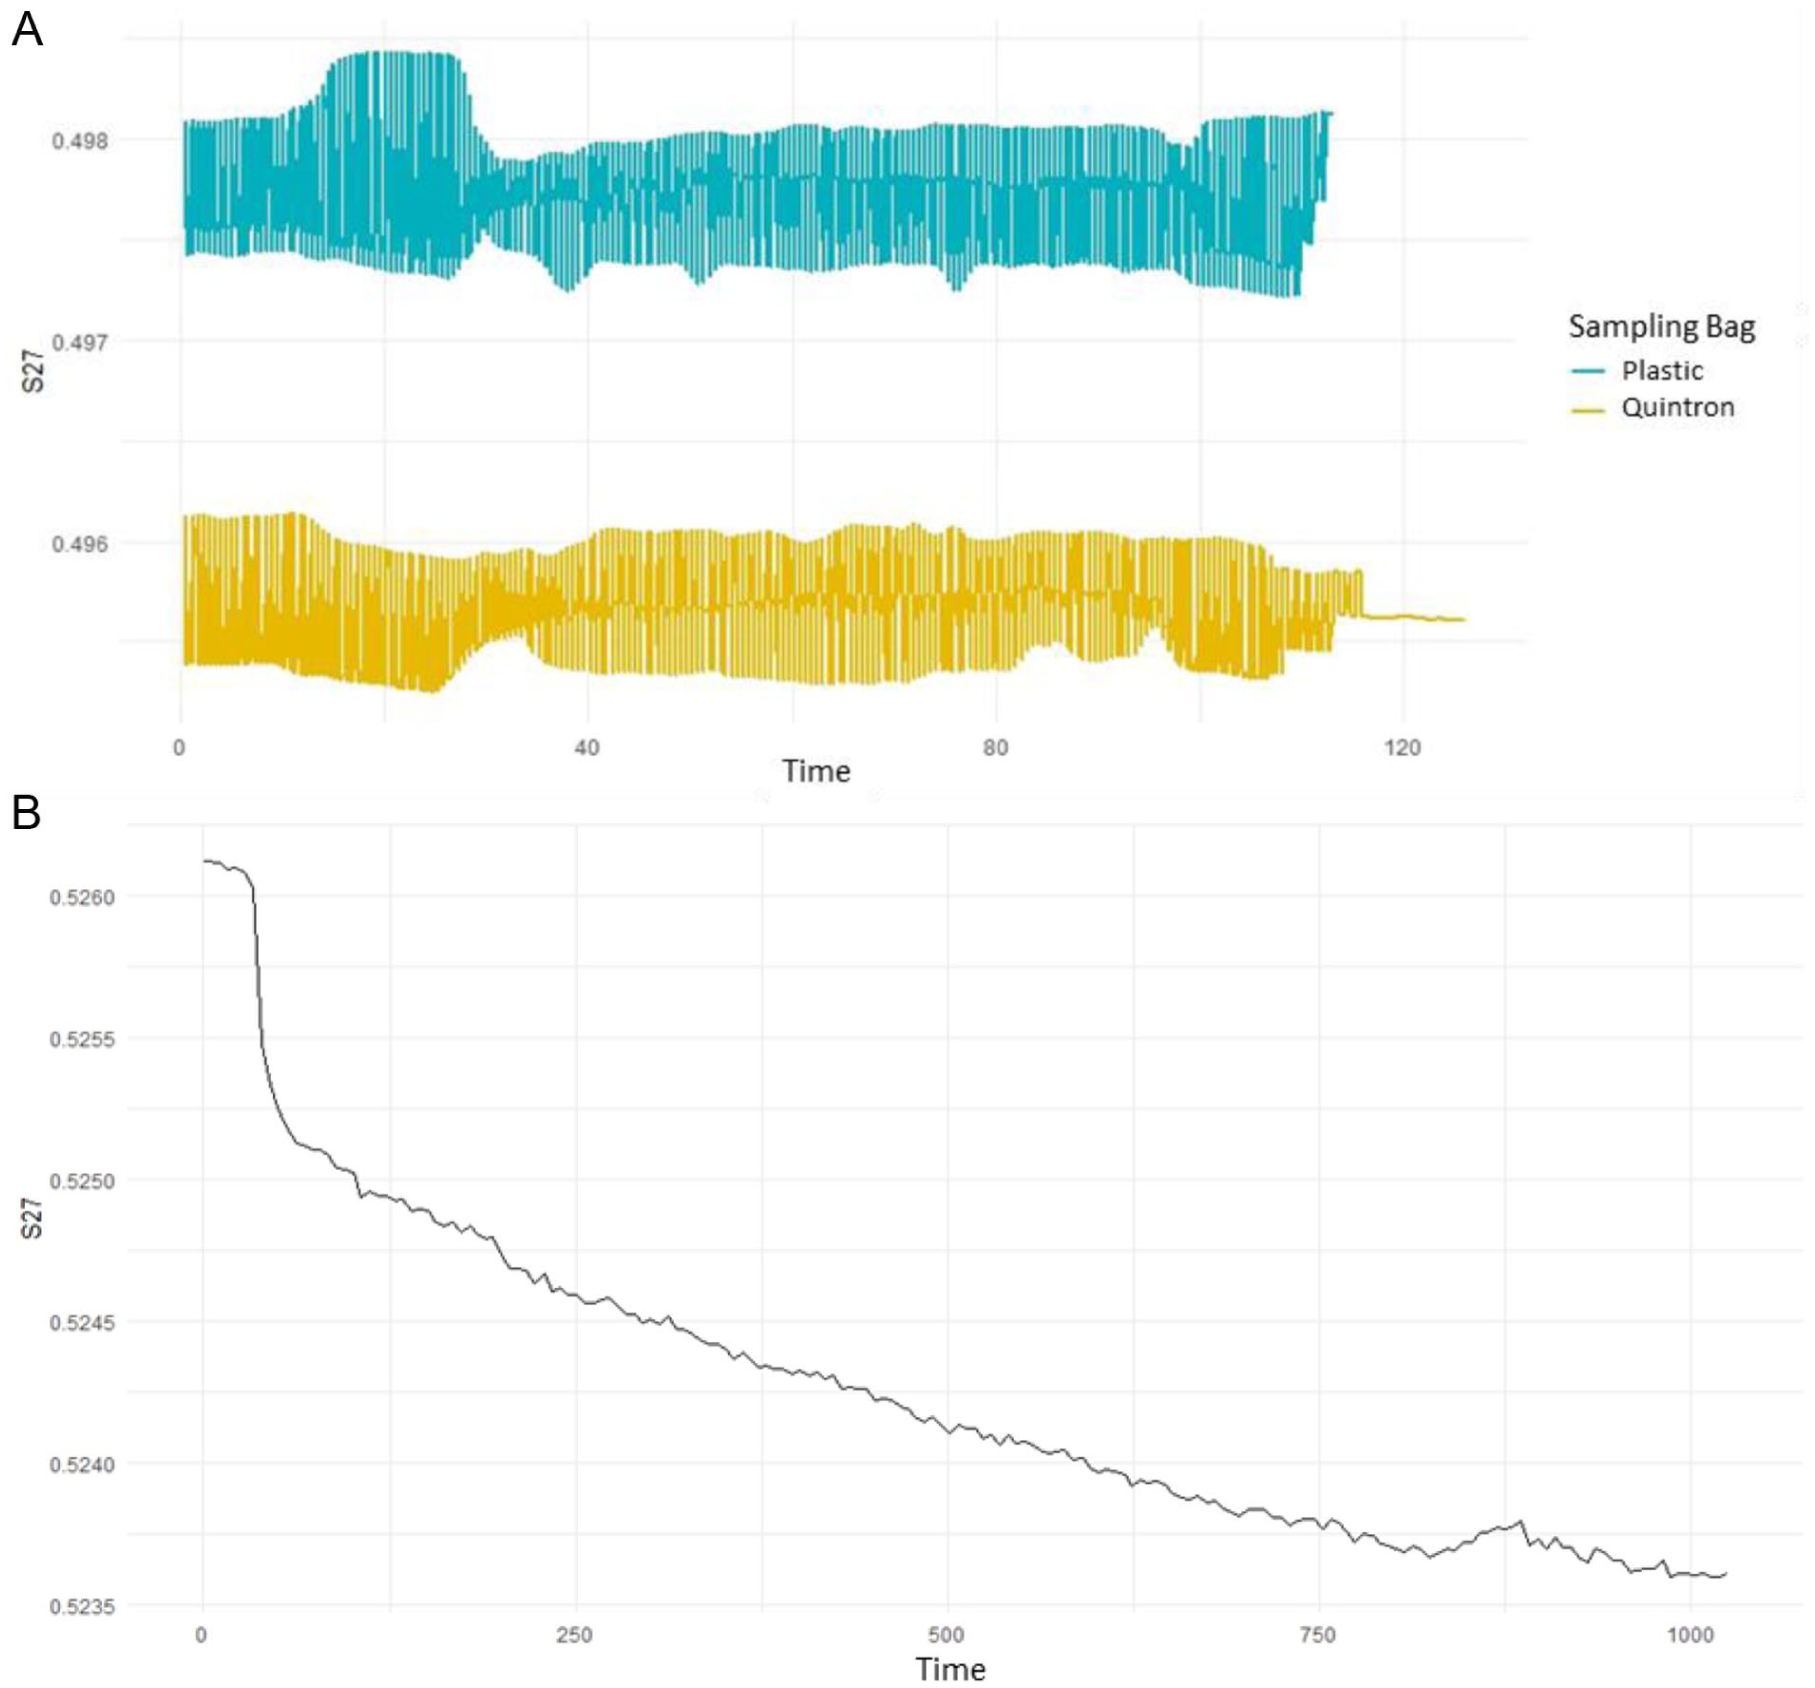
(A) Analysis of the exhaled air profile using the same sensor, including the purge periods, in 2 sensor bags (plastic and Tedlar (Quintron) with 15-second purge. (B) Examination of exhaled air profile in a single e-nose sensor, featuring purging during the initial 15 seconds.
Figure 3A represents the analysis of ambient air by one of the e-nose sensors (S27), and Figure 3B represents the analysis of the exhaled air profile using the same sensor, including the purge periods, and showing the same trend in both types of bags (plastic and tedlar bags).
Table 2 shows the characteristics of the analysis over time with the different types of bags. Regarding the measurement time, 300 seconds were initially analysed: However, the data show that there are no differences in the analysis at 30, 60, 90, 120, 150 and 180 seconds, with high sensitivity in the different types of bags (>0.9), and also a high accuracy >0.9 in all the types of bags. Therefore, given these results, the analysis time per bag was established in 60 seconds, but can be established between 30 and 180 seconds.
Discussion
The collection of exhaled breath sampling regards the type of sampling, depends on different issues: type of breath sample (total vs alveolar breath), the effect of environmental substances, the duration of sampling (single breath vs. fixed-time breathing), the effect of expiratory flow, the type of collecting bags or humidity and VOCs recovery.
The e-nose is a useful screening tool in discriminating asthmatic paediatric patients versus healthy controls, as studies in adults have already shown. 6 Although studies using e-noses in paediatrics are still scarce, some have differentiated the breathprint of patients with asthma from that of healthy controls. Also, a different breathprint has been shown between CF and PCD. Moreover, comparisons between healthy and OSA children showed differences, and even a different inflammatory breathprint in children during and after rhinovirus-induced wheezing. 13 - 18 In addition, establishing the feasibility protocol may help to extend and standardize its use in daily clinical practice.
We have established 3 groups of patients: healthy, asthmatic and those with other respiratory diseases. Healthy controls were used for comparison with asthmatics; however, we created a third group for “other respiratory diagnoses” because the sample size was insufficient for a stratified analysis by illness and because the target organ was the same.
Our data using the random forest model showed adequate classifications with statistically significant differences of the e-nose as a screening tool in paediatric patients with asthma versus healthy controls with a sensitivity higher than 90%. There are some studies that show similar results with lower sensitivities. 17 In fact, the e-nose could be a potential screening tool, especially in younger patients, when routine lung function tests are not available.
The e-nose has been used in some studies as a potential screening tool for respiratory diseases with sensitivities, specificities and accuracies of up to 80% depending on the case, without being able to fully compare the studies because they use different e-noses and different methods of collecting and analysing the samples, 5 being particularly relevant to establish a standardized data collection and analysis method.
The results of the random forest model classifications suggest that the e-nose could be used as a screening tool. In addition, it seems that plastic bags could be used for the analysis with accuracies and kappas above 0.9, although this variation may be due to the fact that it is the one with the largest sample size.
Plastic bags could be used, understanding that with their use the cost of consumables is considerably reduced, helping to spread their use, but understanding that there is a limitation involving a lower predictive capacity, although their accuracies and kappas are always above 0.9, and variation may be due to which is the one with the sample size) (see Table 2).
The longer the measurement time, there is a certain trend that seems to show the better results (especially with plastic bags), although the increase from 30 to 180 seconds in the quality of the prediction is not significant.
Among 6 and 10 analyses were performed for each one of the samples for each patient, some previous studies performed the analysis 5 times for each sample, but there are no reproducibility criteria established for the e-nose. 22 As a limitation, the software used in our case shows the regularity of the sensors while the analysis is being performed, but it does not show it at a numerical level with a friendly/easy interface, so that the correct determination is operator-dependent, to establish the regularity of the analysis. Likewise, the curves sensors of the analysis cannot be compared simultaneously, being unintuitive. Despite this, our results show that 3 determinations in which the sample analysis was regular (according to the operator) are sufficient. Sixty seconds per random determination were also analysed, and with the subsequent analysis, it is evident that 60 seconds would be sufficient. This could be especially relevant to facilitate the technician’s work and speed up the analysis.
All sampling methods for VOCs require standardization and validation with multicentre studies. 2 Most of the studies have been carried out with Tedlar bags. 5 However, Tedlar bags have a high cost, being nonreusable by data sheet, although few studies have been shown to have acceptable repeatability using washing techniques.2,23 The principal base for using Tedlar bags is a longer conservation time until the analysis, so if the analysis could be performed in the first 3 hours, there seem to be no differences. 23 Our results show statistically significant differences between plastic bags and Tedlar bags (30/32 and 18/32) and differences between the different types of Quinton and SKC Flexfoil bags. However, when the graphs among Tedlar and plastic bags were reviewed the same trend could be evidenced. In that case, the first hypothesis is that it is due to differences in the measurement scale, but requires more studies to confirm it.
The prediction model established through machine learning presented a high accuracy of 0.91, a sensitivity of 0.92, and a specificity of 0.91 (Table 2). This would mean the potential utility of the e-nose in clinical practice, particularly as a screening tool. However, today, it is complex to perform the collection and determinations with e-nose in exhaled air, as well as the subsequent analysis and interpretation of the results, limiting its applicability to daily clinical practice. The creation of user-friendly software would probably favour its diffusion to clinical practice. The e-nose shows a breathprint PCA profile per individual, and the detailed analysis of each of the sensors shows statistically significant differences in differentiating asthma from healthy and from other respiratory diseases. It should be noted that PCA showed a specific breathprint for each subject. Despite what other studies have shown, 24 - 26 our data did not show a specific PCA profile by illness (see the supplemental material – Appendix B), although, it could be due to not having a large sample size. However, previous studies do show it with a similar number of patients. 24 - 26
Regarding the comparison of the e-nose with other lung function tests such as spirometry, in our case, we have not performed it jointly, as it was not the main objective of this study. In the evaluation manoeuvres of both techniques, the repeatability was important; in the case of the e-nose, it was operator-dependent screening and also in the case of spirometry, which has much more experience and an established criteria with at least 3 manoeuvres. 27 In addition, there are certain similarities between the recommendations for collecting exhaled air for the e-nose and the established recommendations prior to performing spirometry: avoid smoking or vaping within 1 hour before testing and avoid performing vigorous exercise within 1 hour before testing. 27 In the specific recommendations for exhaled VOCs, there are breath analyses that also include diet. 2
A pilot study has been conducted to evaluate the use of an e-nose as a classification method. For this purpose, a convenience sample was used to maximize internal validation, but with the limitation that the results cannot be extrapolated to the general population. As our sample size is small, there would be a risk of overfitting. However, with the statistical analysis of random forest, also with the training data set used to evaluate the classification quality and using part of the sample as the training data set, this would be mitigated.
Conclusion
Despite the current evidence on the potential of e-nose screening, this is still not yet a tool used in daily clinical practice, due to the lack of standardization in the collection and analysis procedures and the difficulty in interpreting the results in an easy way. However, our data showed the e-nose can be a useful screening tool differentiating asthmatic paediatric patients versus healthy controls. Determining the collection and analysis protocol may help to expand and standardize its use in daily clinical practice. More efforts and resources have to be focussed on developing a standardized technique and facilitating a friendly analysis for the user.
Author Contributions
Dr Jose María Martínez-Sánchez and Dr Ana Díez-Izquierdo conceptualized and designed the study, designed the data collection instruments, collected data, drafted the initial manuscript and critically reviewed and revised the manuscript. Dr Hipólito Perez Martín and Dr Cristina Lidón Moyano carried out the analyses, and critically reviewed and revised the manuscript. All the authors critically reviewed and revised the manuscript and approved the final manuscript as submitted and agree to be accountable for all aspects of the work.
Supplemental Material
sj-docx-1-cpj-10.1177_00099228261459936 – Supplemental material for Utility of E-Nose in Paediatric Respiratory Diseases Using Machine Learning Approach: A Pilot Study
Supplemental material, sj-docx-1-cpj-10.1177_00099228261459936 for Utility of E-Nose in Paediatric Respiratory Diseases Using Machine Learning Approach: A Pilot Study by Ana Díez-Izquierdo, Hipólito Perez Martín, Cristina Lidón Moyano, Teresa Garriga-Baraut, Ines De Mir-Messa, Alba Torrent-Vernetta, Sandra Rovira-Amigó, Manuel Gómez-Duque, Antonio Moreno-Galdó and Jose Maria Martínez-Sánchez in Clinical Pediatrics
Footnotes

Ethical Considerations
The study was approved by the Ethical Committee of Vall d’Hebron Hospital project number PR(AG)305/2019 and all the participants and legal guardians gave their written informed consent.
Funding
The authors disclosed receipt of the following financial support for the research, authorship and/or publication of this article: The funding of the electronic nose and consumables has been obtained with 3 research scholarships: Accessit Mutual Medical Scholarship 2020, the Spanish Society of Allergy and Pediatric Clinical Immunology (SEICAP) Scholarship 2020 and Young Researchers Scholarship of the Spanish Society of Pediatric Pulmonology (SENP) 2020.
This study was funded by the “Ministerio de Ciencia e Innovación” of the Government of Spain (ref.: PID2021-122272OB-I00) and by FEDER funds/European Regional Development Fund (ERDF) – a way to build Europe. The Health Determinants and Health Policies Evaluation Group (CTS063) has received support for research groups from the Junta de Extremadura co-financed by Europe. This study is also supported by the del Ministerio Ciencia, Innovación y Universidades para la estancias de personal docente y/o investigador senior en centros extranjeros (grant PRX24/00228).
Declaration of Conflicting Interests
The authors declared no potential conflicts of interest with respect to the research, authorship and/or publication of this article.
Supplemental Material
Supplemental material for this article is available online.
References
Supplementary Material
Please find the following supplemental material available below.
For Open Access articles published under a Creative Commons License, all supplemental material carries the same license as the article it is associated with.
For non-Open Access articles published, all supplemental material carries a non-exclusive license, and permission requests for re-use of supplemental material or any part of supplemental material shall be sent directly to the copyright owner as specified in the copyright notice associated with the article.
